Zip Codes with the Highest Percentage of Population with a Degree in Computers and Mathematics in Utah
RELATED REPORTS & OPTIONS
Computers and Mathematics
Utah
Compare Zip Codes
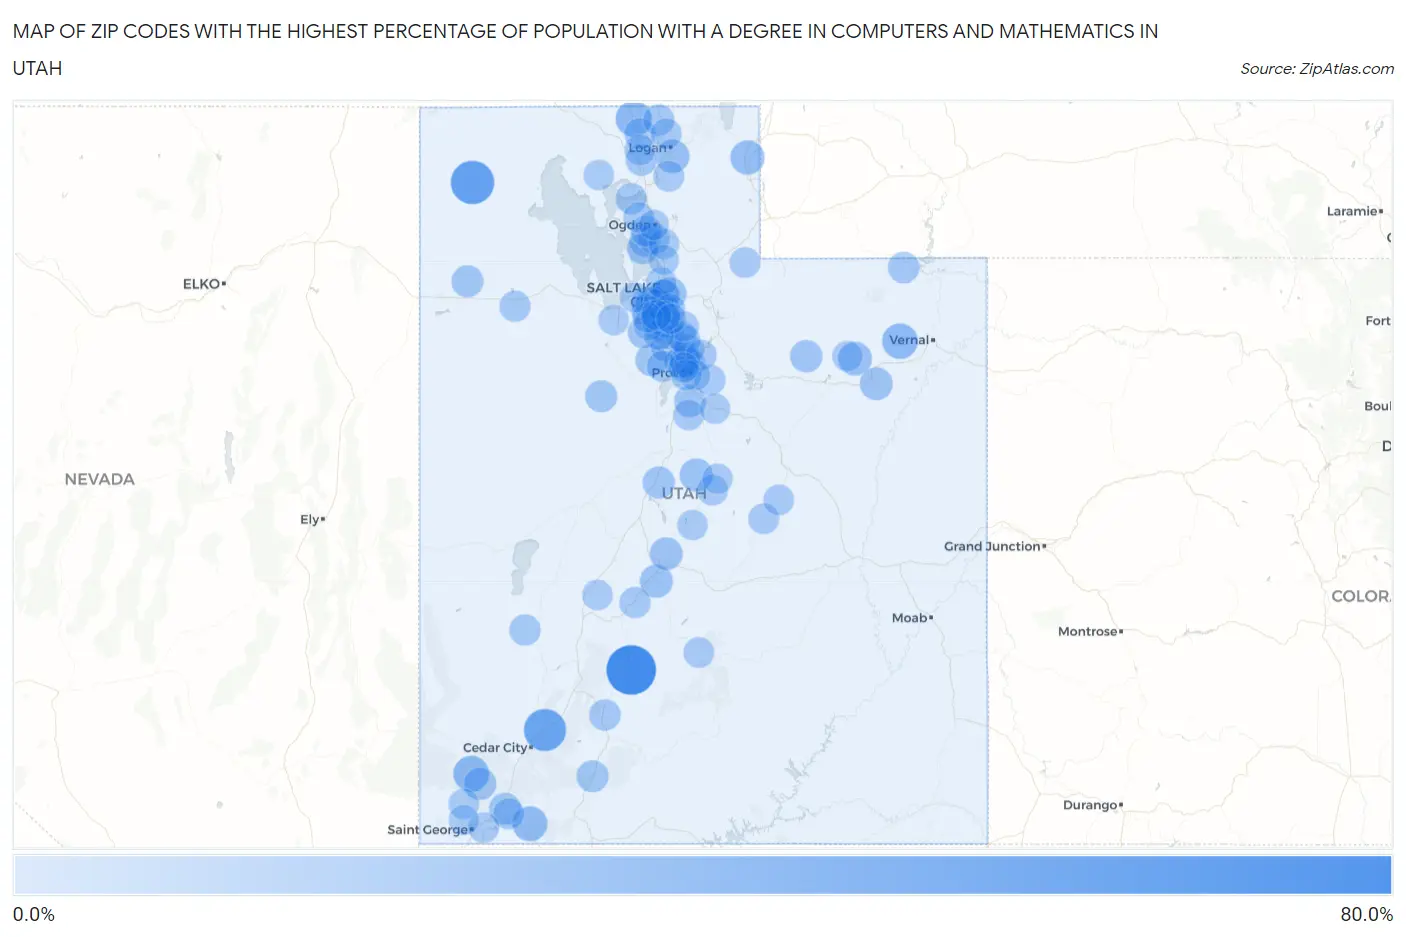
Map of Zip Codes with the Highest Percentage of Population with a Degree in Computers and Mathematics in Utah
0.0%
80.0%
Zip Codes with the Highest Percentage of Population with a Degree in Computers and Mathematics in Utah
| Zip Code | % Graduates | vs State | vs National | |
| 1. | 84743 | 71.4% | 5.5%(+65.9)#1 | 4.9%(+66.5)#33 |
| 2. | 84313 | 50.0% | 5.5%(+44.5)#2 | 4.9%(+45.1)#88 |
| 3. | 84772 | 45.5% | 5.5%(+40.0)#3 | 4.9%(+40.6)#104 |
| 4. | 84330 | 24.0% | 5.5%(+18.5)#4 | 4.9%(+19.1)#329 |
| 5. | 84722 | 23.5% | 5.5%(+18.0)#5 | 4.9%(+18.6)#349 |
| 6. | 84039 | 22.6% | 5.5%(+17.1)#6 | 4.9%(+17.7)#374 |
| 7. | 84763 | 20.5% | 5.5%(+15.0)#7 | 4.9%(+15.6)#446 |
| 8. | 84064 | 17.6% | 5.5%(+12.1)#8 | 4.9%(+12.8)#578 |
| 9. | 84007 | 16.2% | 5.5%(+10.7)#9 | 4.9%(+11.3)#686 |
| 10. | 84326 | 15.8% | 5.5%(+10.3)#10 | 4.9%(+10.9)#715 |
| 11. | 84657 | 14.5% | 5.5%(+9.05)#11 | 4.9%(+9.65)#838 |
| 12. | 84646 | 14.3% | 5.5%(+8.79)#12 | 4.9%(+9.39)#865 |
| 13. | 84112 | 13.9% | 5.5%(+8.40)#13 | 4.9%(+9.01)#919 |
| 14. | 84052 | 13.4% | 5.5%(+7.93)#14 | 4.9%(+8.54)#990 |
| 15. | 84652 | 13.4% | 5.5%(+7.90)#15 | 4.9%(+8.51)#995 |
| 16. | 84072 | 11.8% | 5.5%(+6.27)#16 | 4.9%(+6.87)#1,268 |
| 17. | 84781 | 11.8% | 5.5%(+6.27)#17 | 4.9%(+6.87)#1,271 |
| 18. | 84639 | 11.0% | 5.5%(+5.48)#18 | 4.9%(+6.08)#1,463 |
| 19. | 84118 | 10.9% | 5.5%(+5.37)#19 | 4.9%(+5.97)#1,490 |
| 20. | 84080 | 10.5% | 5.5%(+5.03)#20 | 4.9%(+5.63)#1,579 |
| 21. | 84005 | 10.4% | 5.5%(+4.95)#21 | 4.9%(+5.56)#1,599 |
| 22. | 84083 | 10.3% | 5.5%(+4.85)#22 | 4.9%(+5.45)#1,630 |
| 23. | 84710 | 10.3% | 5.5%(+4.76)#23 | 4.9%(+5.36)#1,671 |
| 24. | 84653 | 10.2% | 5.5%(+4.75)#24 | 4.9%(+5.35)#1,675 |
| 25. | 84096 | 10.0% | 5.5%(+4.54)#25 | 4.9%(+5.15)#1,739 |
| 26. | 84774 | 9.6% | 5.5%(+4.12)#26 | 4.9%(+4.73)#1,914 |
| 27. | 84111 | 9.5% | 5.5%(+3.98)#27 | 4.9%(+4.58)#1,978 |
| 28. | 84128 | 9.3% | 5.5%(+3.84)#28 | 4.9%(+4.44)#2,047 |
| 29. | 84046 | 8.8% | 5.5%(+3.33)#29 | 4.9%(+3.93)#2,357 |
| 30. | 84095 | 8.7% | 5.5%(+3.18)#30 | 4.9%(+3.79)#2,435 |
| 31. | 84759 | 8.5% | 5.5%(+3.01)#31 | 4.9%(+3.61)#2,534 |
| 32. | 84043 | 8.3% | 5.5%(+2.82)#32 | 4.9%(+3.43)#2,653 |
| 33. | 84015 | 8.2% | 5.5%(+2.73)#33 | 4.9%(+3.34)#2,722 |
| 34. | 84042 | 8.2% | 5.5%(+2.73)#34 | 4.9%(+3.34)#2,726 |
| 35. | 84056 | 8.2% | 5.5%(+2.71)#35 | 4.9%(+3.31)#2,743 |
| 36. | 84314 | 8.2% | 5.5%(+2.69)#36 | 4.9%(+3.29)#2,754 |
| 37. | 84059 | 8.0% | 5.5%(+2.49)#37 | 4.9%(+3.10)#2,911 |
| 38. | 84123 | 8.0% | 5.5%(+2.49)#38 | 4.9%(+3.09)#2,912 |
| 39. | 84751 | 7.9% | 5.5%(+2.42)#39 | 4.9%(+3.03)#2,960 |
| 40. | 84070 | 7.9% | 5.5%(+2.38)#40 | 4.9%(+2.99)#2,996 |
| 41. | 84724 | 7.9% | 5.5%(+2.38)#41 | 4.9%(+2.98)#2,999 |
| 42. | 84107 | 7.8% | 5.5%(+2.32)#42 | 4.9%(+2.92)#3,049 |
| 43. | 84045 | 7.8% | 5.5%(+2.32)#43 | 4.9%(+2.92)#3,052 |
| 44. | 84075 | 7.8% | 5.5%(+2.27)#44 | 4.9%(+2.87)#3,091 |
| 45. | 84311 | 7.7% | 5.5%(+2.19)#45 | 4.9%(+2.80)#3,154 |
| 46. | 84745 | 7.7% | 5.5%(+2.18)#46 | 4.9%(+2.78)#3,177 |
| 47. | 84129 | 7.6% | 5.5%(+2.10)#47 | 4.9%(+2.71)#3,241 |
| 48. | 84094 | 7.5% | 5.5%(+1.96)#48 | 4.9%(+2.57)#3,381 |
| 49. | 84120 | 7.4% | 5.5%(+1.93)#49 | 4.9%(+2.54)#3,407 |
| 50. | 84029 | 7.4% | 5.5%(+1.86)#50 | 4.9%(+2.47)#3,469 |
| 51. | 84020 | 7.3% | 5.5%(+1.85)#51 | 4.9%(+2.45)#3,476 |
| 52. | 84057 | 7.3% | 5.5%(+1.85)#52 | 4.9%(+2.45)#3,477 |
| 53. | 84340 | 7.3% | 5.5%(+1.84)#53 | 4.9%(+2.44)#3,481 |
| 54. | 84309 | 7.1% | 5.5%(+1.64)#54 | 4.9%(+2.25)#3,688 |
| 55. | 84067 | 7.1% | 5.5%(+1.62)#55 | 4.9%(+2.23)#3,709 |
| 56. | 84338 | 7.0% | 5.5%(+1.50)#56 | 4.9%(+2.11)#3,830 |
| 57. | 84004 | 7.0% | 5.5%(+1.49)#57 | 4.9%(+2.09)#3,851 |
| 58. | 84662 | 6.8% | 5.5%(+1.29)#58 | 4.9%(+1.90)#4,078 |
| 59. | 84097 | 6.8% | 5.5%(+1.27)#59 | 4.9%(+1.87)#4,113 |
| 60. | 84009 | 6.8% | 5.5%(+1.27)#60 | 4.9%(+1.87)#4,114 |
| 61. | 84335 | 6.7% | 5.5%(+1.24)#61 | 4.9%(+1.85)#4,154 |
| 62. | 84119 | 6.7% | 5.5%(+1.17)#62 | 4.9%(+1.77)#4,259 |
| 63. | 84513 | 6.5% | 5.5%(+1.01)#63 | 4.9%(+1.61)#4,466 |
| 64. | 84328 | 6.4% | 5.5%(+0.928)#64 | 4.9%(+1.53)#4,570 |
| 65. | 84062 | 6.3% | 5.5%(+0.804)#65 | 4.9%(+1.41)#4,769 |
| 66. | 84663 | 6.3% | 5.5%(+0.788)#66 | 4.9%(+1.39)#4,794 |
| 67. | 84088 | 6.3% | 5.5%(+0.765)#67 | 4.9%(+1.37)#4,830 |
| 68. | 84518 | 6.2% | 5.5%(+0.752)#68 | 4.9%(+1.36)#4,852 |
| 69. | 84003 | 6.2% | 5.5%(+0.744)#69 | 4.9%(+1.35)#4,870 |
| 70. | 84017 | 6.2% | 5.5%(+0.681)#70 | 4.9%(+1.28)#4,978 |
| 71. | 84404 | 6.1% | 5.5%(+0.617)#71 | 4.9%(+1.22)#5,092 |
| 72. | 84651 | 5.9% | 5.5%(+0.433)#72 | 4.9%(+1.04)#5,416 |
| 73. | 84715 | 5.9% | 5.5%(+0.384)#73 | 4.9%(+0.988)#5,531 |
| 74. | 84101 | 5.8% | 5.5%(+0.312)#74 | 4.9%(+0.915)#5,659 |
| 75. | 84604 | 5.8% | 5.5%(+0.265)#75 | 4.9%(+0.869)#5,748 |
| 76. | 84040 | 5.7% | 5.5%(+0.249)#76 | 4.9%(+0.853)#5,781 |
| 77. | 84780 | 5.7% | 5.5%(+0.215)#77 | 4.9%(+0.819)#5,854 |
| 78. | 84054 | 5.6% | 5.5%(+0.118)#78 | 4.9%(+0.722)#6,032 |
| 79. | 84783 | 5.5% | 5.5%(+0.044)#79 | 4.9%(+0.648)#6,218 |
| 80. | 84637 | 5.5% | 5.5%(-0.003)#80 | 4.9%(+0.601)#6,314 |
| 81. | 84606 | 5.5% | 5.5%(-0.022)#81 | 4.9%(+0.582)#6,356 |
| 82. | 84601 | 5.5% | 5.5%(-0.029)#82 | 4.9%(+0.575)#6,371 |
| 83. | 84074 | 5.3% | 5.5%(-0.184)#83 | 4.9%(+0.420)#6,728 |
| 84. | 84001 | 5.3% | 5.5%(-0.235)#84 | 4.9%(+0.369)#6,851 |
| 85. | 84037 | 5.2% | 5.5%(-0.345)#85 | 4.9%(+0.259)#7,078 |
| 86. | 84307 | 5.1% | 5.5%(-0.370)#86 | 4.9%(+0.234)#7,146 |
| 87. | 84665 | 5.1% | 5.5%(-0.370)#87 | 4.9%(+0.234)#7,147 |
| 88. | 84058 | 5.1% | 5.5%(-0.385)#88 | 4.9%(+0.219)#7,180 |
| 89. | 84092 | 5.1% | 5.5%(-0.425)#89 | 4.9%(+0.178)#7,272 |
| 90. | 84660 | 5.1% | 5.5%(-0.437)#90 | 4.9%(+0.167)#7,305 |
| 91. | 84117 | 5.0% | 5.5%(-0.469)#91 | 4.9%(+0.135)#7,384 |
| 92. | 84065 | 5.0% | 5.5%(-0.488)#92 | 4.9%(+0.116)#7,426 |
| 93. | 84647 | 5.0% | 5.5%(-0.498)#93 | 4.9%(+0.106)#7,444 |
| 94. | 84047 | 5.0% | 5.5%(-0.501)#94 | 4.9%(+0.103)#7,464 |
| 95. | 84081 | 5.0% | 5.5%(-0.502)#95 | 4.9%(+0.102)#7,470 |
| 96. | 84401 | 5.0% | 5.5%(-0.538)#96 | 4.9%(+0.066)#7,541 |
| 97. | 84044 | 4.9% | 5.5%(-0.575)#97 | 4.9%(+0.028)#7,634 |
| 98. | 84770 | 4.9% | 5.5%(-0.589)#98 | 4.9%(+0.015)#7,669 |
| 99. | 84084 | 4.9% | 5.5%(-0.591)#99 | 4.9%(+0.013)#7,677 |
| 100. | 84093 | 4.9% | 5.5%(-0.620)#100 | 4.9%(-0.016)#7,763 |
Common Questions
What are the Top 10 Zip Codes with the Highest Percentage of Population with a Degree in Computers and Mathematics in Utah?
Top 10 Zip Codes with the Highest Percentage of Population with a Degree in Computers and Mathematics in Utah are:
What zip code has the Highest Percentage of Population with a Degree in Computers and Mathematics in Utah?
84743 has the Highest Percentage of Population with a Degree in Computers and Mathematics in Utah with 71.4%.
What is the Percentage of Population with a Degree in Computers and Mathematics in the State of Utah?
Percentage of Population with a Degree in Computers and Mathematics in Utah is 5.5%.
What is the Percentage of Population with a Degree in Computers and Mathematics in the United States?
Percentage of Population with a Degree in Computers and Mathematics in the United States is 4.9%.