Zip Codes with the Highest Percentage of Population Employed in Computer & Mathematics in Utah
RELATED REPORTS & OPTIONS
Computer & Mathematics
Utah
Compare Zip Codes
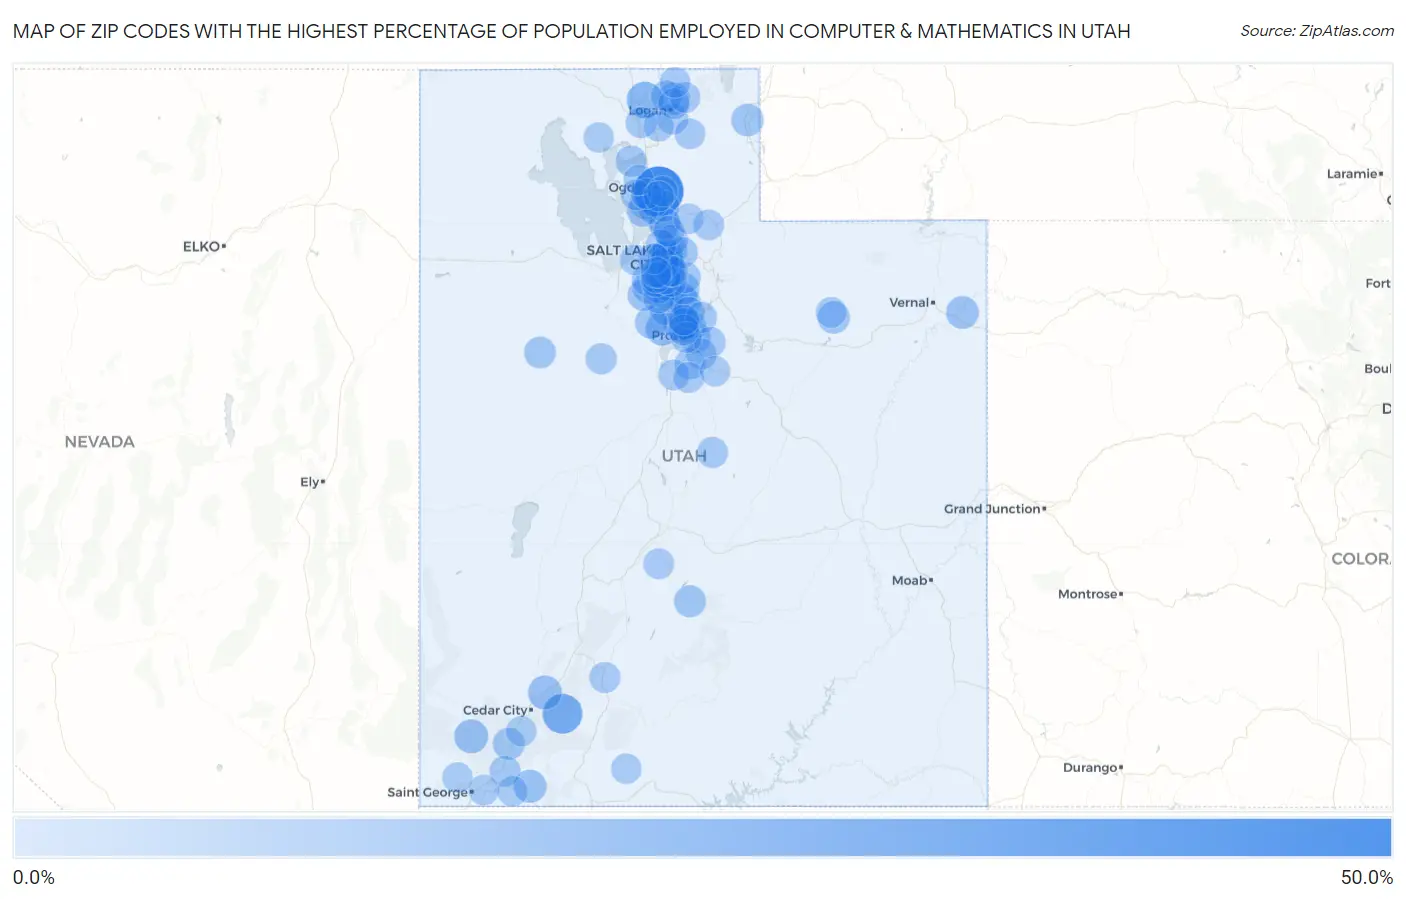
Map of Zip Codes with the Highest Percentage of Population Employed in Computer & Mathematics in Utah
0.0%
50.0%
Zip Codes with the Highest Percentage of Population Employed in Computer & Mathematics in Utah
| Zip Code | % Employed | vs State | vs National | |
| 1. | 84408 | 46.4% | 4.5%(+41.9)#1 | 3.5%(+42.9)#16 |
| 2. | 84719 | 24.0% | 4.5%(+19.5)#2 | 3.5%(+20.5)#85 |
| 3. | 84306 | 16.7% | 4.5%(+12.2)#3 | 3.5%(+13.1)#196 |
| 4. | 84772 | 11.1% | 4.5%(+6.59)#4 | 3.5%(+7.59)#548 |
| 5. | 84722 | 10.7% | 4.5%(+6.23)#5 | 3.5%(+7.22)#597 |
| 6. | 84111 | 10.5% | 4.5%(+5.98)#6 | 3.5%(+6.97)#632 |
| 7. | 84045 | 10.3% | 4.5%(+5.82)#7 | 3.5%(+6.82)#654 |
| 8. | 84059 | 9.7% | 4.5%(+5.15)#8 | 3.5%(+6.15)#760 |
| 9. | 84043 | 9.1% | 4.5%(+4.55)#9 | 3.5%(+5.54)#893 |
| 10. | 84763 | 8.8% | 4.5%(+4.31)#10 | 3.5%(+5.30)#948 |
| 11. | 84035 | 8.5% | 4.5%(+3.95)#11 | 3.5%(+4.94)#1,064 |
| 12. | 84102 | 8.0% | 4.5%(+3.53)#12 | 3.5%(+4.52)#1,194 |
| 13. | 84064 | 7.8% | 4.5%(+3.27)#13 | 3.5%(+4.26)#1,292 |
| 14. | 84073 | 7.8% | 4.5%(+3.26)#14 | 3.5%(+4.25)#1,294 |
| 15. | 84005 | 7.8% | 4.5%(+3.25)#15 | 3.5%(+4.24)#1,297 |
| 16. | 84009 | 7.7% | 4.5%(+3.14)#16 | 3.5%(+4.13)#1,332 |
| 17. | 84096 | 7.3% | 4.5%(+2.74)#17 | 3.5%(+3.74)#1,487 |
| 18. | 84103 | 7.2% | 4.5%(+2.70)#18 | 3.5%(+3.69)#1,508 |
| 19. | 84107 | 7.2% | 4.5%(+2.65)#19 | 3.5%(+3.64)#1,531 |
| 20. | 84070 | 7.1% | 4.5%(+2.60)#20 | 3.5%(+3.60)#1,559 |
| 21. | 84105 | 6.6% | 4.5%(+2.13)#21 | 3.5%(+3.12)#1,834 |
| 22. | 84318 | 6.6% | 4.5%(+2.05)#22 | 3.5%(+3.04)#1,878 |
| 23. | 84757 | 6.5% | 4.5%(+1.99)#23 | 3.5%(+2.98)#1,922 |
| 24. | 84097 | 6.4% | 4.5%(+1.92)#24 | 3.5%(+2.91)#1,974 |
| 25. | 84747 | 6.4% | 4.5%(+1.90)#25 | 3.5%(+2.90)#1,990 |
| 26. | 84004 | 6.3% | 4.5%(+1.81)#26 | 3.5%(+2.80)#2,054 |
| 27. | 84022 | 6.3% | 4.5%(+1.77)#27 | 3.5%(+2.76)#2,095 |
| 28. | 84020 | 6.2% | 4.5%(+1.70)#28 | 3.5%(+2.69)#2,138 |
| 29. | 84003 | 6.1% | 4.5%(+1.63)#29 | 3.5%(+2.62)#2,188 |
| 30. | 84101 | 6.1% | 4.5%(+1.60)#30 | 3.5%(+2.59)#2,217 |
| 31. | 84081 | 6.1% | 4.5%(+1.55)#31 | 3.5%(+2.54)#2,262 |
| 32. | 84094 | 6.0% | 4.5%(+1.51)#32 | 3.5%(+2.51)#2,288 |
| 33. | 84606 | 6.0% | 4.5%(+1.45)#33 | 3.5%(+2.44)#2,343 |
| 34. | 84092 | 6.0% | 4.5%(+1.44)#34 | 3.5%(+2.43)#2,351 |
| 35. | 84106 | 6.0% | 4.5%(+1.44)#35 | 3.5%(+2.43)#2,358 |
| 36. | 84095 | 5.8% | 4.5%(+1.32)#36 | 3.5%(+2.31)#2,463 |
| 37. | 84057 | 5.7% | 4.5%(+1.21)#37 | 3.5%(+2.20)#2,560 |
| 38. | 84121 | 5.7% | 4.5%(+1.19)#38 | 3.5%(+2.18)#2,578 |
| 39. | 84065 | 5.5% | 4.5%(+1.02)#39 | 3.5%(+2.02)#2,740 |
| 40. | 84062 | 5.5% | 4.5%(+0.967)#40 | 3.5%(+1.96)#2,803 |
| 41. | 84604 | 5.3% | 4.5%(+0.783)#41 | 3.5%(+1.77)#3,006 |
| 42. | 84335 | 5.3% | 4.5%(+0.775)#42 | 3.5%(+1.77)#3,016 |
| 43. | 84326 | 5.3% | 4.5%(+0.740)#43 | 3.5%(+1.73)#3,067 |
| 44. | 84088 | 5.2% | 4.5%(+0.666)#44 | 3.5%(+1.66)#3,148 |
| 45. | 84340 | 5.1% | 4.5%(+0.566)#45 | 3.5%(+1.56)#3,249 |
| 46. | 84663 | 5.1% | 4.5%(+0.534)#46 | 3.5%(+1.53)#3,300 |
| 47. | 84037 | 4.9% | 4.5%(+0.416)#47 | 3.5%(+1.41)#3,447 |
| 48. | 84093 | 4.9% | 4.5%(+0.412)#48 | 3.5%(+1.40)#3,456 |
| 49. | 84025 | 4.9% | 4.5%(+0.382)#49 | 3.5%(+1.37)#3,502 |
| 50. | 84015 | 4.9% | 4.5%(+0.361)#50 | 3.5%(+1.35)#3,531 |
| 51. | 84047 | 4.9% | 4.5%(+0.357)#51 | 3.5%(+1.35)#3,536 |
| 52. | 84041 | 4.8% | 4.5%(+0.327)#52 | 3.5%(+1.32)#3,578 |
| 53. | 84080 | 4.8% | 4.5%(+0.303)#53 | 3.5%(+1.29)#3,621 |
| 54. | 84010 | 4.8% | 4.5%(+0.294)#54 | 3.5%(+1.29)#3,633 |
| 55. | 84653 | 4.8% | 4.5%(+0.270)#55 | 3.5%(+1.26)#3,661 |
| 56. | 84123 | 4.7% | 4.5%(+0.176)#56 | 3.5%(+1.17)#3,804 |
| 57. | 84040 | 4.6% | 4.5%(+0.128)#57 | 3.5%(+1.12)#3,877 |
| 58. | 84774 | 4.6% | 4.5%(+0.059)#58 | 3.5%(+1.05)#3,981 |
| 59. | 84314 | 4.6% | 4.5%(+0.037)#59 | 3.5%(+1.03)#4,007 |
| 60. | 84056 | 4.6% | 4.5%(+0.037)#60 | 3.5%(+1.03)#4,008 |
| 61. | 84108 | 4.5% | 4.5%(+0.027)#61 | 3.5%(+1.02)#4,019 |
| 62. | 84662 | 4.5% | 4.5%(+0.022)#62 | 3.5%(+1.01)#4,023 |
| 63. | 84117 | 4.5% | 4.5%(-0.038)#63 | 3.5%(+0.954)#4,116 |
| 64. | 84075 | 4.4% | 4.5%(-0.067)#64 | 3.5%(+0.925)#4,176 |
| 65. | 84664 | 4.4% | 4.5%(-0.107)#65 | 3.5%(+0.885)#4,257 |
| 66. | 84759 | 4.4% | 4.5%(-0.125)#66 | 3.5%(+0.867)#4,284 |
| 67. | 84655 | 4.4% | 4.5%(-0.133)#67 | 3.5%(+0.859)#4,292 |
| 68. | 84115 | 4.4% | 4.5%(-0.135)#68 | 3.5%(+0.857)#4,296 |
| 69. | 84601 | 4.4% | 4.5%(-0.147)#69 | 3.5%(+0.845)#4,317 |
| 70. | 84651 | 4.3% | 4.5%(-0.177)#70 | 3.5%(+0.815)#4,360 |
| 71. | 84341 | 4.3% | 4.5%(-0.204)#71 | 3.5%(+0.788)#4,411 |
| 72. | 84058 | 4.3% | 4.5%(-0.205)#72 | 3.5%(+0.787)#4,415 |
| 73. | 84124 | 4.2% | 4.5%(-0.361)#73 | 3.5%(+0.631)#4,692 |
| 74. | 84042 | 4.1% | 4.5%(-0.367)#74 | 3.5%(+0.625)#4,707 |
| 75. | 84054 | 4.1% | 4.5%(-0.377)#75 | 3.5%(+0.615)#4,728 |
| 76. | 84014 | 4.1% | 4.5%(-0.404)#76 | 3.5%(+0.588)#4,786 |
| 77. | 84084 | 4.1% | 4.5%(-0.422)#77 | 3.5%(+0.570)#4,831 |
| 78. | 84104 | 4.1% | 4.5%(-0.458)#78 | 3.5%(+0.534)#4,906 |
| 79. | 84701 | 4.0% | 4.5%(-0.484)#79 | 3.5%(+0.508)#4,963 |
| 80. | 84129 | 4.0% | 4.5%(-0.511)#80 | 3.5%(+0.481)#5,023 |
| 81. | 84315 | 4.0% | 4.5%(-0.566)#81 | 3.5%(+0.426)#5,151 |
| 82. | 84033 | 3.8% | 4.5%(-0.722)#82 | 3.5%(+0.270)#5,493 |
| 83. | 84067 | 3.7% | 4.5%(-0.778)#83 | 3.5%(+0.215)#5,623 |
| 84. | 84321 | 3.7% | 4.5%(-0.823)#84 | 3.5%(+0.169)#5,742 |
| 85. | 84333 | 3.6% | 4.5%(-0.875)#85 | 3.5%(+0.117)#5,864 |
| 86. | 84319 | 3.6% | 4.5%(-0.879)#86 | 3.5%(+0.113)#5,873 |
| 87. | 84051 | 3.6% | 4.5%(-0.945)#87 | 3.5%(+0.047)#6,006 |
| 88. | 84404 | 3.6% | 4.5%(-0.962)#88 | 3.5%(+0.030)#6,061 |
| 89. | 84780 | 3.5% | 4.5%(-0.970)#89 | 3.5%(+0.022)#6,079 |
| 90. | 84339 | 3.5% | 4.5%(-1.06)#90 | 3.5%(-0.071)#6,330 |
| 91. | 84050 | 3.4% | 4.5%(-1.10)#91 | 3.5%(-0.111)#6,445 |
| 92. | 84737 | 3.4% | 4.5%(-1.10)#92 | 3.5%(-0.111)#6,447 |
| 93. | 84660 | 3.4% | 4.5%(-1.13)#93 | 3.5%(-0.140)#6,530 |
| 94. | 84403 | 3.3% | 4.5%(-1.22)#94 | 3.5%(-0.230)#6,800 |
| 95. | 84405 | 3.3% | 4.5%(-1.24)#95 | 3.5%(-0.244)#6,836 |
| 96. | 84307 | 3.2% | 4.5%(-1.34)#96 | 3.5%(-0.350)#7,175 |
| 97. | 84738 | 3.1% | 4.5%(-1.38)#97 | 3.5%(-0.387)#7,299 |
| 98. | 84044 | 3.1% | 4.5%(-1.38)#98 | 3.5%(-0.389)#7,308 |
| 99. | 84741 | 3.1% | 4.5%(-1.39)#99 | 3.5%(-0.400)#7,340 |
| 100. | 84742 | 3.1% | 4.5%(-1.39)#100 | 3.5%(-0.400)#7,346 |
Common Questions
What are the Top 10 Zip Codes with the Highest Percentage of Population Employed in Computer & Mathematics in Utah?
Top 10 Zip Codes with the Highest Percentage of Population Employed in Computer & Mathematics in Utah are:
What zip code has the Highest Percentage of Population Employed in Computer & Mathematics in Utah?
84408 has the Highest Percentage of Population Employed in Computer & Mathematics in Utah with 46.4%.
What is the Percentage of Population Employed in Computer & Mathematics in the State of Utah?
Percentage of Population Employed in Computer & Mathematics in Utah is 4.5%.
What is the Percentage of Population Employed in Computer & Mathematics in the United States?
Percentage of Population Employed in Computer & Mathematics in the United States is 3.5%.