Doolittle, TX Map & Demographics
Doolittle Map
Doolittle Overview
$14,190
PER CAPITA INCOME
$33,653
AVG FAMILY INCOME
$33,326
AVG HOUSEHOLD INCOME
$11,491
FAMILY INCOME DEFICIT
0.54
INEQUALITY / GINI INDEX
6,019
TOTAL POPULATION
3,053
MALE POPULATION
2,966
FEMALE POPULATION
102.93
MALES / 100 FEMALES
97.15
FEMALES / 100 MALES
23.2
MEDIAN AGE
4.5
AVG FAMILY SIZE
4.1
AVG HOUSEHOLD SIZE
1,632
LABOR FORCE [ PEOPLE ]
43.8%
PERCENT IN LABOR FORCE
22.3%
UNEMPLOYMENT RATE
Income in Doolittle
Income Overview in Doolittle
Per Capita Income in Doolittle is $14,190, while median incomes of families and households are $33,653 and $33,326 respectively.
| Characteristic | Number | Measure |
| Per Capita Income | 6,019 | $14,190 |
| Median Family Income | 1,295 | $33,653 |
| Mean Family Income | 1,295 | $55,221 |
| Median Household Income | 1,482 | $33,326 |
| Mean Household Income | 1,482 | $53,857 |
| Income Deficit | 1,295 | $11,491 |
| Wage / Income Gap (%) | 6,019 | 0.00% |
| Wage / Income Gap ($) | 6,019 | 100.00¢ per $1 |
| Gini / Inequality Index | 6,019 | 0.54 |
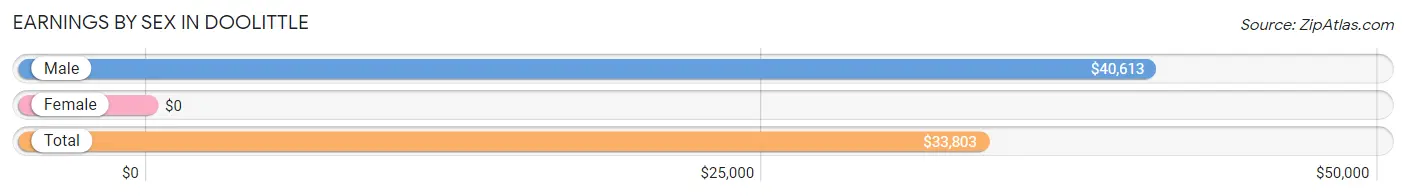
Earnings by Sex in Doolittle
| Sex | Number | Average Earnings |
| Male | 1,224 (76.4%) | $40,613 |
| Female | 378 (23.6%) | $0 |
| Total | 1,602 (100.0%) | $33,803 |
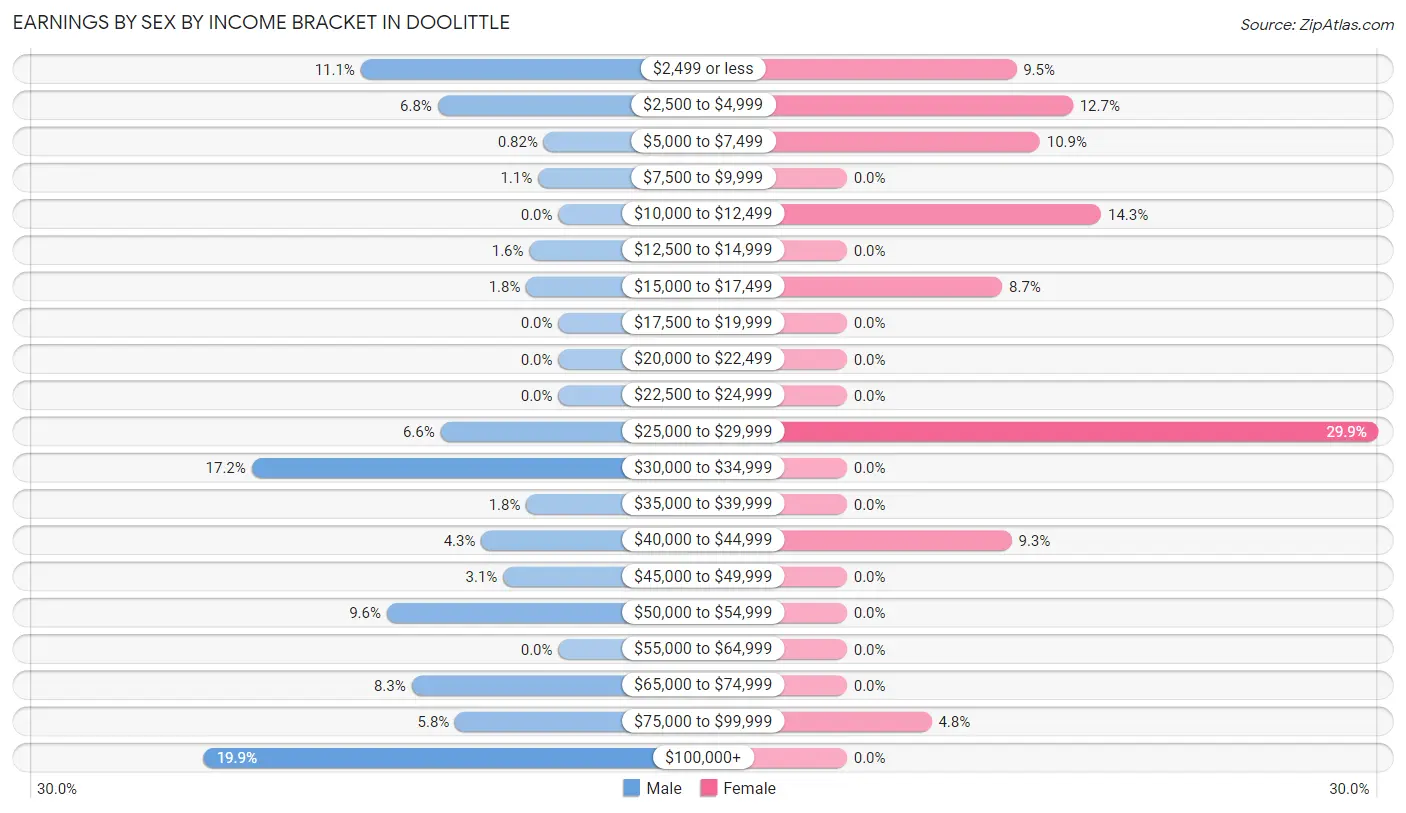
Earnings by Sex by Income Bracket in Doolittle
The most common earnings brackets in Doolittle are $100,000+ for men (244 | 19.9%) and $25,000 to $29,999 for women (113 | 29.9%).
| Income | Male | Female |
| $2,499 or less | 136 (11.1%) | 36 (9.5%) |
| $2,500 to $4,999 | 83 (6.8%) | 48 (12.7%) |
| $5,000 to $7,499 | 10 (0.8%) | 41 (10.8%) |
| $7,500 to $9,999 | 14 (1.1%) | 0 (0.0%) |
| $10,000 to $12,499 | 0 (0.0%) | 54 (14.3%) |
| $12,500 to $14,999 | 20 (1.6%) | 0 (0.0%) |
| $15,000 to $17,499 | 22 (1.8%) | 33 (8.7%) |
| $17,500 to $19,999 | 0 (0.0%) | 0 (0.0%) |
| $20,000 to $22,499 | 0 (0.0%) | 0 (0.0%) |
| $22,500 to $24,999 | 0 (0.0%) | 0 (0.0%) |
| $25,000 to $29,999 | 81 (6.6%) | 113 (29.9%) |
| $30,000 to $34,999 | 211 (17.2%) | 0 (0.0%) |
| $35,000 to $39,999 | 22 (1.8%) | 0 (0.0%) |
| $40,000 to $44,999 | 53 (4.3%) | 35 (9.3%) |
| $45,000 to $49,999 | 38 (3.1%) | 0 (0.0%) |
| $50,000 to $54,999 | 118 (9.6%) | 0 (0.0%) |
| $55,000 to $64,999 | 0 (0.0%) | 0 (0.0%) |
| $65,000 to $74,999 | 101 (8.3%) | 0 (0.0%) |
| $75,000 to $99,999 | 71 (5.8%) | 18 (4.8%) |
| $100,000+ | 244 (19.9%) | 0 (0.0%) |
| Total | 1,224 (100.0%) | 378 (100.0%) |
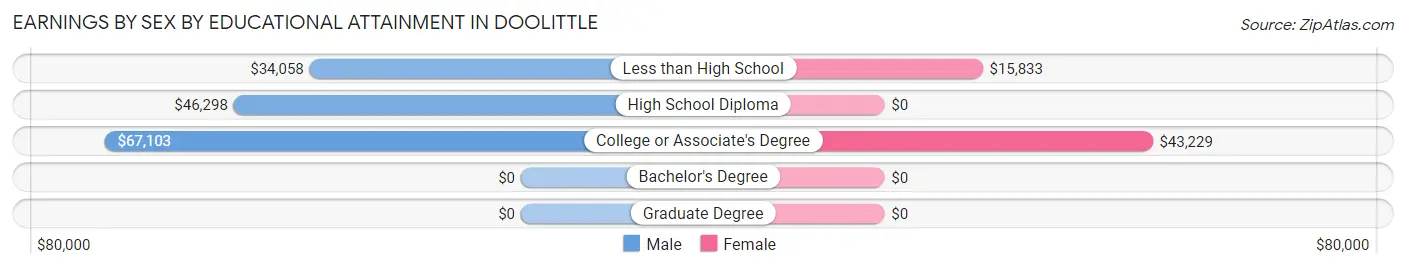
Earnings by Sex by Educational Attainment in Doolittle
Average earnings in Doolittle are $41,179 for men and $13,750 for women, a difference of 66.6%. Men with an educational attainment of college or associate's degree enjoy the highest average annual earnings of $67,103, while those with less than high school education earn the least with $34,058. Women with an educational attainment of college or associate's degree earn the most with the average annual earnings of $43,229, while those with less than high school education have the smallest earnings of $15,833.
| Educational Attainment | Male Income | Female Income |
| Less than High School | $34,058 | $15,833 |
| High School Diploma | $46,298 | $0 |
| College or Associate's Degree | $67,103 | $43,229 |
| Bachelor's Degree | - | - |
| Graduate Degree | - | - |
| Total | $41,179 | $13,750 |
Family Income in Doolittle
Family Income Brackets in Doolittle
According to the Doolittle family income data, there are 357 families falling into the $25,000 to $34,999 income range, which is the most common income bracket and makes up 27.6% of all families. Conversely, the $150,000 to $199,999 income bracket is the least frequent group with only 18 families (1.4%) belonging to this category.
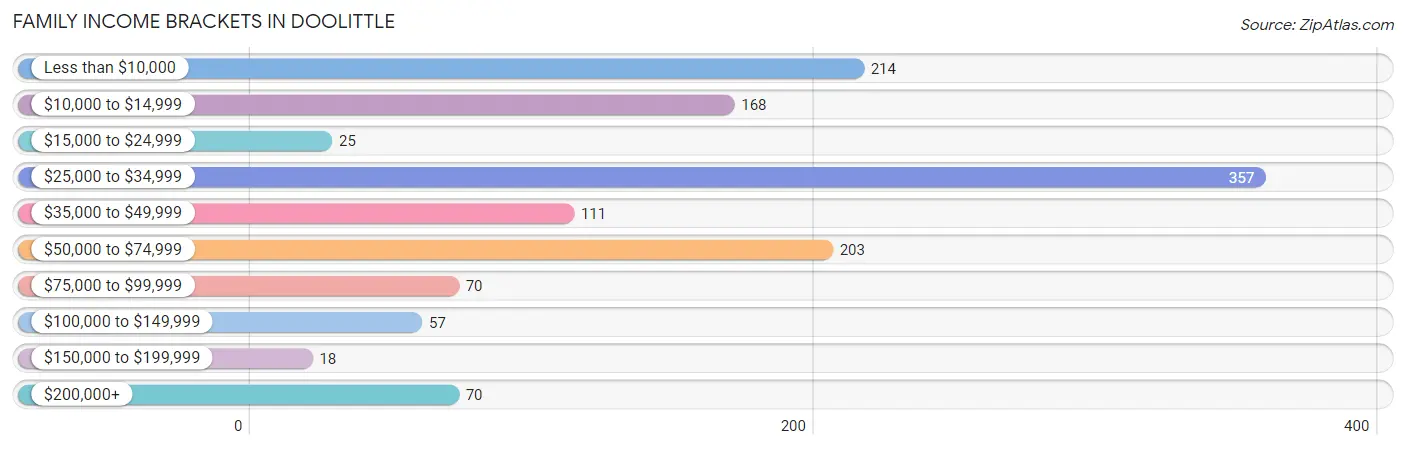
| Income Bracket | # Families | % Families |
| Less than $10,000 | 214 | 16.5% |
| $10,000 to $14,999 | 168 | 13.0% |
| $15,000 to $24,999 | 25 | 1.9% |
| $25,000 to $34,999 | 357 | 27.6% |
| $35,000 to $49,999 | 111 | 8.6% |
| $50,000 to $74,999 | 203 | 15.7% |
| $75,000 to $99,999 | 70 | 5.4% |
| $100,000 to $149,999 | 57 | 4.4% |
| $150,000 to $199,999 | 18 | 1.4% |
| $200,000+ | 70 | 5.4% |
Family Income by Famaliy Size in Doolittle
5-person families (265 | 20.5%) account for the highest median family income in Doolittle with $53,867 per family, while 5-person families (265 | 20.5%) have the highest median income of $10,773 per family member.
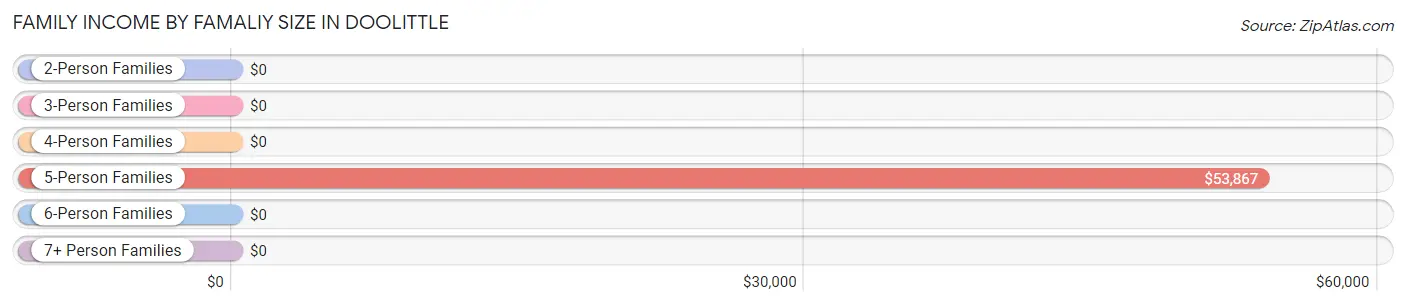
| Income Bracket | # Families | Median Income |
| 2-Person Families | 311 (24.0%) | $0 |
| 3-Person Families | 143 (11.0%) | $0 |
| 4-Person Families | 214 (16.5%) | $0 |
| 5-Person Families | 265 (20.5%) | $53,867 |
| 6-Person Families | 126 (9.7%) | $0 |
| 7+ Person Families | 236 (18.2%) | $0 |
| Total | 1,295 (100.0%) | $33,653 |
Family Income by Number of Earners in Doolittle
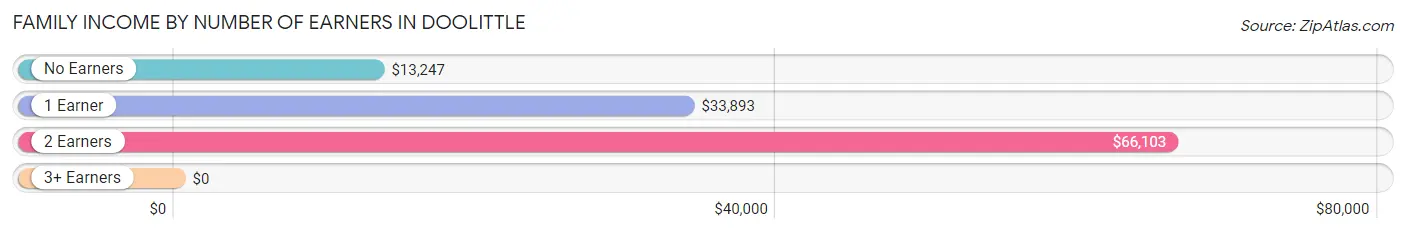
| Number of Earners | # Families | Median Income |
| No Earners | 319 (24.6%) | $13,247 |
| 1 Earner | 671 (51.8%) | $33,893 |
| 2 Earners | 239 (18.5%) | $66,103 |
| 3+ Earners | 66 (5.1%) | $0 |
| Total | 1,295 (100.0%) | $33,653 |
Household Income in Doolittle
Household Income Brackets in Doolittle
With 359 households falling in the category, the $25,000 to $34,999 income range is the most frequent in Doolittle, accounting for 24.2% of all households. In contrast, only 18 households (1.2%) fall into the $150,000 to $199,999 income bracket, making it the least populous group.
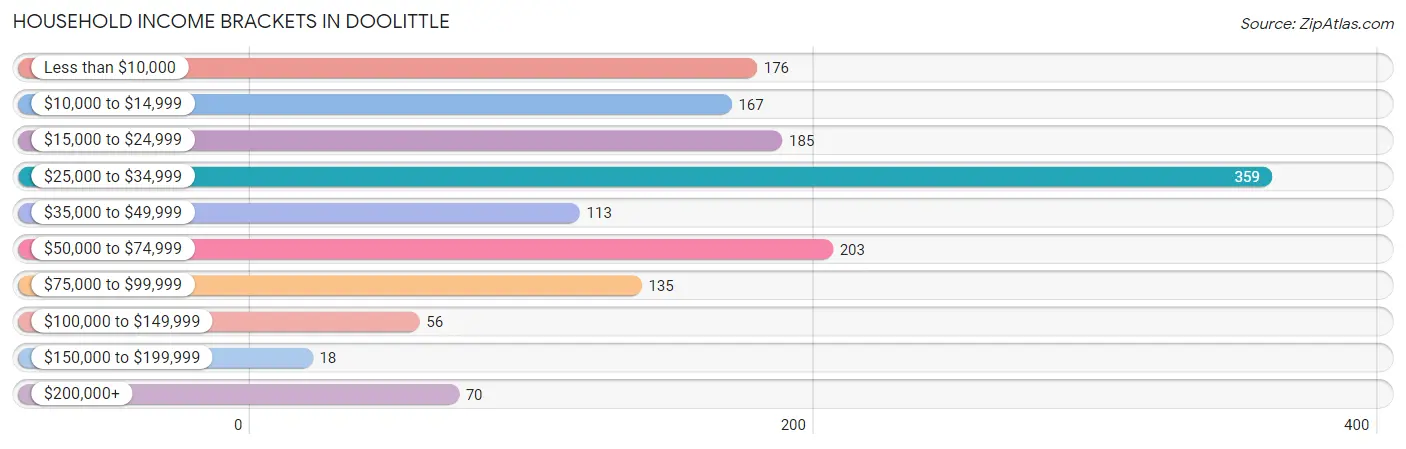
| Income Bracket | # Households | % Households |
| Less than $10,000 | 176 | 11.9% |
| $10,000 to $14,999 | 167 | 11.3% |
| $15,000 to $24,999 | 185 | 12.5% |
| $25,000 to $34,999 | 359 | 24.2% |
| $35,000 to $49,999 | 113 | 7.6% |
| $50,000 to $74,999 | 203 | 13.7% |
| $75,000 to $99,999 | 135 | 9.1% |
| $100,000 to $149,999 | 56 | 3.8% |
| $150,000 to $199,999 | 18 | 1.2% |
| $200,000+ | 70 | 4.7% |
Household Income by Householder Age in Doolittle
The median household income in Doolittle is $33,326, with the highest median household income of $33,406 found in the 25 to 44 years age bracket for the primary householder. A total of 580 households (39.1%) fall into this category.
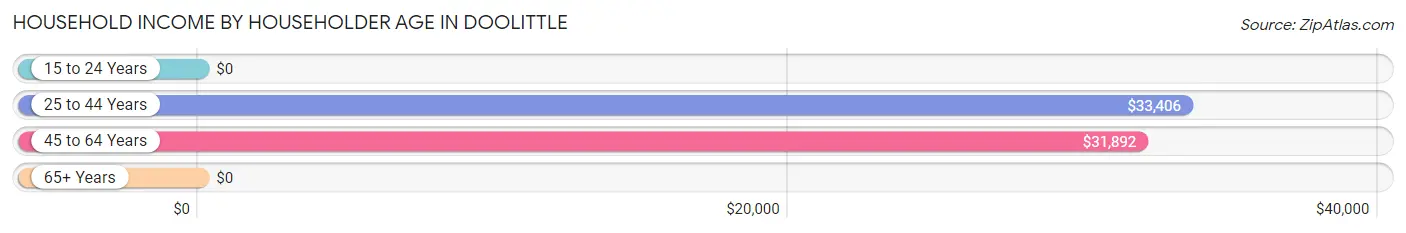
| Income Bracket | # Households | Median Income |
| 15 to 24 Years | 0 (0.0%) | $0 |
| 25 to 44 Years | 580 (39.1%) | $33,406 |
| 45 to 64 Years | 750 (50.6%) | $31,892 |
| 65+ Years | 152 (10.3%) | $0 |
| Total | 1,482 (100.0%) | $33,326 |
Poverty in Doolittle
Income Below Poverty by Sex and Age in Doolittle
With 48.6% poverty level for males and 63.1% for females among the residents of Doolittle, 6 to 11 year old males and under 5 year old females are the most vulnerable to poverty, with 390 males (94.9%) and 338 females (100.0%) in their respective age groups living below the poverty level.
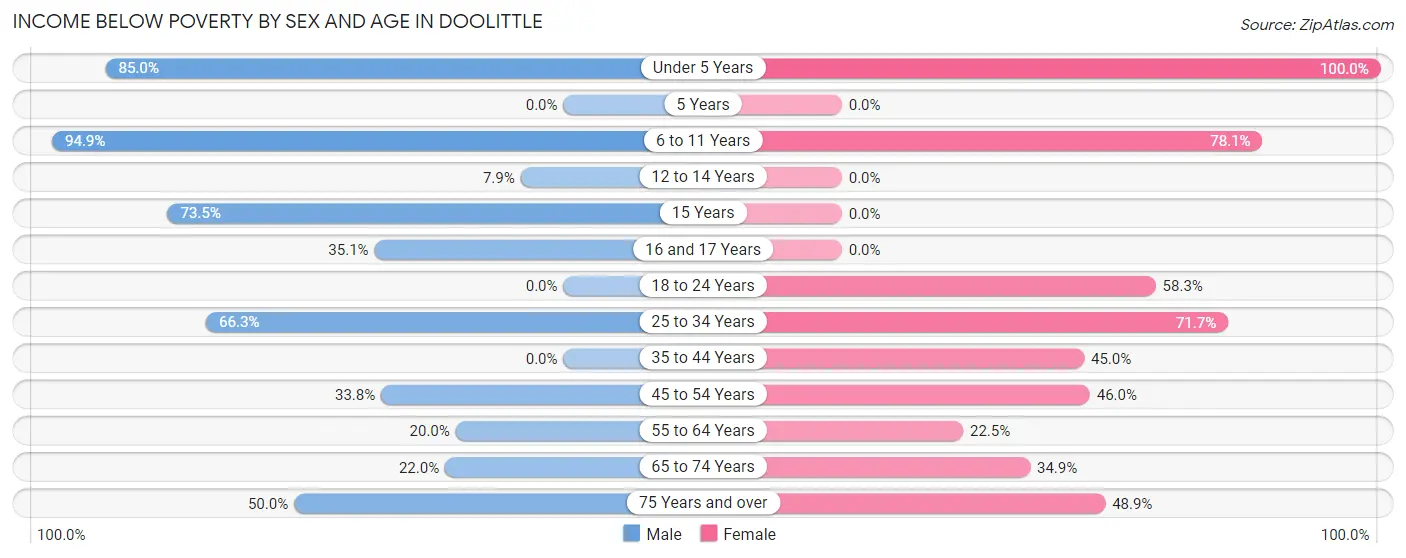
| Age Bracket | Male | Female |
| Under 5 Years | 458 (85.0%) | 338 (100.0%) |
| 5 Years | 0 (0.0%) | 0 (0.0%) |
| 6 to 11 Years | 390 (94.9%) | 591 (78.1%) |
| 12 to 14 Years | 15 (7.9%) | 0 (0.0%) |
| 15 Years | 36 (73.5%) | 0 (0.0%) |
| 16 and 17 Years | 101 (35.1%) | 0 (0.0%) |
| 18 to 24 Years | 0 (0.0%) | 134 (58.3%) |
| 25 to 34 Years | 236 (66.3%) | 405 (71.7%) |
| 35 to 44 Years | 0 (0.0%) | 174 (45.0%) |
| 45 to 54 Years | 157 (33.8%) | 110 (46.0%) |
| 55 to 64 Years | 41 (20.0%) | 70 (22.5%) |
| 65 to 74 Years | 29 (22.0%) | 29 (34.9%) |
| 75 Years and over | 22 (50.0%) | 22 (48.9%) |
| Total | 1,485 (48.6%) | 1,873 (63.1%) |
Income Above Poverty by Sex and Age in Doolittle
According to the poverty statistics in Doolittle, males aged 18 to 24 years and females aged 12 to 14 years are the age groups that are most secure financially, with 100.0% of males and 100.0% of females in these age groups living above the poverty line.
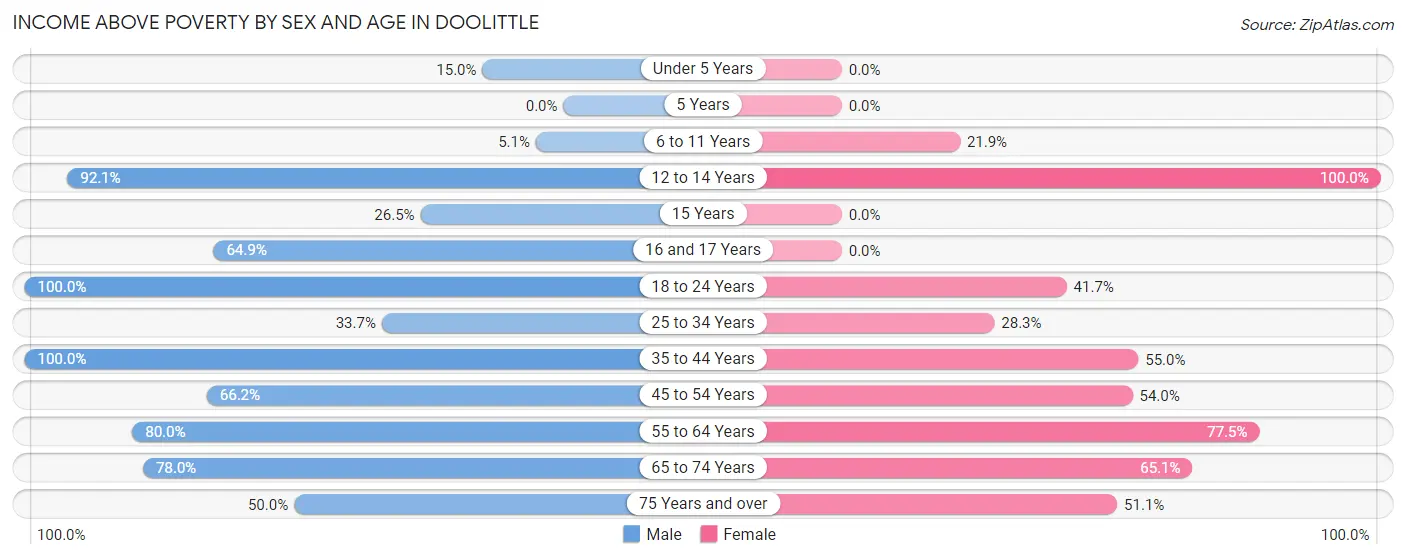
| Age Bracket | Male | Female |
| Under 5 Years | 81 (15.0%) | 0 (0.0%) |
| 5 Years | 0 (0.0%) | 0 (0.0%) |
| 6 to 11 Years | 21 (5.1%) | 166 (21.9%) |
| 12 to 14 Years | 174 (92.1%) | 11 (100.0%) |
| 15 Years | 13 (26.5%) | 0 (0.0%) |
| 16 and 17 Years | 187 (64.9%) | 0 (0.0%) |
| 18 to 24 Years | 252 (100.0%) | 96 (41.7%) |
| 25 to 34 Years | 120 (33.7%) | 160 (28.3%) |
| 35 to 44 Years | 124 (100.0%) | 213 (55.0%) |
| 45 to 54 Years | 307 (66.2%) | 129 (54.0%) |
| 55 to 64 Years | 164 (80.0%) | 241 (77.5%) |
| 65 to 74 Years | 103 (78.0%) | 54 (65.1%) |
| 75 Years and over | 22 (50.0%) | 23 (51.1%) |
| Total | 1,568 (51.4%) | 1,093 (36.8%) |
Income Below Poverty Among Married-Couple Families in Doolittle
The poverty statistics for married-couple families in Doolittle show that 44.2% or 421 of the total 952 families live below the poverty line. Families with 5 or more children have the highest poverty rate of 100.0%, comprising of 218 families. On the other hand, families with 3 or 4 children have the lowest poverty rate of 23.8%, which includes 41 families.
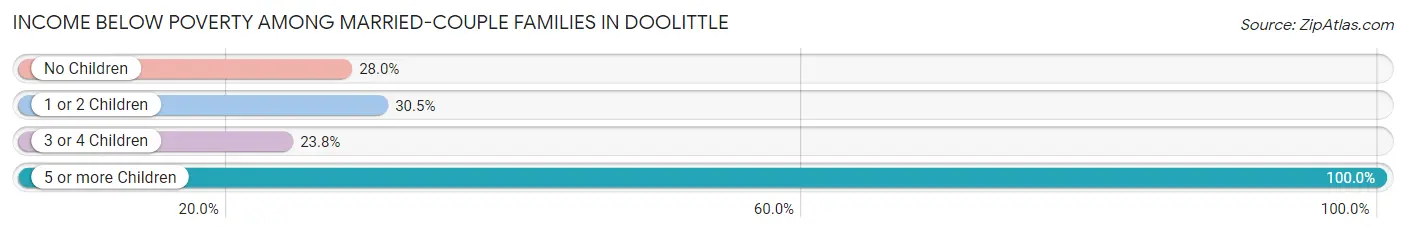
| Children | Above Poverty | Below Poverty |
| No Children | 263 (72.1%) | 102 (28.0%) |
| 1 or 2 Children | 137 (69.5%) | 60 (30.5%) |
| 3 or 4 Children | 131 (76.2%) | 41 (23.8%) |
| 5 or more Children | 0 (0.0%) | 218 (100.0%) |
| Total | 531 (55.8%) | 421 (44.2%) |
Income Below Poverty Among Single-Parent Households in Doolittle
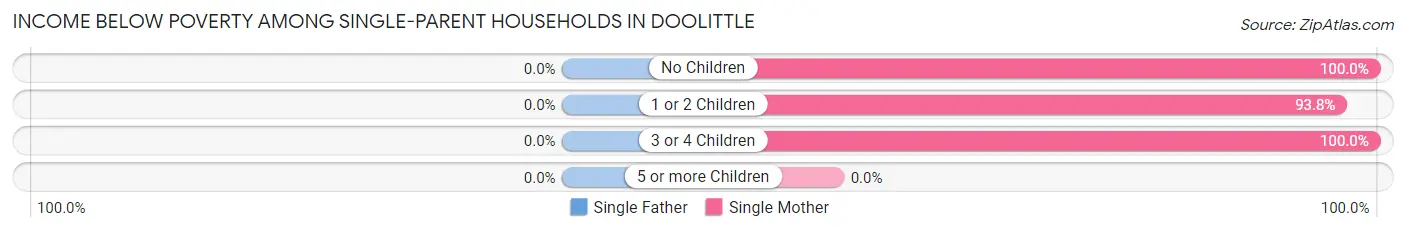
| Children | Single Father | Single Mother |
| No Children | 0 (0.0%) | 29 (100.0%) |
| 1 or 2 Children | 0 (0.0%) | 211 (93.8%) |
| 3 or 4 Children | 0 (0.0%) | 67 (100.0%) |
| 5 or more Children | 0 (0.0%) | 0 (0.0%) |
| Total | 0 (0.0%) | 307 (95.6%) |
Income Below Poverty Among Married-Couple vs Single-Parent Households in Doolittle
The poverty data for Doolittle shows that 421 of the married-couple family households (44.2%) and 307 of the single-parent households (89.5%) are living below the poverty level. Within the married-couple family households, those with 5 or more children have the highest poverty rate, with 218 households (100.0%) falling below the poverty line. Among the single-parent households, those with 3 or 4 children have the highest poverty rate, with 67 household (100.0%) living below poverty.
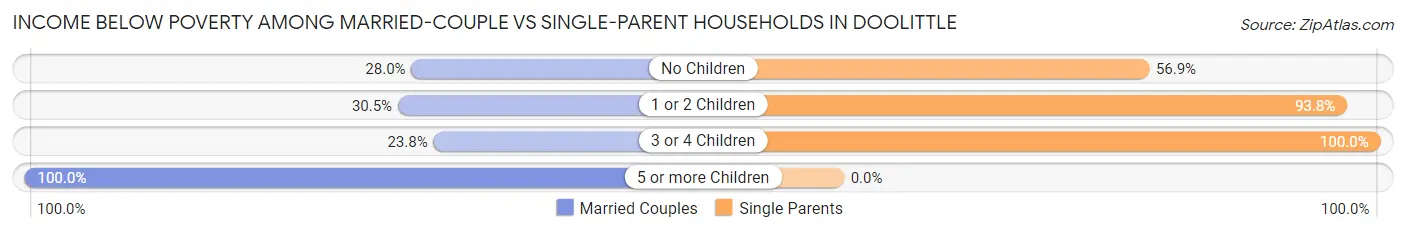
| Children | Married-Couple Families | Single-Parent Households |
| No Children | 102 (28.0%) | 29 (56.9%) |
| 1 or 2 Children | 60 (30.5%) | 211 (93.8%) |
| 3 or 4 Children | 41 (23.8%) | 67 (100.0%) |
| 5 or more Children | 218 (100.0%) | 0 (0.0%) |
| Total | 421 (44.2%) | 307 (89.5%) |
Race in Doolittle
The most populous races in Doolittle are Hispanic or Latino (6,010 | 99.9%), Two or more Races (4,117 | 68.4%), and White / Caucasian (1,196 | 19.9%).
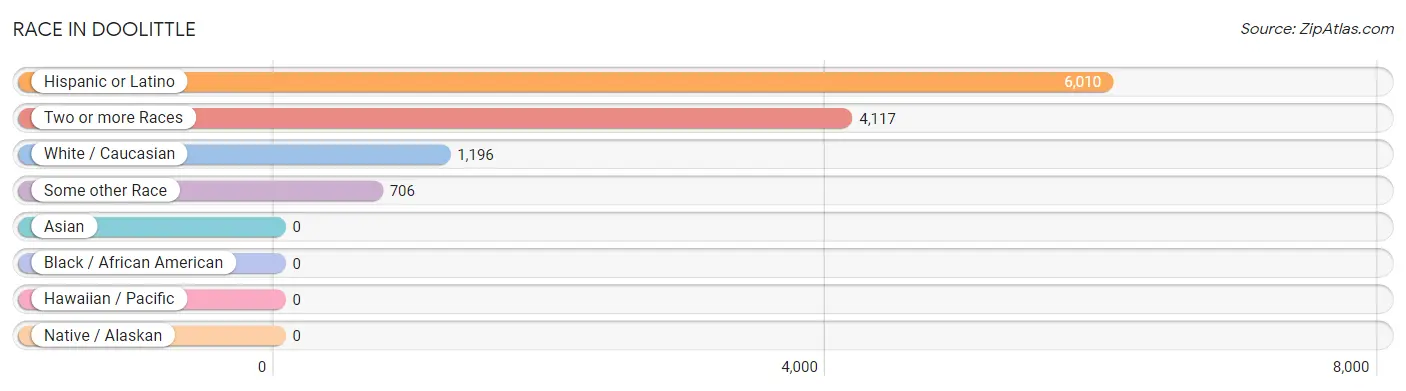
| Race | # Population | % Population |
| Asian | 0 | 0.0% |
| Black / African American | 0 | 0.0% |
| Hawaiian / Pacific | 0 | 0.0% |
| Hispanic or Latino | 6,010 | 99.9% |
| Native / Alaskan | 0 | 0.0% |
| White / Caucasian | 1,196 | 19.9% |
| Two or more Races | 4,117 | 68.4% |
| Some other Race | 706 | 11.7% |
| Total | 6,019 | 100.0% |
Ancestry in Doolittle
The most populous ancestries reported in Doolittle are , and Mexican (6,010 | 99.9%), together accounting for 99.9% of all Doolittle residents.

| Ancestry | # Population | % Population |
| Mexican | 6,010 | 99.9% | View All 1 Rows |
Immigrants in Doolittle
The most numerous immigrant groups reported in Doolittle came from Central America (1,353 | 22.5%), Latin America (1,353 | 22.5%), and Mexico (1,353 | 22.5%), together accounting for 67.4% of all Doolittle residents.
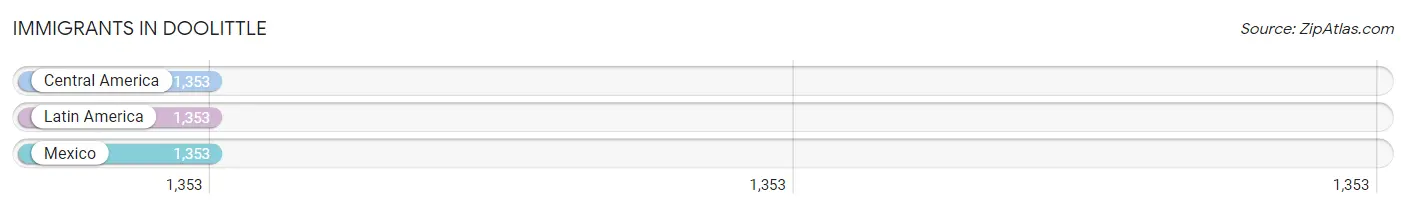
| Immigration Origin | # Population | % Population |
| Central America | 1,353 | 22.5% |
| Latin America | 1,353 | 22.5% |
| Mexico | 1,353 | 22.5% | View All 3 Rows |
Sex and Age in Doolittle
Sex and Age in Doolittle
The most populous age groups in Doolittle are Under 5 Years (539 | 17.6%) for men and 5 to 9 Years (532 | 17.9%) for women.
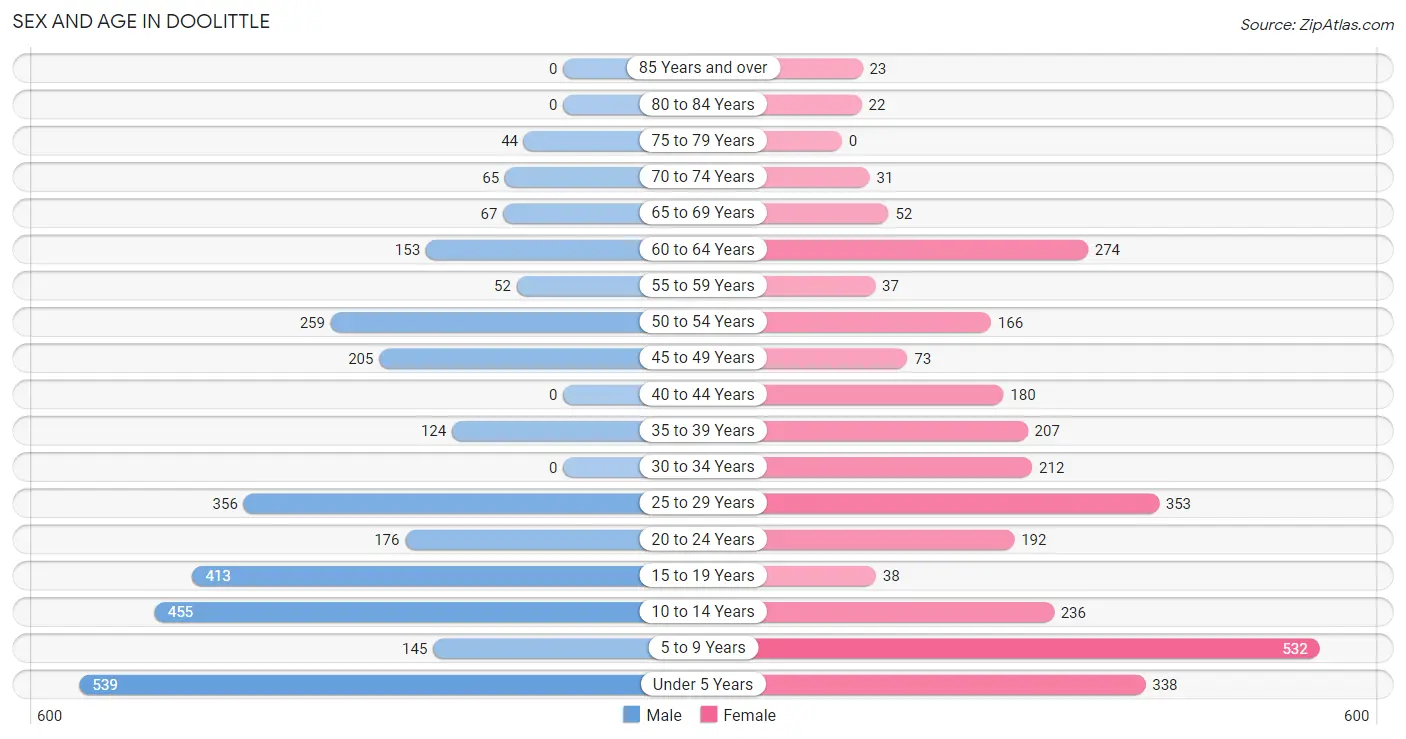
| Age Bracket | Male | Female |
| Under 5 Years | 539 (17.6%) | 338 (11.4%) |
| 5 to 9 Years | 145 (4.8%) | 532 (17.9%) |
| 10 to 14 Years | 455 (14.9%) | 236 (8.0%) |
| 15 to 19 Years | 413 (13.5%) | 38 (1.3%) |
| 20 to 24 Years | 176 (5.8%) | 192 (6.5%) |
| 25 to 29 Years | 356 (11.7%) | 353 (11.9%) |
| 30 to 34 Years | 0 (0.0%) | 212 (7.1%) |
| 35 to 39 Years | 124 (4.1%) | 207 (7.0%) |
| 40 to 44 Years | 0 (0.0%) | 180 (6.1%) |
| 45 to 49 Years | 205 (6.7%) | 73 (2.5%) |
| 50 to 54 Years | 259 (8.5%) | 166 (5.6%) |
| 55 to 59 Years | 52 (1.7%) | 37 (1.3%) |
| 60 to 64 Years | 153 (5.0%) | 274 (9.2%) |
| 65 to 69 Years | 67 (2.2%) | 52 (1.8%) |
| 70 to 74 Years | 65 (2.1%) | 31 (1.1%) |
| 75 to 79 Years | 44 (1.4%) | 0 (0.0%) |
| 80 to 84 Years | 0 (0.0%) | 22 (0.7%) |
| 85 Years and over | 0 (0.0%) | 23 (0.8%) |
| Total | 3,053 (100.0%) | 2,966 (100.0%) |
Families and Households in Doolittle
Median Family Size in Doolittle
The median family size in Doolittle is 4.46 persons per family, with single male/father families (22 | 1.7%) accounting for the largest median family size of 5.32 persons per family. On the other hand, single female/mother families (321 | 24.8%) represent the smallest median family size with 3.58 persons per family.
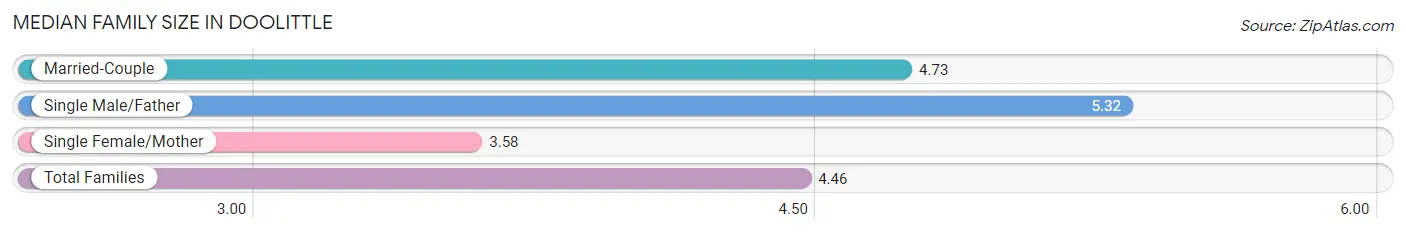
| Family Type | # Families | Family Size |
| Married-Couple | 952 (73.5%) | 4.73 |
| Single Male/Father | 22 (1.7%) | 5.32 |
| Single Female/Mother | 321 (24.8%) | 3.58 |
| Total Families | 1,295 (100.0%) | 4.46 |
Median Household Size in Doolittle
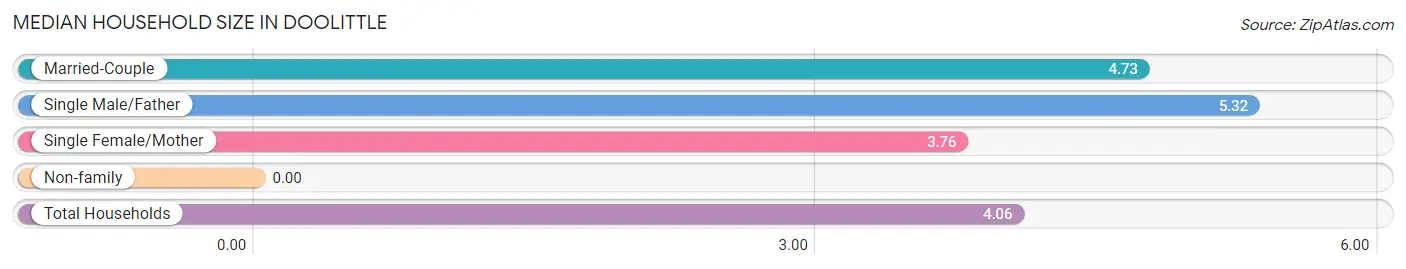
| Household Type | # Households | Household Size |
| Married-Couple | 952 (64.2%) | 4.73 |
| Single Male/Father | 22 (1.5%) | 5.32 |
| Single Female/Mother | 321 (21.7%) | 3.76 |
| Non-family | 187 (12.6%) | - |
| Total Households | 1,482 (100.0%) | 4.06 |
Household Size by Marriage Status in Doolittle
Out of a total of 1,482 households in Doolittle, 1,295 (87.4%) are family households, while 187 (12.6%) are nonfamily households. The most numerous type of family households are 2-person households, comprising 311, and the most common type of nonfamily households are 1-person households, comprising 187.
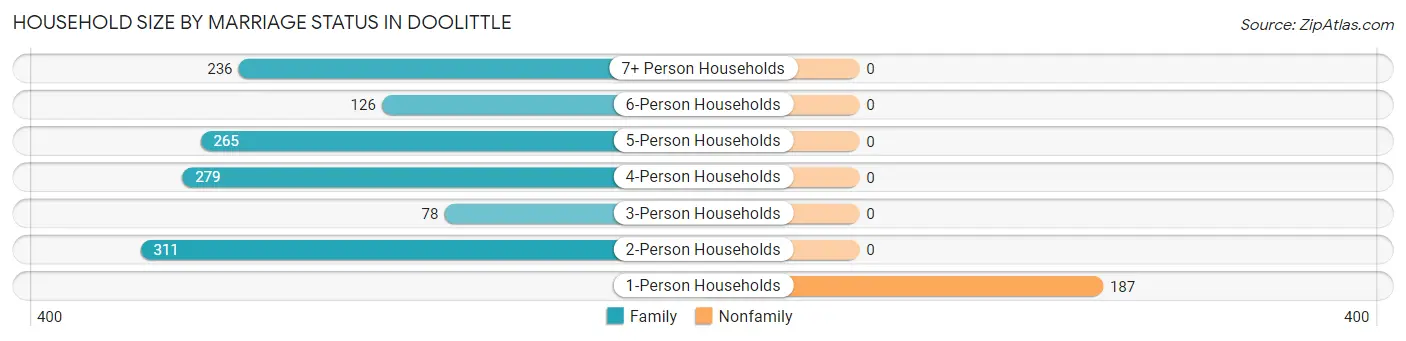
| Household Size | Family Households | Nonfamily Households |
| 1-Person Households | - | 187 (12.6%) |
| 2-Person Households | 311 (21.0%) | 0 (0.0%) |
| 3-Person Households | 78 (5.3%) | 0 (0.0%) |
| 4-Person Households | 279 (18.8%) | 0 (0.0%) |
| 5-Person Households | 265 (17.9%) | 0 (0.0%) |
| 6-Person Households | 126 (8.5%) | 0 (0.0%) |
| 7+ Person Households | 236 (15.9%) | 0 (0.0%) |
| Total | 1,295 (87.4%) | 187 (12.6%) |
Female Fertility in Doolittle
Fertility by Age in Doolittle
Average fertility rate in Doolittle is 206.0 births per 1,000 women. Women in the age bracket of 20 to 34 years have the highest fertility rate with 343.0 births per 1,000 women. Women in the age bracket of 20 to 34 years acount for 92.5% of all women with births.
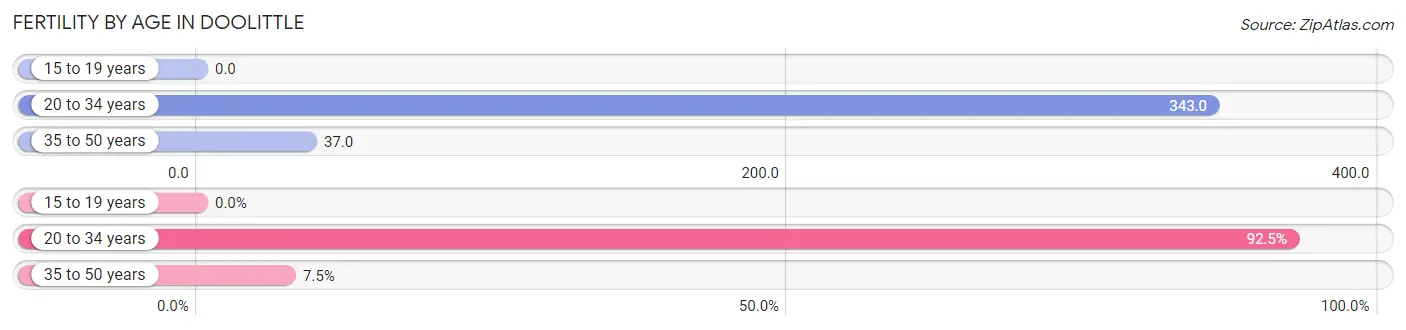
| Age Bracket | Women with Births | Births / 1,000 Women |
| 15 to 19 years | 0 (0.0%) | 0.0 |
| 20 to 34 years | 260 (92.5%) | 343.0 |
| 35 to 50 years | 21 (7.5%) | 37.0 |
| Total | 281 (100.0%) | 206.0 |
Fertility by Age by Marriage Status in Doolittle
77.6% of women with births (281) in Doolittle are married. The highest percentage of unmarried women with births falls into 35 to 50 years age bracket with 100.0% of them unmarried at the time of birth, while the lowest percentage of unmarried women with births belong to 20 to 34 years age bracket with 16.1% of them unmarried.
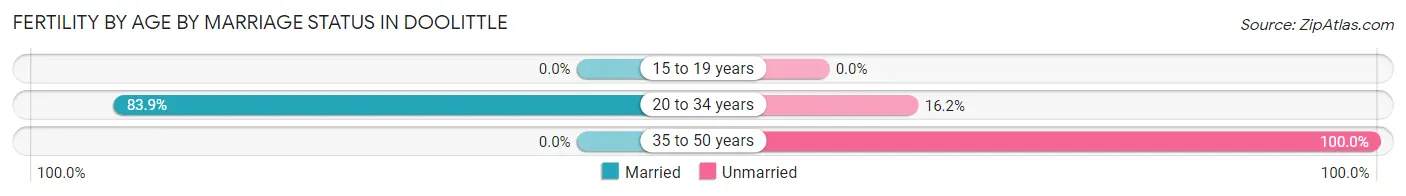
| Age Bracket | Married | Unmarried |
| 15 to 19 years | 0 (0.0%) | 0 (0.0%) |
| 20 to 34 years | 218 (83.9%) | 42 (16.2%) |
| 35 to 50 years | 0 (0.0%) | 21 (100.0%) |
| Total | 218 (77.6%) | 63 (22.4%) |
Fertility by Education in Doolittle
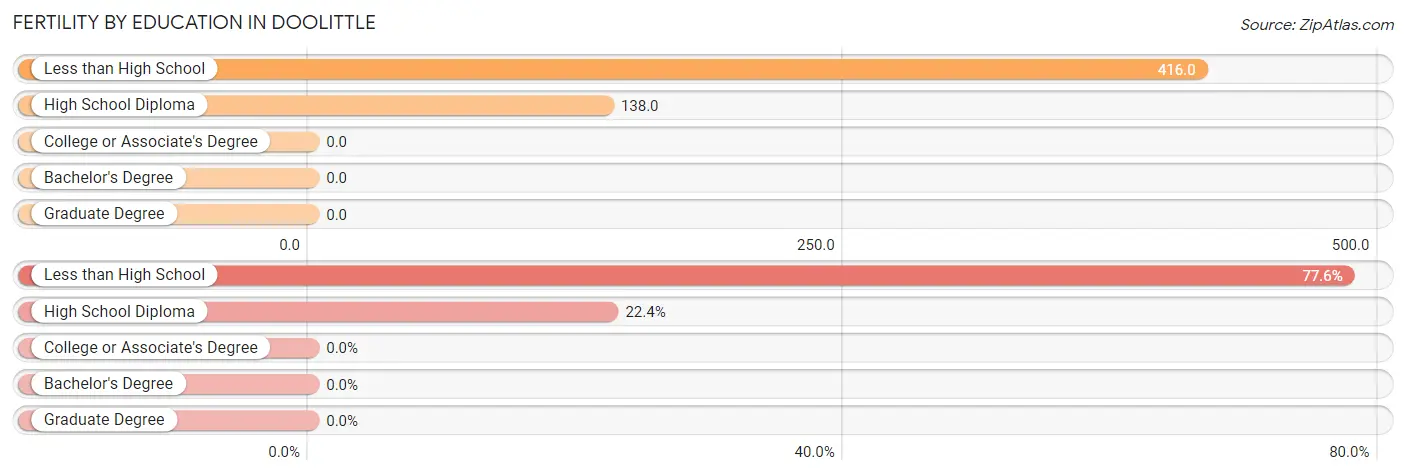
| Educational Attainment | Women with Births | Births / 1,000 Women |
| Less than High School | 218 (77.6%) | 416.0 |
| High School Diploma | 63 (22.4%) | 138.0 |
| College or Associate's Degree | 0 (0.0%) | 0.0 |
| Bachelor's Degree | 0 (0.0%) | 0.0 |
| Graduate Degree | 0 (0.0%) | 0.0 |
| Total | 281 (100.0%) | 206.0 |
Fertility by Education by Marriage Status in Doolittle
22.4% of women with births in Doolittle are unmarried. Women with the educational attainment of less than high school are most likely to be married with 100.0% of them married at childbirth, while women with the educational attainment of high school diploma are least likely to be married with 100.0% of them unmarried at childbirth.
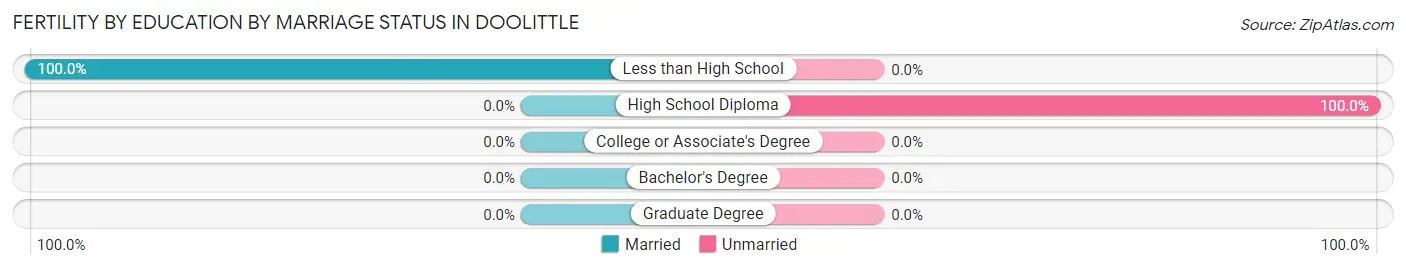
| Educational Attainment | Married | Unmarried |
| Less than High School | 218 (100.0%) | 0 (0.0%) |
| High School Diploma | 0 (0.0%) | 63 (100.0%) |
| College or Associate's Degree | 0 (0.0%) | 0 (0.0%) |
| Bachelor's Degree | 0 (0.0%) | 0 (0.0%) |
| Graduate Degree | 0 (0.0%) | 0 (0.0%) |
| Total | 218 (77.6%) | 63 (22.4%) |
Employment Characteristics in Doolittle
Employment by Class of Employer in Doolittle
Among the 1,268 employed individuals in Doolittle, private company employees (848 | 66.9%), self-employed (not incorporated) (319 | 25.2%), and local government employees (58 | 4.6%) make up the most common classes of employment.
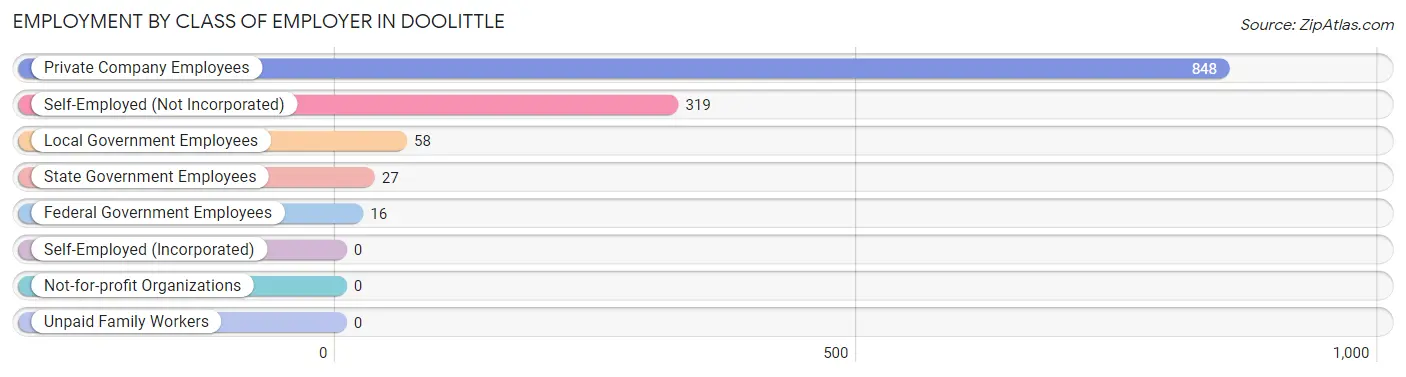
| Employer Class | # Employees | % Employees |
| Private Company Employees | 848 | 66.9% |
| Self-Employed (Incorporated) | 0 | 0.0% |
| Self-Employed (Not Incorporated) | 319 | 25.2% |
| Not-for-profit Organizations | 0 | 0.0% |
| Local Government Employees | 58 | 4.6% |
| State Government Employees | 27 | 2.1% |
| Federal Government Employees | 16 | 1.3% |
| Unpaid Family Workers | 0 | 0.0% |
| Total | 1,268 | 100.0% |
Employment Status by Age in Doolittle
According to the labor force statistics for Doolittle, out of the total population over 16 years of age (3,725), 43.8% or 1,632 individuals are in the labor force, with 22.3% or 364 of them unemployed. The age group with the highest labor force participation rate is 20 to 24 years, with 77.7% or 286 individuals in the labor force. Within the labor force, the 25 to 29 years age range has the highest percentage of unemployed individuals, with 59.3% or 211 of them being unemployed.
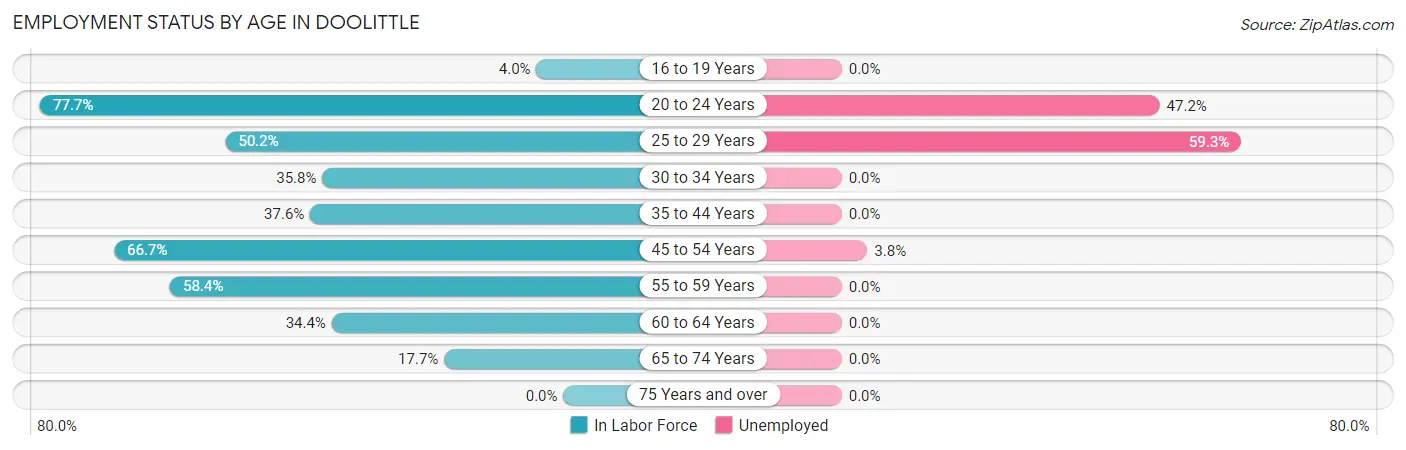
| Age Bracket | In Labor Force | Unemployed |
| 16 to 19 Years | 16 (4.0%) | 0 (0.0%) |
| 20 to 24 Years | 286 (77.7%) | 135 (47.2%) |
| 25 to 29 Years | 356 (50.2%) | 211 (59.3%) |
| 30 to 34 Years | 76 (35.8%) | 0 (0.0%) |
| 35 to 44 Years | 192 (37.6%) | 0 (0.0%) |
| 45 to 54 Years | 469 (66.7%) | 18 (3.8%) |
| 55 to 59 Years | 52 (58.4%) | 0 (0.0%) |
| 60 to 64 Years | 147 (34.4%) | 0 (0.0%) |
| 65 to 74 Years | 38 (17.7%) | 0 (0.0%) |
| 75 Years and over | 0 (0.0%) | 0 (0.0%) |
| Total | 1,632 (43.8%) | 364 (22.3%) |
Employment Status by Educational Attainment in Doolittle
According to labor force statistics for Doolittle, 48.7% of individuals (1,291) out of the total population between 25 and 64 years of age (2,651) are in the labor force, with 17.7% or 229 of them being unemployed. The group with the highest labor force participation rate are those with the educational attainment of bachelor's degree or higher, with 81.6% or 80 individuals in the labor force. Within the labor force, individuals with less than high school education have the highest percentage of unemployment, with 35.2% or 211 of them being unemployed.
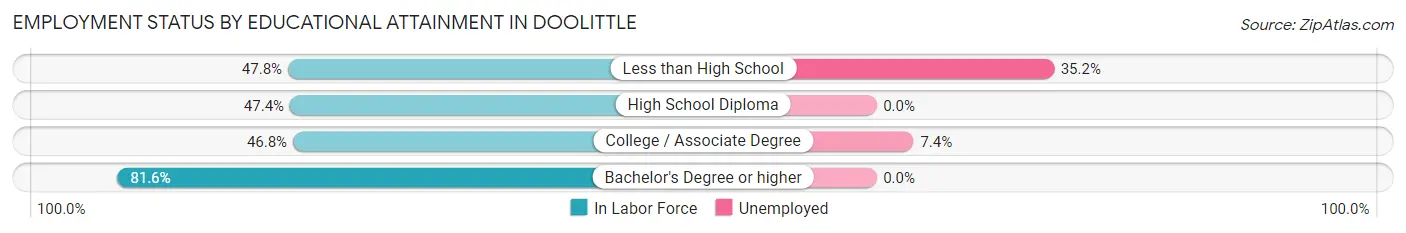
| Educational Attainment | In Labor Force | Unemployed |
| Less than High School | 599 (47.8%) | 441 (35.2%) |
| High School Diploma | 371 (47.4%) | 0 (0.0%) |
| College / Associate Degree | 242 (46.8%) | 38 (7.4%) |
| Bachelor's Degree or higher | 80 (81.6%) | 0 (0.0%) |
| Total | 1,291 (48.7%) | 469 (17.7%) |
Employment Occupations by Sex in Doolittle
Management, Business, Science and Arts Occupations
The most common Management, Business, Science and Arts occupations in Doolittle are Health Diagnosing & Treating (44 | 3.5%), Health Technologists (44 | 3.5%), Management (39 | 3.1%), Computers, Engineering & Science (26 | 2.1%), and Computers & Mathematics (26 | 2.1%).
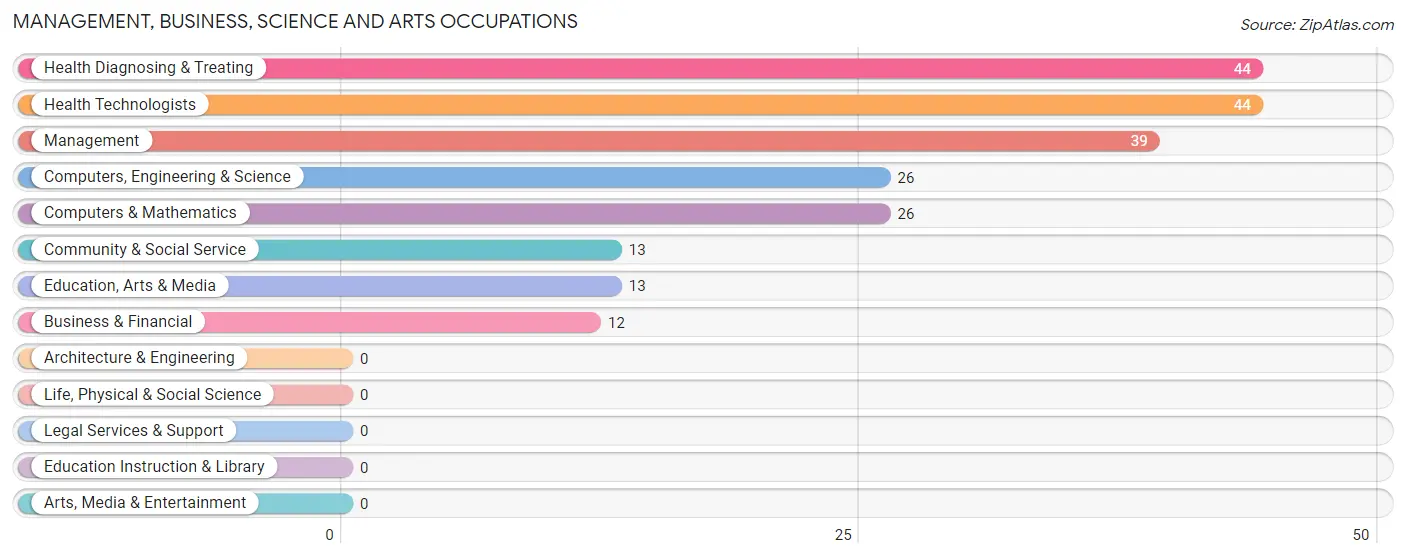
Management, Business, Science and Arts Occupations by Sex
Within the Management, Business, Science and Arts occupations in Doolittle, the most male-oriented occupations are Management (100.0%), Computers, Engineering & Science (100.0%), and Computers & Mathematics (100.0%), while the most female-oriented occupations are Business & Financial (100.0%), Health Diagnosing & Treating (40.9%), and Health Technologists (40.9%).
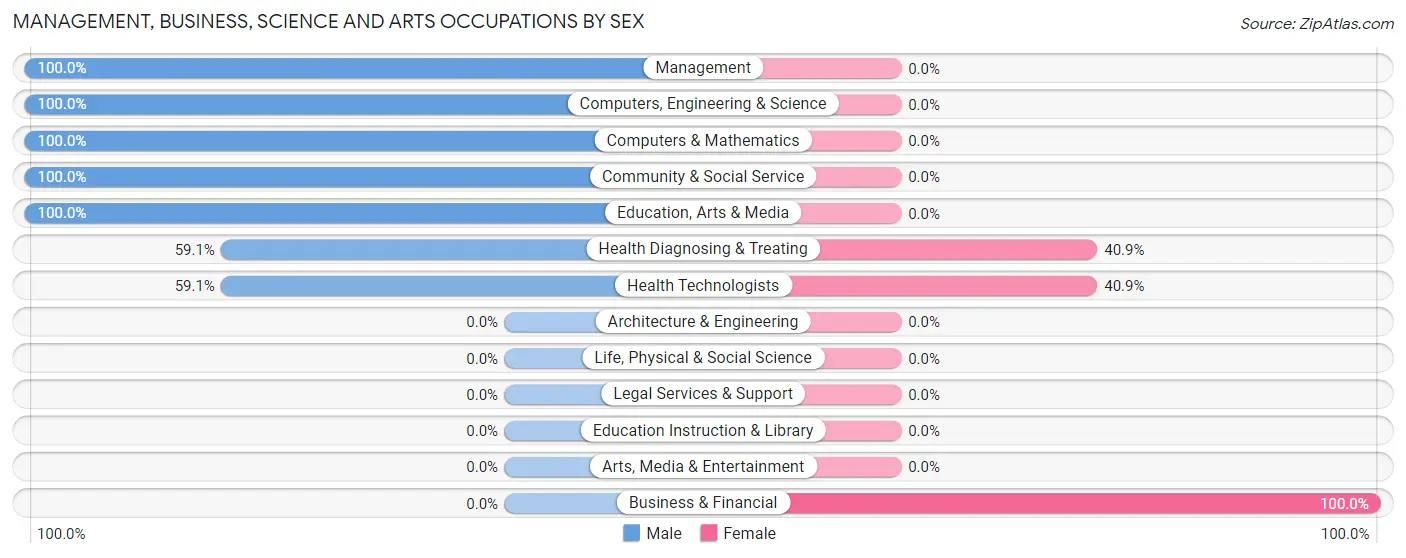
| Occupation | Male | Female |
| Management | 39 (100.0%) | 0 (0.0%) |
| Business & Financial | 0 (0.0%) | 12 (100.0%) |
| Computers, Engineering & Science | 26 (100.0%) | 0 (0.0%) |
| Computers & Mathematics | 26 (100.0%) | 0 (0.0%) |
| Architecture & Engineering | 0 (0.0%) | 0 (0.0%) |
| Life, Physical & Social Science | 0 (0.0%) | 0 (0.0%) |
| Community & Social Service | 13 (100.0%) | 0 (0.0%) |
| Education, Arts & Media | 13 (100.0%) | 0 (0.0%) |
| Legal Services & Support | 0 (0.0%) | 0 (0.0%) |
| Education Instruction & Library | 0 (0.0%) | 0 (0.0%) |
| Arts, Media & Entertainment | 0 (0.0%) | 0 (0.0%) |
| Health Diagnosing & Treating | 26 (59.1%) | 18 (40.9%) |
| Health Technologists | 26 (59.1%) | 18 (40.9%) |
| Total (Category) | 104 (77.6%) | 30 (22.4%) |
| Total (Overall) | 926 (73.0%) | 342 (27.0%) |
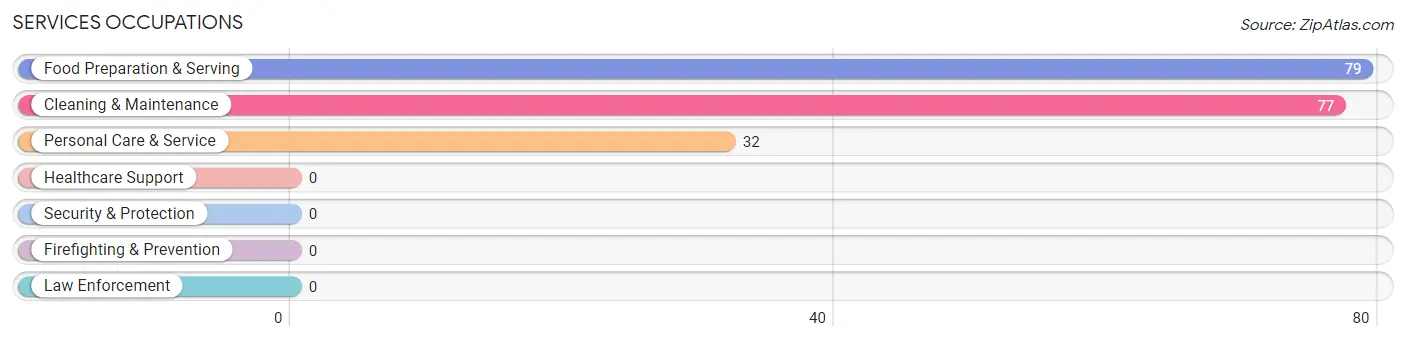
Services Occupations
The most common Services occupations in Doolittle are Food Preparation & Serving (79 | 6.2%), Cleaning & Maintenance (77 | 6.1%), and Personal Care & Service (32 | 2.5%).
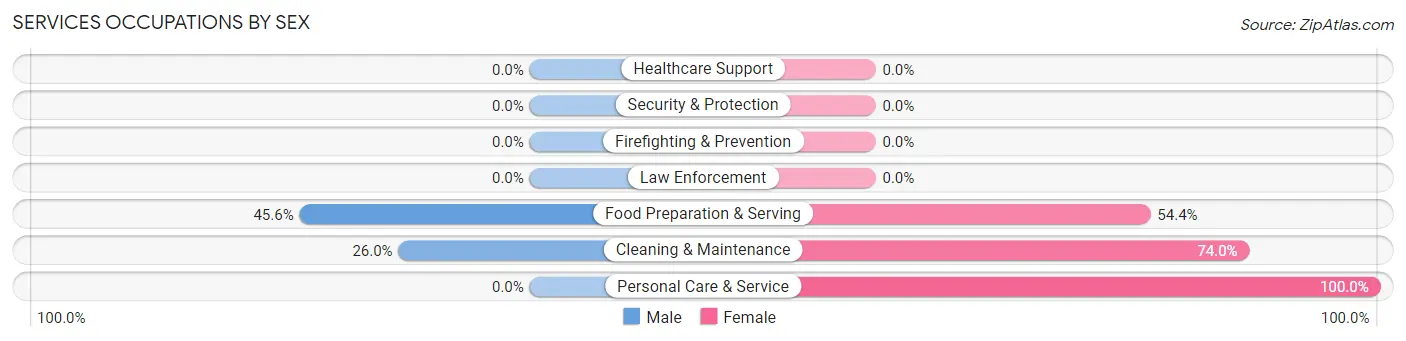
Services Occupations by Sex
Within the Services occupations in Doolittle, the most male-oriented occupations are Food Preparation & Serving (45.6%), and Cleaning & Maintenance (26.0%), while the most female-oriented occupations are Personal Care & Service (100.0%), Cleaning & Maintenance (74.0%), and Food Preparation & Serving (54.4%).
| Occupation | Male | Female |
| Healthcare Support | 0 (0.0%) | 0 (0.0%) |
| Security & Protection | 0 (0.0%) | 0 (0.0%) |
| Firefighting & Prevention | 0 (0.0%) | 0 (0.0%) |
| Law Enforcement | 0 (0.0%) | 0 (0.0%) |
| Food Preparation & Serving | 36 (45.6%) | 43 (54.4%) |
| Cleaning & Maintenance | 20 (26.0%) | 57 (74.0%) |
| Personal Care & Service | 0 (0.0%) | 32 (100.0%) |
| Total (Category) | 56 (29.8%) | 132 (70.2%) |
| Total (Overall) | 926 (73.0%) | 342 (27.0%) |
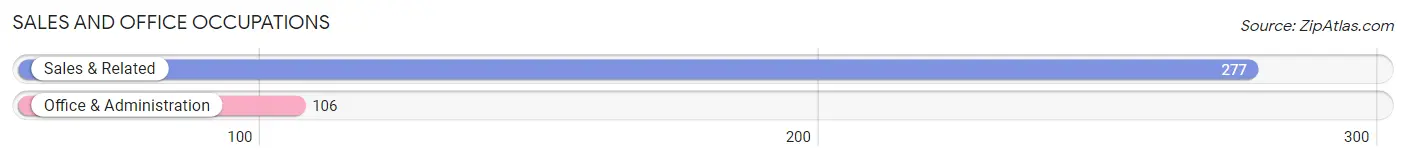
Sales and Office Occupations
The most common Sales and Office occupations in Doolittle are Sales & Related (277 | 21.8%), and Office & Administration (106 | 8.4%).
Sales and Office Occupations by Sex
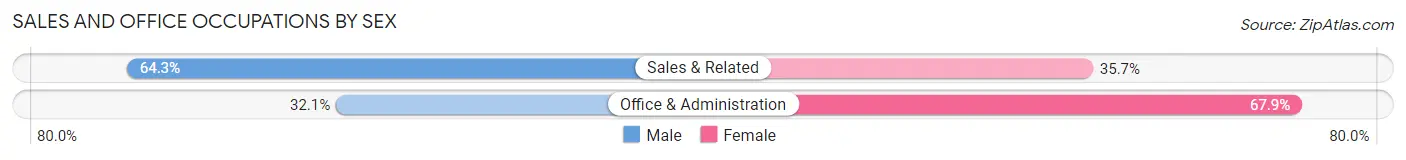
| Occupation | Male | Female |
| Sales & Related | 178 (64.3%) | 99 (35.7%) |
| Office & Administration | 34 (32.1%) | 72 (67.9%) |
| Total (Category) | 212 (55.3%) | 171 (44.7%) |
| Total (Overall) | 926 (73.0%) | 342 (27.0%) |
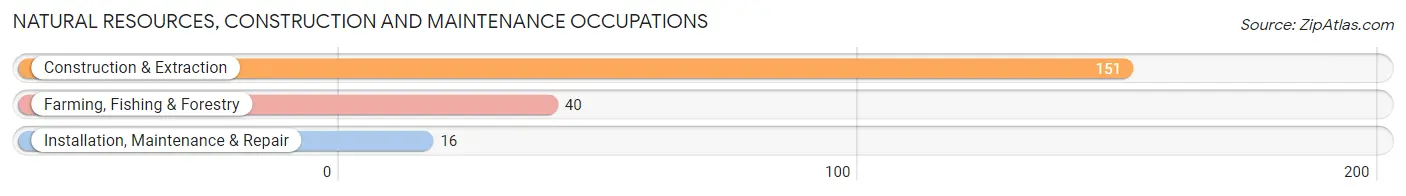
Natural Resources, Construction and Maintenance Occupations
The most common Natural Resources, Construction and Maintenance occupations in Doolittle are Construction & Extraction (151 | 11.9%), Farming, Fishing & Forestry (40 | 3.2%), and Installation, Maintenance & Repair (16 | 1.3%).
Natural Resources, Construction and Maintenance Occupations by Sex
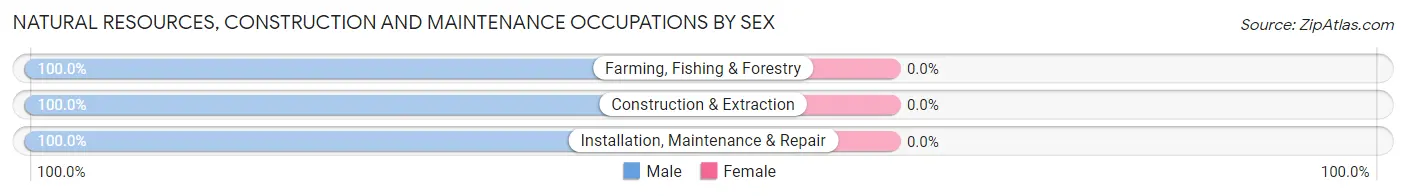
| Occupation | Male | Female |
| Farming, Fishing & Forestry | 40 (100.0%) | 0 (0.0%) |
| Construction & Extraction | 151 (100.0%) | 0 (0.0%) |
| Installation, Maintenance & Repair | 16 (100.0%) | 0 (0.0%) |
| Total (Category) | 207 (100.0%) | 0 (0.0%) |
| Total (Overall) | 926 (73.0%) | 342 (27.0%) |
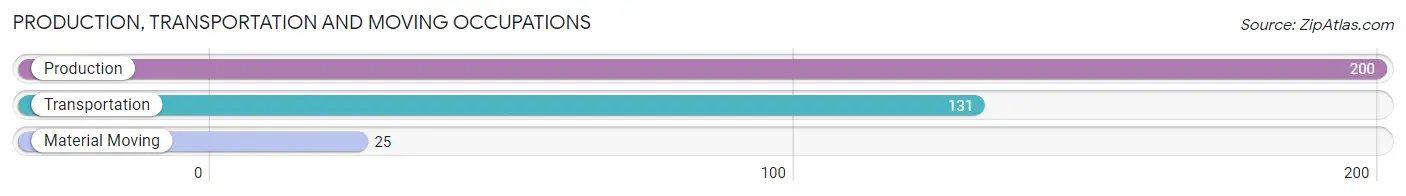
Production, Transportation and Moving Occupations
The most common Production, Transportation and Moving occupations in Doolittle are Production (200 | 15.8%), Transportation (131 | 10.3%), and Material Moving (25 | 2.0%).
Production, Transportation and Moving Occupations by Sex
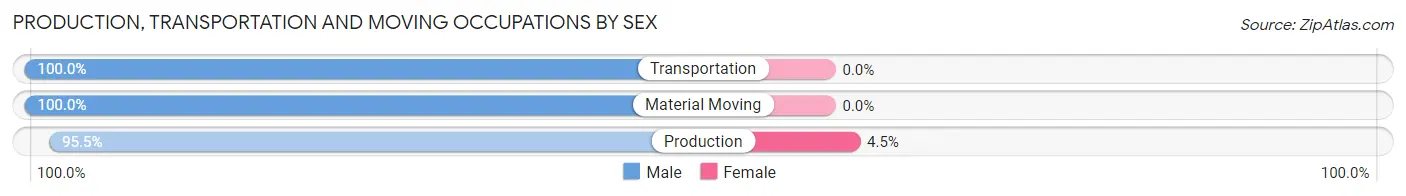
| Occupation | Male | Female |
| Production | 191 (95.5%) | 9 (4.5%) |
| Transportation | 131 (100.0%) | 0 (0.0%) |
| Material Moving | 25 (100.0%) | 0 (0.0%) |
| Total (Category) | 347 (97.5%) | 9 (2.5%) |
| Total (Overall) | 926 (73.0%) | 342 (27.0%) |
Employment Industries by Sex in Doolittle
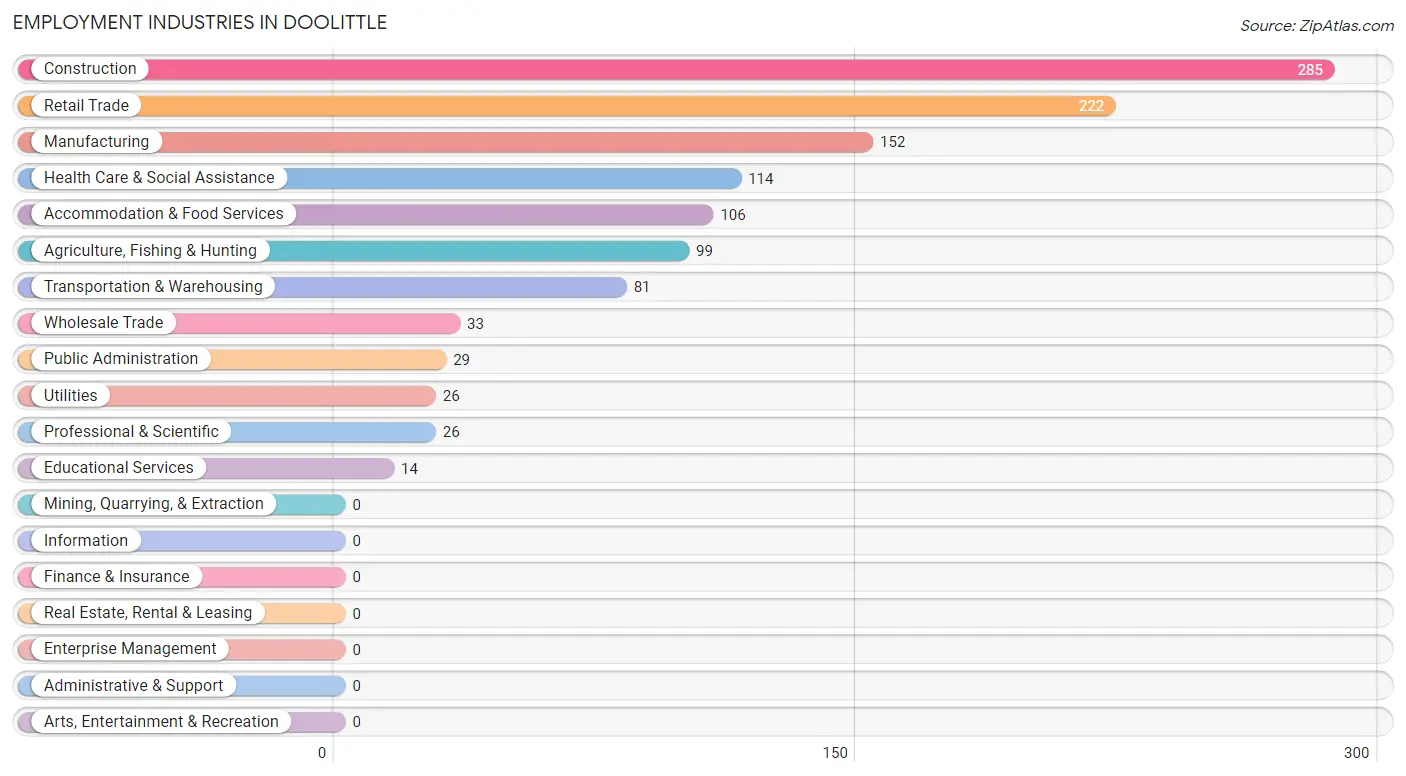
Employment Industries in Doolittle
The major employment industries in Doolittle include Construction (285 | 22.5%), Retail Trade (222 | 17.5%), Manufacturing (152 | 12.0%), Health Care & Social Assistance (114 | 9.0%), and Accommodation & Food Services (106 | 8.4%).
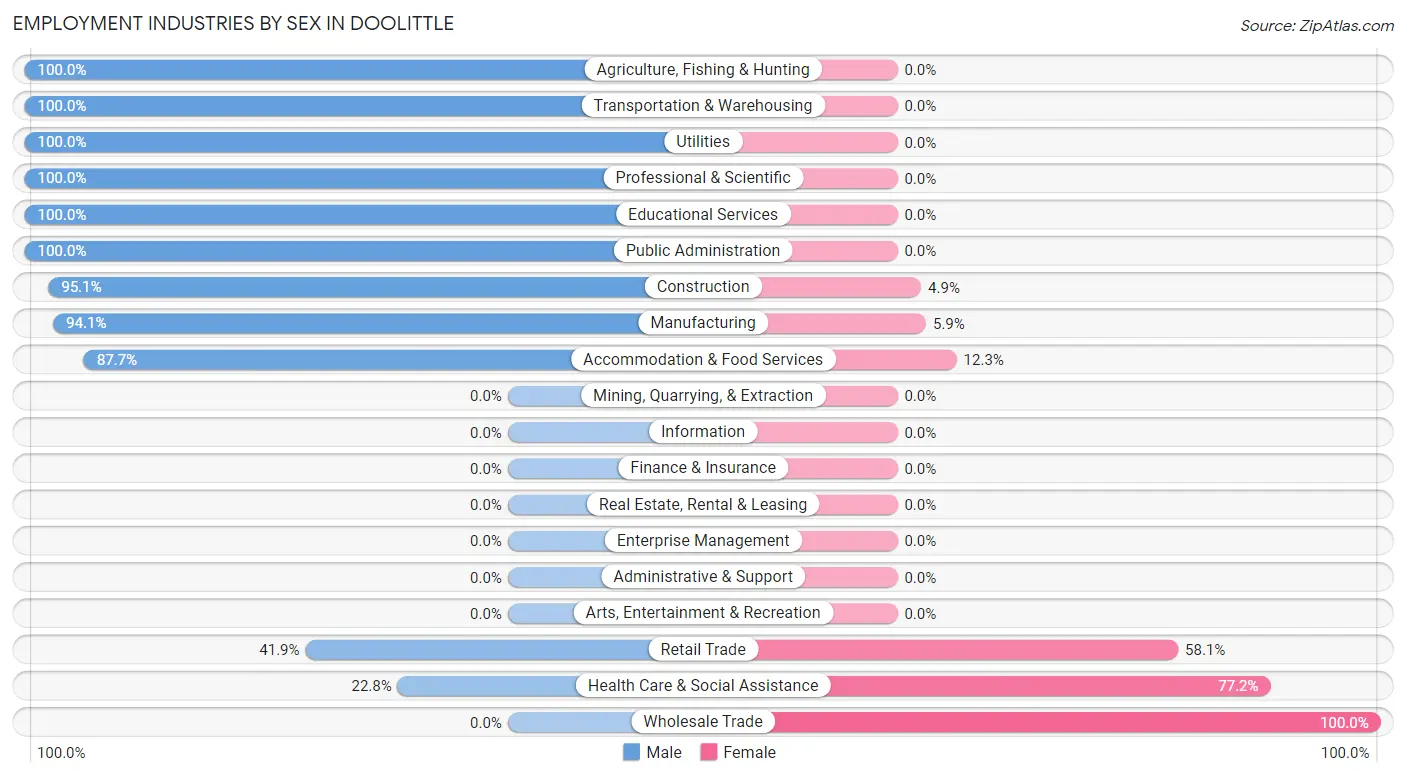
Employment Industries by Sex in Doolittle
The Doolittle industries that see more men than women are Agriculture, Fishing & Hunting (100.0%), Transportation & Warehousing (100.0%), and Utilities (100.0%), whereas the industries that tend to have a higher number of women are Wholesale Trade (100.0%), Health Care & Social Assistance (77.2%), and Retail Trade (58.1%).
| Industry | Male | Female |
| Agriculture, Fishing & Hunting | 99 (100.0%) | 0 (0.0%) |
| Mining, Quarrying, & Extraction | 0 (0.0%) | 0 (0.0%) |
| Construction | 271 (95.1%) | 14 (4.9%) |
| Manufacturing | 143 (94.1%) | 9 (5.9%) |
| Wholesale Trade | 0 (0.0%) | 33 (100.0%) |
| Retail Trade | 93 (41.9%) | 129 (58.1%) |
| Transportation & Warehousing | 81 (100.0%) | 0 (0.0%) |
| Utilities | 26 (100.0%) | 0 (0.0%) |
| Information | 0 (0.0%) | 0 (0.0%) |
| Finance & Insurance | 0 (0.0%) | 0 (0.0%) |
| Real Estate, Rental & Leasing | 0 (0.0%) | 0 (0.0%) |
| Professional & Scientific | 26 (100.0%) | 0 (0.0%) |
| Enterprise Management | 0 (0.0%) | 0 (0.0%) |
| Administrative & Support | 0 (0.0%) | 0 (0.0%) |
| Educational Services | 14 (100.0%) | 0 (0.0%) |
| Health Care & Social Assistance | 26 (22.8%) | 88 (77.2%) |
| Arts, Entertainment & Recreation | 0 (0.0%) | 0 (0.0%) |
| Accommodation & Food Services | 93 (87.7%) | 13 (12.3%) |
| Public Administration | 29 (100.0%) | 0 (0.0%) |
| Total | 926 (73.0%) | 342 (27.0%) |
Education in Doolittle
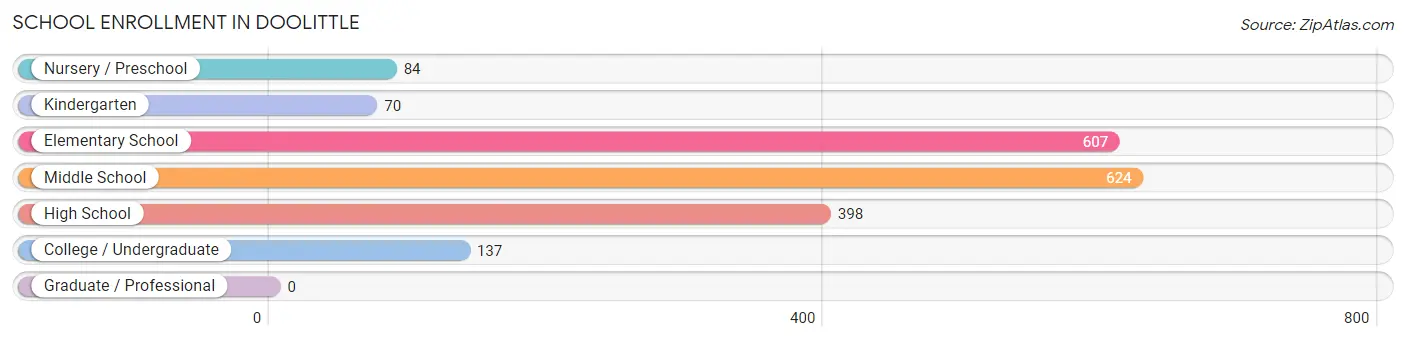
School Enrollment in Doolittle
The most common levels of schooling among the 1,920 students in Doolittle are middle school (624 | 32.5%), elementary school (607 | 31.6%), and high school (398 | 20.7%).
| School Level | # Students | % Students |
| Nursery / Preschool | 84 | 4.4% |
| Kindergarten | 70 | 3.6% |
| Elementary School | 607 | 31.6% |
| Middle School | 624 | 32.5% |
| High School | 398 | 20.7% |
| College / Undergraduate | 137 | 7.1% |
| Graduate / Professional | 0 | 0.0% |
| Total | 1,920 | 100.0% |
School Enrollment by Age by Funding Source in Doolittle
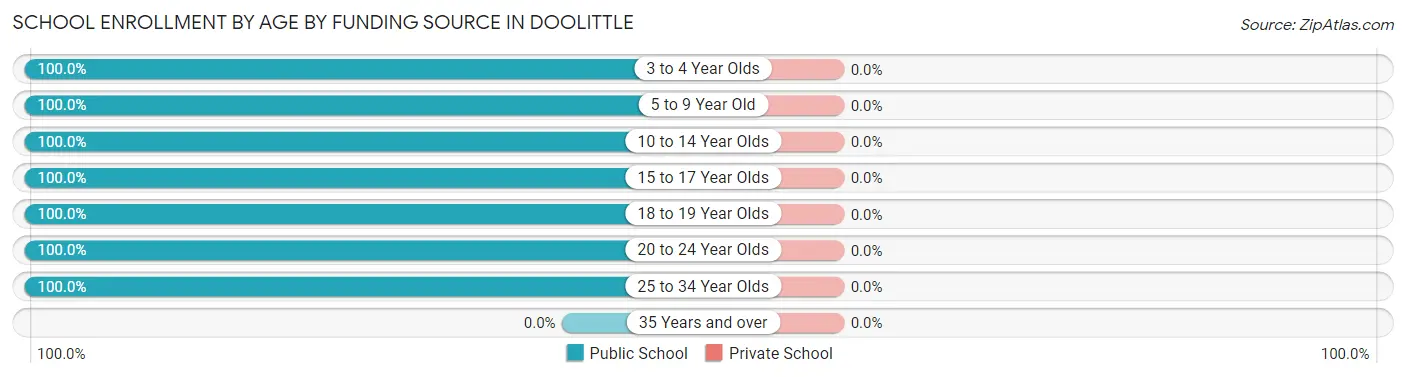
| Age Bracket | Public School | Private School |
| 3 to 4 Year Olds | 84 (100.0%) | 0 (0.0%) |
| 5 to 9 Year Old | 677 (100.0%) | 0 (0.0%) |
| 10 to 14 Year Olds | 624 (100.0%) | 0 (0.0%) |
| 15 to 17 Year Olds | 232 (100.0%) | 0 (0.0%) |
| 18 to 19 Year Olds | 98 (100.0%) | 0 (0.0%) |
| 20 to 24 Year Olds | 82 (100.0%) | 0 (0.0%) |
| 25 to 34 Year Olds | 123 (100.0%) | 0 (0.0%) |
| 35 Years and over | 0 (0.0%) | 0 (0.0%) |
| Total | 1,920 (100.0%) | 0 (0.0%) |
Educational Attainment by Field of Study in Doolittle
Education (67 | 68.4%), business (18 | 18.4%), and arts & humanities (13 | 13.3%) are the most common fields of study among 98 individuals in Doolittle who have obtained a bachelor's degree or higher.
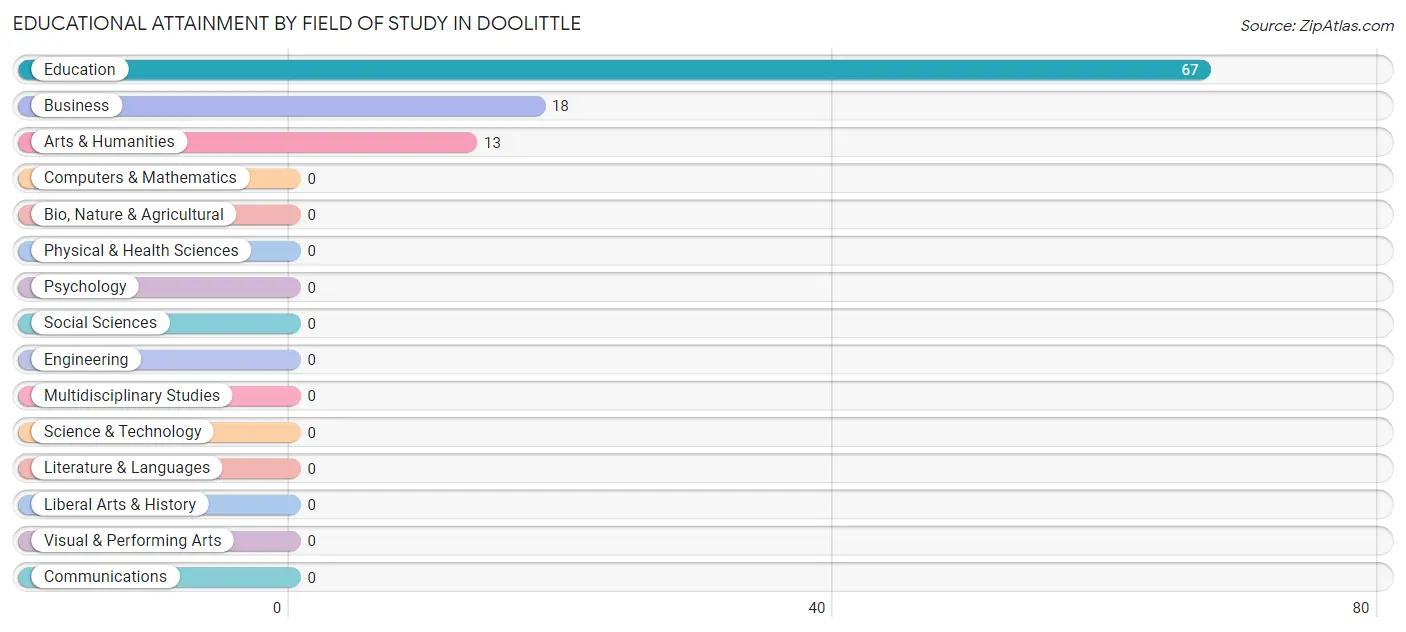
| Field of Study | # Graduates | % Graduates |
| Computers & Mathematics | 0 | 0.0% |
| Bio, Nature & Agricultural | 0 | 0.0% |
| Physical & Health Sciences | 0 | 0.0% |
| Psychology | 0 | 0.0% |
| Social Sciences | 0 | 0.0% |
| Engineering | 0 | 0.0% |
| Multidisciplinary Studies | 0 | 0.0% |
| Science & Technology | 0 | 0.0% |
| Business | 18 | 18.4% |
| Education | 67 | 68.4% |
| Literature & Languages | 0 | 0.0% |
| Liberal Arts & History | 0 | 0.0% |
| Visual & Performing Arts | 0 | 0.0% |
| Communications | 0 | 0.0% |
| Arts & Humanities | 13 | 13.3% |
| Total | 98 | 100.0% |
Transportation & Commute in Doolittle
Vehicle Availability by Sex in Doolittle
The most prevalent vehicle ownership categories in Doolittle are males with 3 vehicles (410, accounting for 44.3%) and females with 3 vehicles (41, making up 119.9%).
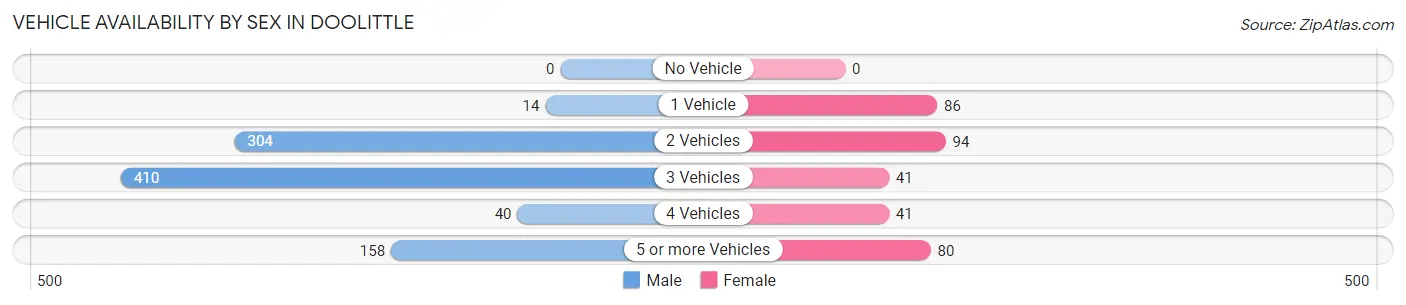
| Vehicles Available | Male | Female |
| No Vehicle | 0 (0.0%) | 0 (0.0%) |
| 1 Vehicle | 14 (1.5%) | 86 (25.2%) |
| 2 Vehicles | 304 (32.8%) | 94 (27.5%) |
| 3 Vehicles | 410 (44.3%) | 41 (12.0%) |
| 4 Vehicles | 40 (4.3%) | 41 (12.0%) |
| 5 or more Vehicles | 158 (17.1%) | 80 (23.4%) |
| Total | 926 (100.0%) | 342 (100.0%) |
Commute Time in Doolittle
The most frequently occuring commute durations in Doolittle are 20 to 24 minutes (243 commuters, 20.9%), 25 to 29 minutes (219 commuters, 18.8%), and 5 to 9 minutes (169 commuters, 14.5%).
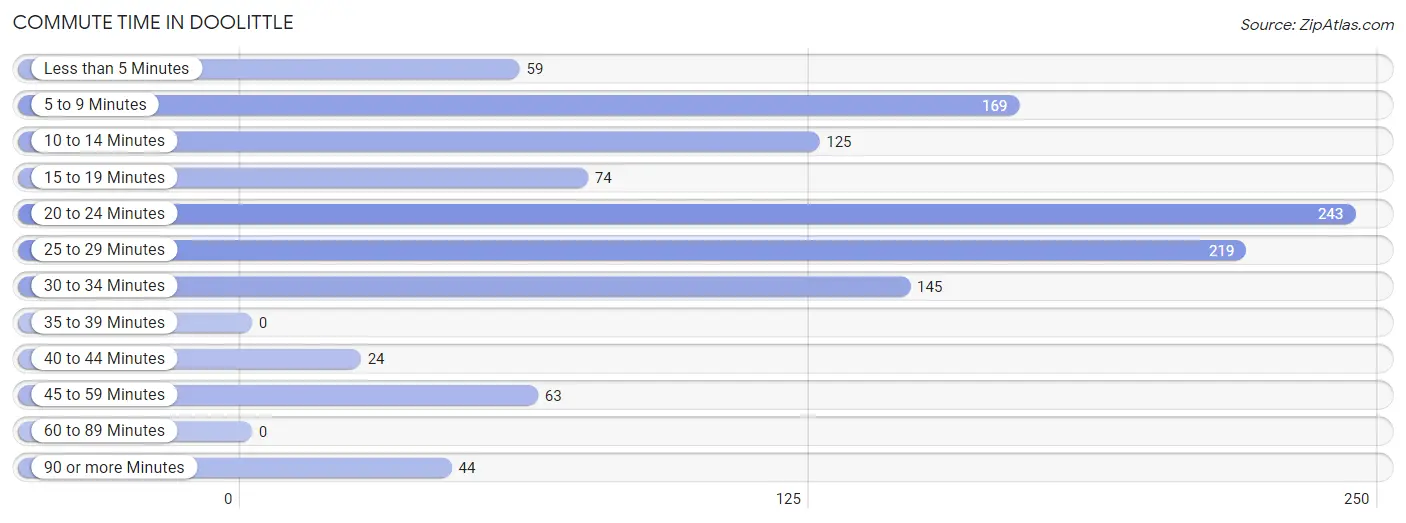
| Commute Time | # Commuters | % Commuters |
| Less than 5 Minutes | 59 | 5.1% |
| 5 to 9 Minutes | 169 | 14.5% |
| 10 to 14 Minutes | 125 | 10.7% |
| 15 to 19 Minutes | 74 | 6.4% |
| 20 to 24 Minutes | 243 | 20.9% |
| 25 to 29 Minutes | 219 | 18.8% |
| 30 to 34 Minutes | 145 | 12.4% |
| 35 to 39 Minutes | 0 | 0.0% |
| 40 to 44 Minutes | 24 | 2.1% |
| 45 to 59 Minutes | 63 | 5.4% |
| 60 to 89 Minutes | 0 | 0.0% |
| 90 or more Minutes | 44 | 3.8% |
Commute Time by Sex in Doolittle
The most common commute times in Doolittle are 20 to 24 minutes (162 commuters, 18.6%) for males and 20 to 24 minutes (81 commuters, 27.6%) for females.
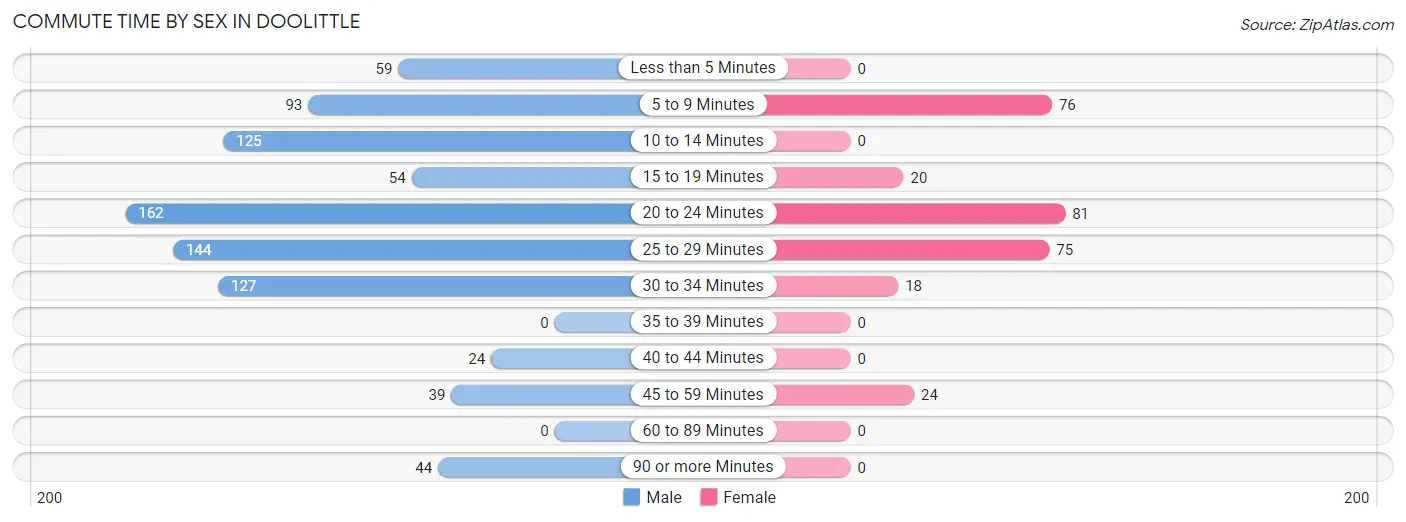
| Commute Time | Male | Female |
| Less than 5 Minutes | 59 (6.8%) | 0 (0.0%) |
| 5 to 9 Minutes | 93 (10.7%) | 76 (25.9%) |
| 10 to 14 Minutes | 125 (14.3%) | 0 (0.0%) |
| 15 to 19 Minutes | 54 (6.2%) | 20 (6.8%) |
| 20 to 24 Minutes | 162 (18.6%) | 81 (27.6%) |
| 25 to 29 Minutes | 144 (16.5%) | 75 (25.5%) |
| 30 to 34 Minutes | 127 (14.6%) | 18 (6.1%) |
| 35 to 39 Minutes | 0 (0.0%) | 0 (0.0%) |
| 40 to 44 Minutes | 24 (2.8%) | 0 (0.0%) |
| 45 to 59 Minutes | 39 (4.5%) | 24 (8.2%) |
| 60 to 89 Minutes | 0 (0.0%) | 0 (0.0%) |
| 90 or more Minutes | 44 (5.1%) | 0 (0.0%) |
Time of Departure to Work by Sex in Doolittle
The most frequent times of departure to work in Doolittle are 6:00 AM to 6:29 AM (240, 27.6%) for males and 7:30 AM to 7:59 AM (150, 51.0%) for females.
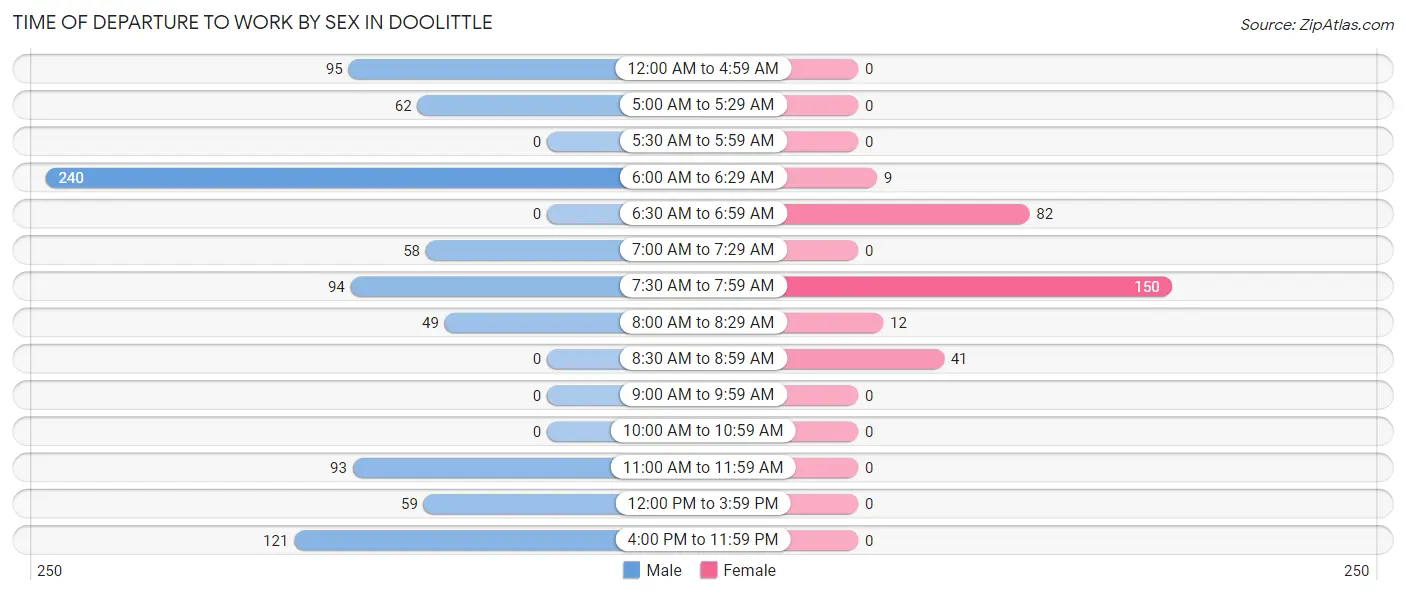
| Time of Departure | Male | Female |
| 12:00 AM to 4:59 AM | 95 (10.9%) | 0 (0.0%) |
| 5:00 AM to 5:29 AM | 62 (7.1%) | 0 (0.0%) |
| 5:30 AM to 5:59 AM | 0 (0.0%) | 0 (0.0%) |
| 6:00 AM to 6:29 AM | 240 (27.6%) | 9 (3.1%) |
| 6:30 AM to 6:59 AM | 0 (0.0%) | 82 (27.9%) |
| 7:00 AM to 7:29 AM | 58 (6.7%) | 0 (0.0%) |
| 7:30 AM to 7:59 AM | 94 (10.8%) | 150 (51.0%) |
| 8:00 AM to 8:29 AM | 49 (5.6%) | 12 (4.1%) |
| 8:30 AM to 8:59 AM | 0 (0.0%) | 41 (14.0%) |
| 9:00 AM to 9:59 AM | 0 (0.0%) | 0 (0.0%) |
| 10:00 AM to 10:59 AM | 0 (0.0%) | 0 (0.0%) |
| 11:00 AM to 11:59 AM | 93 (10.7%) | 0 (0.0%) |
| 12:00 PM to 3:59 PM | 59 (6.8%) | 0 (0.0%) |
| 4:00 PM to 11:59 PM | 121 (13.9%) | 0 (0.0%) |
| Total | 871 (100.0%) | 294 (100.0%) |
Housing Occupancy in Doolittle
Occupancy by Ownership in Doolittle
Of the total 1,482 dwellings in Doolittle, owner-occupied units account for 1,294 (87.3%), while renter-occupied units make up 188 (12.7%).
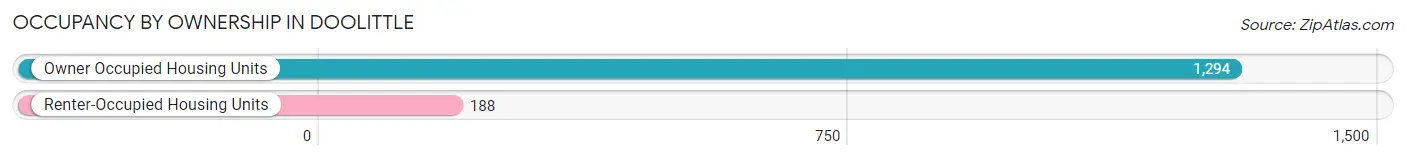
| Occupancy | # Housing Units | % Housing Units |
| Owner Occupied Housing Units | 1,294 | 87.3% |
| Renter-Occupied Housing Units | 188 | 12.7% |
| Total Occupied Housing Units | 1,482 | 100.0% |
Occupancy by Household Size in Doolittle
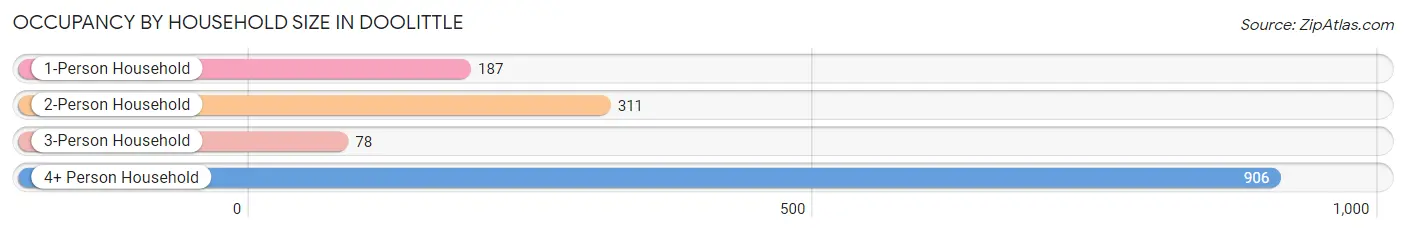
| Household Size | # Housing Units | % Housing Units |
| 1-Person Household | 187 | 12.6% |
| 2-Person Household | 311 | 21.0% |
| 3-Person Household | 78 | 5.3% |
| 4+ Person Household | 906 | 61.1% |
| Total Housing Units | 1,482 | 100.0% |
Occupancy by Ownership by Household Size in Doolittle
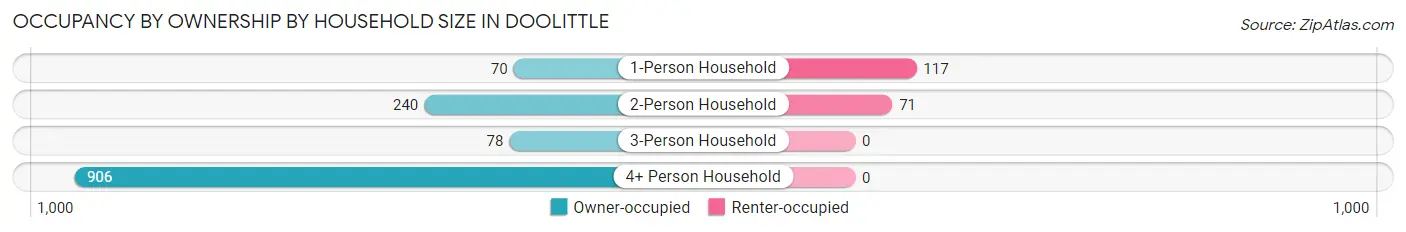
| Household Size | Owner-occupied | Renter-occupied |
| 1-Person Household | 70 (37.4%) | 117 (62.6%) |
| 2-Person Household | 240 (77.2%) | 71 (22.8%) |
| 3-Person Household | 78 (100.0%) | 0 (0.0%) |
| 4+ Person Household | 906 (100.0%) | 0 (0.0%) |
| Total Housing Units | 1,294 (87.3%) | 188 (12.7%) |
Occupancy by Educational Attainment in Doolittle
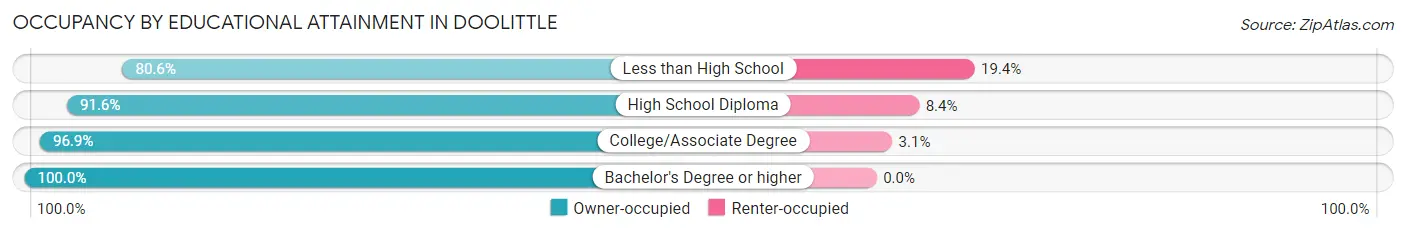
| Household Size | Owner-occupied | Renter-occupied |
| Less than High School | 585 (80.6%) | 141 (19.4%) |
| High School Diploma | 412 (91.6%) | 38 (8.4%) |
| College/Associate Degree | 284 (96.9%) | 9 (3.1%) |
| Bachelor's Degree or higher | 13 (100.0%) | 0 (0.0%) |
Occupancy by Age of Householder in Doolittle
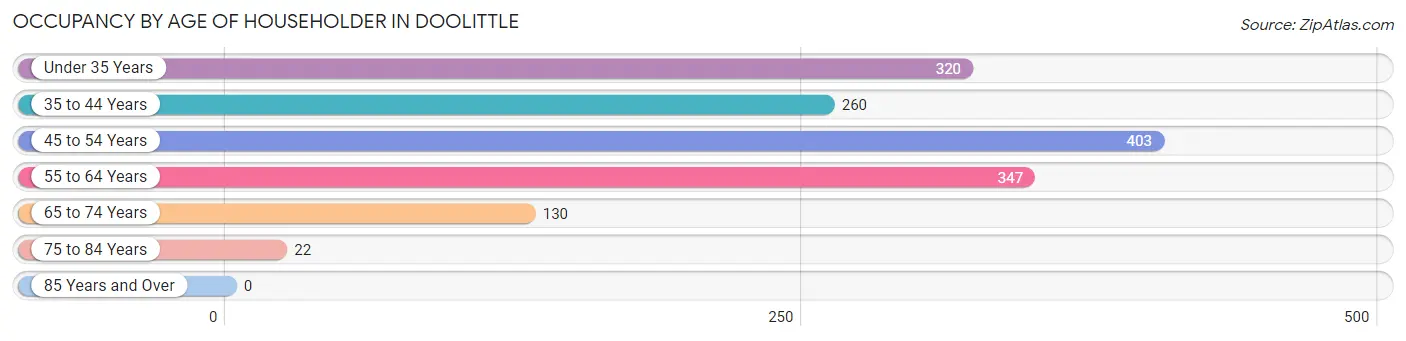
| Age Bracket | # Households | % Households |
| Under 35 Years | 320 | 21.6% |
| 35 to 44 Years | 260 | 17.5% |
| 45 to 54 Years | 403 | 27.2% |
| 55 to 64 Years | 347 | 23.4% |
| 65 to 74 Years | 130 | 8.8% |
| 75 to 84 Years | 22 | 1.5% |
| 85 Years and Over | 0 | 0.0% |
| Total | 1,482 | 100.0% |
Housing Finances in Doolittle
Median Income by Occupancy in Doolittle
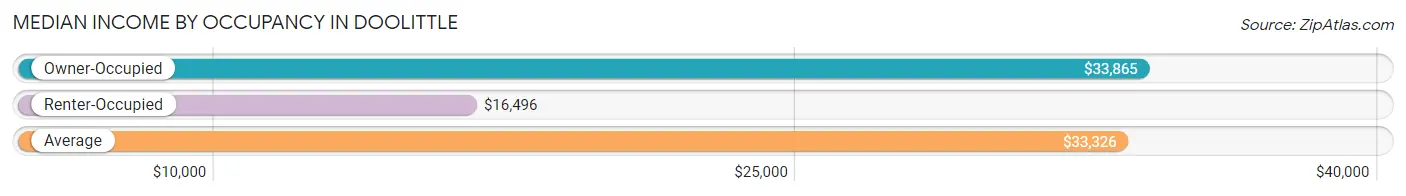
| Occupancy Type | # Households | Median Income |
| Owner-Occupied | 1,294 (87.3%) | $33,865 |
| Renter-Occupied | 188 (12.7%) | $16,496 |
| Average | 1,482 (100.0%) | $33,326 |
Occupancy by Householder Income Bracket in Doolittle
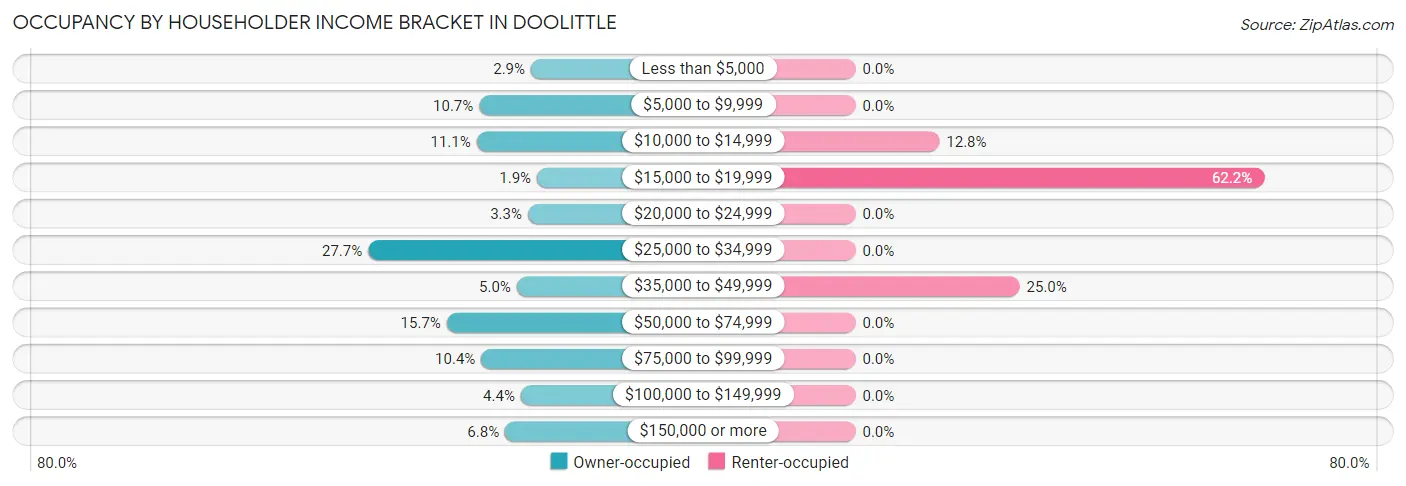
| Income Bracket | Owner-occupied | Renter-occupied |
| Less than $5,000 | 37 (2.9%) | 0 (0.0%) |
| $5,000 to $9,999 | 139 (10.7%) | 0 (0.0%) |
| $10,000 to $14,999 | 144 (11.1%) | 24 (12.8%) |
| $15,000 to $19,999 | 25 (1.9%) | 117 (62.2%) |
| $20,000 to $24,999 | 43 (3.3%) | 0 (0.0%) |
| $25,000 to $34,999 | 358 (27.7%) | 0 (0.0%) |
| $35,000 to $49,999 | 65 (5.0%) | 47 (25.0%) |
| $50,000 to $74,999 | 203 (15.7%) | 0 (0.0%) |
| $75,000 to $99,999 | 135 (10.4%) | 0 (0.0%) |
| $100,000 to $149,999 | 57 (4.4%) | 0 (0.0%) |
| $150,000 or more | 88 (6.8%) | 0 (0.0%) |
| Total | 1,294 (100.0%) | 188 (100.0%) |
Monthly Housing Cost Tiers in Doolittle
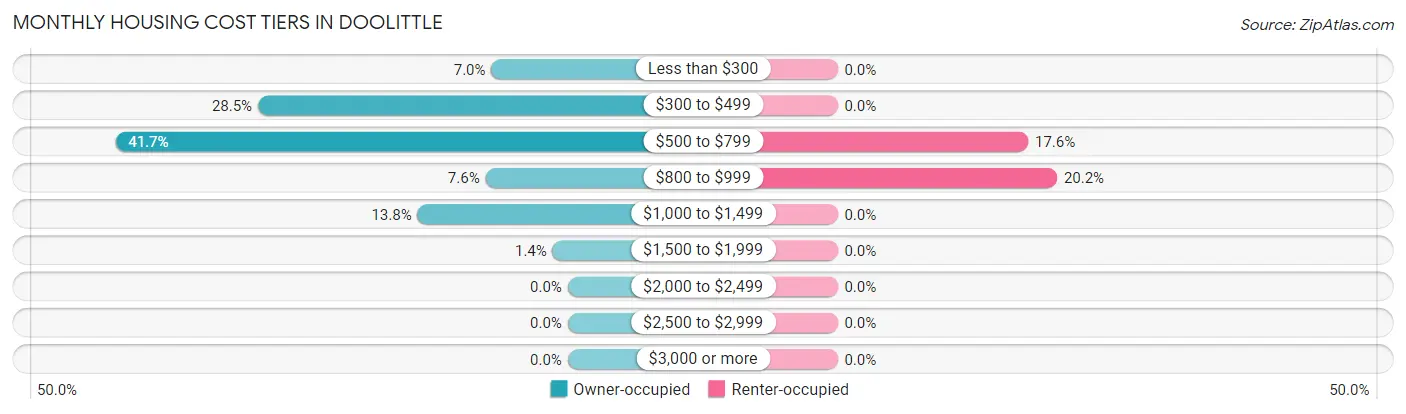
| Monthly Cost | Owner-occupied | Renter-occupied |
| Less than $300 | 91 (7.0%) | 0 (0.0%) |
| $300 to $499 | 369 (28.5%) | 0 (0.0%) |
| $500 to $799 | 539 (41.6%) | 33 (17.5%) |
| $800 to $999 | 98 (7.6%) | 38 (20.2%) |
| $1,000 to $1,499 | 179 (13.8%) | 0 (0.0%) |
| $1,500 to $1,999 | 18 (1.4%) | 0 (0.0%) |
| $2,000 to $2,499 | 0 (0.0%) | 0 (0.0%) |
| $2,500 to $2,999 | 0 (0.0%) | 0 (0.0%) |
| $3,000 or more | 0 (0.0%) | 0 (0.0%) |
| Total | 1,294 (100.0%) | 188 (100.0%) |
Physical Housing Characteristics in Doolittle
Housing Structures in Doolittle
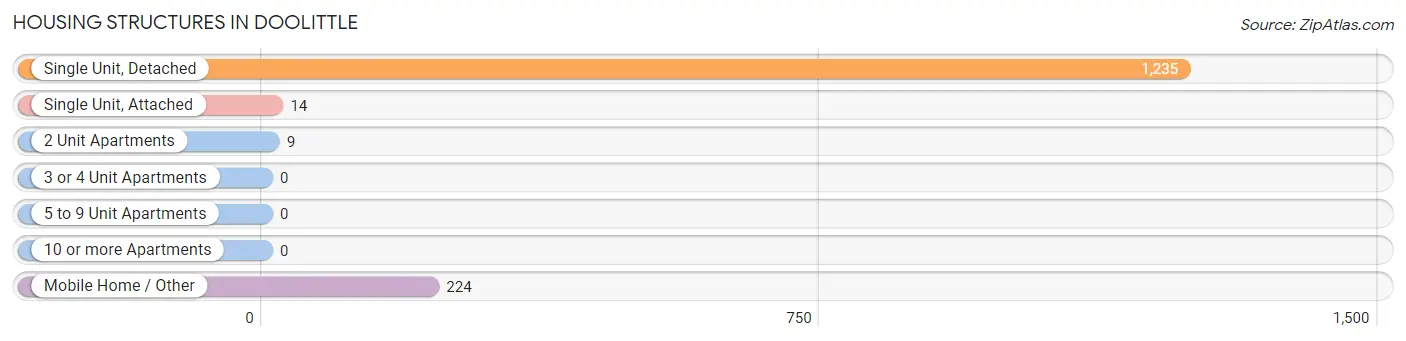
| Structure Type | # Housing Units | % Housing Units |
| Single Unit, Detached | 1,235 | 83.3% |
| Single Unit, Attached | 14 | 0.9% |
| 2 Unit Apartments | 9 | 0.6% |
| 3 or 4 Unit Apartments | 0 | 0.0% |
| 5 to 9 Unit Apartments | 0 | 0.0% |
| 10 or more Apartments | 0 | 0.0% |
| Mobile Home / Other | 224 | 15.1% |
| Total | 1,482 | 100.0% |
Housing Structures by Occupancy in Doolittle
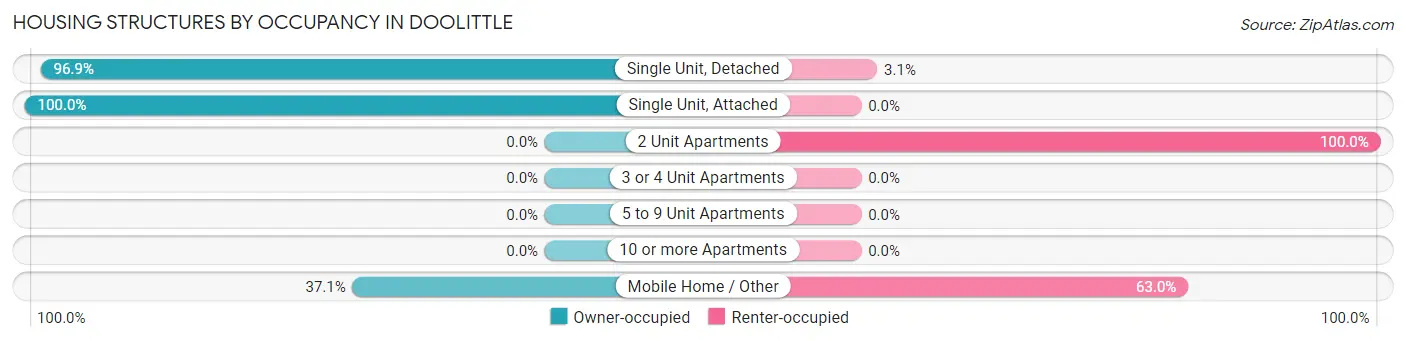
| Structure Type | Owner-occupied | Renter-occupied |
| Single Unit, Detached | 1,197 (96.9%) | 38 (3.1%) |
| Single Unit, Attached | 14 (100.0%) | 0 (0.0%) |
| 2 Unit Apartments | 0 (0.0%) | 9 (100.0%) |
| 3 or 4 Unit Apartments | 0 (0.0%) | 0 (0.0%) |
| 5 to 9 Unit Apartments | 0 (0.0%) | 0 (0.0%) |
| 10 or more Apartments | 0 (0.0%) | 0 (0.0%) |
| Mobile Home / Other | 83 (37.0%) | 141 (62.9%) |
| Total | 1,294 (87.3%) | 188 (12.7%) |
Housing Structures by Number of Rooms in Doolittle
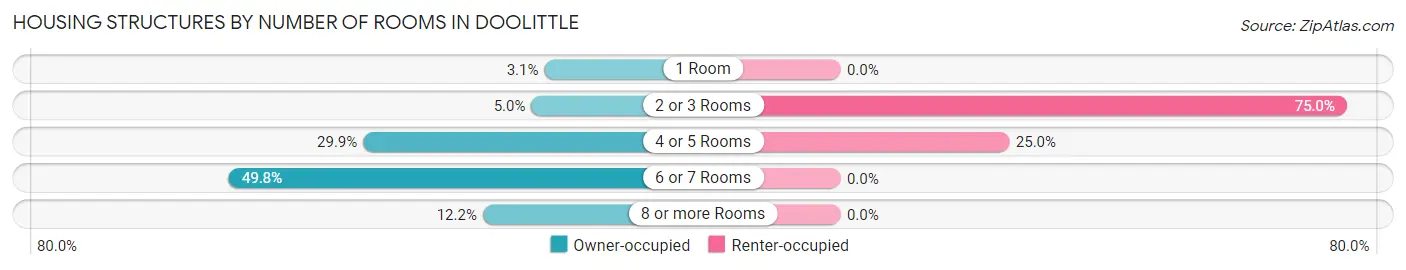
| Number of Rooms | Owner-occupied | Renter-occupied |
| 1 Room | 40 (3.1%) | 0 (0.0%) |
| 2 or 3 Rooms | 65 (5.0%) | 141 (75.0%) |
| 4 or 5 Rooms | 387 (29.9%) | 47 (25.0%) |
| 6 or 7 Rooms | 644 (49.8%) | 0 (0.0%) |
| 8 or more Rooms | 158 (12.2%) | 0 (0.0%) |
| Total | 1,294 (100.0%) | 188 (100.0%) |
Housing Structure by Heating Type in Doolittle
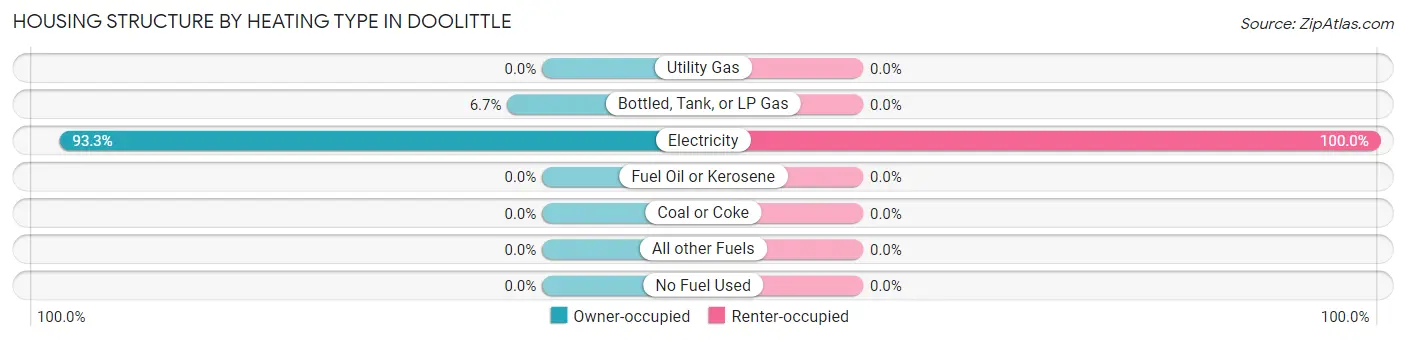
| Heating Type | Owner-occupied | Renter-occupied |
| Utility Gas | 0 (0.0%) | 0 (0.0%) |
| Bottled, Tank, or LP Gas | 87 (6.7%) | 0 (0.0%) |
| Electricity | 1,207 (93.3%) | 188 (100.0%) |
| Fuel Oil or Kerosene | 0 (0.0%) | 0 (0.0%) |
| Coal or Coke | 0 (0.0%) | 0 (0.0%) |
| All other Fuels | 0 (0.0%) | 0 (0.0%) |
| No Fuel Used | 0 (0.0%) | 0 (0.0%) |
| Total | 1,294 (100.0%) | 188 (100.0%) |
Household Vehicle Usage in Doolittle
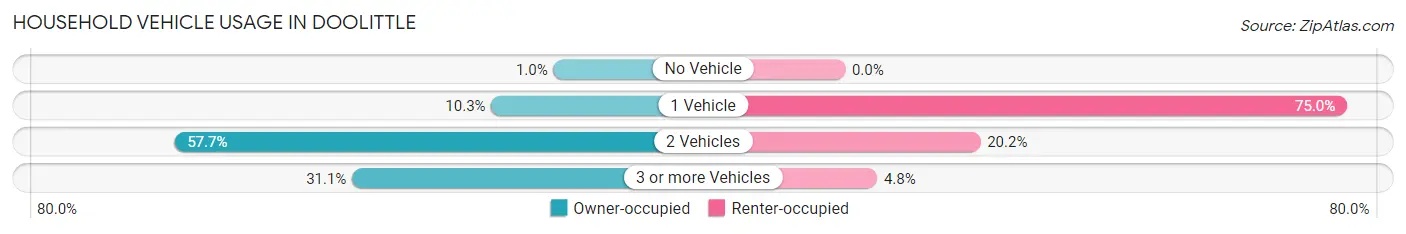
| Vehicles per Household | Owner-occupied | Renter-occupied |
| No Vehicle | 13 (1.0%) | 0 (0.0%) |
| 1 Vehicle | 133 (10.3%) | 141 (75.0%) |
| 2 Vehicles | 746 (57.7%) | 38 (20.2%) |
| 3 or more Vehicles | 402 (31.1%) | 9 (4.8%) |
| Total | 1,294 (100.0%) | 188 (100.0%) |
Real Estate & Mortgages in Doolittle
Real Estate and Mortgage Overview in Doolittle
| Characteristic | Without Mortgage | With Mortgage |
| Housing Units | 710 | 584 |
| Median Property Value | $83,500 | $58,400 |
| Median Household Income | $30,270 | $62 |
| Monthly Housing Costs | $435 | $0 |
| Real Estate Taxes | $1,158 | $0 |
Property Value by Mortgage Status in Doolittle
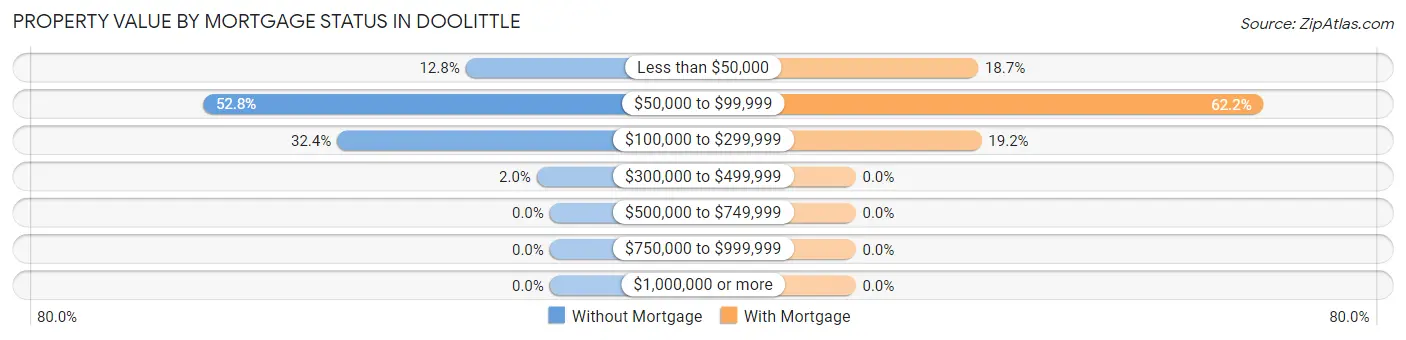
| Property Value | Without Mortgage | With Mortgage |
| Less than $50,000 | 91 (12.8%) | 109 (18.7%) |
| $50,000 to $99,999 | 375 (52.8%) | 363 (62.2%) |
| $100,000 to $299,999 | 230 (32.4%) | 112 (19.2%) |
| $300,000 to $499,999 | 14 (2.0%) | 0 (0.0%) |
| $500,000 to $749,999 | 0 (0.0%) | 0 (0.0%) |
| $750,000 to $999,999 | 0 (0.0%) | 0 (0.0%) |
| $1,000,000 or more | 0 (0.0%) | 0 (0.0%) |
| Total | 710 (100.0%) | 584 (100.0%) |
Household Income by Mortgage Status in Doolittle
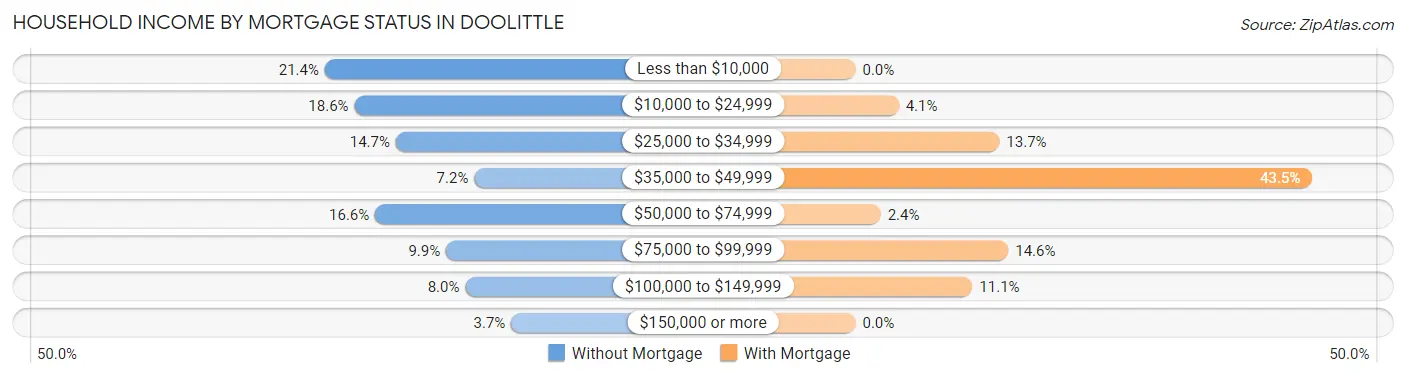
| Household Income | Without Mortgage | With Mortgage |
| Less than $10,000 | 152 (21.4%) | 0 (0.0%) |
| $10,000 to $24,999 | 132 (18.6%) | 24 (4.1%) |
| $25,000 to $34,999 | 104 (14.6%) | 80 (13.7%) |
| $35,000 to $49,999 | 51 (7.2%) | 254 (43.5%) |
| $50,000 to $74,999 | 118 (16.6%) | 14 (2.4%) |
| $75,000 to $99,999 | 70 (9.9%) | 85 (14.5%) |
| $100,000 to $149,999 | 57 (8.0%) | 65 (11.1%) |
| $150,000 or more | 26 (3.7%) | 0 (0.0%) |
| Total | 710 (100.0%) | 584 (100.0%) |
Property Value to Household Income Ratio in Doolittle
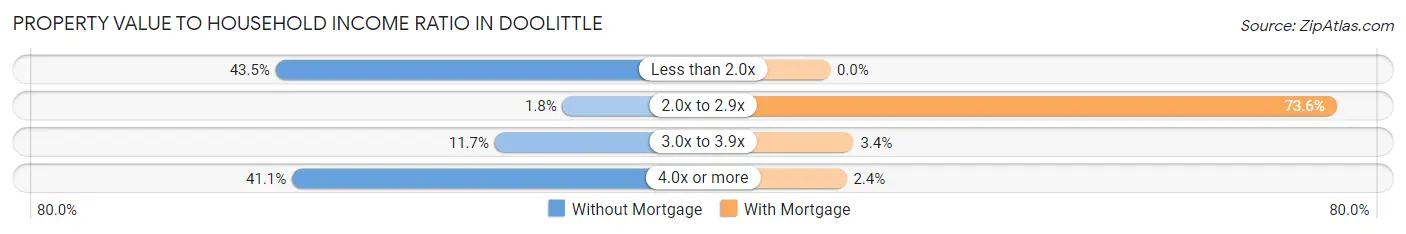
| Value-to-Income Ratio | Without Mortgage | With Mortgage |
| Less than 2.0x | 309 (43.5%) | 0 (0.0%) |
| 2.0x to 2.9x | 13 (1.8%) | 430 (73.6%) |
| 3.0x to 3.9x | 83 (11.7%) | 20 (3.4%) |
| 4.0x or more | 292 (41.1%) | 14 (2.4%) |
| Total | 710 (100.0%) | 584 (100.0%) |
Real Estate Taxes by Mortgage Status in Doolittle
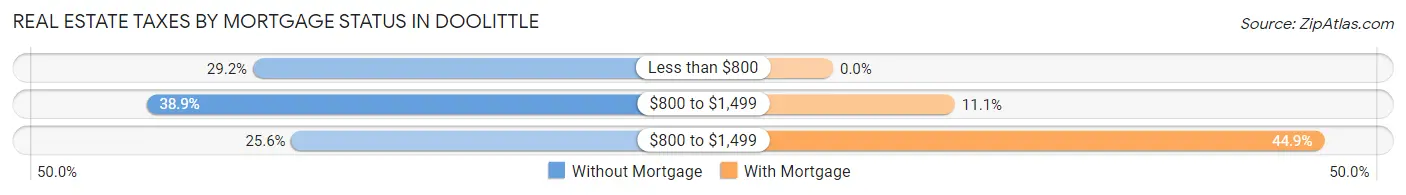
| Property Taxes | Without Mortgage | With Mortgage |
| Less than $800 | 207 (29.1%) | 0 (0.0%) |
| $800 to $1,499 | 276 (38.9%) | 65 (11.1%) |
| $800 to $1,499 | 182 (25.6%) | 262 (44.9%) |
| Total | 710 (100.0%) | 584 (100.0%) |
Health & Disability in Doolittle
Health Insurance Coverage by Age in Doolittle
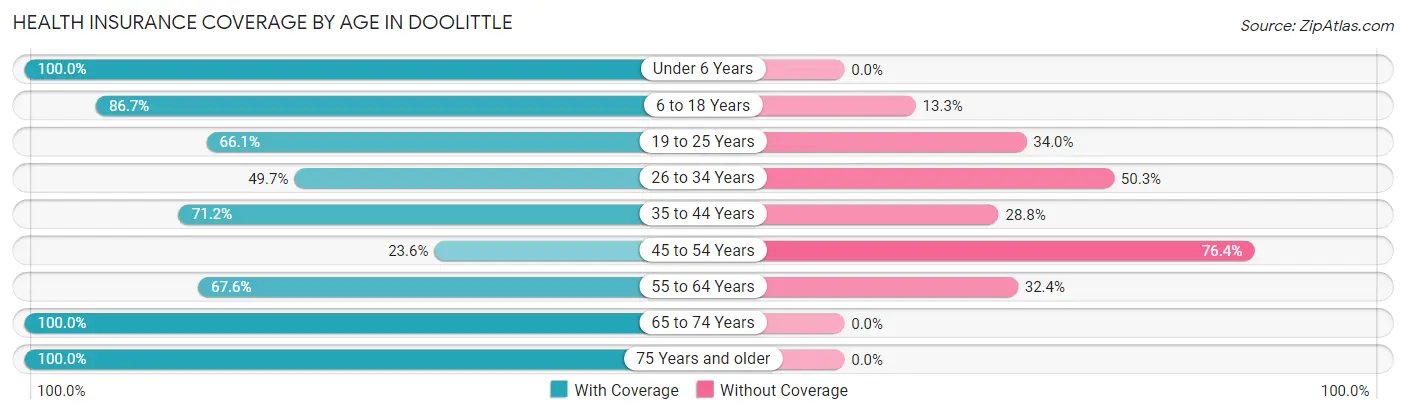
| Age Bracket | With Coverage | Without Coverage |
| Under 6 Years | 877 (100.0%) | 0 (0.0%) |
| 6 to 18 Years | 1,544 (86.7%) | 237 (13.3%) |
| 19 to 25 Years | 284 (66.0%) | 146 (34.0%) |
| 26 to 34 Years | 446 (49.7%) | 451 (50.3%) |
| 35 to 44 Years | 364 (71.2%) | 147 (28.8%) |
| 45 to 54 Years | 166 (23.6%) | 537 (76.4%) |
| 55 to 64 Years | 349 (67.6%) | 167 (32.4%) |
| 65 to 74 Years | 215 (100.0%) | 0 (0.0%) |
| 75 Years and older | 89 (100.0%) | 0 (0.0%) |
| Total | 4,334 (72.0%) | 1,685 (28.0%) |
Health Insurance Coverage by Citizenship Status in Doolittle
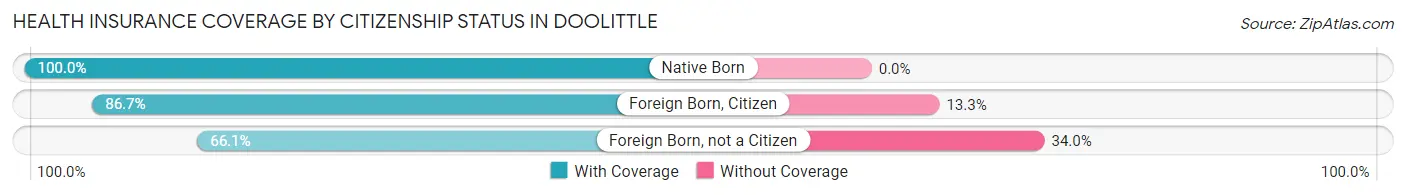
| Citizenship Status | With Coverage | Without Coverage |
| Native Born | 877 (100.0%) | 0 (0.0%) |
| Foreign Born, Citizen | 1,544 (86.7%) | 237 (13.3%) |
| Foreign Born, not a Citizen | 284 (66.0%) | 146 (34.0%) |
Health Insurance Coverage by Household Income in Doolittle
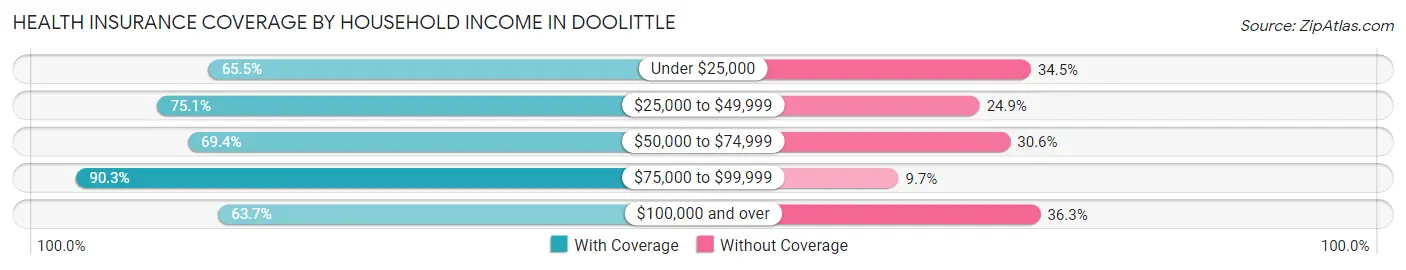
| Household Income | With Coverage | Without Coverage |
| Under $25,000 | 881 (65.5%) | 464 (34.5%) |
| $25,000 to $49,999 | 1,864 (75.1%) | 618 (24.9%) |
| $50,000 to $74,999 | 747 (69.4%) | 330 (30.6%) |
| $75,000 to $99,999 | 447 (90.3%) | 48 (9.7%) |
| $100,000 and over | 395 (63.7%) | 225 (36.3%) |
Public vs Private Health Insurance Coverage by Age in Doolittle
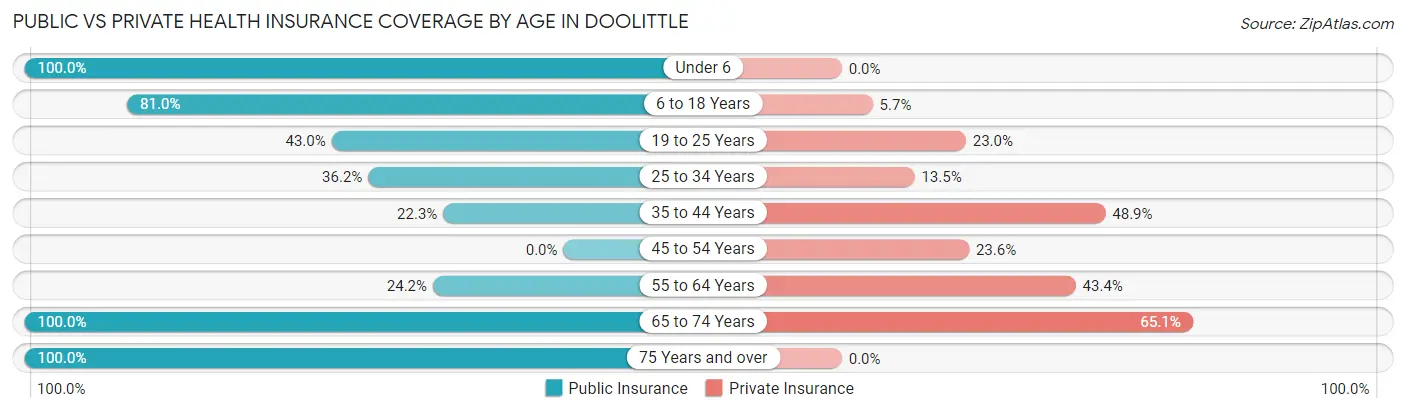
| Age Bracket | Public Insurance | Private Insurance |
| Under 6 | 877 (100.0%) | 0 (0.0%) |
| 6 to 18 Years | 1,442 (81.0%) | 102 (5.7%) |
| 19 to 25 Years | 185 (43.0%) | 99 (23.0%) |
| 25 to 34 Years | 325 (36.2%) | 121 (13.5%) |
| 35 to 44 Years | 114 (22.3%) | 250 (48.9%) |
| 45 to 54 Years | 0 (0.0%) | 166 (23.6%) |
| 55 to 64 Years | 125 (24.2%) | 224 (43.4%) |
| 65 to 74 Years | 215 (100.0%) | 140 (65.1%) |
| 75 Years and over | 89 (100.0%) | 0 (0.0%) |
| Total | 3,372 (56.0%) | 1,102 (18.3%) |
Disability Status by Sex by Age in Doolittle
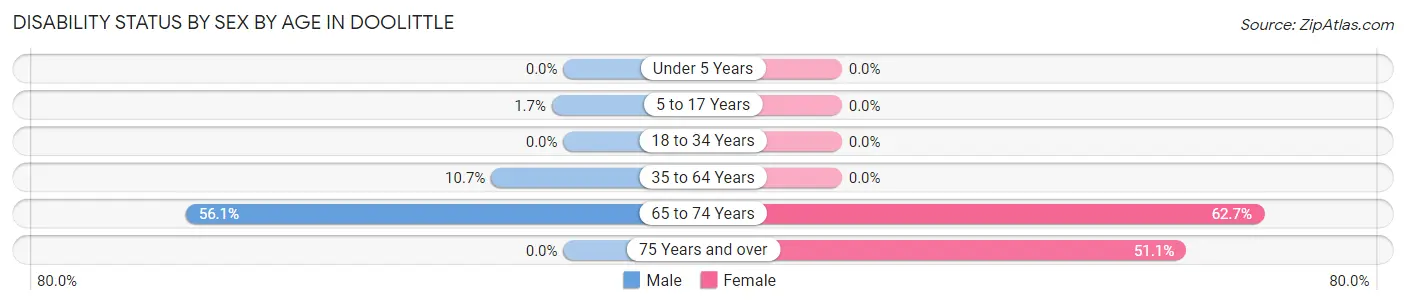
| Age Bracket | Male | Female |
| Under 5 Years | 0 (0.0%) | 0 (0.0%) |
| 5 to 17 Years | 16 (1.7%) | 0 (0.0%) |
| 18 to 34 Years | 0 (0.0%) | 0 (0.0%) |
| 35 to 64 Years | 85 (10.7%) | 0 (0.0%) |
| 65 to 74 Years | 74 (56.1%) | 52 (62.6%) |
| 75 Years and over | 0 (0.0%) | 23 (51.1%) |
Disability Class by Sex by Age in Doolittle
Disability Class: Hearing Difficulty
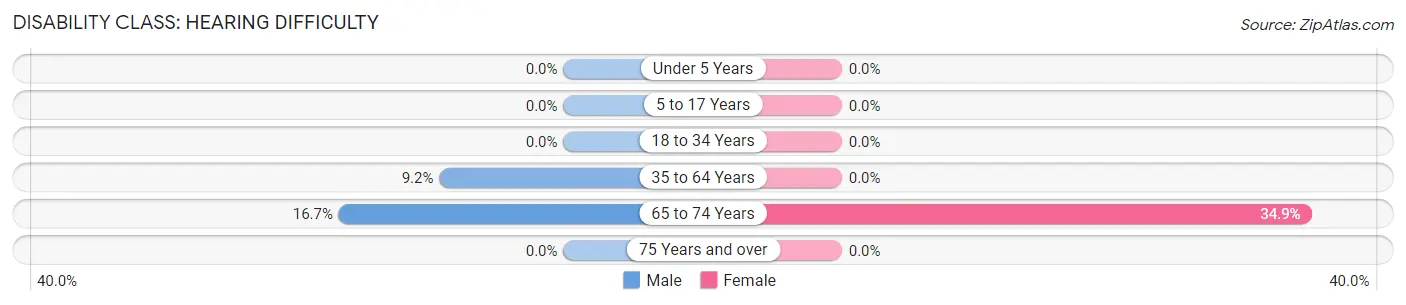
| Age Bracket | Male | Female |
| Under 5 Years | 0 (0.0%) | 0 (0.0%) |
| 5 to 17 Years | 0 (0.0%) | 0 (0.0%) |
| 18 to 34 Years | 0 (0.0%) | 0 (0.0%) |
| 35 to 64 Years | 73 (9.2%) | 0 (0.0%) |
| 65 to 74 Years | 22 (16.7%) | 29 (34.9%) |
| 75 Years and over | 0 (0.0%) | 0 (0.0%) |
Disability Class: Vision Difficulty
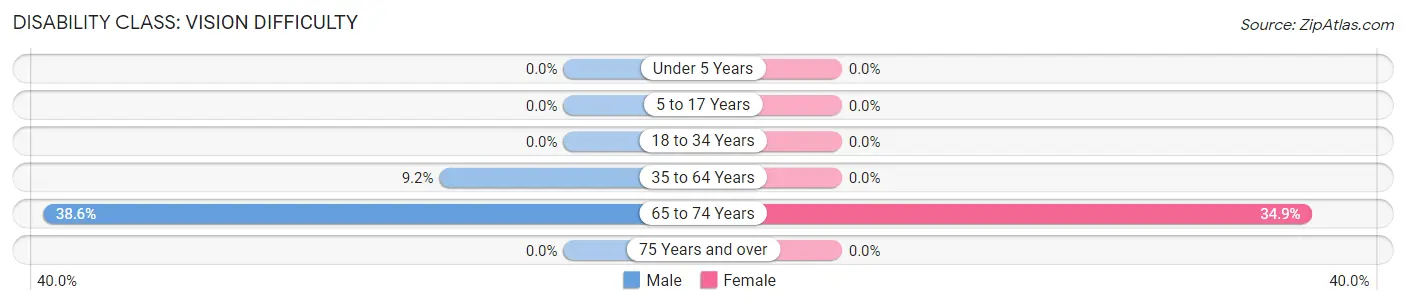
| Age Bracket | Male | Female |
| Under 5 Years | 0 (0.0%) | 0 (0.0%) |
| 5 to 17 Years | 0 (0.0%) | 0 (0.0%) |
| 18 to 34 Years | 0 (0.0%) | 0 (0.0%) |
| 35 to 64 Years | 73 (9.2%) | 0 (0.0%) |
| 65 to 74 Years | 51 (38.6%) | 29 (34.9%) |
| 75 Years and over | 0 (0.0%) | 0 (0.0%) |
Disability Class: Cognitive Difficulty
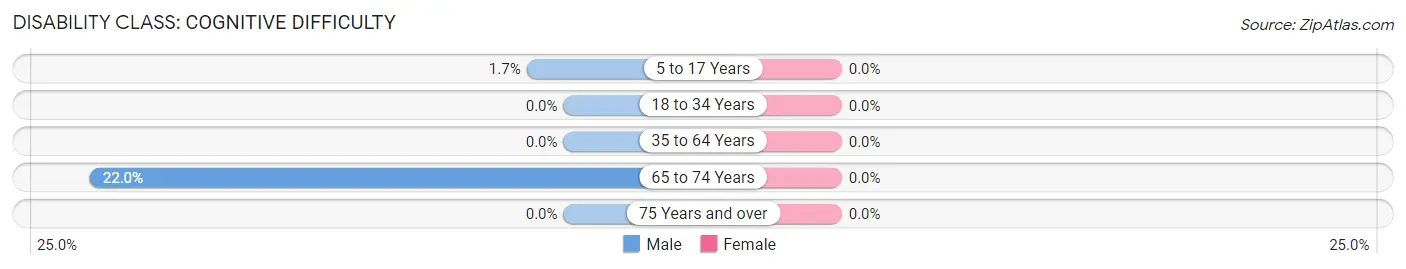
| Age Bracket | Male | Female |
| 5 to 17 Years | 16 (1.7%) | 0 (0.0%) |
| 18 to 34 Years | 0 (0.0%) | 0 (0.0%) |
| 35 to 64 Years | 0 (0.0%) | 0 (0.0%) |
| 65 to 74 Years | 29 (22.0%) | 0 (0.0%) |
| 75 Years and over | 0 (0.0%) | 0 (0.0%) |
Disability Class: Ambulatory Difficulty
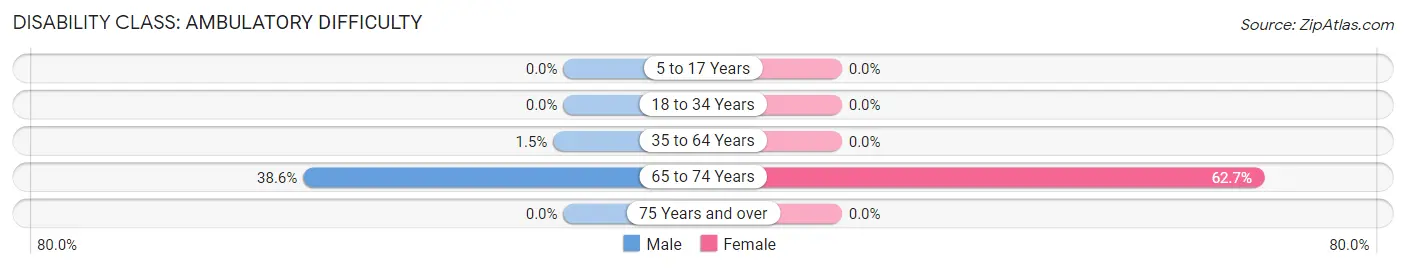
| Age Bracket | Male | Female |
| 5 to 17 Years | 0 (0.0%) | 0 (0.0%) |
| 18 to 34 Years | 0 (0.0%) | 0 (0.0%) |
| 35 to 64 Years | 12 (1.5%) | 0 (0.0%) |
| 65 to 74 Years | 51 (38.6%) | 52 (62.6%) |
| 75 Years and over | 0 (0.0%) | 0 (0.0%) |
Disability Class: Self-Care Difficulty
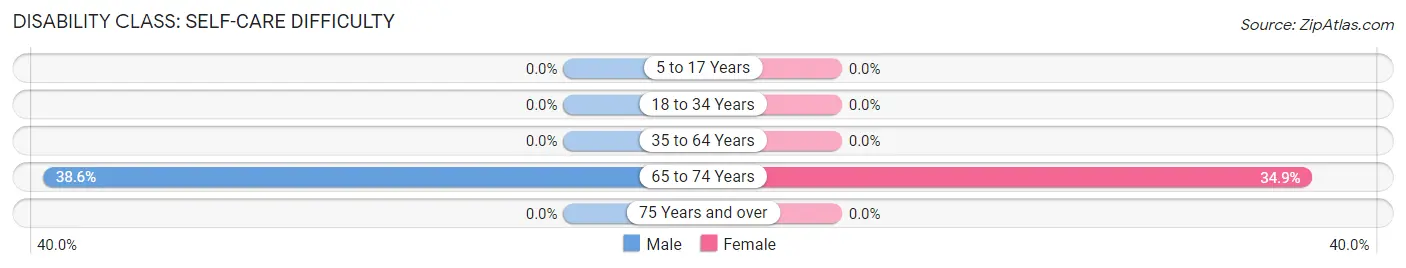
| Age Bracket | Male | Female |
| 5 to 17 Years | 0 (0.0%) | 0 (0.0%) |
| 18 to 34 Years | 0 (0.0%) | 0 (0.0%) |
| 35 to 64 Years | 0 (0.0%) | 0 (0.0%) |
| 65 to 74 Years | 51 (38.6%) | 29 (34.9%) |
| 75 Years and over | 0 (0.0%) | 0 (0.0%) |
Technology Access in Doolittle
Computing Device Access in Doolittle
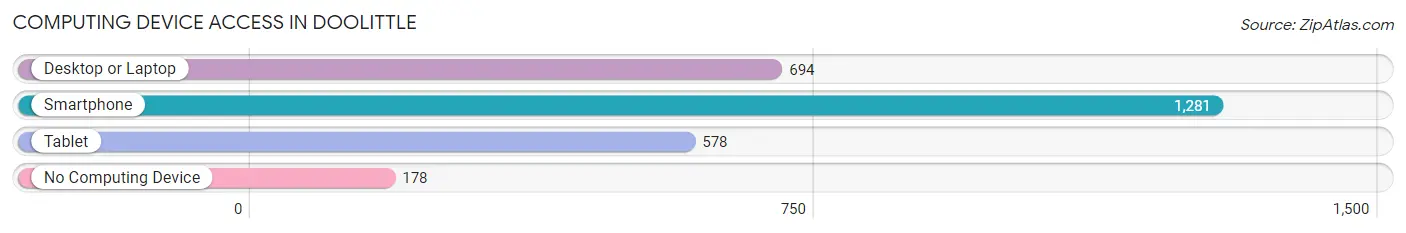
| Device Type | # Households | % Households |
| Desktop or Laptop | 694 | 46.8% |
| Smartphone | 1,281 | 86.4% |
| Tablet | 578 | 39.0% |
| No Computing Device | 178 | 12.0% |
| Total | 1,482 | 100.0% |
Internet Access in Doolittle
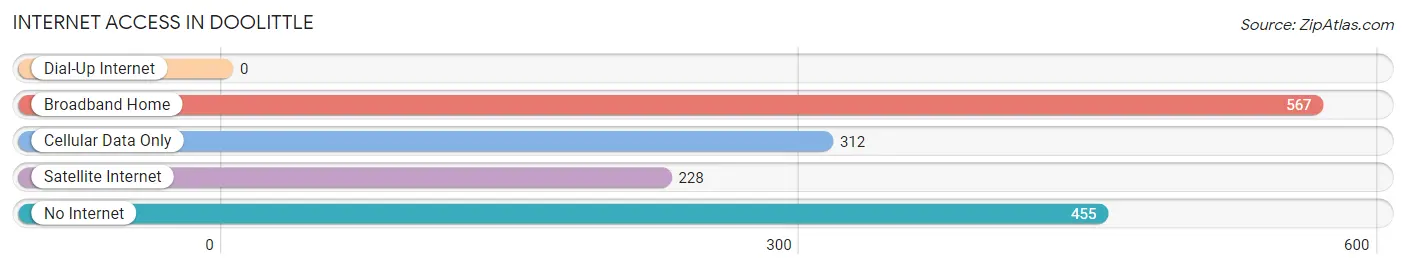
| Internet Type | # Households | % Households |
| Dial-Up Internet | 0 | 0.0% |
| Broadband Home | 567 | 38.3% |
| Cellular Data Only | 312 | 21.0% |
| Satellite Internet | 228 | 15.4% |
| No Internet | 455 | 30.7% |
| Total | 1,482 | 100.0% |
Doolittle Summary
Doolittle, Texas is a small unincorporated community located in the southeastern corner of Fayette County, Texas. The town is situated on the banks of the Colorado River, approximately 25 miles east of La Grange and about 50 miles west of Austin. The population of Doolittle was estimated to be around 200 people in 2020.
History
Doolittle was founded in 1873 by a group of German immigrants who had recently arrived in the area. The town was named after a local rancher, John Doolittle, who had donated the land for the settlement. The town quickly grew and by the early 1900s, it had become a thriving community with a population of over 500 people.
The town was home to several businesses, including a general store, a blacksmith shop, a cotton gin, and a post office. The town also had a school, a church, and a cemetery.
In the early 1900s, the town was a popular destination for tourists, who came to enjoy the area’s natural beauty and to take advantage of the nearby Colorado River. The town was also known for its annual Fourth of July celebration, which included a parade, a rodeo, and a fireworks display.
Geography
Doolittle is located in the southeastern corner of Fayette County, Texas. The town is situated on the banks of the Colorado River, approximately 25 miles east of La Grange and about 50 miles west of Austin. The terrain in the area is mostly flat, with some rolling hills. The climate is generally mild, with temperatures ranging from the mid-50s in the winter to the mid-90s in the summer.
Economy
The economy of Doolittle is largely based on agriculture. The town is home to several farms, which produce a variety of crops, including cotton, corn, and hay. The town also has a few small businesses, including a general store, a gas station, and a restaurant.
Demographics
The population of Doolittle was estimated to be around 200 people in 2020. The town is predominantly white, with a small Hispanic population. The median household income in the town is around $35,000, and the median home value is around $90,000. The town has a low unemployment rate, and the majority of the population is employed in the agricultural sector.
Common Questions
What is Per Capita Income in Doolittle?
Per Capita income in Doolittle is $14,190.
What is the Median Family Income in Doolittle?
Median Family Income in Doolittle is $33,653.
What is the Median Household income in Doolittle?
Median Household Income in Doolittle is $33,326.
What is Family Income Deficit in Doolittle?
Family Income Deficit in Doolittle is $11,491.
Families that are below poverty line in Doolittle earn $11,491 less on average than the poverty threshold level.
What is Inequality or Gini Index in Doolittle?
Inequality or Gini Index in Doolittle is 0.54.
What is the Total Population of Doolittle?
Total Population of Doolittle is 6,019.
What is the Total Male Population of Doolittle?
Total Male Population of Doolittle is 3,053.
What is the Total Female Population of Doolittle?
Total Female Population of Doolittle is 2,966.
What is the Ratio of Males per 100 Females in Doolittle?
There are 102.93 Males per 100 Females in Doolittle.
What is the Ratio of Females per 100 Males in Doolittle?
There are 97.15 Females per 100 Males in Doolittle.
What is the Median Population Age in Doolittle?
Median Population Age in Doolittle is 23.2 Years.
What is the Average Family Size in Doolittle
Average Family Size in Doolittle is 4.5 People.
What is the Average Household Size in Doolittle
Average Household Size in Doolittle is 4.1 People.
How Large is the Labor Force in Doolittle?
There are 1,632 People in the Labor Forcein in Doolittle.
What is the Percentage of People in the Labor Force in Doolittle?
43.8% of People are in the Labor Force in Doolittle.
What is the Unemployment Rate in Doolittle?
Unemployment Rate in Doolittle is 22.3%.