Zip Codes with the Highest Percentage of Families with Income Below $10,000 in Brownsville, TX
RELATED REPORTS & OPTIONS
Family Income | $0-10k
Brownsville
Compare Zip Codes
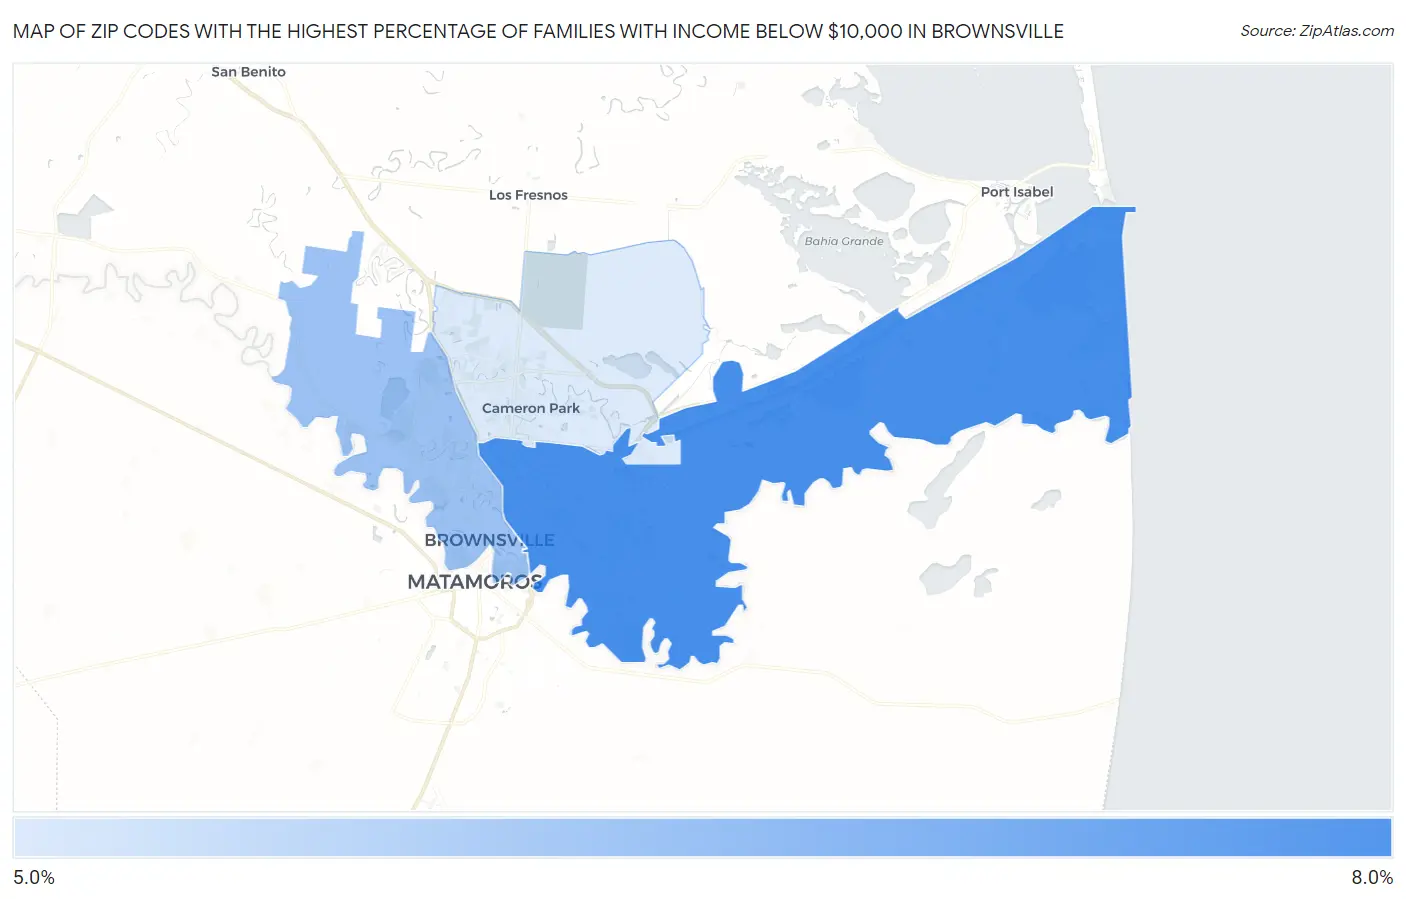
Map of Zip Codes with the Highest Percentage of Families with Income Below $10,000 in Brownsville
5.4%
7.3%
Zip Codes with the Highest Percentage of Families with Income Below $10,000 in Brownsville, TX
| Zip Code | Families with Income < $10k | vs State | vs National | |
| 1. | 78521 | 7.3% | 3.5%(+3.80)#201 | 3.1%(+4.20)#3,392 |
| 2. | 78520 | 6.2% | 3.5%(+2.70)#280 | 3.1%(+3.10)#4,415 |
| 3. | 78526 | 5.4% | 3.5%(+1.90)#376 | 3.1%(+2.30)#5,428 |
1
Common Questions
What are the Top Zip Codes with the Highest Percentage of Families with Income Below $10,000 in Brownsville, TX?
Top Zip Codes with the Highest Percentage of Families with Income Below $10,000 in Brownsville, TX are:
What zip code has the Highest Percentage of Families with Income Below $10,000 in Brownsville, TX?
78521 has the Highest Percentage of Families with Income Below $10,000 in Brownsville, TX with 7.3%.
What is the Percentage of Families with Income Below $10,000 in Brownsville, TX?
Percentage of Families with Income Below $10,000 in Brownsville is 7.2%.
What is the Percentage of Families with Income Below $10,000 in Texas?
Percentage of Families with Income Below $10,000 in Texas is 3.5%.
What is the Percentage of Families with Income Below $10,000 in the United States?
Percentage of Families with Income Below $10,000 in the United States is 3.1%.