Kingsville, TX Map & Demographics
Kingsville Map
Kingsville Overview
$24,713
PER CAPITA INCOME
$57,720
AVG FAMILY INCOME
$50,963
AVG HOUSEHOLD INCOME
42.2%
WAGE / INCOME GAP [ % ]
57.8¢/ $1
WAGE / INCOME GAP [ $ ]
$13,197
FAMILY INCOME DEFICIT
0.48
INEQUALITY / GINI INDEX
25,265
TOTAL POPULATION
13,205
MALE POPULATION
12,060
FEMALE POPULATION
109.49
MALES / 100 FEMALES
91.33
FEMALES / 100 MALES
27.4
MEDIAN AGE
3.0
AVG FAMILY SIZE
2.4
AVG HOUSEHOLD SIZE
12,309
LABOR FORCE [ PEOPLE ]
61.4%
PERCENT IN LABOR FORCE
8.2%
UNEMPLOYMENT RATE
Kingsville Zip Codes
Kingsville Area Codes
Income in Kingsville
Income Overview in Kingsville
Per Capita Income in Kingsville is $24,713, while median incomes of families and households are $57,720 and $50,963 respectively.
| Characteristic | Number | Measure |
| Per Capita Income | 25,265 | $24,713 |
| Median Family Income | 5,754 | $57,720 |
| Mean Family Income | 5,754 | $73,140 |
| Median Household Income | 9,900 | $50,963 |
| Mean Household Income | 9,900 | $63,370 |
| Income Deficit | 5,754 | $13,197 |
| Wage / Income Gap (%) | 25,265 | 42.25% |
| Wage / Income Gap ($) | 25,265 | 57.75¢ per $1 |
| Gini / Inequality Index | 25,265 | 0.48 |
Earnings by Sex in Kingsville
Average Earnings in Kingsville are $28,822, $40,282 for men and $23,264 for women, a difference of 42.2%.
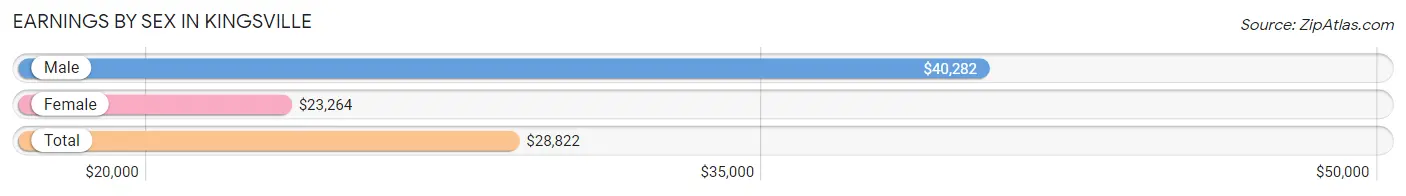
| Sex | Number | Average Earnings |
| Male | 7,003 (55.0%) | $40,282 |
| Female | 5,729 (45.0%) | $23,264 |
| Total | 12,732 (100.0%) | $28,822 |
Earnings by Sex by Income Bracket in Kingsville
The most common earnings brackets in Kingsville are $55,000 to $64,999 for men (878 | 12.5%) and $5,000 to $7,499 for women (647 | 11.3%).
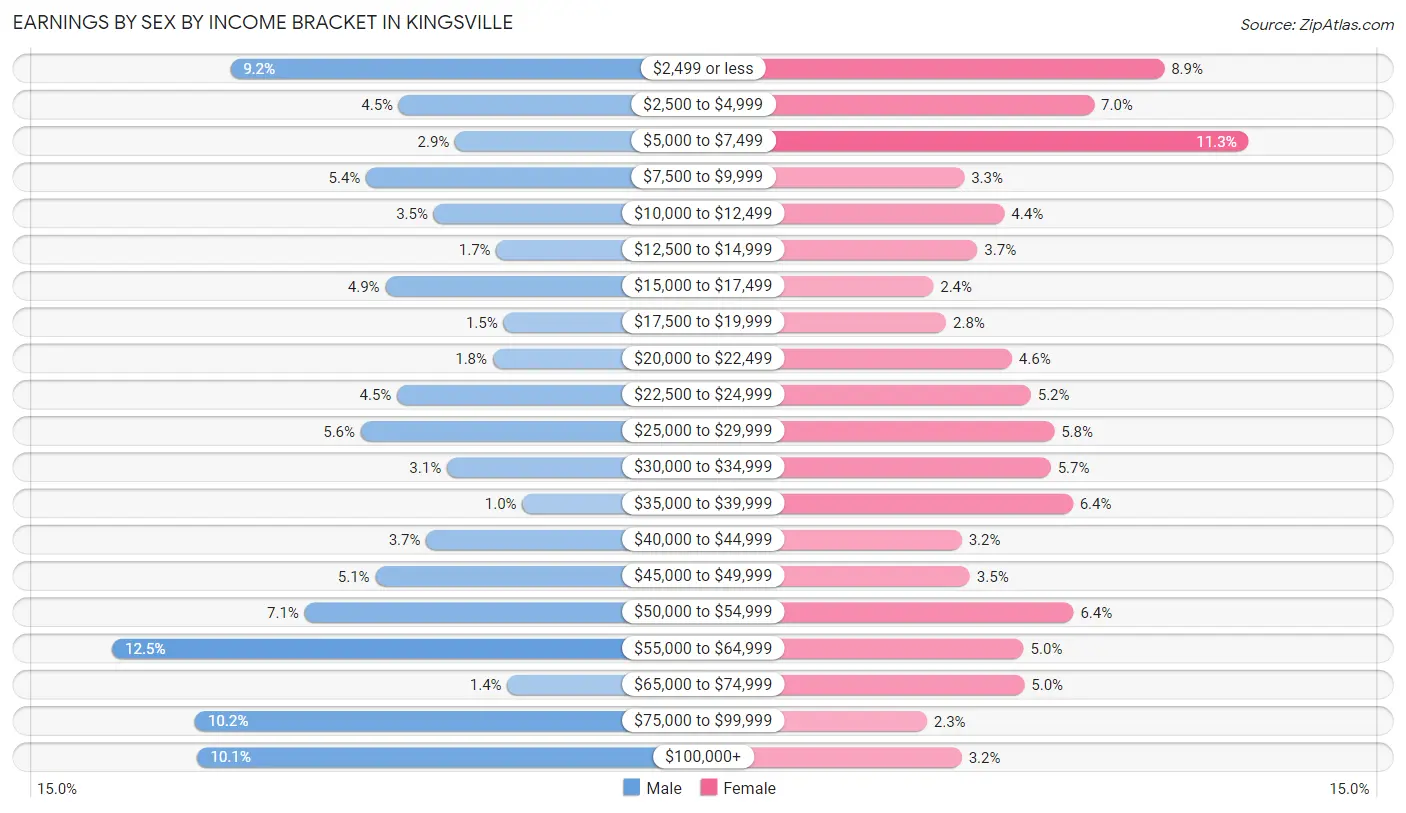
| Income | Male | Female |
| $2,499 or less | 646 (9.2%) | 511 (8.9%) |
| $2,500 to $4,999 | 314 (4.5%) | 398 (7.0%) |
| $5,000 to $7,499 | 203 (2.9%) | 647 (11.3%) |
| $7,500 to $9,999 | 378 (5.4%) | 189 (3.3%) |
| $10,000 to $12,499 | 245 (3.5%) | 254 (4.4%) |
| $12,500 to $14,999 | 122 (1.7%) | 210 (3.7%) |
| $15,000 to $17,499 | 340 (4.9%) | 139 (2.4%) |
| $17,500 to $19,999 | 108 (1.5%) | 160 (2.8%) |
| $20,000 to $22,499 | 129 (1.8%) | 266 (4.6%) |
| $22,500 to $24,999 | 317 (4.5%) | 296 (5.2%) |
| $25,000 to $29,999 | 389 (5.6%) | 334 (5.8%) |
| $30,000 to $34,999 | 219 (3.1%) | 328 (5.7%) |
| $35,000 to $39,999 | 71 (1.0%) | 364 (6.4%) |
| $40,000 to $44,999 | 260 (3.7%) | 185 (3.2%) |
| $45,000 to $49,999 | 360 (5.1%) | 198 (3.5%) |
| $50,000 to $54,999 | 499 (7.1%) | 365 (6.4%) |
| $55,000 to $64,999 | 878 (12.5%) | 285 (5.0%) |
| $65,000 to $74,999 | 100 (1.4%) | 286 (5.0%) |
| $75,000 to $99,999 | 715 (10.2%) | 129 (2.2%) |
| $100,000+ | 710 (10.1%) | 185 (3.2%) |
| Total | 7,003 (100.0%) | 5,729 (100.0%) |
Earnings by Sex by Educational Attainment in Kingsville
Average earnings in Kingsville are $49,578 for men and $29,860 for women, a difference of 39.8%. Men with an educational attainment of graduate degree enjoy the highest average annual earnings of $117,188, while those with college or associate's degree education earn the least with $34,375. Women with an educational attainment of graduate degree earn the most with the average annual earnings of $61,843, while those with less than high school education have the smallest earnings of $17,700.
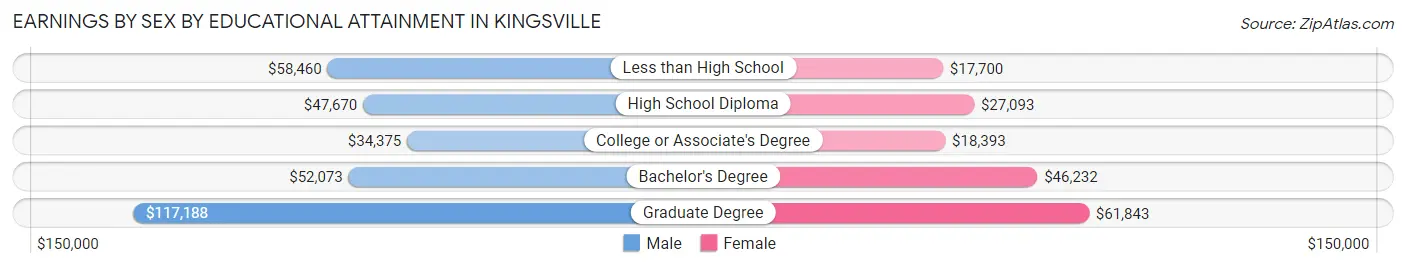
| Educational Attainment | Male Income | Female Income |
| Less than High School | $58,460 | $17,700 |
| High School Diploma | $47,670 | $27,093 |
| College or Associate's Degree | $34,375 | $18,393 |
| Bachelor's Degree | $52,073 | $46,232 |
| Graduate Degree | $117,188 | $61,843 |
| Total | $49,578 | $29,860 |
Family Income in Kingsville
Family Income Brackets in Kingsville
According to the Kingsville family income data, there are 1,007 families falling into the $100,000 to $149,999 income range, which is the most common income bracket and makes up 17.5% of all families. Conversely, the $10,000 to $14,999 income bracket is the least frequent group with only 127 families (2.2%) belonging to this category.
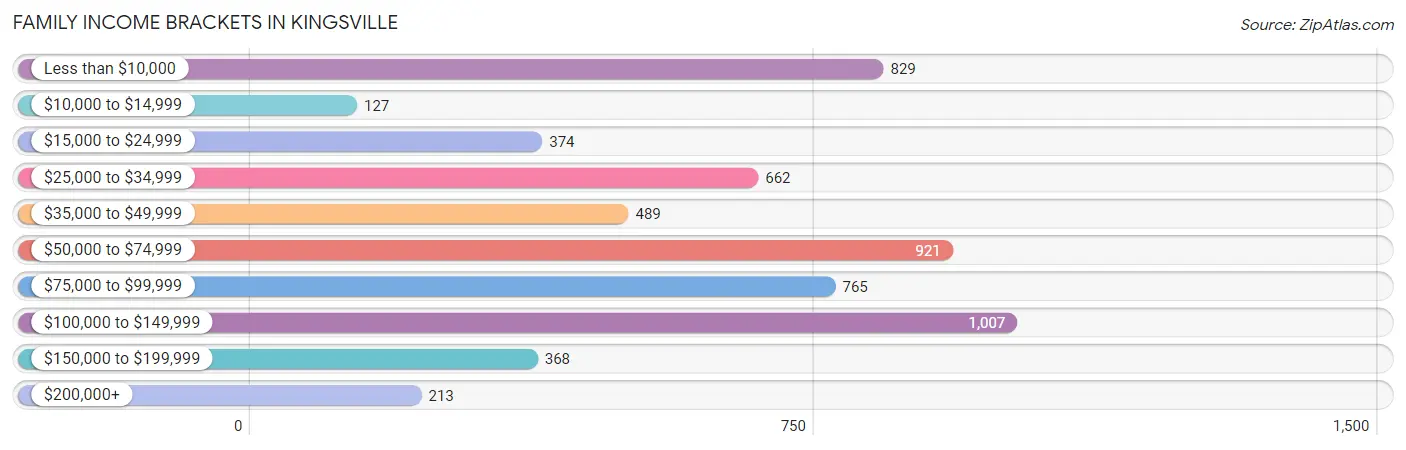
| Income Bracket | # Families | % Families |
| Less than $10,000 | 829 | 14.4% |
| $10,000 to $14,999 | 127 | 2.2% |
| $15,000 to $24,999 | 374 | 6.5% |
| $25,000 to $34,999 | 662 | 11.5% |
| $35,000 to $49,999 | 489 | 8.5% |
| $50,000 to $74,999 | 921 | 16.0% |
| $75,000 to $99,999 | 765 | 13.3% |
| $100,000 to $149,999 | 1,007 | 17.5% |
| $150,000 to $199,999 | 368 | 6.4% |
| $200,000+ | 213 | 3.7% |
Family Income by Famaliy Size in Kingsville
6-person families (97 | 1.7%) account for the highest median family income in Kingsville with $95,995 per family, while 2-person families (2,400 | 41.7%) have the highest median income of $26,134 per family member.
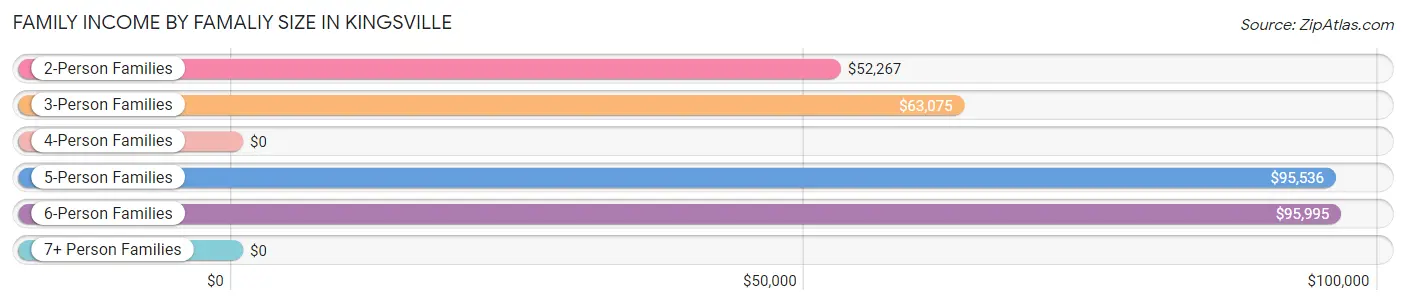
| Income Bracket | # Families | Median Income |
| 2-Person Families | 2,400 (41.7%) | $52,267 |
| 3-Person Families | 1,339 (23.3%) | $63,075 |
| 4-Person Families | 1,520 (26.4%) | $0 |
| 5-Person Families | 345 (6.0%) | $95,536 |
| 6-Person Families | 97 (1.7%) | $95,995 |
| 7+ Person Families | 53 (0.9%) | $0 |
| Total | 5,754 (100.0%) | $57,720 |
Family Income by Number of Earners in Kingsville
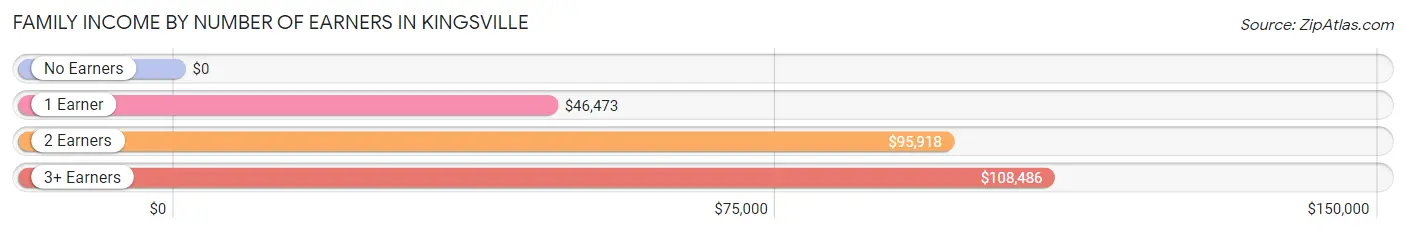
| Number of Earners | # Families | Median Income |
| No Earners | 1,040 (18.1%) | $0 |
| 1 Earner | 2,389 (41.5%) | $46,473 |
| 2 Earners | 1,887 (32.8%) | $95,918 |
| 3+ Earners | 438 (7.6%) | $108,486 |
| Total | 5,754 (100.0%) | $57,720 |
Household Income in Kingsville
Household Income Brackets in Kingsville
With 1,732 households falling in the category, the $50,000 to $74,999 income range is the most frequent in Kingsville, accounting for 17.5% of all households. In contrast, only 248 households (2.5%) fall into the $200,000+ income bracket, making it the least populous group.
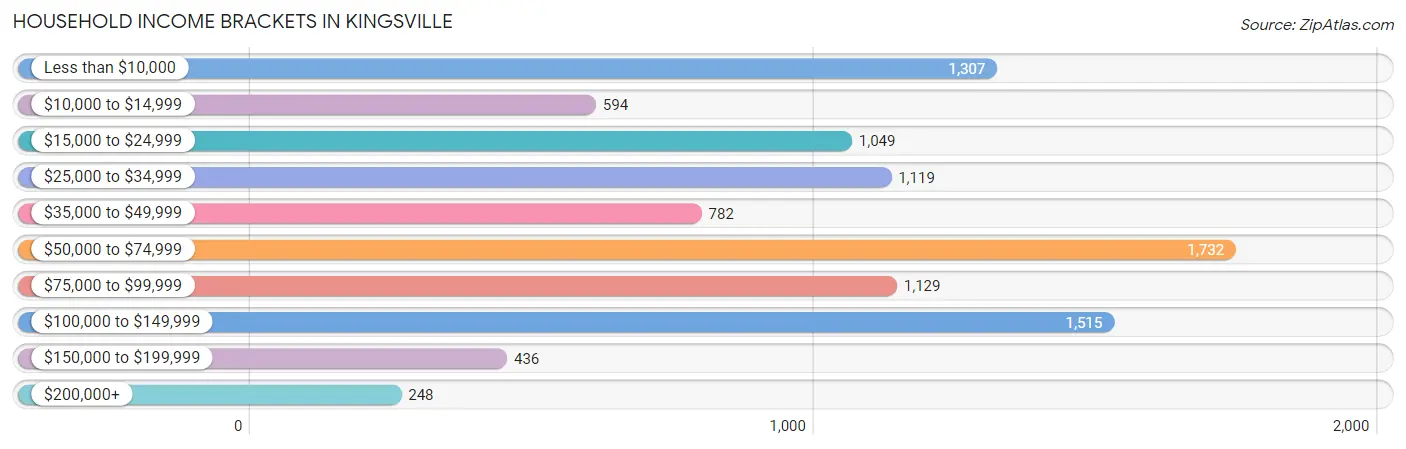
| Income Bracket | # Households | % Households |
| Less than $10,000 | 1,307 | 13.2% |
| $10,000 to $14,999 | 594 | 6.0% |
| $15,000 to $24,999 | 1,049 | 10.6% |
| $25,000 to $34,999 | 1,119 | 11.3% |
| $35,000 to $49,999 | 782 | 7.9% |
| $50,000 to $74,999 | 1,732 | 17.5% |
| $75,000 to $99,999 | 1,129 | 11.4% |
| $100,000 to $149,999 | 1,515 | 15.3% |
| $150,000 to $199,999 | 436 | 4.4% |
| $200,000+ | 248 | 2.5% |
Household Income by Householder Age in Kingsville
The median household income in Kingsville is $50,963, with the highest median household income of $60,398 found in the 45 to 64 years age bracket for the primary householder. A total of 2,437 households (24.6%) fall into this category. Meanwhile, the 15 to 24 years age bracket for the primary householder has the lowest median household income of $25,250, with 1,893 households (19.1%) in this group.
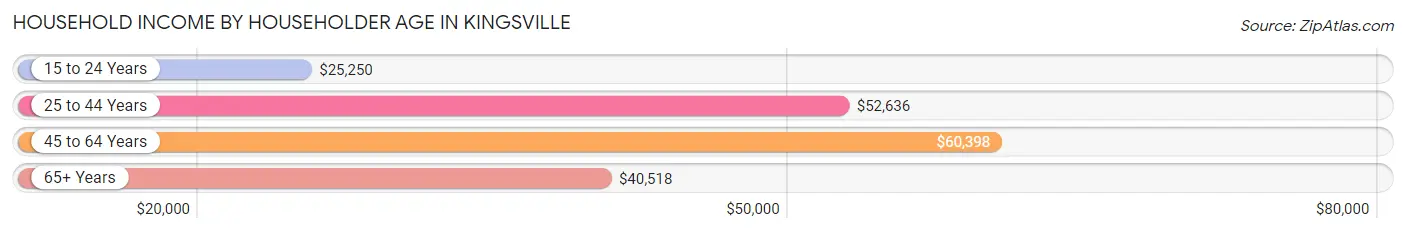
| Income Bracket | # Households | Median Income |
| 15 to 24 Years | 1,893 (19.1%) | $25,250 |
| 25 to 44 Years | 3,787 (38.3%) | $52,636 |
| 45 to 64 Years | 2,437 (24.6%) | $60,398 |
| 65+ Years | 1,783 (18.0%) | $40,518 |
| Total | 9,900 (100.0%) | $50,963 |
Poverty in Kingsville
Income Below Poverty by Sex and Age in Kingsville
With 29.4% poverty level for males and 37.1% for females among the residents of Kingsville, 5 year old males and under 5 year old females are the most vulnerable to poverty, with 206 males (81.4%) and 449 females (60.1%) in their respective age groups living below the poverty level.
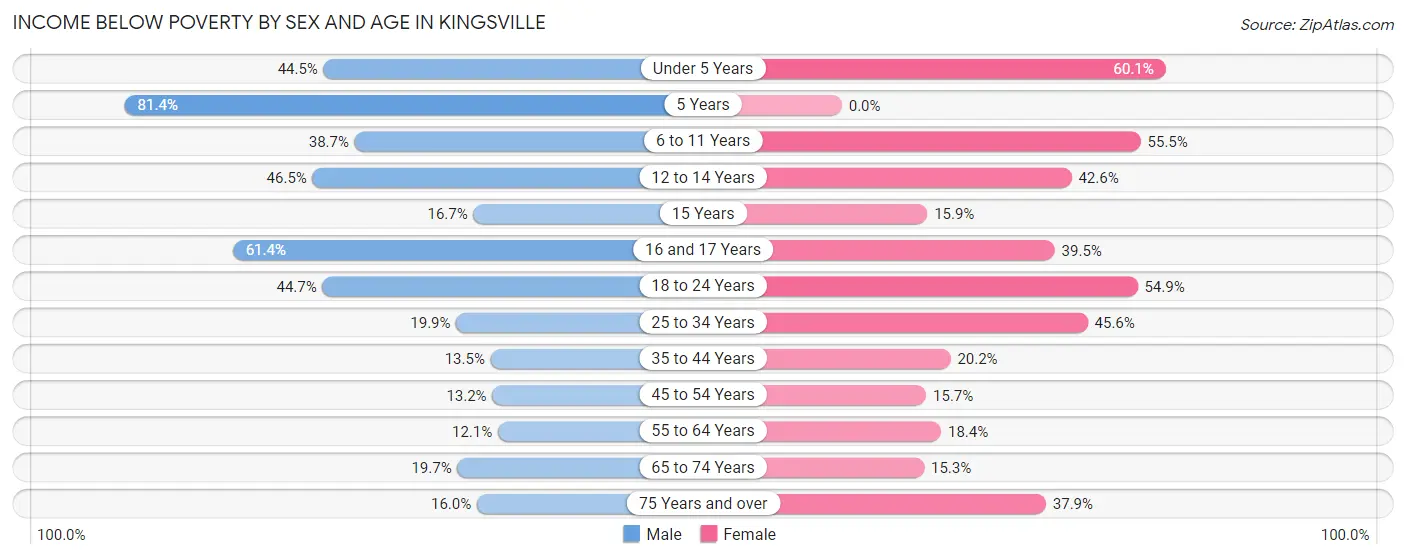
| Age Bracket | Male | Female |
| Under 5 Years | 439 (44.5%) | 449 (60.1%) |
| 5 Years | 206 (81.4%) | 0 (0.0%) |
| 6 to 11 Years | 377 (38.7%) | 391 (55.5%) |
| 12 to 14 Years | 295 (46.5%) | 217 (42.6%) |
| 15 Years | 18 (16.7%) | 29 (15.9%) |
| 16 and 17 Years | 259 (61.4%) | 96 (39.5%) |
| 18 to 24 Years | 909 (44.7%) | 1,255 (54.9%) |
| 25 to 34 Years | 416 (19.9%) | 798 (45.6%) |
| 35 to 44 Years | 190 (13.5%) | 264 (20.2%) |
| 45 to 54 Years | 156 (13.2%) | 170 (15.7%) |
| 55 to 64 Years | 107 (12.1%) | 167 (18.4%) |
| 65 to 74 Years | 147 (19.7%) | 133 (15.3%) |
| 75 Years and over | 79 (16.0%) | 250 (37.9%) |
| Total | 3,598 (29.4%) | 4,219 (37.1%) |
Income Above Poverty by Sex and Age in Kingsville
According to the poverty statistics in Kingsville, males aged 55 to 64 years and females aged 5 years are the age groups that are most secure financially, with 87.9% of males and 100.0% of females in these age groups living above the poverty line.
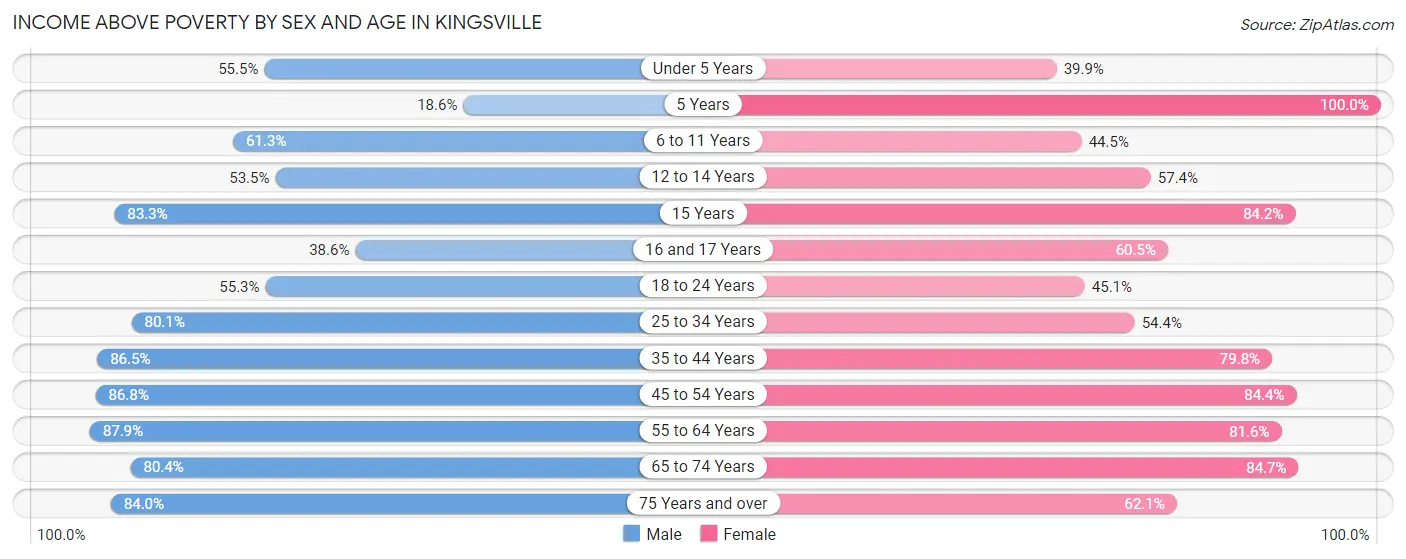
| Age Bracket | Male | Female |
| Under 5 Years | 548 (55.5%) | 298 (39.9%) |
| 5 Years | 47 (18.6%) | 114 (100.0%) |
| 6 to 11 Years | 597 (61.3%) | 314 (44.5%) |
| 12 to 14 Years | 339 (53.5%) | 292 (57.4%) |
| 15 Years | 90 (83.3%) | 154 (84.2%) |
| 16 and 17 Years | 163 (38.6%) | 147 (60.5%) |
| 18 to 24 Years | 1,125 (55.3%) | 1,032 (45.1%) |
| 25 to 34 Years | 1,679 (80.1%) | 951 (54.4%) |
| 35 to 44 Years | 1,220 (86.5%) | 1,045 (79.8%) |
| 45 to 54 Years | 1,029 (86.8%) | 916 (84.4%) |
| 55 to 64 Years | 776 (87.9%) | 739 (81.6%) |
| 65 to 74 Years | 601 (80.3%) | 738 (84.7%) |
| 75 Years and over | 414 (84.0%) | 410 (62.1%) |
| Total | 8,628 (70.6%) | 7,150 (62.9%) |
Income Below Poverty Among Married-Couple Families in Kingsville
The poverty statistics for married-couple families in Kingsville show that 8.3% or 277 of the total 3,327 families live below the poverty line. Families with 3 or 4 children have the highest poverty rate of 31.9%, comprising of 89 families. On the other hand, families with no children have the lowest poverty rate of 2.4%, which includes 45 families.
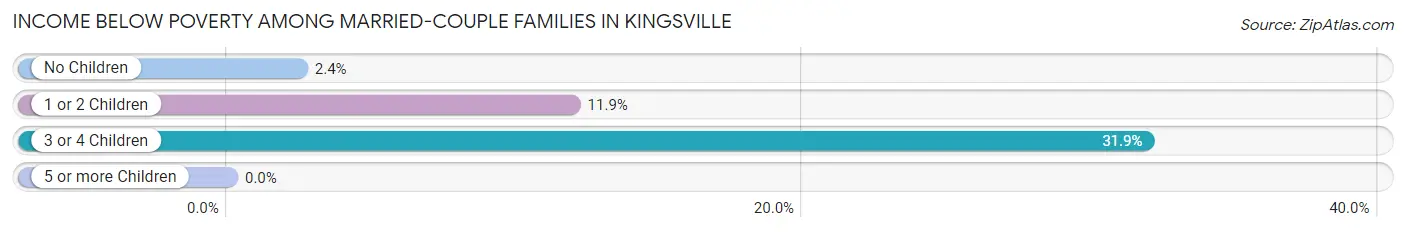
| Children | Above Poverty | Below Poverty |
| No Children | 1,804 (97.6%) | 45 (2.4%) |
| 1 or 2 Children | 1,056 (88.1%) | 143 (11.9%) |
| 3 or 4 Children | 190 (68.1%) | 89 (31.9%) |
| 5 or more Children | 0 (0.0%) | 0 (0.0%) |
| Total | 3,050 (91.7%) | 277 (8.3%) |
Income Below Poverty Among Single-Parent Households in Kingsville
According to the poverty data in Kingsville, 39.7% or 241 single-father households and 56.1% or 1,022 single-mother households are living below the poverty line. Among single-father households, those with 1 or 2 children have the highest poverty rate, with 126 households (45.2%) experiencing poverty. Likewise, among single-mother households, those with 5 or more children have the highest poverty rate, with 10 households (100.0%) falling below the poverty line.
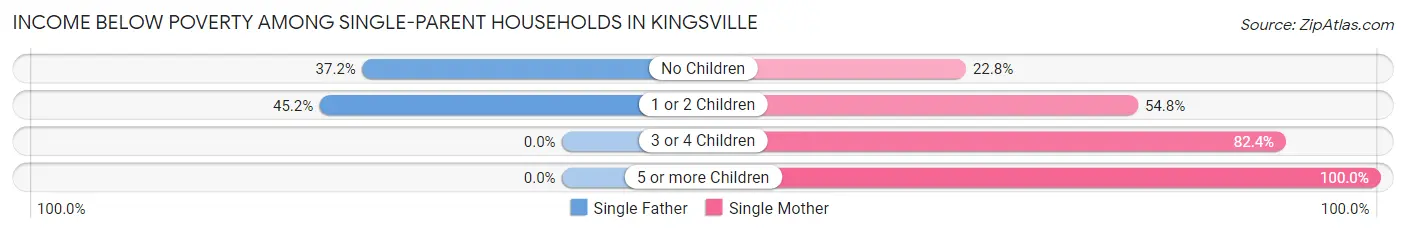
| Children | Single Father | Single Mother |
| No Children | 115 (37.2%) | 77 (22.8%) |
| 1 or 2 Children | 126 (45.2%) | 552 (54.8%) |
| 3 or 4 Children | 0 (0.0%) | 383 (82.4%) |
| 5 or more Children | 0 (0.0%) | 10 (100.0%) |
| Total | 241 (39.7%) | 1,022 (56.1%) |
Income Below Poverty Among Married-Couple vs Single-Parent Households in Kingsville
The poverty data for Kingsville shows that 277 of the married-couple family households (8.3%) and 1,263 of the single-parent households (52.0%) are living below the poverty level. Within the married-couple family households, those with 3 or 4 children have the highest poverty rate, with 89 households (31.9%) falling below the poverty line. Among the single-parent households, those with 5 or more children have the highest poverty rate, with 10 household (100.0%) living below poverty.
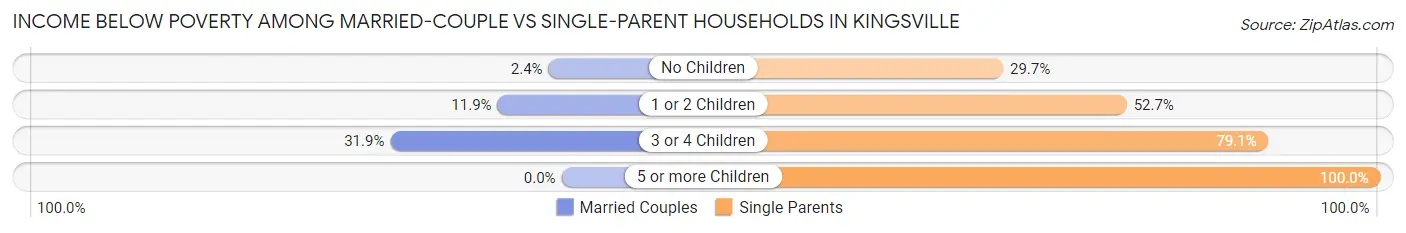
| Children | Married-Couple Families | Single-Parent Households |
| No Children | 45 (2.4%) | 192 (29.7%) |
| 1 or 2 Children | 143 (11.9%) | 678 (52.7%) |
| 3 or 4 Children | 89 (31.9%) | 383 (79.1%) |
| 5 or more Children | 0 (0.0%) | 10 (100.0%) |
| Total | 277 (8.3%) | 1,263 (52.0%) |
Race in Kingsville
The most populous races in Kingsville are Hispanic or Latino (18,967 | 75.1%), White / Caucasian (14,487 | 57.3%), and Two or more Races (7,985 | 31.6%).
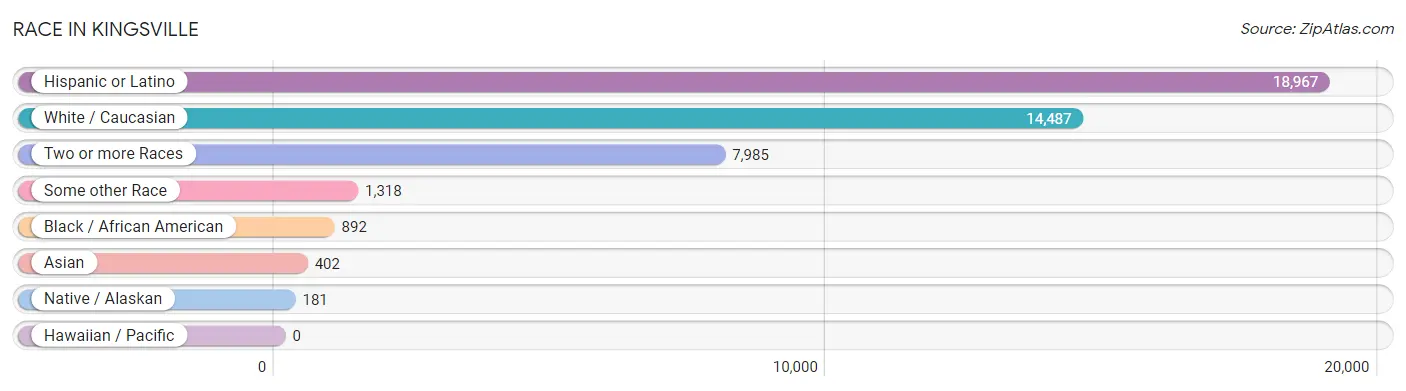
| Race | # Population | % Population |
| Asian | 402 | 1.6% |
| Black / African American | 892 | 3.5% |
| Hawaiian / Pacific | 0 | 0.0% |
| Hispanic or Latino | 18,967 | 75.1% |
| Native / Alaskan | 181 | 0.7% |
| White / Caucasian | 14,487 | 57.3% |
| Two or more Races | 7,985 | 31.6% |
| Some other Race | 1,318 | 5.2% |
| Total | 25,265 | 100.0% |
Ancestry in Kingsville
The most populous ancestries reported in Kingsville are Mexican (17,872 | 70.7%), German (1,237 | 4.9%), English (1,222 | 4.8%), Irish (726 | 2.9%), and American (687 | 2.7%), together accounting for 86.1% of all Kingsville residents.
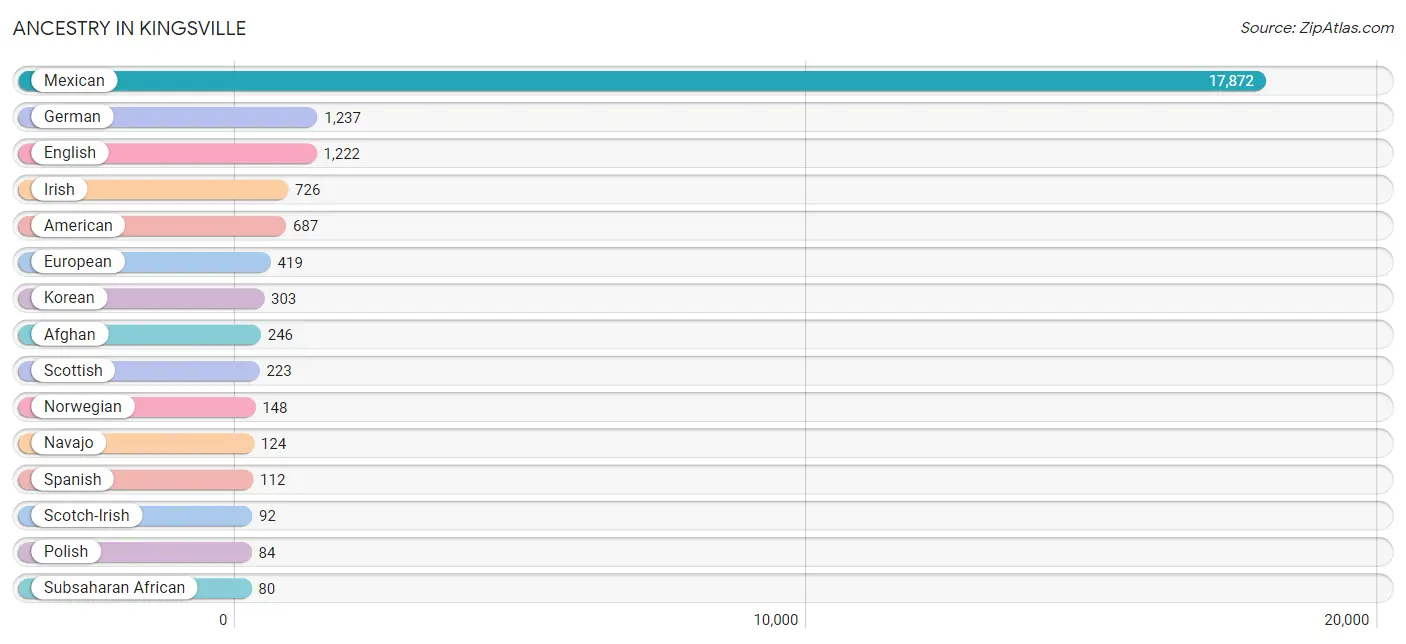
| Ancestry | # Population | % Population |
| Afghan | 246 | 1.0% |
| African | 41 | 0.2% |
| American | 687 | 2.7% |
| Apache | 13 | 0.1% |
| Argentinean | 10 | 0.0% |
| Bhutanese | 79 | 0.3% |
| Bolivian | 30 | 0.1% |
| Brazilian | 15 | 0.1% |
| British | 52 | 0.2% |
| Burmese | 8 | 0.0% |
| Central American | 30 | 0.1% |
| Cherokee | 9 | 0.0% |
| Chickasaw | 17 | 0.1% |
| Creek | 31 | 0.1% |
| Cuban | 33 | 0.1% |
| Czech | 70 | 0.3% |
| Dutch | 30 | 0.1% |
| Dutch West Indian | 8 | 0.0% |
| Eastern European | 23 | 0.1% |
| English | 1,222 | 4.8% |
| European | 419 | 1.7% |
| Filipino | 12 | 0.1% |
| French | 66 | 0.3% |
| French Canadian | 12 | 0.1% |
| German | 1,237 | 4.9% |
| Greek | 11 | 0.0% |
| Honduran | 15 | 0.1% |
| Indian (Asian) | 70 | 0.3% |
| Inupiat | 2 | 0.0% |
| Irish | 726 | 2.9% |
| Italian | 50 | 0.2% |
| Korean | 303 | 1.2% |
| Laotian | 44 | 0.2% |
| Mexican | 17,872 | 70.7% |
| Navajo | 124 | 0.5% |
| Nigerian | 39 | 0.2% |
| Northern European | 35 | 0.1% |
| Norwegian | 148 | 0.6% |
| Pakistani | 44 | 0.2% |
| Peruvian | 30 | 0.1% |
| Polish | 84 | 0.3% |
| Portuguese | 7 | 0.0% |
| Russian | 10 | 0.0% |
| Salvadoran | 15 | 0.1% |
| Scandinavian | 19 | 0.1% |
| Scotch-Irish | 92 | 0.4% |
| Scottish | 223 | 0.9% |
| Slovak | 11 | 0.0% |
| South American | 70 | 0.3% |
| Spaniard | 20 | 0.1% |
| Spanish | 112 | 0.4% |
| Sri Lankan | 17 | 0.1% |
| Subsaharan African | 80 | 0.3% |
| Swedish | 35 | 0.1% |
| Thai | 66 | 0.3% |
| Ukrainian | 16 | 0.1% |
| Welsh | 5 | 0.0% | View All 57 Rows |
Immigrants in Kingsville
The most numerous immigrant groups reported in Kingsville came from Latin America (943 | 3.7%), Central America (865 | 3.4%), Mexico (806 | 3.2%), Asia (576 | 2.3%), and South Central Asia (302 | 1.2%), together accounting for 13.8% of all Kingsville residents.
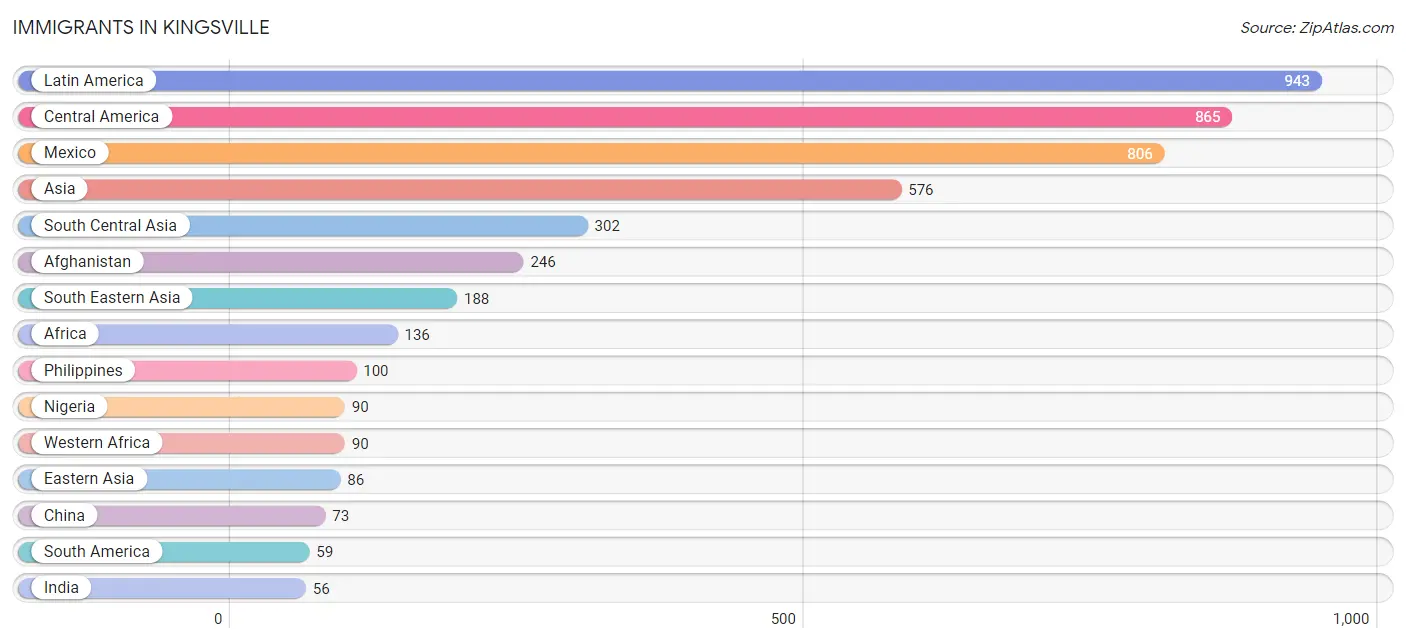
| Immigration Origin | # Population | % Population |
| Afghanistan | 246 | 1.0% |
| Africa | 136 | 0.5% |
| Asia | 576 | 2.3% |
| Bolivia | 7 | 0.0% |
| Brazil | 22 | 0.1% |
| Caribbean | 19 | 0.1% |
| Central America | 865 | 3.4% |
| China | 73 | 0.3% |
| Cuba | 9 | 0.0% |
| Eastern Asia | 86 | 0.3% |
| El Salvador | 15 | 0.1% |
| Europe | 49 | 0.2% |
| Germany | 49 | 0.2% |
| Honduras | 44 | 0.2% |
| India | 56 | 0.2% |
| Indonesia | 44 | 0.2% |
| Jamaica | 10 | 0.0% |
| Japan | 13 | 0.1% |
| Latin America | 943 | 3.7% |
| Mexico | 806 | 3.2% |
| Nigeria | 90 | 0.4% |
| Peru | 30 | 0.1% |
| Philippines | 100 | 0.4% |
| South America | 59 | 0.2% |
| South Central Asia | 302 | 1.2% |
| South Eastern Asia | 188 | 0.7% |
| Taiwan | 12 | 0.1% |
| Thailand | 44 | 0.2% |
| Western Africa | 90 | 0.4% |
| Western Europe | 49 | 0.2% | View All 30 Rows |
Sex and Age in Kingsville
Sex and Age in Kingsville
The most populous age groups in Kingsville are 20 to 24 Years (2,033 | 15.4%) for men and 20 to 24 Years (2,052 | 17.0%) for women.
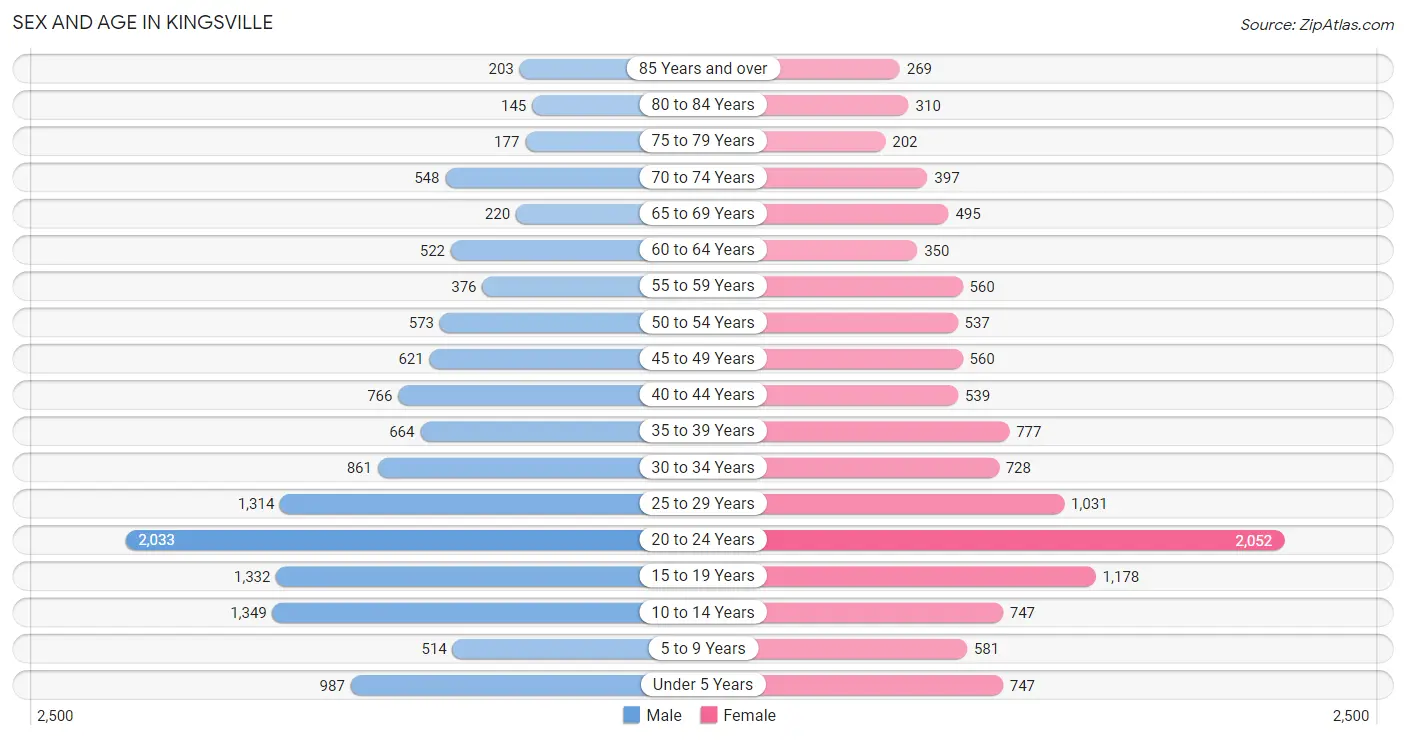
| Age Bracket | Male | Female |
| Under 5 Years | 987 (7.5%) | 747 (6.2%) |
| 5 to 9 Years | 514 (3.9%) | 581 (4.8%) |
| 10 to 14 Years | 1,349 (10.2%) | 747 (6.2%) |
| 15 to 19 Years | 1,332 (10.1%) | 1,178 (9.8%) |
| 20 to 24 Years | 2,033 (15.4%) | 2,052 (17.0%) |
| 25 to 29 Years | 1,314 (10.0%) | 1,031 (8.6%) |
| 30 to 34 Years | 861 (6.5%) | 728 (6.0%) |
| 35 to 39 Years | 664 (5.0%) | 777 (6.4%) |
| 40 to 44 Years | 766 (5.8%) | 539 (4.5%) |
| 45 to 49 Years | 621 (4.7%) | 560 (4.6%) |
| 50 to 54 Years | 573 (4.3%) | 537 (4.4%) |
| 55 to 59 Years | 376 (2.9%) | 560 (4.6%) |
| 60 to 64 Years | 522 (4.0%) | 350 (2.9%) |
| 65 to 69 Years | 220 (1.7%) | 495 (4.1%) |
| 70 to 74 Years | 548 (4.2%) | 397 (3.3%) |
| 75 to 79 Years | 177 (1.3%) | 202 (1.7%) |
| 80 to 84 Years | 145 (1.1%) | 310 (2.6%) |
| 85 Years and over | 203 (1.5%) | 269 (2.2%) |
| Total | 13,205 (100.0%) | 12,060 (100.0%) |
Families and Households in Kingsville
Median Family Size in Kingsville
The median family size in Kingsville is 3.01 persons per family, with married-couple families (3,327 | 57.8%) accounting for the largest median family size of 3.17 persons per family. On the other hand, single male/father families (607 | 10.5%) represent the smallest median family size with 2.44 persons per family.
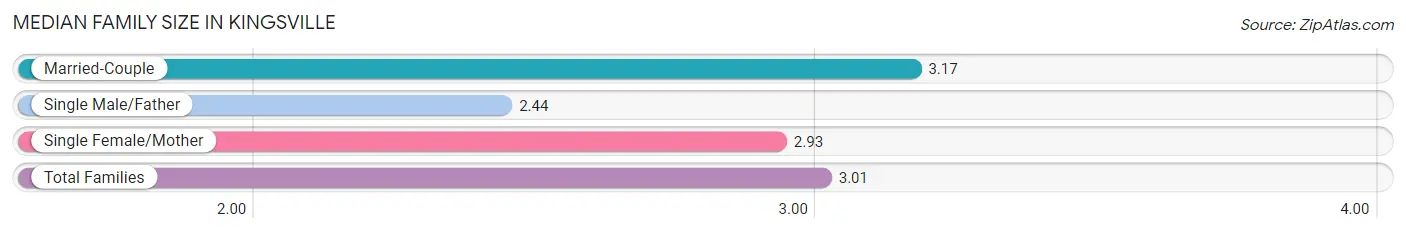
| Family Type | # Families | Family Size |
| Married-Couple | 3,327 (57.8%) | 3.17 |
| Single Male/Father | 607 (10.5%) | 2.44 |
| Single Female/Mother | 1,820 (31.6%) | 2.93 |
| Total Families | 5,754 (100.0%) | 3.01 |
Median Household Size in Kingsville
The median household size in Kingsville is 2.38 persons per household, with married-couple households (3,327 | 33.6%) accounting for the largest median household size of 3.18 persons per household. non-family households (4,146 | 41.9%) represent the smallest median household size with 1.35 persons per household.
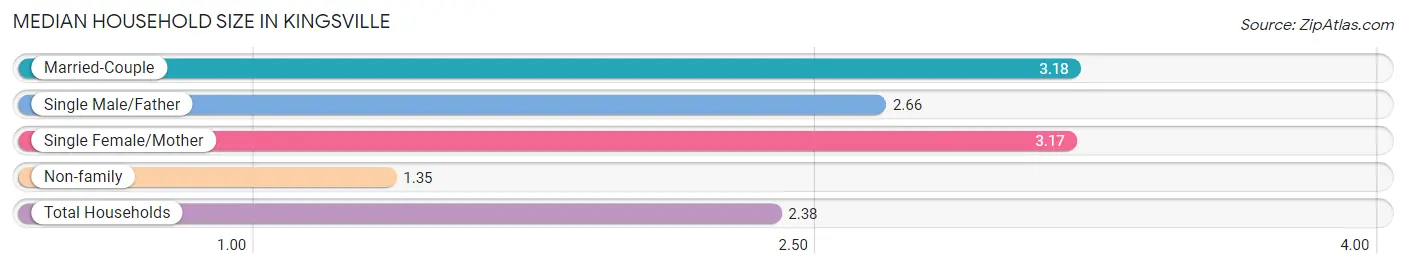
| Household Type | # Households | Household Size |
| Married-Couple | 3,327 (33.6%) | 3.18 |
| Single Male/Father | 607 (6.1%) | 2.66 |
| Single Female/Mother | 1,820 (18.4%) | 3.17 |
| Non-family | 4,146 (41.9%) | 1.35 |
| Total Households | 9,900 (100.0%) | 2.38 |
Household Size by Marriage Status in Kingsville
Out of a total of 9,900 households in Kingsville, 5,754 (58.1%) are family households, while 4,146 (41.9%) are nonfamily households. The most numerous type of family households are 2-person households, comprising 2,199, and the most common type of nonfamily households are 1-person households, comprising 2,883.
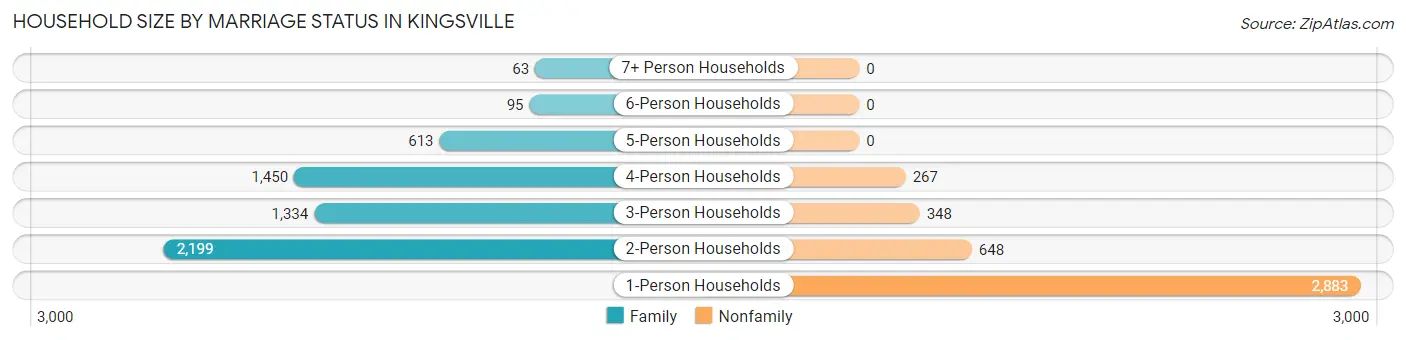
| Household Size | Family Households | Nonfamily Households |
| 1-Person Households | - | 2,883 (29.1%) |
| 2-Person Households | 2,199 (22.2%) | 648 (6.6%) |
| 3-Person Households | 1,334 (13.5%) | 348 (3.5%) |
| 4-Person Households | 1,450 (14.6%) | 267 (2.7%) |
| 5-Person Households | 613 (6.2%) | 0 (0.0%) |
| 6-Person Households | 95 (1.0%) | 0 (0.0%) |
| 7+ Person Households | 63 (0.6%) | 0 (0.0%) |
| Total | 5,754 (58.1%) | 4,146 (41.9%) |
Female Fertility in Kingsville
Fertility by Age in Kingsville
Average fertility rate in Kingsville is 34.0 births per 1,000 women. Women in the age bracket of 20 to 34 years have the highest fertility rate with 42.0 births per 1,000 women. Women in the age bracket of 20 to 34 years acount for 67.4% of all women with births.
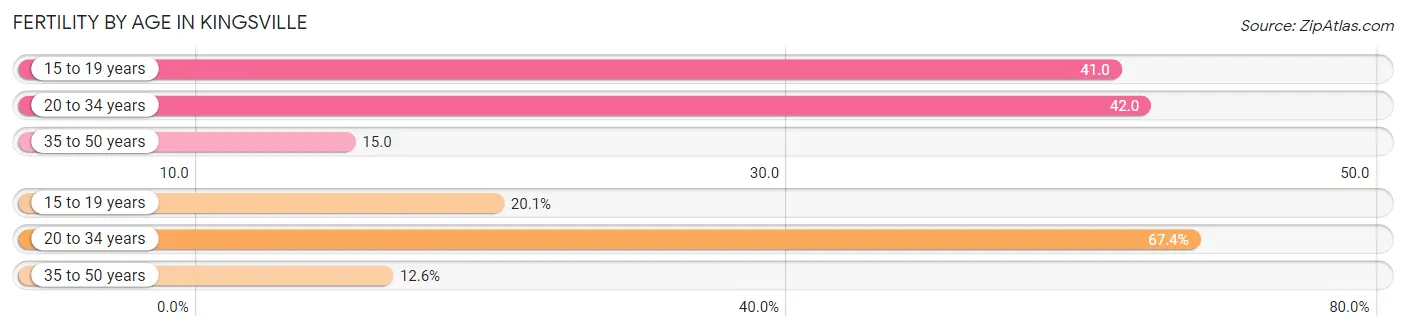
| Age Bracket | Women with Births | Births / 1,000 Women |
| 15 to 19 years | 48 (20.1%) | 41.0 |
| 20 to 34 years | 161 (67.4%) | 42.0 |
| 35 to 50 years | 30 (12.6%) | 15.0 |
| Total | 239 (100.0%) | 34.0 |
Fertility by Age by Marriage Status in Kingsville
53.1% of women with births (239) in Kingsville are married. The highest percentage of unmarried women with births falls into 15 to 19 years age bracket with 100.0% of them unmarried at the time of birth, while the lowest percentage of unmarried women with births belong to 35 to 50 years age bracket with 0.0% of them unmarried.
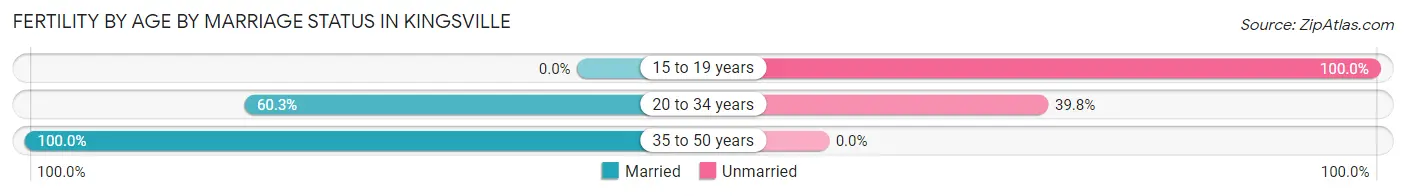
| Age Bracket | Married | Unmarried |
| 15 to 19 years | 0 (0.0%) | 48 (100.0%) |
| 20 to 34 years | 97 (60.3%) | 64 (39.8%) |
| 35 to 50 years | 30 (100.0%) | 0 (0.0%) |
| Total | 127 (53.1%) | 112 (46.9%) |
Fertility by Education in Kingsville
Average fertility rate in Kingsville is 34.0 births per 1,000 women. Women with the education attainment of bachelor's degree have the highest fertility rate of 52.0 births per 1,000 women, while women with the education attainment of college or associate's degree have the lowest fertility at 24.0 births per 1,000 women. Women with the education attainment of college or associate's degree represent 31.0% of all women with births.
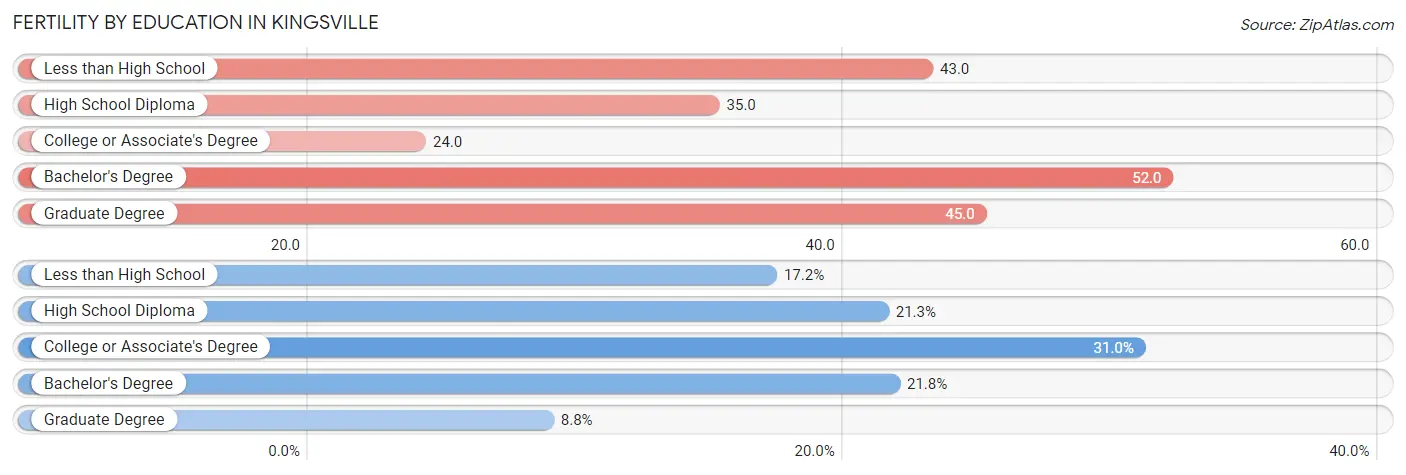
| Educational Attainment | Women with Births | Births / 1,000 Women |
| Less than High School | 41 (17.2%) | 43.0 |
| High School Diploma | 51 (21.3%) | 35.0 |
| College or Associate's Degree | 74 (31.0%) | 24.0 |
| Bachelor's Degree | 52 (21.8%) | 52.0 |
| Graduate Degree | 21 (8.8%) | 45.0 |
| Total | 239 (100.0%) | 34.0 |
Fertility by Education by Marriage Status in Kingsville
46.9% of women with births in Kingsville are unmarried. Women with the educational attainment of less than high school are most likely to be married with 100.0% of them married at childbirth, while women with the educational attainment of high school diploma are least likely to be married with 100.0% of them unmarried at childbirth.
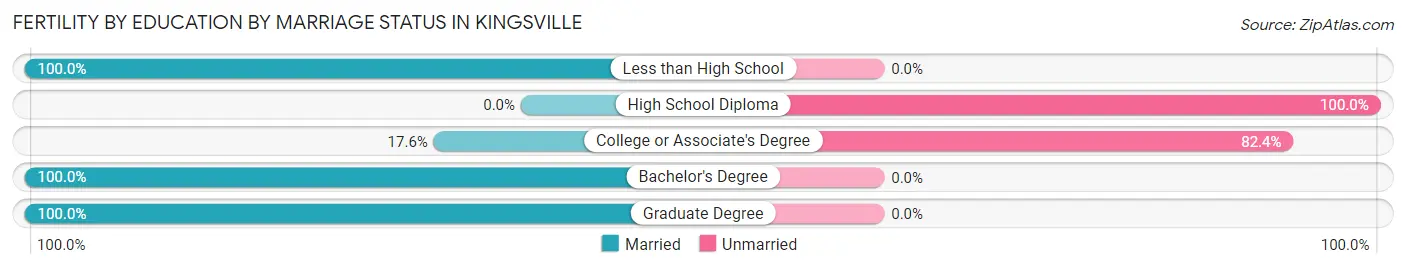
| Educational Attainment | Married | Unmarried |
| Less than High School | 41 (100.0%) | 0 (0.0%) |
| High School Diploma | 0 (0.0%) | 51 (100.0%) |
| College or Associate's Degree | 13 (17.6%) | 61 (82.4%) |
| Bachelor's Degree | 52 (100.0%) | 0 (0.0%) |
| Graduate Degree | 21 (100.0%) | 0 (0.0%) |
| Total | 127 (53.1%) | 112 (46.9%) |
Employment Characteristics in Kingsville
Employment by Class of Employer in Kingsville
Among the 11,212 employed individuals in Kingsville, private company employees (6,638 | 59.2%), state government employees (1,396 | 12.4%), and local government employees (1,024 | 9.1%) make up the most common classes of employment.
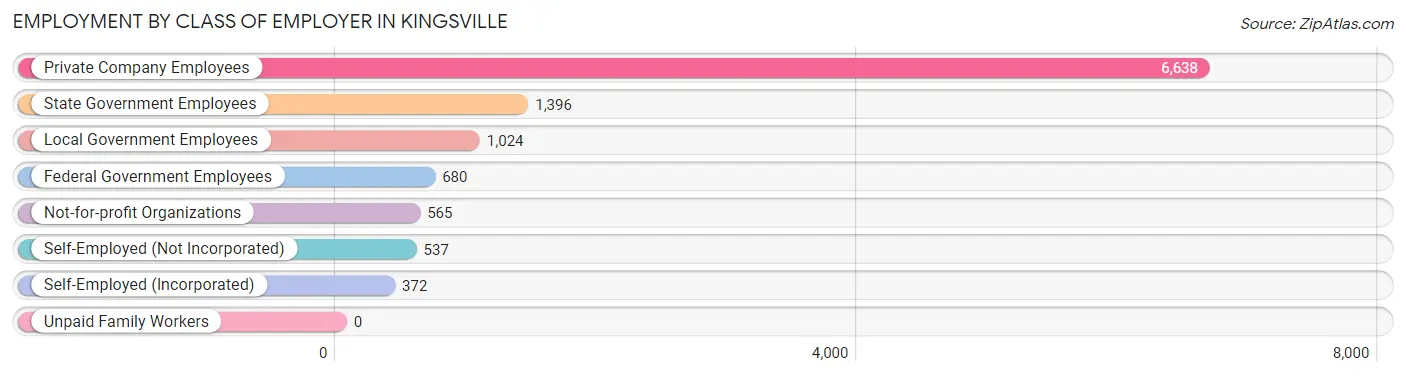
| Employer Class | # Employees | % Employees |
| Private Company Employees | 6,638 | 59.2% |
| Self-Employed (Incorporated) | 372 | 3.3% |
| Self-Employed (Not Incorporated) | 537 | 4.8% |
| Not-for-profit Organizations | 565 | 5.0% |
| Local Government Employees | 1,024 | 9.1% |
| State Government Employees | 1,396 | 12.4% |
| Federal Government Employees | 680 | 6.1% |
| Unpaid Family Workers | 0 | 0.0% |
| Total | 11,212 | 100.0% |
Employment Status by Age in Kingsville
According to the labor force statistics for Kingsville, out of the total population over 16 years of age (20,048), 61.4% or 12,309 individuals are in the labor force, with 8.2% or 1,009 of them unemployed. The age group with the highest labor force participation rate is 30 to 34 years, with 85.7% or 1,362 individuals in the labor force. Within the labor force, the 16 to 19 years age range has the highest percentage of unemployed individuals, with 30.2% or 211 of them being unemployed.
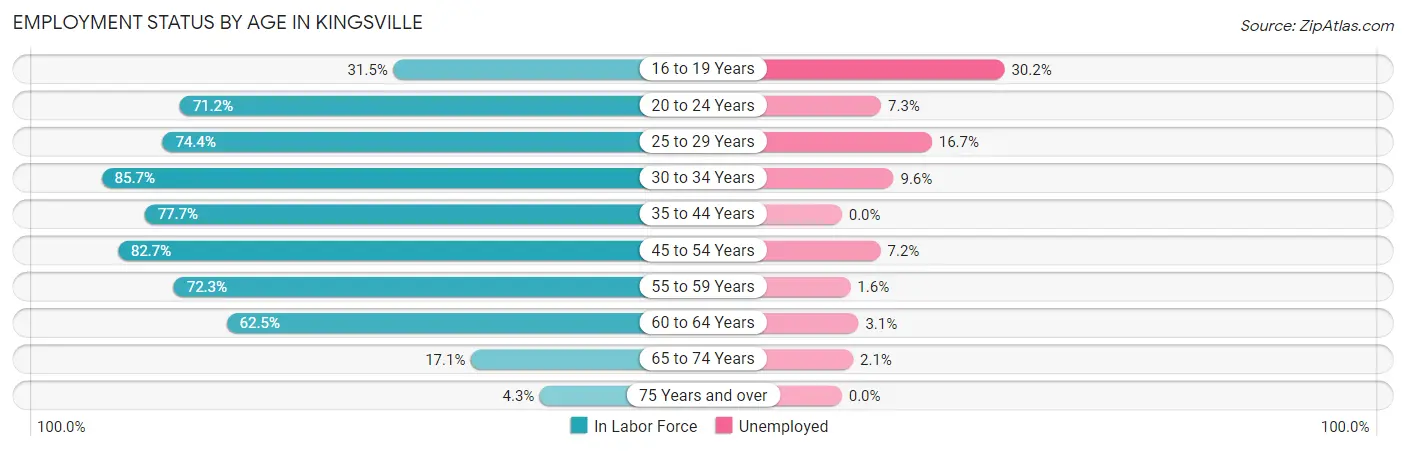
| Age Bracket | In Labor Force | Unemployed |
| 16 to 19 Years | 699 (31.5%) | 211 (30.2%) |
| 20 to 24 Years | 2,909 (71.2%) | 212 (7.3%) |
| 25 to 29 Years | 1,745 (74.4%) | 291 (16.7%) |
| 30 to 34 Years | 1,362 (85.7%) | 131 (9.6%) |
| 35 to 44 Years | 2,134 (77.7%) | 0 (0.0%) |
| 45 to 54 Years | 1,895 (82.7%) | 136 (7.2%) |
| 55 to 59 Years | 677 (72.3%) | 11 (1.6%) |
| 60 to 64 Years | 545 (62.5%) | 17 (3.1%) |
| 65 to 74 Years | 284 (17.1%) | 6 (2.1%) |
| 75 Years and over | 56 (4.3%) | 0 (0.0%) |
| Total | 12,309 (61.4%) | 1,009 (8.2%) |
Employment Status by Educational Attainment in Kingsville
According to labor force statistics for Kingsville, 77.5% of individuals (8,354) out of the total population between 25 and 64 years of age (10,779) are in the labor force, with 6.8% or 568 of them being unemployed. The group with the highest labor force participation rate are those with the educational attainment of bachelor's degree or higher, with 84.0% or 2,237 individuals in the labor force. Within the labor force, individuals with high school diploma education have the highest percentage of unemployment, with 10.5% or 302 of them being unemployed.
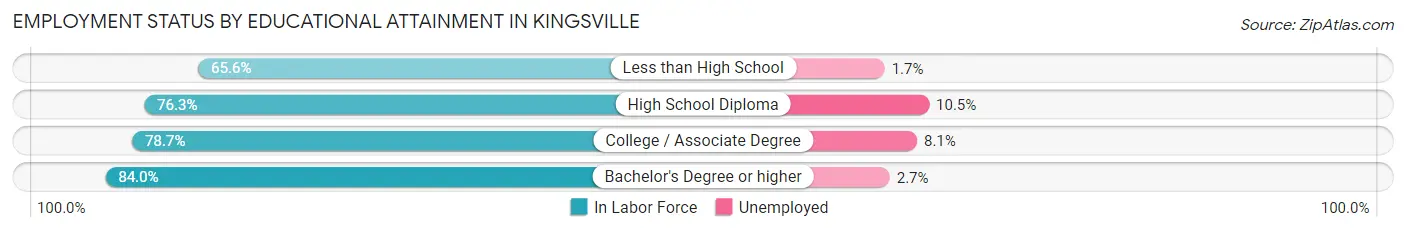
| Educational Attainment | In Labor Force | Unemployed |
| Less than High School | 887 (65.6%) | 23 (1.7%) |
| High School Diploma | 2,875 (76.3%) | 396 (10.5%) |
| College / Associate Degree | 2,358 (78.7%) | 243 (8.1%) |
| Bachelor's Degree or higher | 2,237 (84.0%) | 72 (2.7%) |
| Total | 8,354 (77.5%) | 733 (6.8%) |
Employment Occupations by Sex in Kingsville
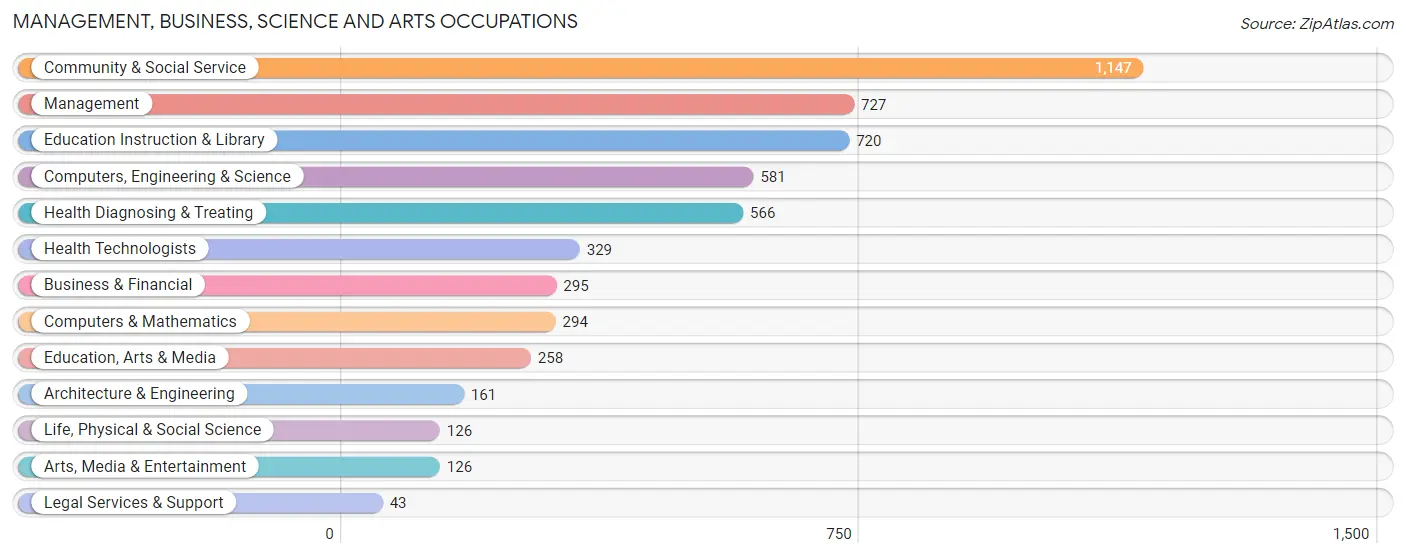
Management, Business, Science and Arts Occupations
The most common Management, Business, Science and Arts occupations in Kingsville are Community & Social Service (1,147 | 10.4%), Management (727 | 6.6%), Education Instruction & Library (720 | 6.5%), Computers, Engineering & Science (581 | 5.3%), and Health Diagnosing & Treating (566 | 5.1%).
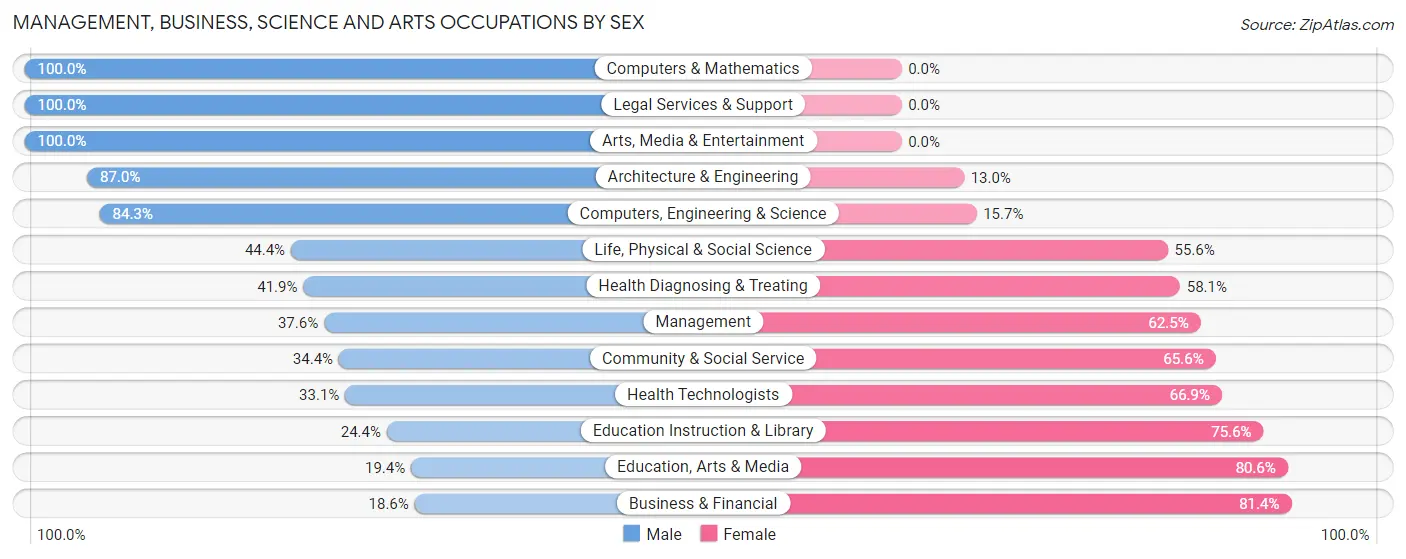
Management, Business, Science and Arts Occupations by Sex
Within the Management, Business, Science and Arts occupations in Kingsville, the most male-oriented occupations are Computers & Mathematics (100.0%), Legal Services & Support (100.0%), and Arts, Media & Entertainment (100.0%), while the most female-oriented occupations are Business & Financial (81.4%), Education, Arts & Media (80.6%), and Education Instruction & Library (75.6%).
| Occupation | Male | Female |
| Management | 273 (37.6%) | 454 (62.5%) |
| Business & Financial | 55 (18.6%) | 240 (81.4%) |
| Computers, Engineering & Science | 490 (84.3%) | 91 (15.7%) |
| Computers & Mathematics | 294 (100.0%) | 0 (0.0%) |
| Architecture & Engineering | 140 (87.0%) | 21 (13.0%) |
| Life, Physical & Social Science | 56 (44.4%) | 70 (55.6%) |
| Community & Social Service | 395 (34.4%) | 752 (65.6%) |
| Education, Arts & Media | 50 (19.4%) | 208 (80.6%) |
| Legal Services & Support | 43 (100.0%) | 0 (0.0%) |
| Education Instruction & Library | 176 (24.4%) | 544 (75.6%) |
| Arts, Media & Entertainment | 126 (100.0%) | 0 (0.0%) |
| Health Diagnosing & Treating | 237 (41.9%) | 329 (58.1%) |
| Health Technologists | 109 (33.1%) | 220 (66.9%) |
| Total (Category) | 1,450 (43.7%) | 1,866 (56.3%) |
| Total (Overall) | 5,916 (53.6%) | 5,129 (46.4%) |
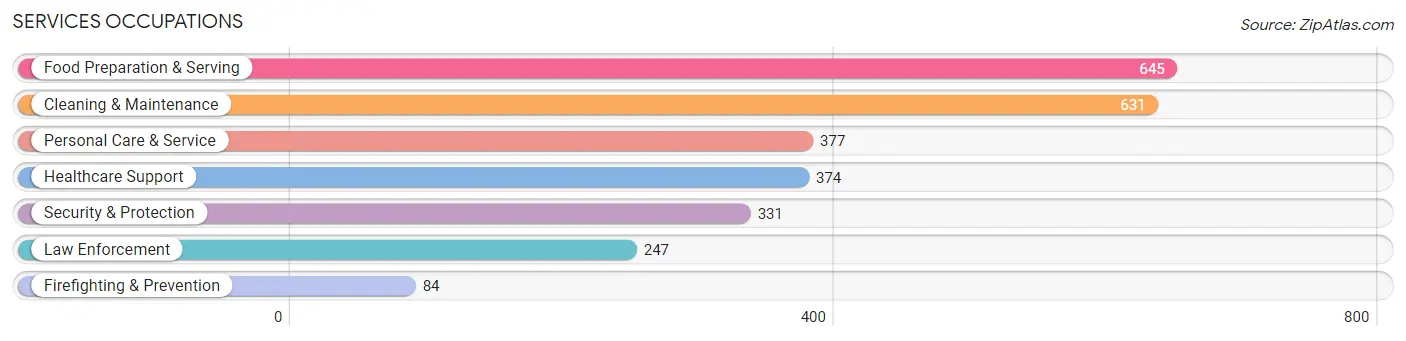
Services Occupations
The most common Services occupations in Kingsville are Food Preparation & Serving (645 | 5.8%), Cleaning & Maintenance (631 | 5.7%), Personal Care & Service (377 | 3.4%), Healthcare Support (374 | 3.4%), and Security & Protection (331 | 3.0%).
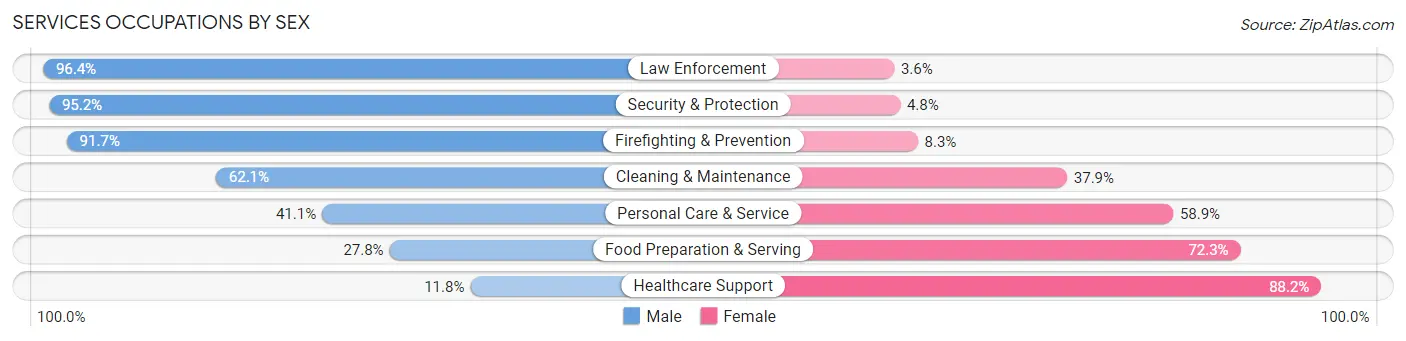
Services Occupations by Sex
Within the Services occupations in Kingsville, the most male-oriented occupations are Law Enforcement (96.4%), Security & Protection (95.2%), and Firefighting & Prevention (91.7%), while the most female-oriented occupations are Healthcare Support (88.2%), Food Preparation & Serving (72.3%), and Personal Care & Service (58.9%).
| Occupation | Male | Female |
| Healthcare Support | 44 (11.8%) | 330 (88.2%) |
| Security & Protection | 315 (95.2%) | 16 (4.8%) |
| Firefighting & Prevention | 77 (91.7%) | 7 (8.3%) |
| Law Enforcement | 238 (96.4%) | 9 (3.6%) |
| Food Preparation & Serving | 179 (27.8%) | 466 (72.3%) |
| Cleaning & Maintenance | 392 (62.1%) | 239 (37.9%) |
| Personal Care & Service | 155 (41.1%) | 222 (58.9%) |
| Total (Category) | 1,085 (46.0%) | 1,273 (54.0%) |
| Total (Overall) | 5,916 (53.6%) | 5,129 (46.4%) |
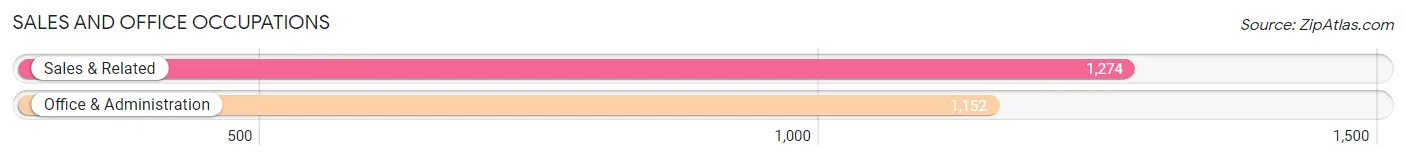
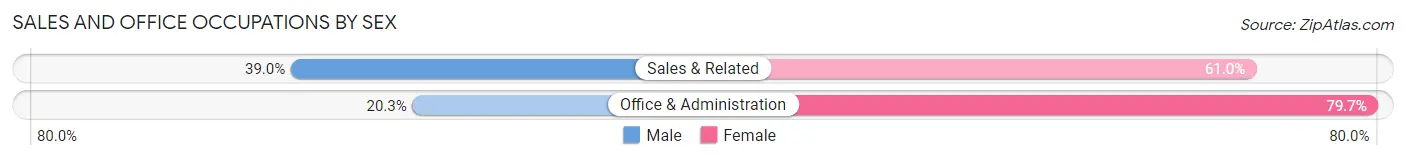
Sales and Office Occupations
The most common Sales and Office occupations in Kingsville are Sales & Related (1,274 | 11.5%), and Office & Administration (1,152 | 10.4%).
Sales and Office Occupations by Sex
| Occupation | Male | Female |
| Sales & Related | 497 (39.0%) | 777 (61.0%) |
| Office & Administration | 234 (20.3%) | 918 (79.7%) |
| Total (Category) | 731 (30.1%) | 1,695 (69.9%) |
| Total (Overall) | 5,916 (53.6%) | 5,129 (46.4%) |
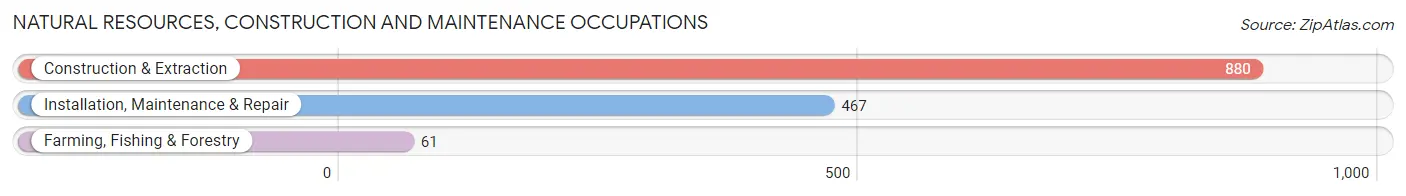
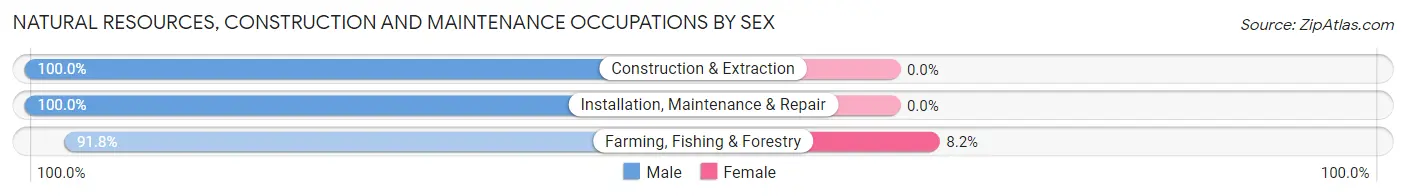
Natural Resources, Construction and Maintenance Occupations
The most common Natural Resources, Construction and Maintenance occupations in Kingsville are Construction & Extraction (880 | 8.0%), Installation, Maintenance & Repair (467 | 4.2%), and Farming, Fishing & Forestry (61 | 0.5%).
Natural Resources, Construction and Maintenance Occupations by Sex
| Occupation | Male | Female |
| Farming, Fishing & Forestry | 56 (91.8%) | 5 (8.2%) |
| Construction & Extraction | 880 (100.0%) | 0 (0.0%) |
| Installation, Maintenance & Repair | 467 (100.0%) | 0 (0.0%) |
| Total (Category) | 1,403 (99.6%) | 5 (0.4%) |
| Total (Overall) | 5,916 (53.6%) | 5,129 (46.4%) |
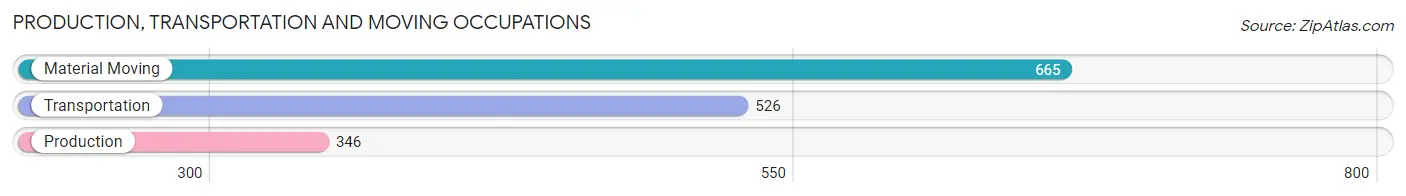
Production, Transportation and Moving Occupations
The most common Production, Transportation and Moving occupations in Kingsville are Material Moving (665 | 6.0%), Transportation (526 | 4.8%), and Production (346 | 3.1%).
Production, Transportation and Moving Occupations by Sex
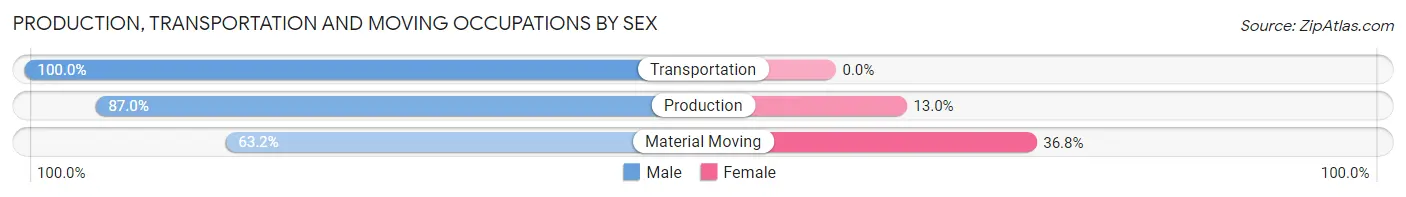
| Occupation | Male | Female |
| Production | 301 (87.0%) | 45 (13.0%) |
| Transportation | 526 (100.0%) | 0 (0.0%) |
| Material Moving | 420 (63.2%) | 245 (36.8%) |
| Total (Category) | 1,247 (81.1%) | 290 (18.9%) |
| Total (Overall) | 5,916 (53.6%) | 5,129 (46.4%) |
Employment Industries by Sex in Kingsville
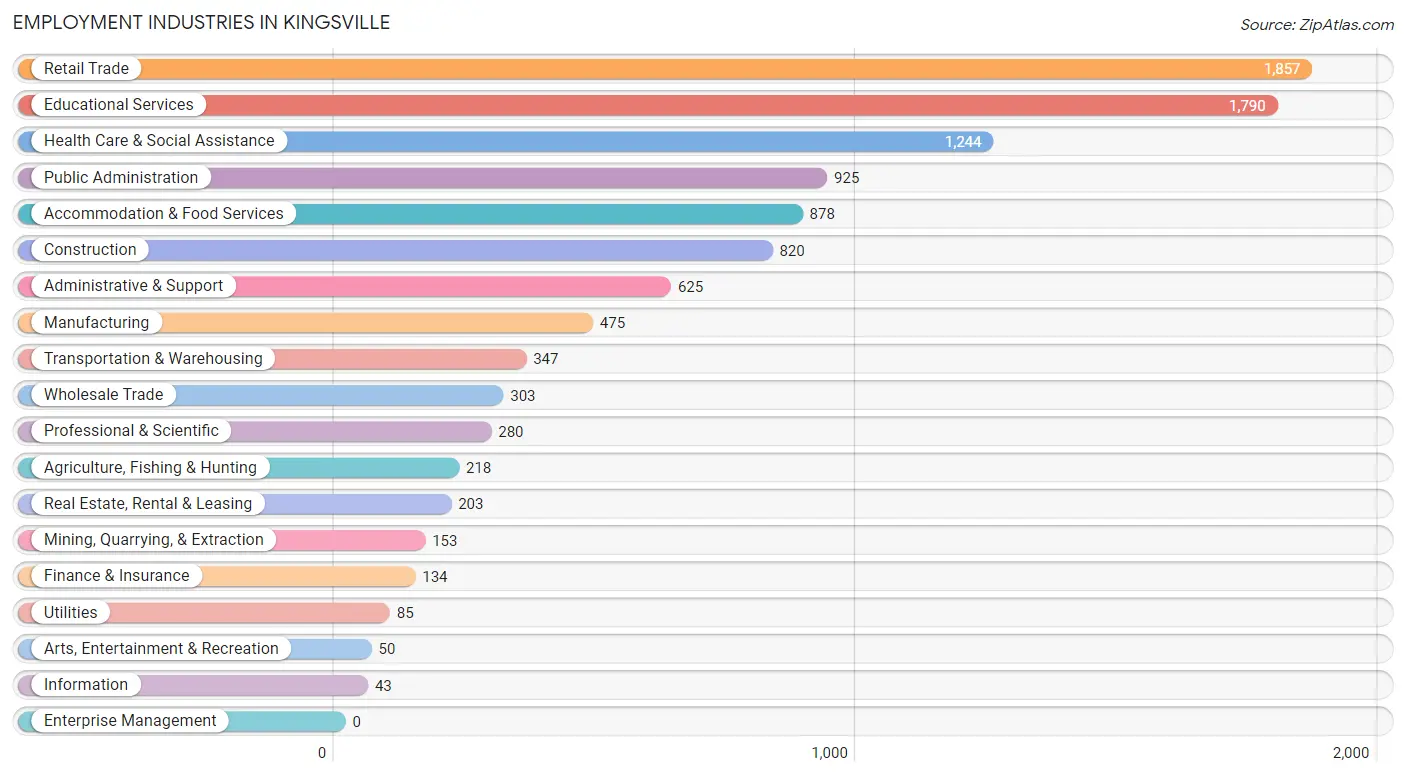
Employment Industries in Kingsville
The major employment industries in Kingsville include Retail Trade (1,857 | 16.8%), Educational Services (1,790 | 16.2%), Health Care & Social Assistance (1,244 | 11.3%), Public Administration (925 | 8.4%), and Accommodation & Food Services (878 | 8.0%).
Employment Industries by Sex in Kingsville
The Kingsville industries that see more men than women are Mining, Quarrying, & Extraction (100.0%), Transportation & Warehousing (100.0%), and Information (100.0%), whereas the industries that tend to have a higher number of women are Health Care & Social Assistance (89.0%), Finance & Insurance (79.8%), and Accommodation & Food Services (66.3%).
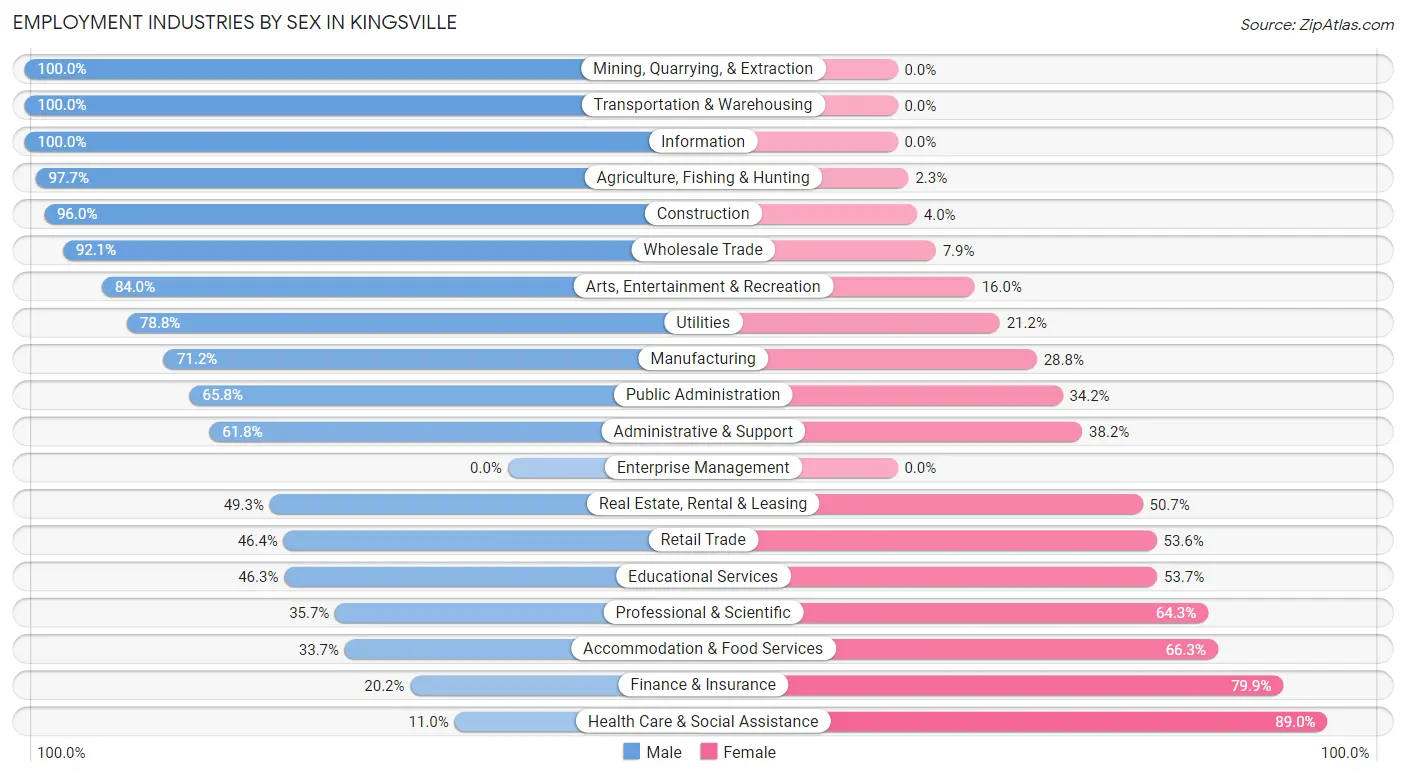
| Industry | Male | Female |
| Agriculture, Fishing & Hunting | 213 (97.7%) | 5 (2.3%) |
| Mining, Quarrying, & Extraction | 153 (100.0%) | 0 (0.0%) |
| Construction | 787 (96.0%) | 33 (4.0%) |
| Manufacturing | 338 (71.2%) | 137 (28.8%) |
| Wholesale Trade | 279 (92.1%) | 24 (7.9%) |
| Retail Trade | 861 (46.4%) | 996 (53.6%) |
| Transportation & Warehousing | 347 (100.0%) | 0 (0.0%) |
| Utilities | 67 (78.8%) | 18 (21.2%) |
| Information | 43 (100.0%) | 0 (0.0%) |
| Finance & Insurance | 27 (20.2%) | 107 (79.8%) |
| Real Estate, Rental & Leasing | 100 (49.3%) | 103 (50.7%) |
| Professional & Scientific | 100 (35.7%) | 180 (64.3%) |
| Enterprise Management | 0 (0.0%) | 0 (0.0%) |
| Administrative & Support | 386 (61.8%) | 239 (38.2%) |
| Educational Services | 828 (46.3%) | 962 (53.7%) |
| Health Care & Social Assistance | 137 (11.0%) | 1,107 (89.0%) |
| Arts, Entertainment & Recreation | 42 (84.0%) | 8 (16.0%) |
| Accommodation & Food Services | 296 (33.7%) | 582 (66.3%) |
| Public Administration | 609 (65.8%) | 316 (34.2%) |
| Total | 5,916 (53.6%) | 5,129 (46.4%) |
Education in Kingsville
School Enrollment in Kingsville
The most common levels of schooling among the 8,411 students in Kingsville are college / undergraduate (4,007 | 47.6%), middle school (1,736 | 20.6%), and high school (911 | 10.8%).
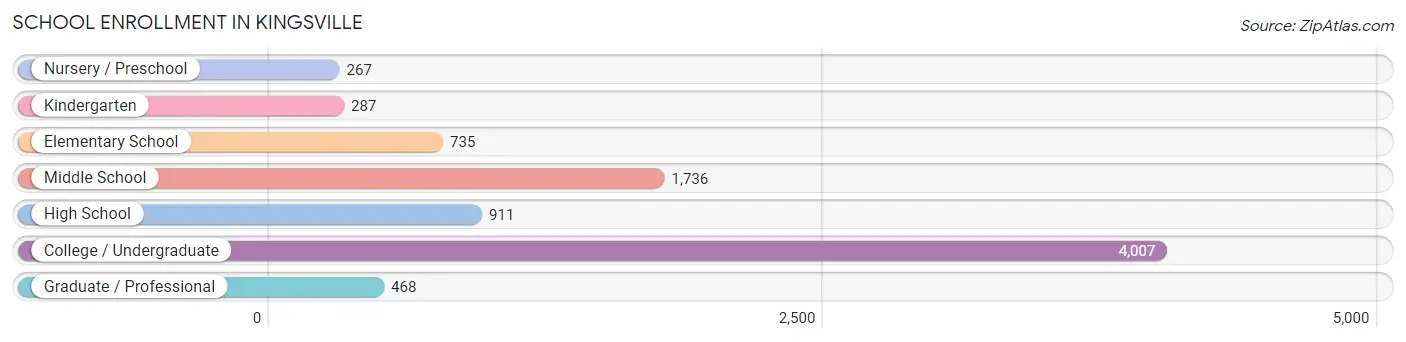
| School Level | # Students | % Students |
| Nursery / Preschool | 267 | 3.2% |
| Kindergarten | 287 | 3.4% |
| Elementary School | 735 | 8.7% |
| Middle School | 1,736 | 20.6% |
| High School | 911 | 10.8% |
| College / Undergraduate | 4,007 | 47.6% |
| Graduate / Professional | 468 | 5.6% |
| Total | 8,411 | 100.0% |
School Enrollment by Age by Funding Source in Kingsville
Out of a total of 8,411 students who are enrolled in schools in Kingsville, 707 (8.4%) attend a private institution, while the remaining 7,704 (91.6%) are enrolled in public schools. The age group of 3 to 4 year olds has the highest likelihood of being enrolled in private schools, with 84 (28.9% in the age bracket) enrolled. Conversely, the age group of 15 to 17 year olds has the lowest likelihood of being enrolled in a private school, with 842 (100.0% in the age bracket) attending a public institution.
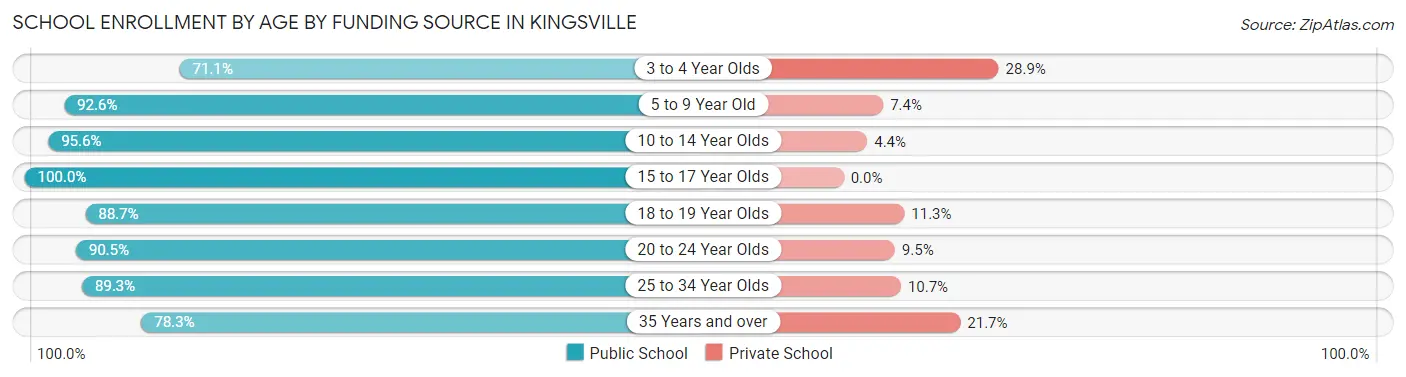
| Age Bracket | Public School | Private School |
| 3 to 4 Year Olds | 207 (71.1%) | 84 (28.9%) |
| 5 to 9 Year Old | 768 (92.6%) | 61 (7.4%) |
| 10 to 14 Year Olds | 1,803 (95.6%) | 83 (4.4%) |
| 15 to 17 Year Olds | 842 (100.0%) | 0 (0.0%) |
| 18 to 19 Year Olds | 1,082 (88.7%) | 138 (11.3%) |
| 20 to 24 Year Olds | 2,437 (90.5%) | 257 (9.5%) |
| 25 to 34 Year Olds | 477 (89.3%) | 57 (10.7%) |
| 35 Years and over | 90 (78.3%) | 25 (21.7%) |
| Total | 7,704 (91.6%) | 707 (8.4%) |
Educational Attainment by Field of Study in Kingsville
Business (498 | 15.5%), education (405 | 12.6%), science & technology (335 | 10.4%), bio, nature & agricultural (334 | 10.4%), and arts & humanities (277 | 8.6%) are the most common fields of study among 3,213 individuals in Kingsville who have obtained a bachelor's degree or higher.
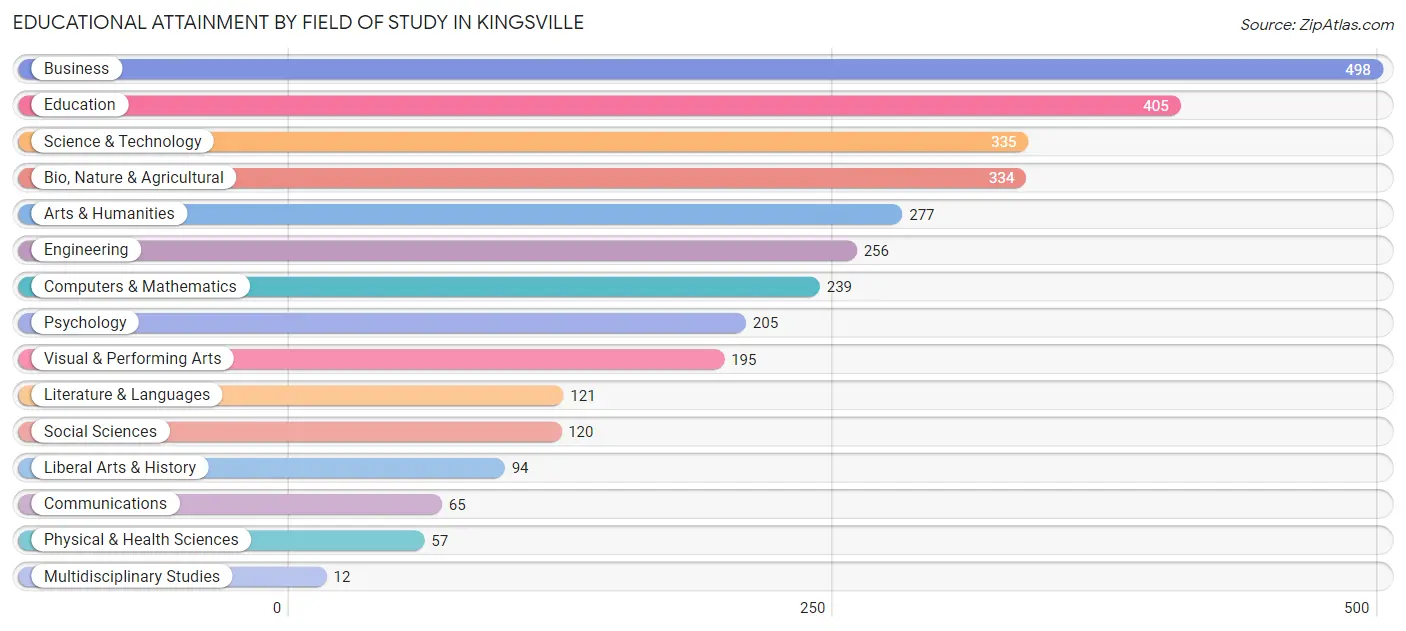
| Field of Study | # Graduates | % Graduates |
| Computers & Mathematics | 239 | 7.4% |
| Bio, Nature & Agricultural | 334 | 10.4% |
| Physical & Health Sciences | 57 | 1.8% |
| Psychology | 205 | 6.4% |
| Social Sciences | 120 | 3.7% |
| Engineering | 256 | 8.0% |
| Multidisciplinary Studies | 12 | 0.4% |
| Science & Technology | 335 | 10.4% |
| Business | 498 | 15.5% |
| Education | 405 | 12.6% |
| Literature & Languages | 121 | 3.8% |
| Liberal Arts & History | 94 | 2.9% |
| Visual & Performing Arts | 195 | 6.1% |
| Communications | 65 | 2.0% |
| Arts & Humanities | 277 | 8.6% |
| Total | 3,213 | 100.0% |
Transportation & Commute in Kingsville
Vehicle Availability by Sex in Kingsville
The most prevalent vehicle ownership categories in Kingsville are males with 2 vehicles (2,606, accounting for 44.5%) and females with 2 vehicles (2,216, making up 52.8%).
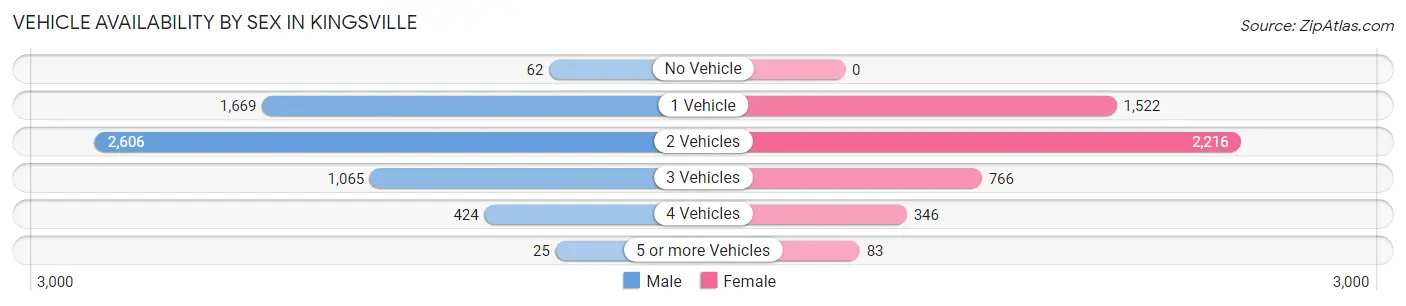
| Vehicles Available | Male | Female |
| No Vehicle | 62 (1.1%) | 0 (0.0%) |
| 1 Vehicle | 1,669 (28.5%) | 1,522 (30.8%) |
| 2 Vehicles | 2,606 (44.5%) | 2,216 (44.9%) |
| 3 Vehicles | 1,065 (18.2%) | 766 (15.5%) |
| 4 Vehicles | 424 (7.2%) | 346 (7.0%) |
| 5 or more Vehicles | 25 (0.4%) | 83 (1.7%) |
| Total | 5,851 (100.0%) | 4,933 (100.0%) |
Commute Time in Kingsville
The most frequently occuring commute durations in Kingsville are 5 to 9 minutes (2,931 commuters, 27.6%), 10 to 14 minutes (2,558 commuters, 24.0%), and 15 to 19 minutes (1,656 commuters, 15.6%).
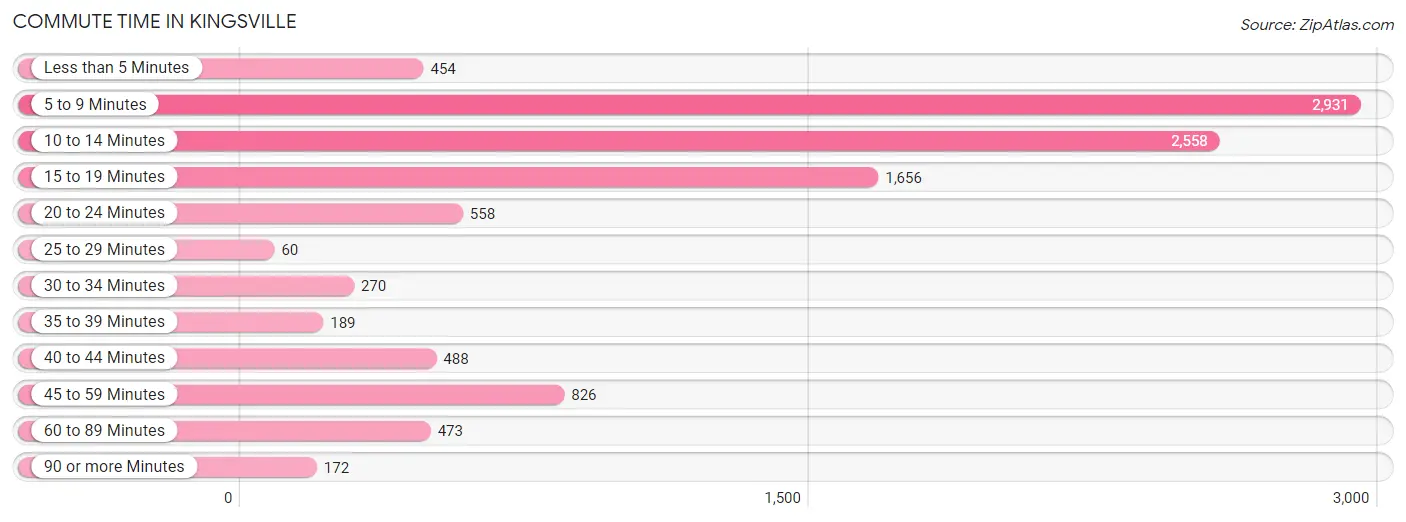
| Commute Time | # Commuters | % Commuters |
| Less than 5 Minutes | 454 | 4.3% |
| 5 to 9 Minutes | 2,931 | 27.6% |
| 10 to 14 Minutes | 2,558 | 24.0% |
| 15 to 19 Minutes | 1,656 | 15.6% |
| 20 to 24 Minutes | 558 | 5.2% |
| 25 to 29 Minutes | 60 | 0.6% |
| 30 to 34 Minutes | 270 | 2.5% |
| 35 to 39 Minutes | 189 | 1.8% |
| 40 to 44 Minutes | 488 | 4.6% |
| 45 to 59 Minutes | 826 | 7.8% |
| 60 to 89 Minutes | 473 | 4.4% |
| 90 or more Minutes | 172 | 1.6% |
Commute Time by Sex in Kingsville
The most common commute times in Kingsville are 10 to 14 minutes (1,397 commuters, 23.4%) for males and 5 to 9 minutes (1,575 commuters, 33.7%) for females.
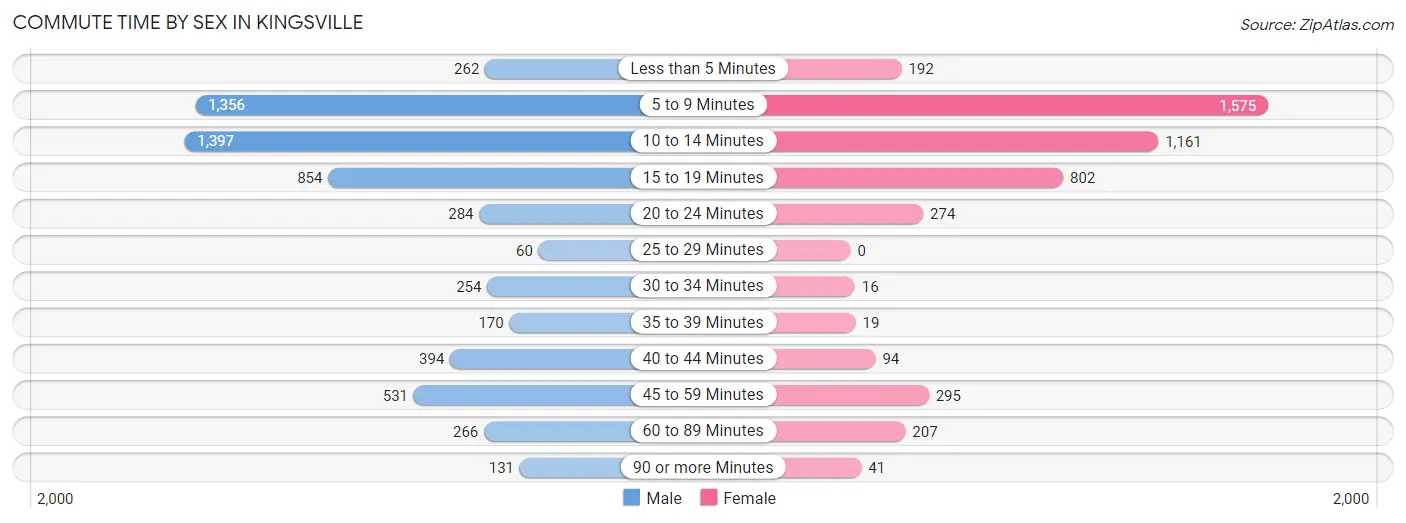
| Commute Time | Male | Female |
| Less than 5 Minutes | 262 (4.4%) | 192 (4.1%) |
| 5 to 9 Minutes | 1,356 (22.8%) | 1,575 (33.7%) |
| 10 to 14 Minutes | 1,397 (23.4%) | 1,161 (24.8%) |
| 15 to 19 Minutes | 854 (14.3%) | 802 (17.2%) |
| 20 to 24 Minutes | 284 (4.8%) | 274 (5.9%) |
| 25 to 29 Minutes | 60 (1.0%) | 0 (0.0%) |
| 30 to 34 Minutes | 254 (4.3%) | 16 (0.3%) |
| 35 to 39 Minutes | 170 (2.9%) | 19 (0.4%) |
| 40 to 44 Minutes | 394 (6.6%) | 94 (2.0%) |
| 45 to 59 Minutes | 531 (8.9%) | 295 (6.3%) |
| 60 to 89 Minutes | 266 (4.5%) | 207 (4.4%) |
| 90 or more Minutes | 131 (2.2%) | 41 (0.9%) |
Time of Departure to Work by Sex in Kingsville
The most frequent times of departure to work in Kingsville are 8:00 AM to 8:29 AM (1,038, 17.4%) for males and 7:00 AM to 7:29 AM (958, 20.5%) for females.
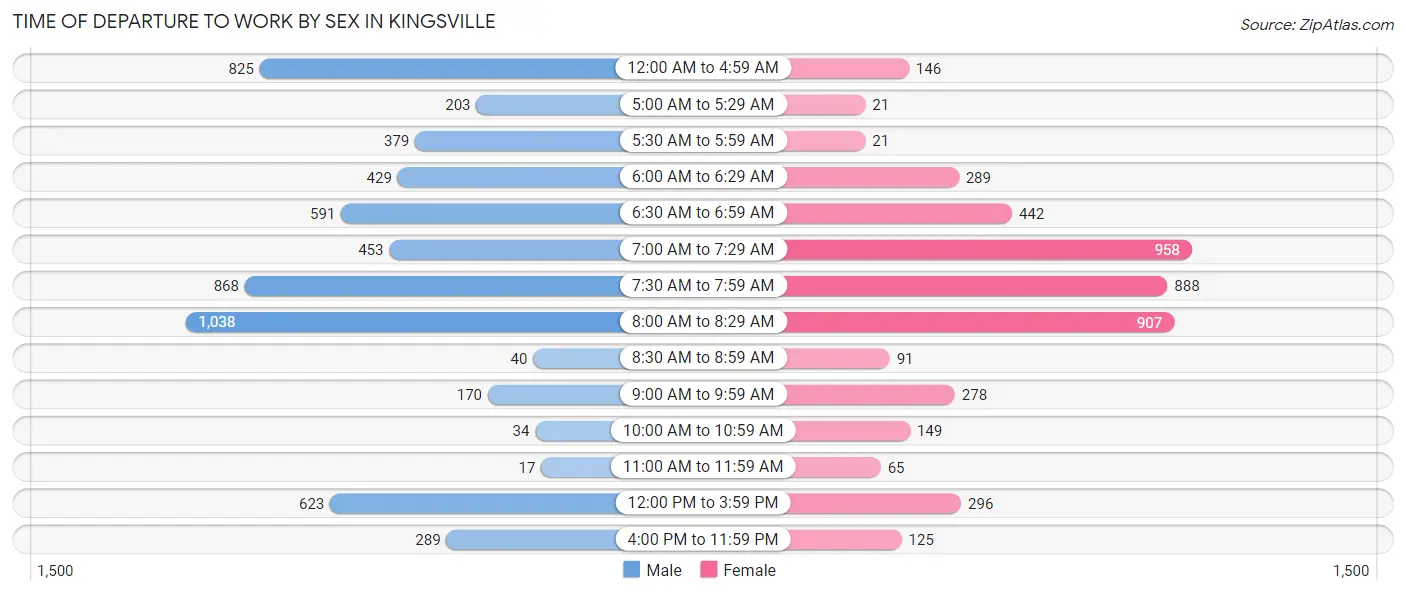
| Time of Departure | Male | Female |
| 12:00 AM to 4:59 AM | 825 (13.8%) | 146 (3.1%) |
| 5:00 AM to 5:29 AM | 203 (3.4%) | 21 (0.4%) |
| 5:30 AM to 5:59 AM | 379 (6.4%) | 21 (0.4%) |
| 6:00 AM to 6:29 AM | 429 (7.2%) | 289 (6.2%) |
| 6:30 AM to 6:59 AM | 591 (9.9%) | 442 (9.5%) |
| 7:00 AM to 7:29 AM | 453 (7.6%) | 958 (20.5%) |
| 7:30 AM to 7:59 AM | 868 (14.6%) | 888 (19.0%) |
| 8:00 AM to 8:29 AM | 1,038 (17.4%) | 907 (19.4%) |
| 8:30 AM to 8:59 AM | 40 (0.7%) | 91 (1.9%) |
| 9:00 AM to 9:59 AM | 170 (2.9%) | 278 (5.9%) |
| 10:00 AM to 10:59 AM | 34 (0.6%) | 149 (3.2%) |
| 11:00 AM to 11:59 AM | 17 (0.3%) | 65 (1.4%) |
| 12:00 PM to 3:59 PM | 623 (10.4%) | 296 (6.3%) |
| 4:00 PM to 11:59 PM | 289 (4.9%) | 125 (2.7%) |
| Total | 5,959 (100.0%) | 4,676 (100.0%) |
Housing Occupancy in Kingsville
Occupancy by Ownership in Kingsville
Of the total 9,900 dwellings in Kingsville, owner-occupied units account for 4,601 (46.5%), while renter-occupied units make up 5,299 (53.5%).
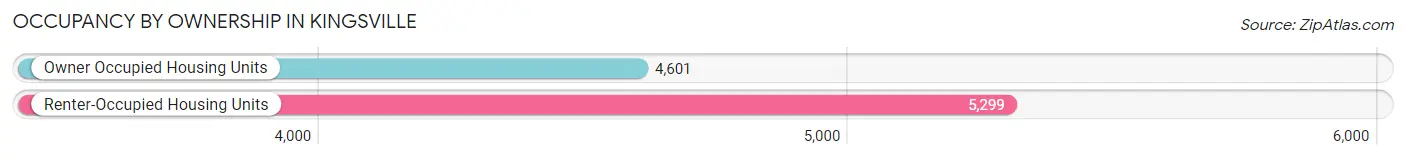
| Occupancy | # Housing Units | % Housing Units |
| Owner Occupied Housing Units | 4,601 | 46.5% |
| Renter-Occupied Housing Units | 5,299 | 53.5% |
| Total Occupied Housing Units | 9,900 | 100.0% |
Occupancy by Household Size in Kingsville
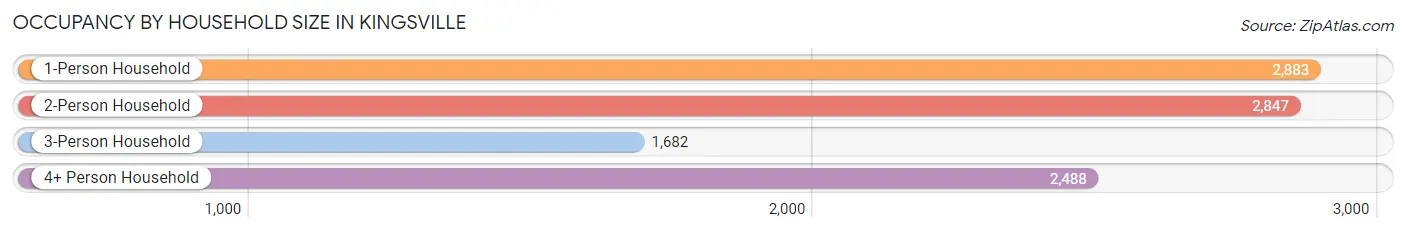
| Household Size | # Housing Units | % Housing Units |
| 1-Person Household | 2,883 | 29.1% |
| 2-Person Household | 2,847 | 28.8% |
| 3-Person Household | 1,682 | 17.0% |
| 4+ Person Household | 2,488 | 25.1% |
| Total Housing Units | 9,900 | 100.0% |
Occupancy by Ownership by Household Size in Kingsville
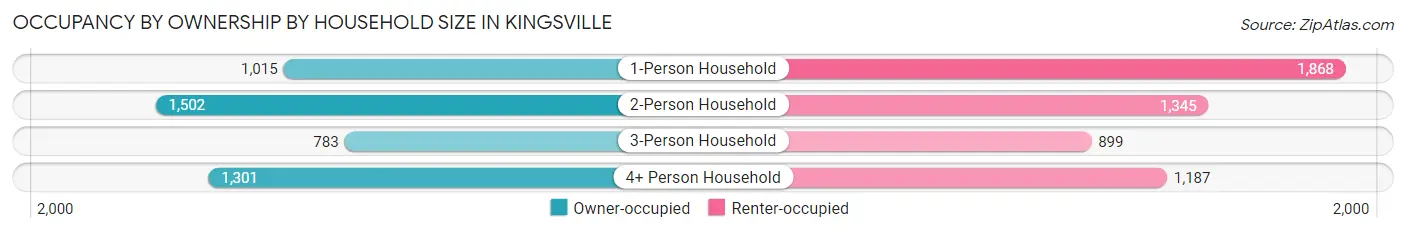
| Household Size | Owner-occupied | Renter-occupied |
| 1-Person Household | 1,015 (35.2%) | 1,868 (64.8%) |
| 2-Person Household | 1,502 (52.8%) | 1,345 (47.2%) |
| 3-Person Household | 783 (46.6%) | 899 (53.4%) |
| 4+ Person Household | 1,301 (52.3%) | 1,187 (47.7%) |
| Total Housing Units | 4,601 (46.5%) | 5,299 (53.5%) |
Occupancy by Educational Attainment in Kingsville
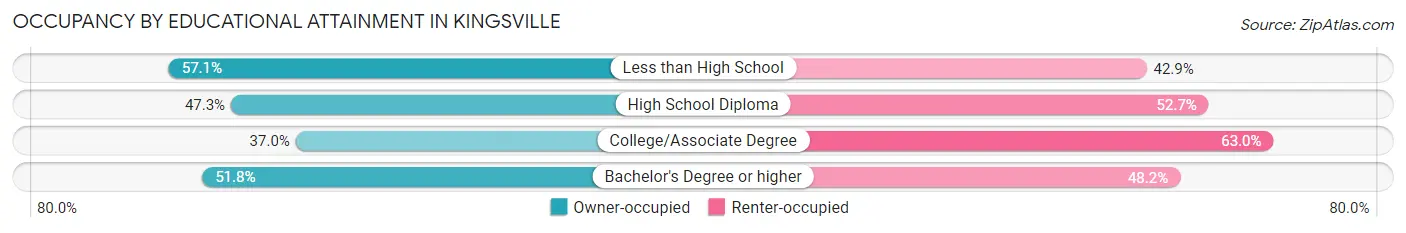
| Household Size | Owner-occupied | Renter-occupied |
| Less than High School | 830 (57.1%) | 623 (42.9%) |
| High School Diploma | 1,489 (47.3%) | 1,661 (52.7%) |
| College/Associate Degree | 1,157 (37.0%) | 1,969 (63.0%) |
| Bachelor's Degree or higher | 1,125 (51.8%) | 1,046 (48.2%) |
Occupancy by Age of Householder in Kingsville
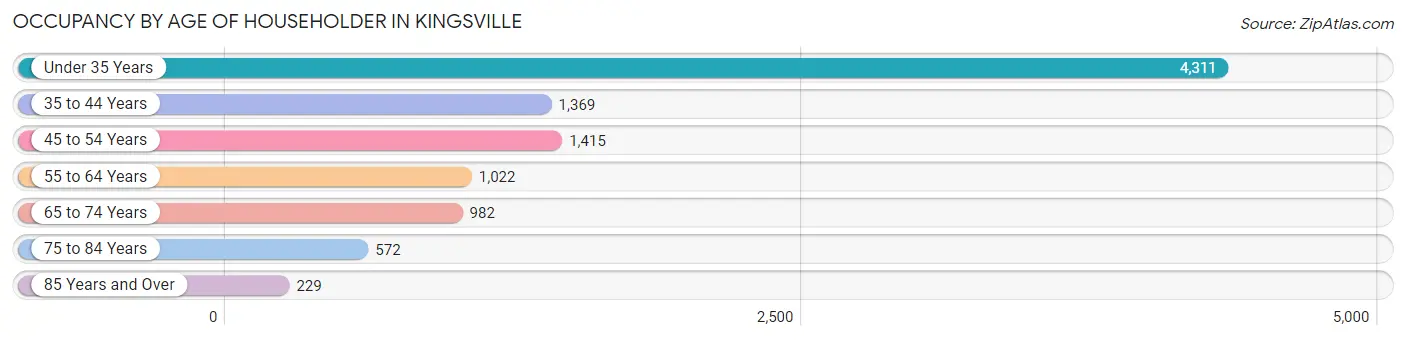
| Age Bracket | # Households | % Households |
| Under 35 Years | 4,311 | 43.5% |
| 35 to 44 Years | 1,369 | 13.8% |
| 45 to 54 Years | 1,415 | 14.3% |
| 55 to 64 Years | 1,022 | 10.3% |
| 65 to 74 Years | 982 | 9.9% |
| 75 to 84 Years | 572 | 5.8% |
| 85 Years and Over | 229 | 2.3% |
| Total | 9,900 | 100.0% |
Housing Finances in Kingsville
Median Income by Occupancy in Kingsville
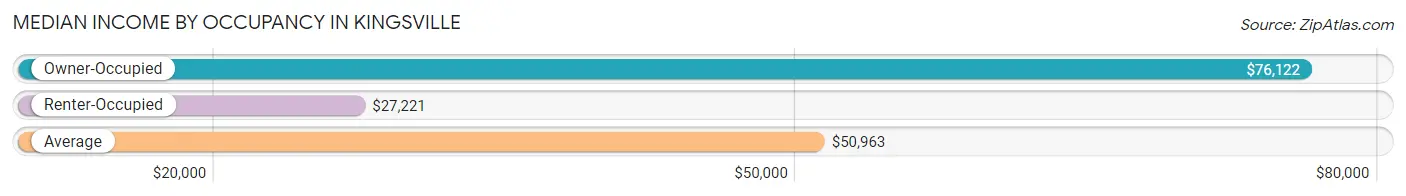
| Occupancy Type | # Households | Median Income |
| Owner-Occupied | 4,601 (46.5%) | $76,122 |
| Renter-Occupied | 5,299 (53.5%) | $27,221 |
| Average | 9,900 (100.0%) | $50,963 |
Occupancy by Householder Income Bracket in Kingsville
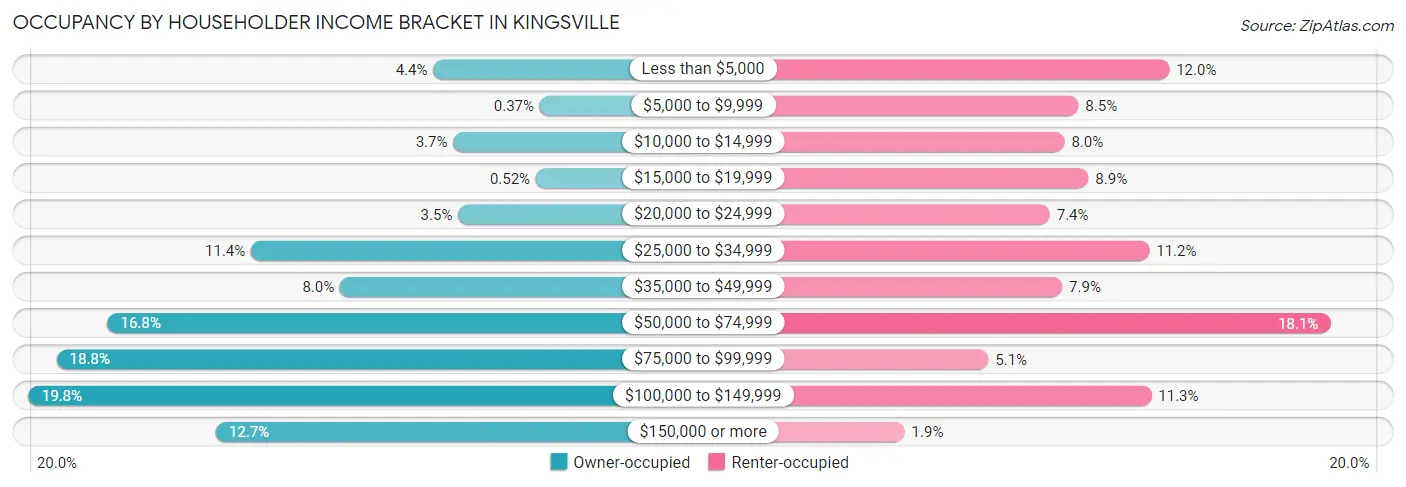
| Income Bracket | Owner-occupied | Renter-occupied |
| Less than $5,000 | 204 (4.4%) | 633 (11.9%) |
| $5,000 to $9,999 | 17 (0.4%) | 450 (8.5%) |
| $10,000 to $14,999 | 169 (3.7%) | 422 (8.0%) |
| $15,000 to $19,999 | 24 (0.5%) | 470 (8.9%) |
| $20,000 to $24,999 | 160 (3.5%) | 392 (7.4%) |
| $25,000 to $34,999 | 523 (11.4%) | 593 (11.2%) |
| $35,000 to $49,999 | 367 (8.0%) | 417 (7.9%) |
| $50,000 to $74,999 | 775 (16.8%) | 958 (18.1%) |
| $75,000 to $99,999 | 864 (18.8%) | 268 (5.1%) |
| $100,000 to $149,999 | 913 (19.8%) | 597 (11.3%) |
| $150,000 or more | 585 (12.7%) | 99 (1.9%) |
| Total | 4,601 (100.0%) | 5,299 (100.0%) |
Monthly Housing Cost Tiers in Kingsville
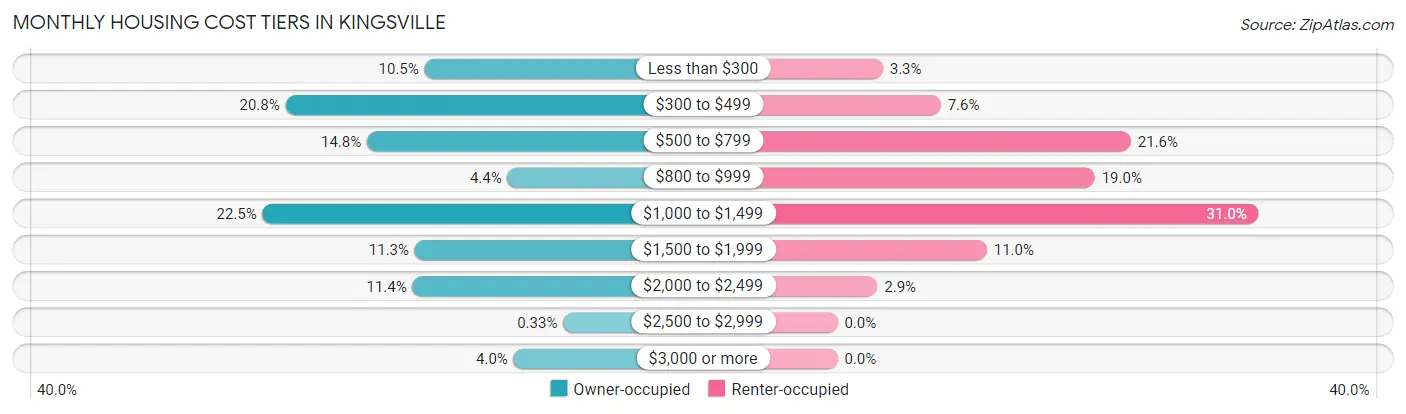
| Monthly Cost | Owner-occupied | Renter-occupied |
| Less than $300 | 485 (10.5%) | 177 (3.3%) |
| $300 to $499 | 956 (20.8%) | 403 (7.6%) |
| $500 to $799 | 680 (14.8%) | 1,145 (21.6%) |
| $800 to $999 | 204 (4.4%) | 1,004 (19.0%) |
| $1,000 to $1,499 | 1,034 (22.5%) | 1,644 (31.0%) |
| $1,500 to $1,999 | 518 (11.3%) | 583 (11.0%) |
| $2,000 to $2,499 | 526 (11.4%) | 156 (2.9%) |
| $2,500 to $2,999 | 15 (0.3%) | 0 (0.0%) |
| $3,000 or more | 183 (4.0%) | 0 (0.0%) |
| Total | 4,601 (100.0%) | 5,299 (100.0%) |
Physical Housing Characteristics in Kingsville
Housing Structures in Kingsville
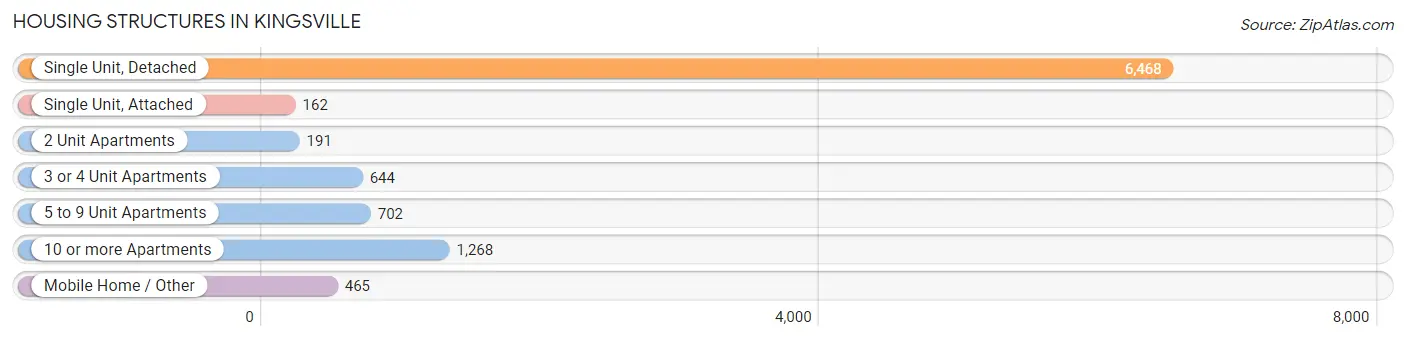
| Structure Type | # Housing Units | % Housing Units |
| Single Unit, Detached | 6,468 | 65.3% |
| Single Unit, Attached | 162 | 1.6% |
| 2 Unit Apartments | 191 | 1.9% |
| 3 or 4 Unit Apartments | 644 | 6.5% |
| 5 to 9 Unit Apartments | 702 | 7.1% |
| 10 or more Apartments | 1,268 | 12.8% |
| Mobile Home / Other | 465 | 4.7% |
| Total | 9,900 | 100.0% |
Housing Structures by Occupancy in Kingsville
| Structure Type | Owner-occupied | Renter-occupied |
| Single Unit, Detached | 4,197 (64.9%) | 2,271 (35.1%) |
| Single Unit, Attached | 106 (65.4%) | 56 (34.6%) |
| 2 Unit Apartments | 0 (0.0%) | 191 (100.0%) |
| 3 or 4 Unit Apartments | 0 (0.0%) | 644 (100.0%) |
| 5 to 9 Unit Apartments | 11 (1.6%) | 691 (98.4%) |
| 10 or more Apartments | 0 (0.0%) | 1,268 (100.0%) |
| Mobile Home / Other | 287 (61.7%) | 178 (38.3%) |
| Total | 4,601 (46.5%) | 5,299 (53.5%) |
Housing Structures by Number of Rooms in Kingsville
| Number of Rooms | Owner-occupied | Renter-occupied |
| 1 Room | 61 (1.3%) | 643 (12.1%) |
| 2 or 3 Rooms | 235 (5.1%) | 869 (16.4%) |
| 4 or 5 Rooms | 1,772 (38.5%) | 2,679 (50.6%) |
| 6 or 7 Rooms | 1,802 (39.2%) | 812 (15.3%) |
| 8 or more Rooms | 731 (15.9%) | 296 (5.6%) |
| Total | 4,601 (100.0%) | 5,299 (100.0%) |
Housing Structure by Heating Type in Kingsville
| Heating Type | Owner-occupied | Renter-occupied |
| Utility Gas | 1,366 (29.7%) | 805 (15.2%) |
| Bottled, Tank, or LP Gas | 32 (0.7%) | 37 (0.7%) |
| Electricity | 3,139 (68.2%) | 4,359 (82.3%) |
| Fuel Oil or Kerosene | 0 (0.0%) | 0 (0.0%) |
| Coal or Coke | 0 (0.0%) | 0 (0.0%) |
| All other Fuels | 64 (1.4%) | 0 (0.0%) |
| No Fuel Used | 0 (0.0%) | 98 (1.8%) |
| Total | 4,601 (100.0%) | 5,299 (100.0%) |
Household Vehicle Usage in Kingsville
| Vehicles per Household | Owner-occupied | Renter-occupied |
| No Vehicle | 131 (2.9%) | 506 (9.6%) |
| 1 Vehicle | 1,218 (26.5%) | 3,013 (56.9%) |
| 2 Vehicles | 2,169 (47.1%) | 1,229 (23.2%) |
| 3 or more Vehicles | 1,083 (23.5%) | 551 (10.4%) |
| Total | 4,601 (100.0%) | 5,299 (100.0%) |
Real Estate & Mortgages in Kingsville
Real Estate and Mortgage Overview in Kingsville
| Characteristic | Without Mortgage | With Mortgage |
| Housing Units | 2,277 | 2,324 |
| Median Property Value | $75,200 | $170,300 |
| Median Household Income | $55,581 | $492 |
| Monthly Housing Costs | $443 | $135 |
| Real Estate Taxes | $1,118 | $61 |
Property Value by Mortgage Status in Kingsville
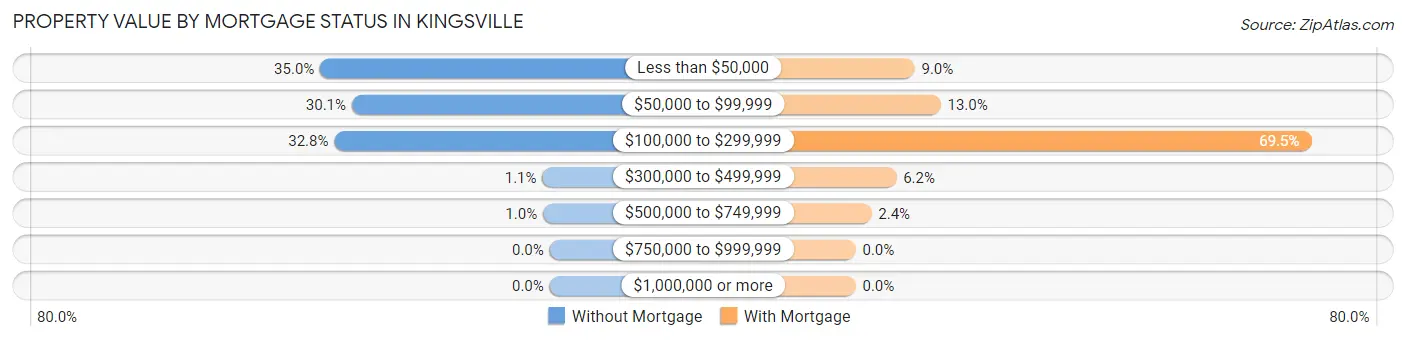
| Property Value | Without Mortgage | With Mortgage |
| Less than $50,000 | 796 (35.0%) | 209 (9.0%) |
| $50,000 to $99,999 | 686 (30.1%) | 301 (13.0%) |
| $100,000 to $299,999 | 747 (32.8%) | 1,614 (69.5%) |
| $300,000 to $499,999 | 25 (1.1%) | 144 (6.2%) |
| $500,000 to $749,999 | 23 (1.0%) | 56 (2.4%) |
| $750,000 to $999,999 | 0 (0.0%) | 0 (0.0%) |
| $1,000,000 or more | 0 (0.0%) | 0 (0.0%) |
| Total | 2,277 (100.0%) | 2,324 (100.0%) |
Household Income by Mortgage Status in Kingsville
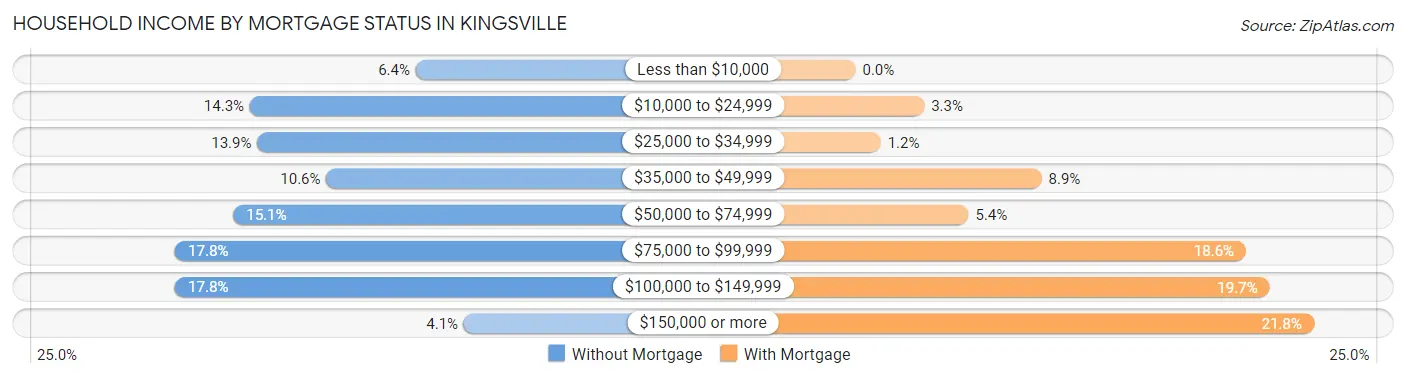
| Household Income | Without Mortgage | With Mortgage |
| Less than $10,000 | 145 (6.4%) | 0 (0.0%) |
| $10,000 to $24,999 | 325 (14.3%) | 76 (3.3%) |
| $25,000 to $34,999 | 317 (13.9%) | 28 (1.2%) |
| $35,000 to $49,999 | 242 (10.6%) | 206 (8.9%) |
| $50,000 to $74,999 | 343 (15.1%) | 125 (5.4%) |
| $75,000 to $99,999 | 406 (17.8%) | 432 (18.6%) |
| $100,000 to $149,999 | 406 (17.8%) | 458 (19.7%) |
| $150,000 or more | 93 (4.1%) | 507 (21.8%) |
| Total | 2,277 (100.0%) | 2,324 (100.0%) |
Property Value to Household Income Ratio in Kingsville
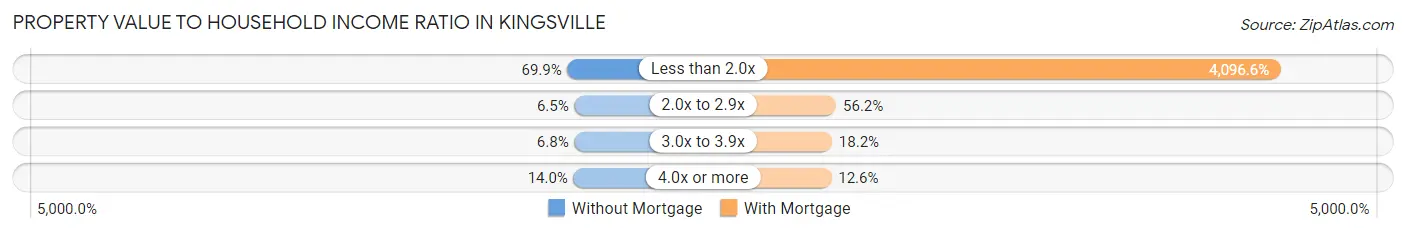
| Value-to-Income Ratio | Without Mortgage | With Mortgage |
| Less than 2.0x | 1,591 (69.9%) | 95,205 (4,096.6%) |
| 2.0x to 2.9x | 148 (6.5%) | 1,307 (56.2%) |
| 3.0x to 3.9x | 155 (6.8%) | 424 (18.2%) |
| 4.0x or more | 319 (14.0%) | 293 (12.6%) |
| Total | 2,277 (100.0%) | 2,324 (100.0%) |
Real Estate Taxes by Mortgage Status in Kingsville
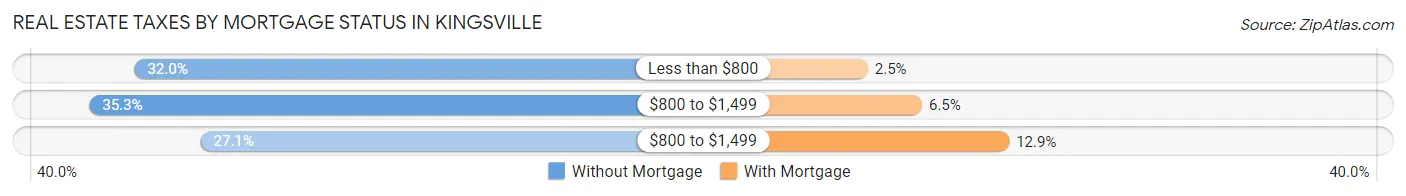
| Property Taxes | Without Mortgage | With Mortgage |
| Less than $800 | 728 (32.0%) | 59 (2.5%) |
| $800 to $1,499 | 803 (35.3%) | 151 (6.5%) |
| $800 to $1,499 | 618 (27.1%) | 299 (12.9%) |
| Total | 2,277 (100.0%) | 2,324 (100.0%) |
Health & Disability in Kingsville
Health Insurance Coverage by Age in Kingsville
| Age Bracket | With Coverage | Without Coverage |
| Under 6 Years | 1,928 (91.8%) | 173 (8.2%) |
| 6 to 18 Years | 4,135 (93.2%) | 303 (6.8%) |
| 19 to 25 Years | 3,509 (65.5%) | 1,847 (34.5%) |
| 26 to 34 Years | 2,381 (73.4%) | 861 (26.6%) |
| 35 to 44 Years | 2,173 (80.2%) | 536 (19.8%) |
| 45 to 54 Years | 1,625 (71.6%) | 646 (28.4%) |
| 55 to 64 Years | 1,407 (78.6%) | 382 (21.3%) |
| 65 to 74 Years | 1,614 (99.7%) | 5 (0.3%) |
| 75 Years and older | 1,153 (100.0%) | 0 (0.0%) |
| Total | 19,925 (80.7%) | 4,753 (19.3%) |
Health Insurance Coverage by Citizenship Status in Kingsville
| Citizenship Status | With Coverage | Without Coverage |
| Native Born | 1,928 (91.8%) | 173 (8.2%) |
| Foreign Born, Citizen | 4,135 (93.2%) | 303 (6.8%) |
| Foreign Born, not a Citizen | 3,509 (65.5%) | 1,847 (34.5%) |
Health Insurance Coverage by Household Income in Kingsville
| Household Income | With Coverage | Without Coverage |
| Under $25,000 | 4,220 (75.8%) | 1,349 (24.2%) |
| $25,000 to $49,999 | 3,796 (81.8%) | 845 (18.2%) |
| $50,000 to $74,999 | 2,796 (75.3%) | 919 (24.7%) |
| $75,000 to $99,999 | 2,850 (85.5%) | 483 (14.5%) |
| $100,000 and over | 5,043 (83.5%) | 999 (16.5%) |
Public vs Private Health Insurance Coverage by Age in Kingsville
| Age Bracket | Public Insurance | Private Insurance |
| Under 6 | 1,389 (66.1%) | 609 (29.0%) |
| 6 to 18 Years | 2,152 (48.5%) | 2,055 (46.3%) |
| 19 to 25 Years | 484 (9.0%) | 3,162 (59.0%) |
| 25 to 34 Years | 480 (14.8%) | 1,977 (61.0%) |
| 35 to 44 Years | 582 (21.5%) | 1,836 (67.8%) |
| 45 to 54 Years | 325 (14.3%) | 1,370 (60.3%) |
| 55 to 64 Years | 462 (25.8%) | 1,062 (59.4%) |
| 65 to 74 Years | 1,521 (94.0%) | 646 (39.9%) |
| 75 Years and over | 1,153 (100.0%) | 588 (51.0%) |
| Total | 8,548 (34.6%) | 13,305 (53.9%) |
Disability Status by Sex by Age in Kingsville
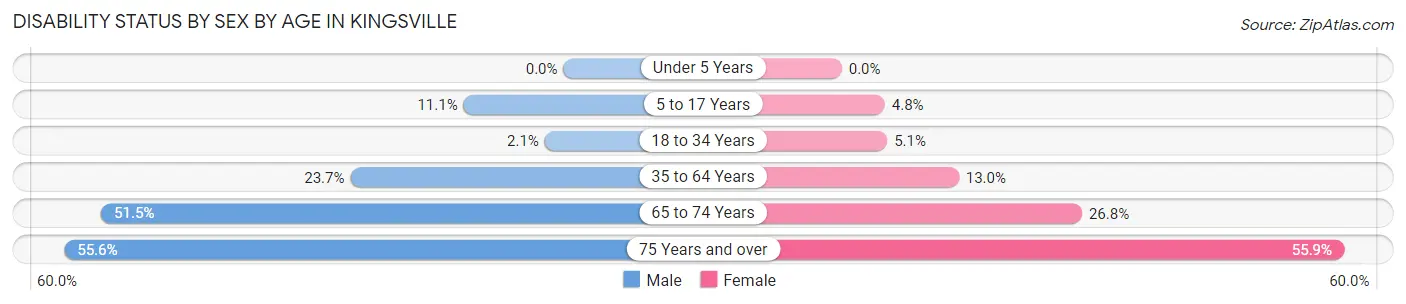
| Age Bracket | Male | Female |
| Under 5 Years | 0 (0.0%) | 0 (0.0%) |
| 5 to 17 Years | 267 (11.1%) | 84 (4.8%) |
| 18 to 34 Years | 98 (2.1%) | 229 (5.1%) |
| 35 to 64 Years | 823 (23.7%) | 430 (13.0%) |
| 65 to 74 Years | 385 (51.5%) | 233 (26.8%) |
| 75 Years and over | 274 (55.6%) | 369 (55.9%) |
Disability Class by Sex by Age in Kingsville
Disability Class: Hearing Difficulty
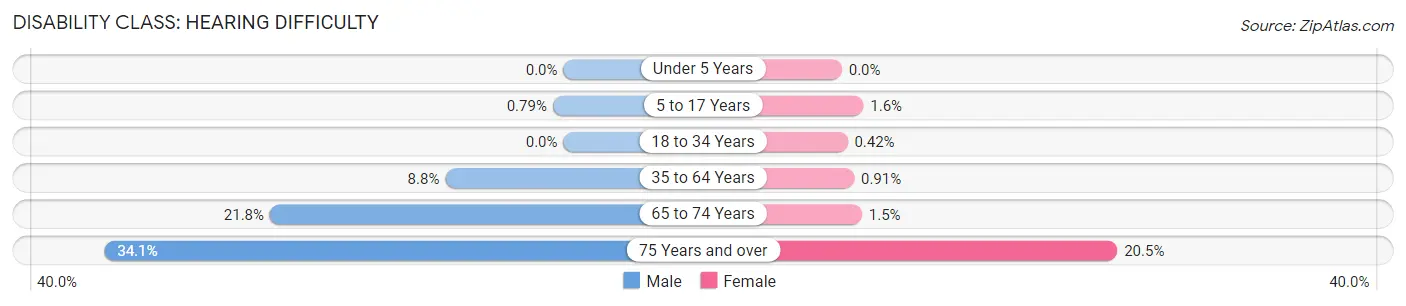
| Age Bracket | Male | Female |
| Under 5 Years | 0 (0.0%) | 0 (0.0%) |
| 5 to 17 Years | 19 (0.8%) | 28 (1.6%) |
| 18 to 34 Years | 0 (0.0%) | 19 (0.4%) |
| 35 to 64 Years | 304 (8.8%) | 30 (0.9%) |
| 65 to 74 Years | 163 (21.8%) | 13 (1.5%) |
| 75 Years and over | 168 (34.1%) | 135 (20.4%) |
Disability Class: Vision Difficulty
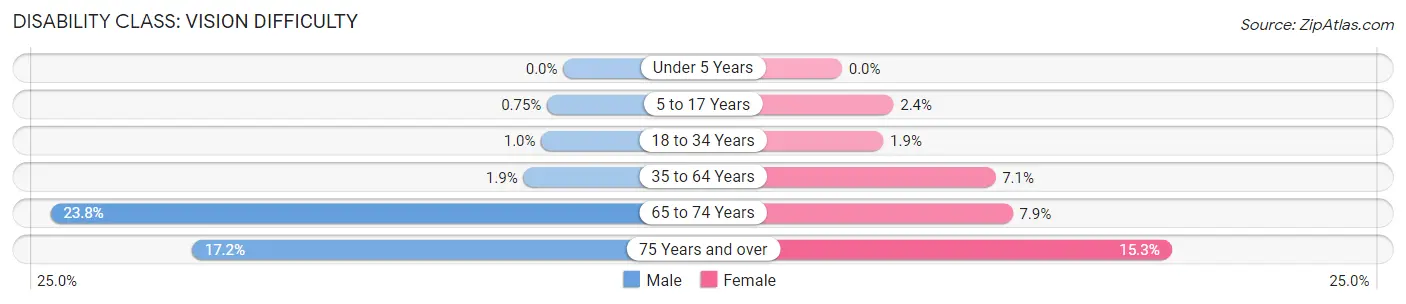
| Age Bracket | Male | Female |
| Under 5 Years | 0 (0.0%) | 0 (0.0%) |
| 5 to 17 Years | 18 (0.7%) | 42 (2.4%) |
| 18 to 34 Years | 48 (1.0%) | 87 (1.9%) |
| 35 to 64 Years | 64 (1.8%) | 235 (7.1%) |
| 65 to 74 Years | 178 (23.8%) | 69 (7.9%) |
| 75 Years and over | 85 (17.2%) | 101 (15.3%) |
Disability Class: Cognitive Difficulty
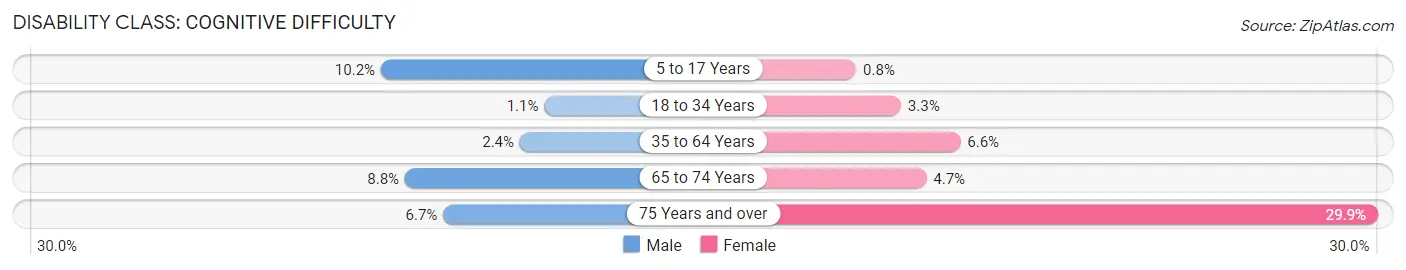
| Age Bracket | Male | Female |
| 5 to 17 Years | 244 (10.2%) | 14 (0.8%) |
| 18 to 34 Years | 50 (1.1%) | 149 (3.3%) |
| 35 to 64 Years | 84 (2.4%) | 218 (6.6%) |
| 65 to 74 Years | 66 (8.8%) | 41 (4.7%) |
| 75 Years and over | 33 (6.7%) | 197 (29.8%) |
Disability Class: Ambulatory Difficulty
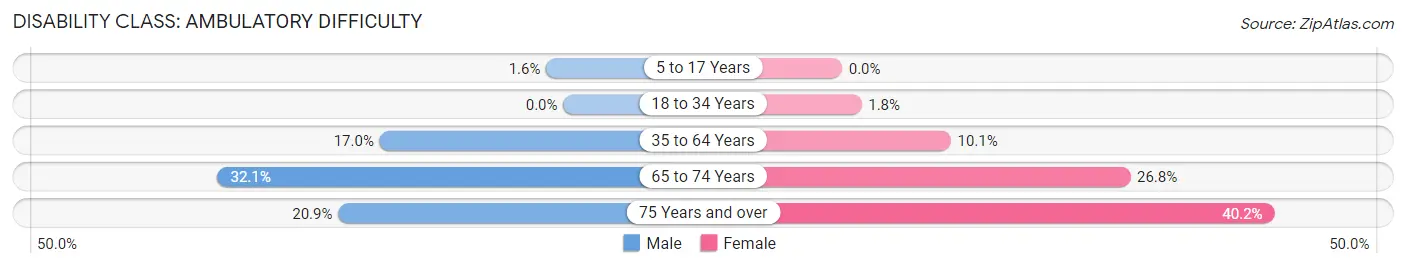
| Age Bracket | Male | Female |
| 5 to 17 Years | 38 (1.6%) | 0 (0.0%) |
| 18 to 34 Years | 0 (0.0%) | 82 (1.8%) |
| 35 to 64 Years | 591 (17.0%) | 333 (10.1%) |
| 65 to 74 Years | 240 (32.1%) | 233 (26.8%) |
| 75 Years and over | 103 (20.9%) | 265 (40.2%) |
Disability Class: Self-Care Difficulty
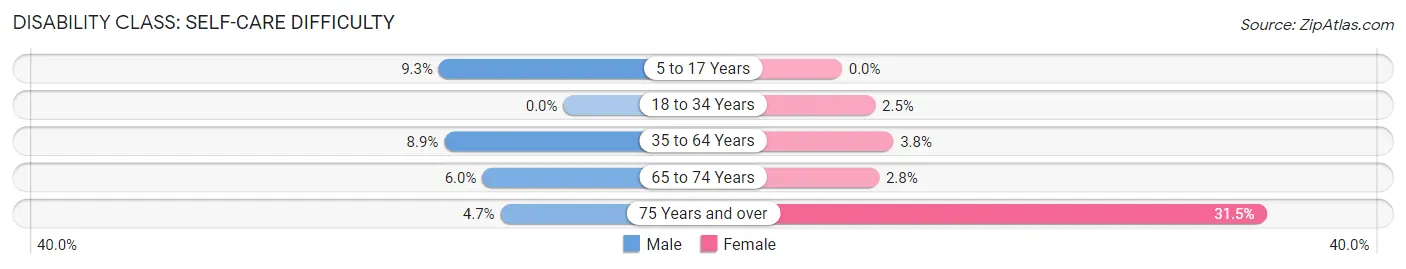
| Age Bracket | Male | Female |
| 5 to 17 Years | 222 (9.2%) | 0 (0.0%) |
| 18 to 34 Years | 0 (0.0%) | 112 (2.5%) |
| 35 to 64 Years | 307 (8.8%) | 126 (3.8%) |
| 65 to 74 Years | 45 (6.0%) | 24 (2.8%) |
| 75 Years and over | 23 (4.7%) | 208 (31.5%) |
Technology Access in Kingsville
Computing Device Access in Kingsville
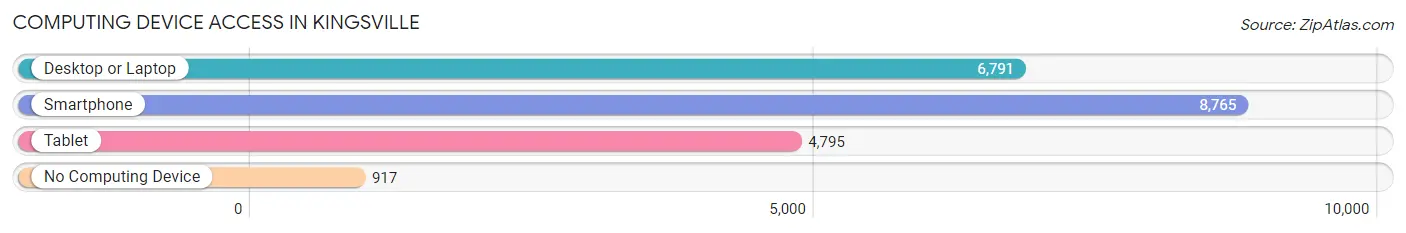
| Device Type | # Households | % Households |
| Desktop or Laptop | 6,791 | 68.6% |
| Smartphone | 8,765 | 88.5% |
| Tablet | 4,795 | 48.4% |
| No Computing Device | 917 | 9.3% |
| Total | 9,900 | 100.0% |
Internet Access in Kingsville
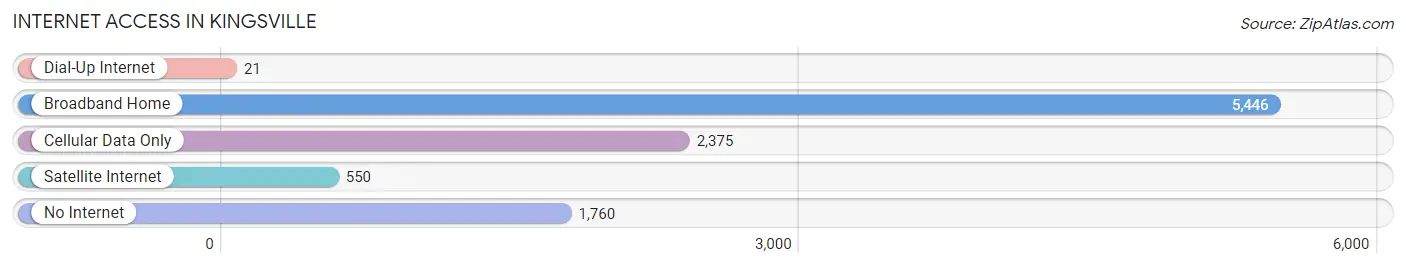
| Internet Type | # Households | % Households |
| Dial-Up Internet | 21 | 0.2% |
| Broadband Home | 5,446 | 55.0% |
| Cellular Data Only | 2,375 | 24.0% |
| Satellite Internet | 550 | 5.6% |
| No Internet | 1,760 | 17.8% |
| Total | 9,900 | 100.0% |
Kingsville Summary
History
The city of Kingsville, Texas is located in the southernmost part of the state, in Kleberg County. It is situated on the Gulf Coast, about 30 miles north of the Mexican border. The city was founded in 1904 by Richard King, a prominent rancher and businessman. King had purchased the land from the King Ranch, which was founded by his father, Richard King Sr. in 1853. The city was named after King, and it quickly became a hub for the ranching and agricultural industries.
The city of Kingsville has a rich history that dates back to the early 1800s. The area was originally inhabited by the Karankawa Indians, who were later displaced by Spanish settlers. The area was then part of the Mexican state of Coahuila y Tejas, until it was annexed by the United States in 1845. After the annexation, the area was divided into two counties, Kleberg and Nueces.
In the late 1800s, the area began to experience a population boom due to the influx of settlers from the Midwest and East Coast. The city of Kingsville was officially incorporated in 1904, and it quickly became a hub for the ranching and agricultural industries. The city was also home to a number of military installations, including the Naval Air Station Kingsville, which was established in 1941.
Geography
Kingsville is located in the southernmost part of Texas, in Kleberg County. It is situated on the Gulf Coast, about 30 miles north of the Mexican border. The city is located on the banks of the Nueces River, and it is surrounded by a number of small towns and rural communities. The city is also located near the King Ranch, which is one of the largest ranches in the United States.
The city of Kingsville has a humid subtropical climate, with hot summers and mild winters. The average temperature in the summer is around 90 degrees Fahrenheit, and the average temperature in the winter is around 60 degrees Fahrenheit. The city receives an average of 33 inches of rain per year, and it is prone to occasional flooding due to its proximity to the Nueces River.
Economy
The economy of Kingsville is largely based on the ranching and agricultural industries. The city is home to the King Ranch, which is one of the largest ranches in the United States. The ranch is a major employer in the area, and it is responsible for a large portion of the city’s economic activity.
The city is also home to a number of military installations, including the Naval Air Station Kingsville. The base is a major employer in the area, and it is responsible for a large portion of the city’s economic activity.
In addition to ranching and agriculture, the city is also home to a number of manufacturing and service-based businesses. The city is home to a number of oil and gas companies, as well as a number of retail stores and restaurants.
Demographics
As of the 2010 census, the city of Kingsville had a population of 26,213. The population is largely Hispanic, with a majority of the population being of Mexican descent. The city also has a significant African American population, as well as a small population of Native Americans.
The median household income in the city is $35,813, and the median home value is $90,000. The city has a poverty rate of 22.3%, and the unemployment rate is 6.2%. The city is served by the Kingsville Independent School District, which has a total enrollment of 8,000 students.
Common Questions
What is Per Capita Income in Kingsville?
Per Capita income in Kingsville is $24,713.
What is the Median Family Income in Kingsville?
Median Family Income in Kingsville is $57,720.
What is the Median Household income in Kingsville?
Median Household Income in Kingsville is $50,963.
What is Income or Wage Gap in Kingsville?
Income or Wage Gap in Kingsville is 42.2%.
Women in Kingsville earn 57.8 cents for every dollar earned by a man.
What is Family Income Deficit in Kingsville?
Family Income Deficit in Kingsville is $13,197.
Families that are below poverty line in Kingsville earn $13,197 less on average than the poverty threshold level.
What is Inequality or Gini Index in Kingsville?
Inequality or Gini Index in Kingsville is 0.48.
What is the Total Population of Kingsville?
Total Population of Kingsville is 25,265.
What is the Total Male Population of Kingsville?
Total Male Population of Kingsville is 13,205.
What is the Total Female Population of Kingsville?
Total Female Population of Kingsville is 12,060.
What is the Ratio of Males per 100 Females in Kingsville?
There are 109.49 Males per 100 Females in Kingsville.
What is the Ratio of Females per 100 Males in Kingsville?
There are 91.33 Females per 100 Males in Kingsville.
What is the Median Population Age in Kingsville?
Median Population Age in Kingsville is 27.4 Years.
What is the Average Family Size in Kingsville
Average Family Size in Kingsville is 3.0 People.
What is the Average Household Size in Kingsville
Average Household Size in Kingsville is 2.4 People.
How Large is the Labor Force in Kingsville?
There are 12,309 People in the Labor Forcein in Kingsville.
What is the Percentage of People in the Labor Force in Kingsville?
61.4% of People are in the Labor Force in Kingsville.
What is the Unemployment Rate in Kingsville?
Unemployment Rate in Kingsville is 8.2%.