Spring Gardens, TX Map & Demographics
Spring Gardens Map
Spring Gardens Overview
$12,328
PER CAPITA INCOME
$39,821
AVG FAMILY INCOME
$39,821
AVG HOUSEHOLD INCOME
0.30
INEQUALITY / GINI INDEX
727
TOTAL POPULATION
399
MALE POPULATION
328
FEMALE POPULATION
121.65
MALES / 100 FEMALES
82.21
FEMALES / 100 MALES
26.0
MEDIAN AGE
4.6
AVG FAMILY SIZE
4.7
AVG HOUSEHOLD SIZE
314
LABOR FORCE [ PEOPLE ]
59.7%
PERCENT IN LABOR FORCE
17.5%
UNEMPLOYMENT RATE
Income in Spring Gardens
Income Overview in Spring Gardens
Per Capita Income in Spring Gardens is $12,328, while median incomes of families and households are $39,821 and $39,821 respectively.
| Characteristic | Number | Measure |
| Per Capita Income | 727 | $12,328 |
| Median Family Income | 154 | $39,821 |
| Mean Family Income | 154 | $50,766 |
| Median Household Income | 154 | $39,821 |
| Mean Household Income | 154 | $52,383 |
| Income Deficit | 154 | $0 |
| Wage / Income Gap (%) | 727 | 0.00% |
| Wage / Income Gap ($) | 727 | 100.00¢ per $1 |
| Gini / Inequality Index | 727 | 0.30 |
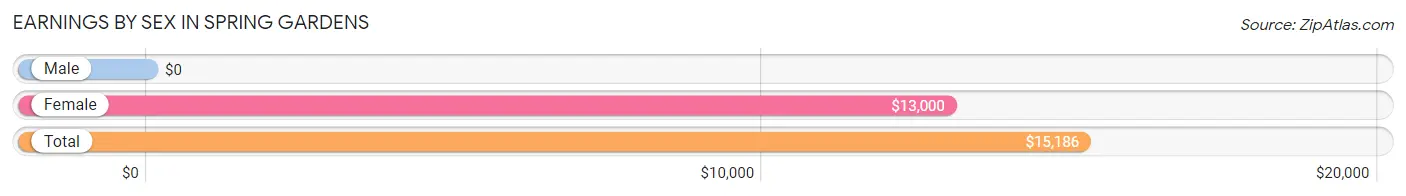
Earnings by Sex in Spring Gardens
| Sex | Number | Average Earnings |
| Male | 113 (41.1%) | $0 |
| Female | 162 (58.9%) | $13,000 |
| Total | 275 (100.0%) | $15,186 |
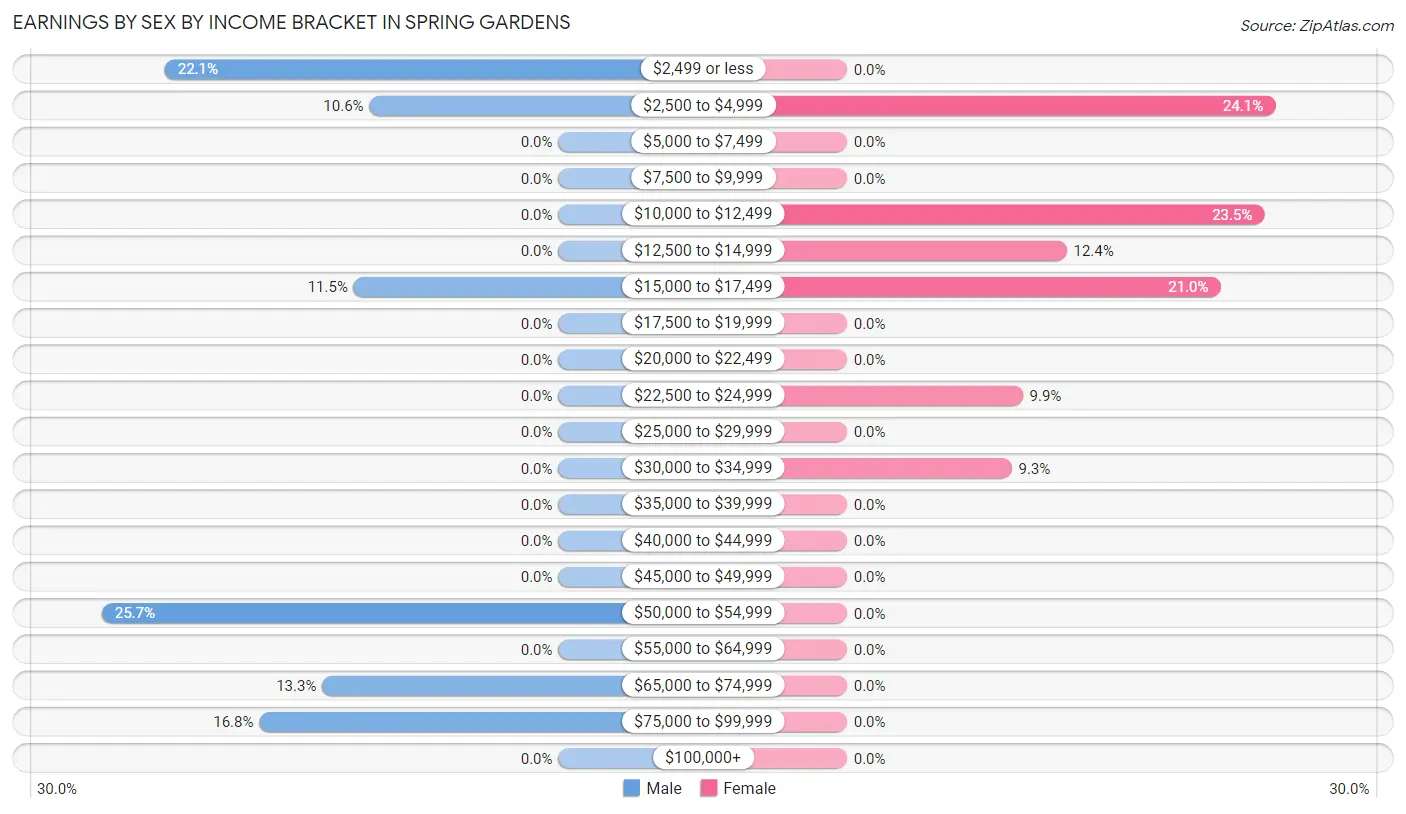
Earnings by Sex by Income Bracket in Spring Gardens
The most common earnings brackets in Spring Gardens are $50,000 to $54,999 for men (29 | 25.7%) and $2,500 to $4,999 for women (39 | 24.1%).
| Income | Male | Female |
| $2,499 or less | 25 (22.1%) | 0 (0.0%) |
| $2,500 to $4,999 | 12 (10.6%) | 39 (24.1%) |
| $5,000 to $7,499 | 0 (0.0%) | 0 (0.0%) |
| $7,500 to $9,999 | 0 (0.0%) | 0 (0.0%) |
| $10,000 to $12,499 | 0 (0.0%) | 38 (23.5%) |
| $12,500 to $14,999 | 0 (0.0%) | 20 (12.3%) |
| $15,000 to $17,499 | 13 (11.5%) | 34 (21.0%) |
| $17,500 to $19,999 | 0 (0.0%) | 0 (0.0%) |
| $20,000 to $22,499 | 0 (0.0%) | 0 (0.0%) |
| $22,500 to $24,999 | 0 (0.0%) | 16 (9.9%) |
| $25,000 to $29,999 | 0 (0.0%) | 0 (0.0%) |
| $30,000 to $34,999 | 0 (0.0%) | 15 (9.3%) |
| $35,000 to $39,999 | 0 (0.0%) | 0 (0.0%) |
| $40,000 to $44,999 | 0 (0.0%) | 0 (0.0%) |
| $45,000 to $49,999 | 0 (0.0%) | 0 (0.0%) |
| $50,000 to $54,999 | 29 (25.7%) | 0 (0.0%) |
| $55,000 to $64,999 | 0 (0.0%) | 0 (0.0%) |
| $65,000 to $74,999 | 15 (13.3%) | 0 (0.0%) |
| $75,000 to $99,999 | 19 (16.8%) | 0 (0.0%) |
| $100,000+ | 0 (0.0%) | 0 (0.0%) |
| Total | 113 (100.0%) | 162 (100.0%) |
Earnings by Sex by Educational Attainment in Spring Gardens
| Educational Attainment | Male Income | Female Income |
| Less than High School | - | - |
| High School Diploma | - | - |
| College or Associate's Degree | - | - |
| Bachelor's Degree | - | - |
| Graduate Degree | - | - |
| Total | - | - |
Family Income in Spring Gardens
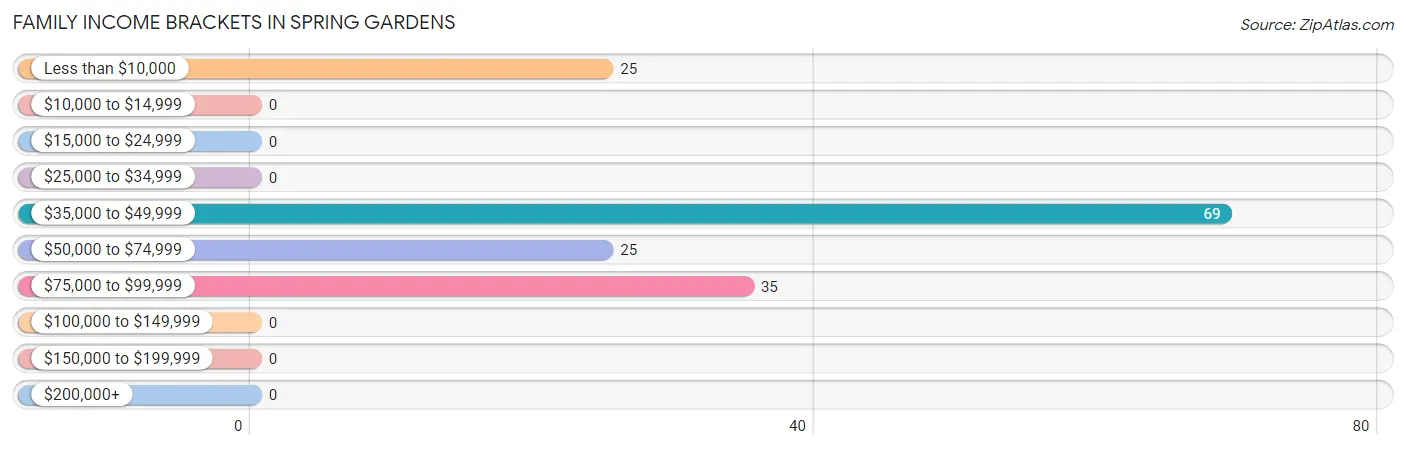
Family Income Brackets in Spring Gardens
According to the Spring Gardens family income data, there are 69 families falling into the $35,000 to $49,999 income range, which is the most common income bracket and makes up 44.8% of all families.
| Income Bracket | # Families | % Families |
| Less than $10,000 | 25 | 16.2% |
| $10,000 to $14,999 | 0 | 0.0% |
| $15,000 to $24,999 | 0 | 0.0% |
| $25,000 to $34,999 | 0 | 0.0% |
| $35,000 to $49,999 | 69 | 44.8% |
| $50,000 to $74,999 | 25 | 16.2% |
| $75,000 to $99,999 | 35 | 22.7% |
| $100,000 to $149,999 | 0 | 0.0% |
| $150,000 to $199,999 | 0 | 0.0% |
| $200,000+ | 0 | 0.0% |
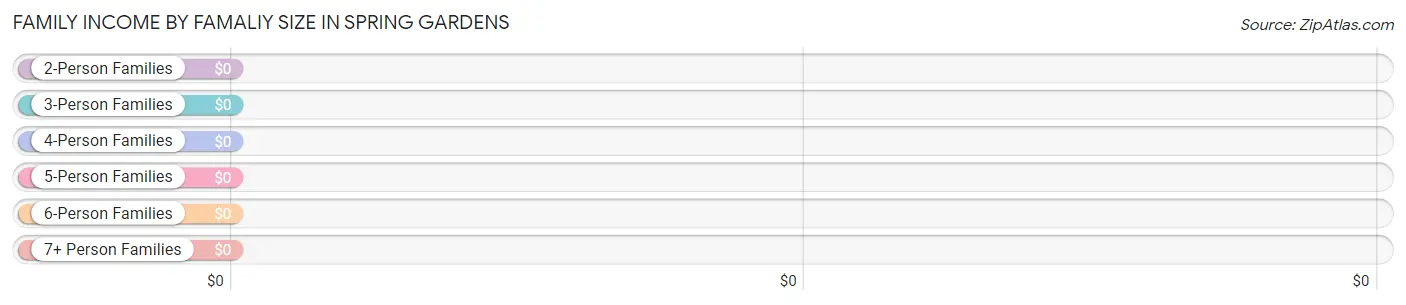
Family Income by Famaliy Size in Spring Gardens
| Income Bracket | # Families | Median Income |
| 2-Person Families | 55 (35.7%) | $0 |
| 3-Person Families | 6 (3.9%) | $0 |
| 4-Person Families | 28 (18.2%) | $0 |
| 5-Person Families | 26 (16.9%) | $0 |
| 6-Person Families | 20 (13.0%) | $0 |
| 7+ Person Families | 19 (12.3%) | $0 |
| Total | 154 (100.0%) | $39,821 |
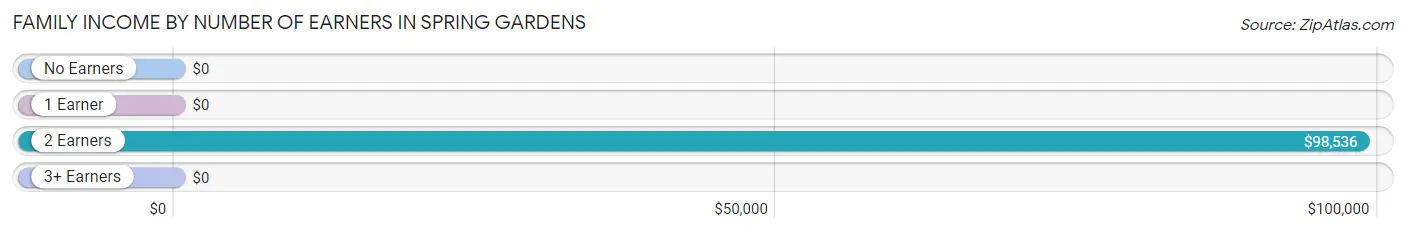
Family Income by Number of Earners in Spring Gardens
| Number of Earners | # Families | Median Income |
| No Earners | 30 (19.5%) | $0 |
| 1 Earner | 44 (28.6%) | $0 |
| 2 Earners | 41 (26.6%) | $98,536 |
| 3+ Earners | 39 (25.3%) | $0 |
| Total | 154 (100.0%) | $39,821 |
Household Income in Spring Gardens
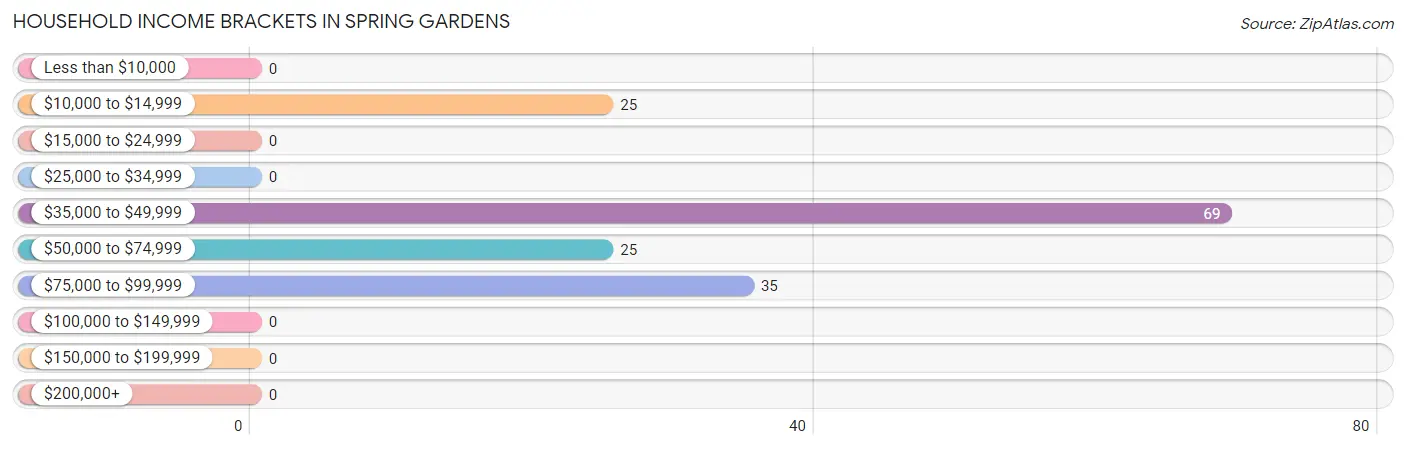
Household Income Brackets in Spring Gardens
With 69 households falling in the category, the $35,000 to $49,999 income range is the most frequent in Spring Gardens, accounting for 44.8% of all households.
| Income Bracket | # Households | % Households |
| Less than $10,000 | 0 | 0.0% |
| $10,000 to $14,999 | 25 | 16.2% |
| $15,000 to $24,999 | 0 | 0.0% |
| $25,000 to $34,999 | 0 | 0.0% |
| $35,000 to $49,999 | 69 | 44.8% |
| $50,000 to $74,999 | 25 | 16.2% |
| $75,000 to $99,999 | 35 | 22.7% |
| $100,000 to $149,999 | 0 | 0.0% |
| $150,000 to $199,999 | 0 | 0.0% |
| $200,000+ | 0 | 0.0% |
Household Income by Householder Age in Spring Gardens
The median household income in Spring Gardens is $39,821, with the highest median household income of $42,692 found in the 45 to 64 years age bracket for the primary householder. A total of 104 households (67.5%) fall into this category.
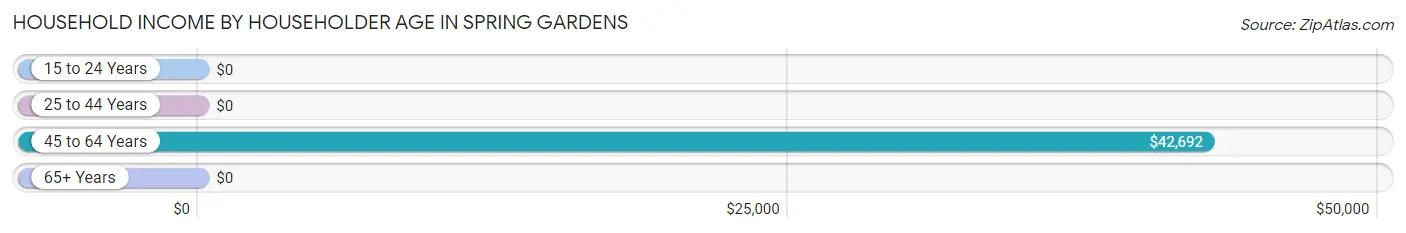
| Income Bracket | # Households | Median Income |
| 15 to 24 Years | 0 (0.0%) | $0 |
| 25 to 44 Years | 20 (13.0%) | $0 |
| 45 to 64 Years | 104 (67.5%) | $42,692 |
| 65+ Years | 30 (19.5%) | $0 |
| Total | 154 (100.0%) | $39,821 |
Poverty in Spring Gardens
Income Below Poverty by Sex and Age in Spring Gardens
With 13.3% poverty level for males and 6.7% for females among the residents of Spring Gardens, 18 to 24 year old males and 55 to 64 year old females are the most vulnerable to poverty, with 28 males (47.5%) and 22 females (46.8%) in their respective age groups living below the poverty level.
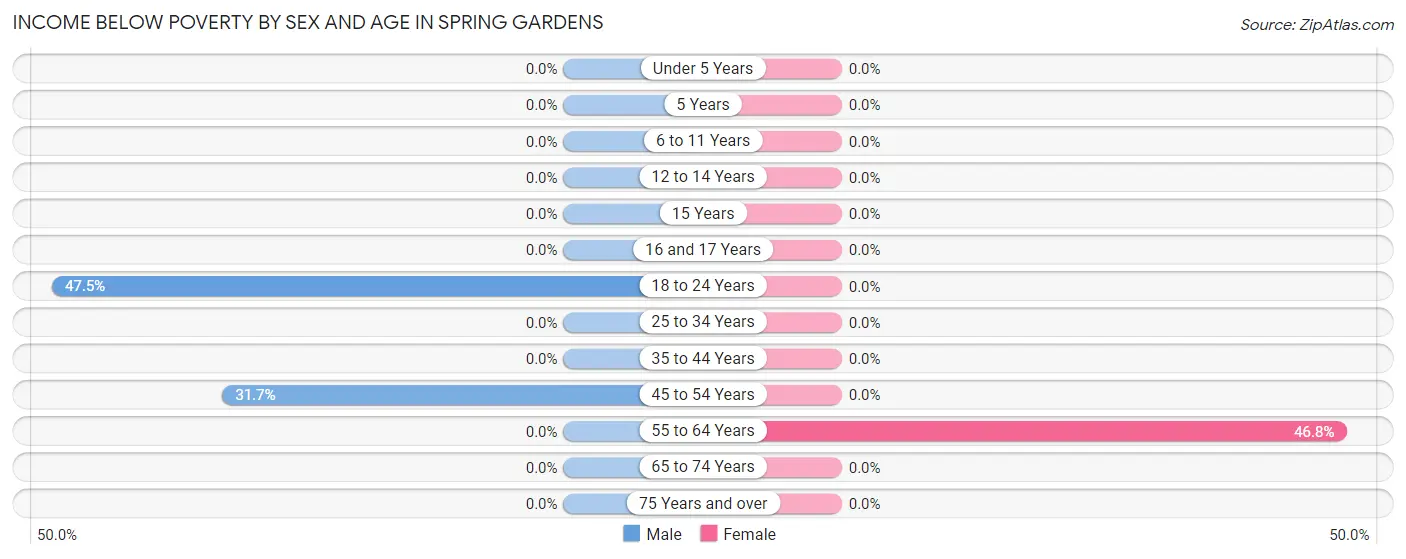
| Age Bracket | Male | Female |
| Under 5 Years | 0 (0.0%) | 0 (0.0%) |
| 5 Years | 0 (0.0%) | 0 (0.0%) |
| 6 to 11 Years | 0 (0.0%) | 0 (0.0%) |
| 12 to 14 Years | 0 (0.0%) | 0 (0.0%) |
| 15 Years | 0 (0.0%) | 0 (0.0%) |
| 16 and 17 Years | 0 (0.0%) | 0 (0.0%) |
| 18 to 24 Years | 28 (47.5%) | 0 (0.0%) |
| 25 to 34 Years | 0 (0.0%) | 0 (0.0%) |
| 35 to 44 Years | 0 (0.0%) | 0 (0.0%) |
| 45 to 54 Years | 25 (31.7%) | 0 (0.0%) |
| 55 to 64 Years | 0 (0.0%) | 22 (46.8%) |
| 65 to 74 Years | 0 (0.0%) | 0 (0.0%) |
| 75 Years and over | 0 (0.0%) | 0 (0.0%) |
| Total | 53 (13.3%) | 22 (6.7%) |
Income Above Poverty by Sex and Age in Spring Gardens
According to the poverty statistics in Spring Gardens, males aged under 5 years and females aged under 5 years are the age groups that are most secure financially, with 100.0% of males and 100.0% of females in these age groups living above the poverty line.
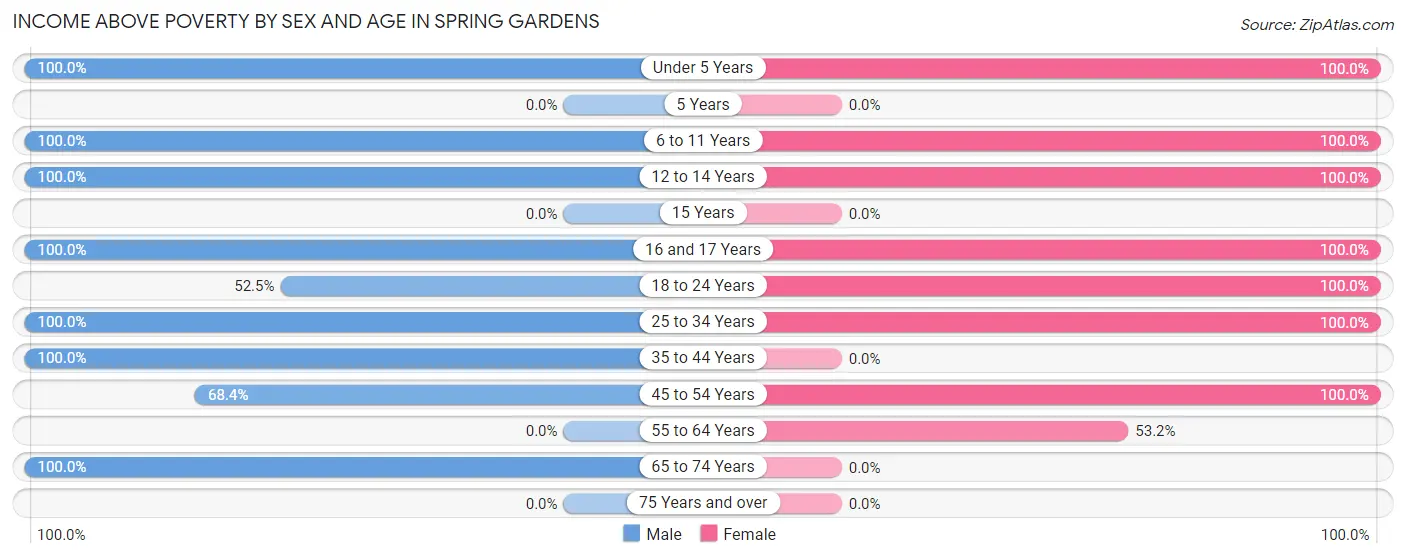
| Age Bracket | Male | Female |
| Under 5 Years | 24 (100.0%) | 25 (100.0%) |
| 5 Years | 0 (0.0%) | 0 (0.0%) |
| 6 to 11 Years | 21 (100.0%) | 22 (100.0%) |
| 12 to 14 Years | 64 (100.0%) | 45 (100.0%) |
| 15 Years | 0 (0.0%) | 0 (0.0%) |
| 16 and 17 Years | 28 (100.0%) | 16 (100.0%) |
| 18 to 24 Years | 31 (52.5%) | 27 (100.0%) |
| 25 to 34 Years | 31 (100.0%) | 92 (100.0%) |
| 35 to 44 Years | 29 (100.0%) | 0 (0.0%) |
| 45 to 54 Years | 54 (68.3%) | 54 (100.0%) |
| 55 to 64 Years | 0 (0.0%) | 25 (53.2%) |
| 65 to 74 Years | 64 (100.0%) | 0 (0.0%) |
| 75 Years and over | 0 (0.0%) | 0 (0.0%) |
| Total | 346 (86.7%) | 306 (93.3%) |
Income Below Poverty Among Married-Couple Families in Spring Gardens
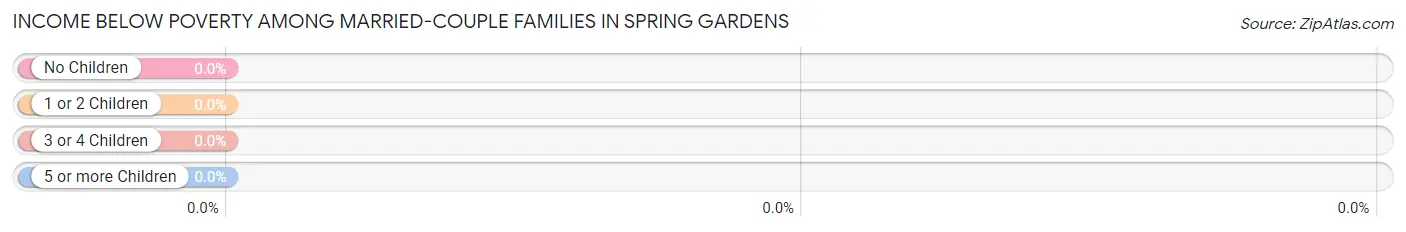
| Children | Above Poverty | Below Poverty |
| No Children | 0 (0.0%) | 0 (0.0%) |
| 1 or 2 Children | 54 (100.0%) | 0 (0.0%) |
| 3 or 4 Children | 20 (100.0%) | 0 (0.0%) |
| 5 or more Children | 0 (0.0%) | 0 (0.0%) |
| Total | 74 (100.0%) | 0 (0.0%) |
Income Below Poverty Among Single-Parent Households in Spring Gardens
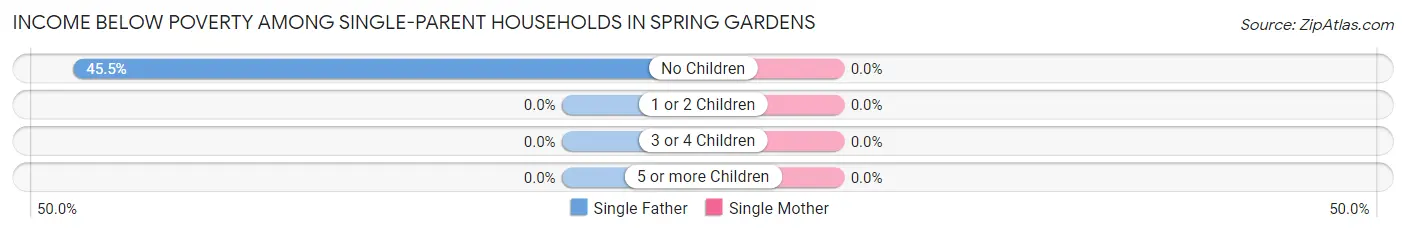
| Children | Single Father | Single Mother |
| No Children | 25 (45.5%) | 0 (0.0%) |
| 1 or 2 Children | 0 (0.0%) | 0 (0.0%) |
| 3 or 4 Children | 0 (0.0%) | 0 (0.0%) |
| 5 or more Children | 0 (0.0%) | 0 (0.0%) |
| Total | 25 (45.5%) | 0 (0.0%) |
Income Below Poverty Among Married-Couple vs Single-Parent Households in Spring Gardens
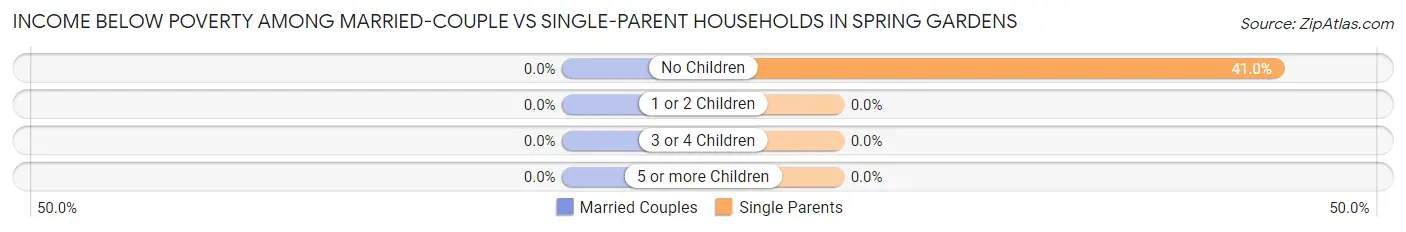
| Children | Married-Couple Families | Single-Parent Households |
| No Children | 0 (0.0%) | 25 (41.0%) |
| 1 or 2 Children | 0 (0.0%) | 0 (0.0%) |
| 3 or 4 Children | 0 (0.0%) | 0 (0.0%) |
| 5 or more Children | 0 (0.0%) | 0 (0.0%) |
| Total | 0 (0.0%) | 25 (31.2%) |
Race in Spring Gardens
The most populous races in Spring Gardens are Hispanic or Latino (579 | 79.6%), White / Caucasian (423 | 58.2%), and Some other Race (304 | 41.8%).
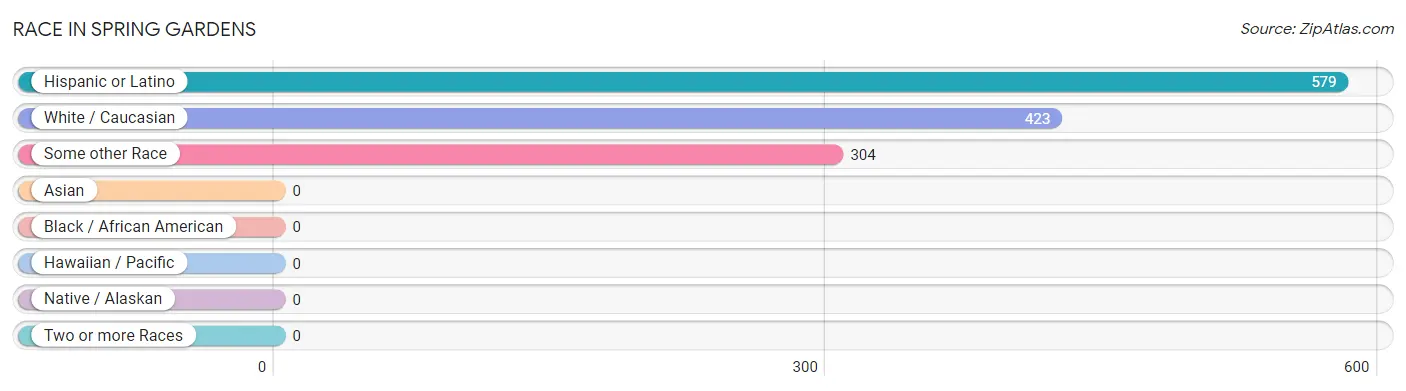
| Race | # Population | % Population |
| Asian | 0 | 0.0% |
| Black / African American | 0 | 0.0% |
| Hawaiian / Pacific | 0 | 0.0% |
| Hispanic or Latino | 579 | 79.6% |
| Native / Alaskan | 0 | 0.0% |
| White / Caucasian | 423 | 58.2% |
| Two or more Races | 0 | 0.0% |
| Some other Race | 304 | 41.8% |
| Total | 727 | 100.0% |
Ancestry in Spring Gardens
The most populous ancestries reported in Spring Gardens are Mexican (493 | 67.8%), and American (6 | 0.8%), together accounting for 68.6% of all Spring Gardens residents.
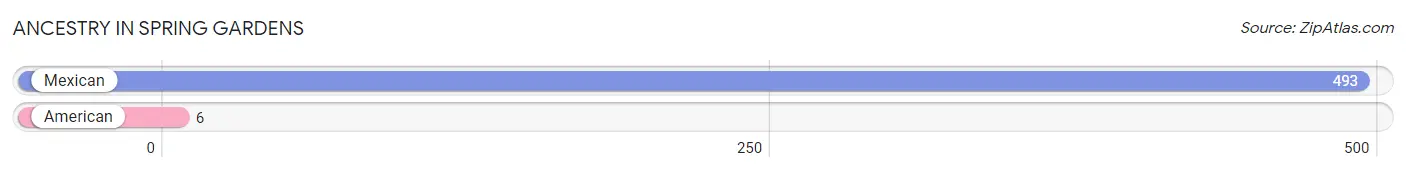
| Ancestry | # Population | % Population |
| American | 6 | 0.8% |
| Mexican | 493 | 67.8% | View All 2 Rows |
Immigrants in Spring Gardens
The most numerous immigrant groups reported in Spring Gardens came from Central America (103 | 14.2%), Latin America (103 | 14.2%), and Mexico (103 | 14.2%), together accounting for 42.5% of all Spring Gardens residents.
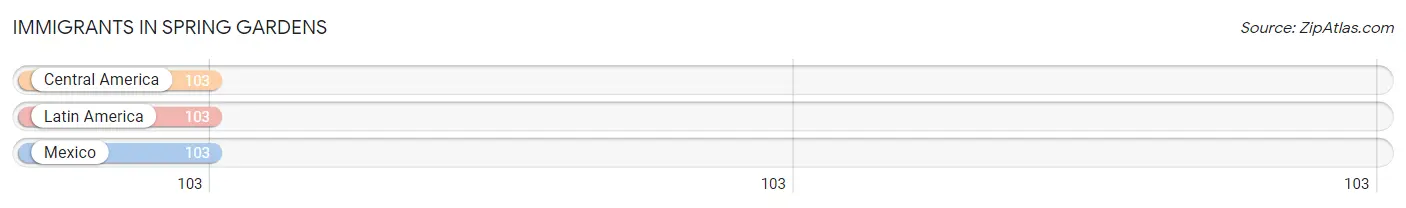
| Immigration Origin | # Population | % Population |
| Central America | 103 | 14.2% |
| Latin America | 103 | 14.2% |
| Mexico | 103 | 14.2% | View All 3 Rows |
Sex and Age in Spring Gardens
Sex and Age in Spring Gardens
The most populous age groups in Spring Gardens are 10 to 14 Years (64 | 16.0%) for men and 30 to 34 Years (47 | 14.3%) for women.
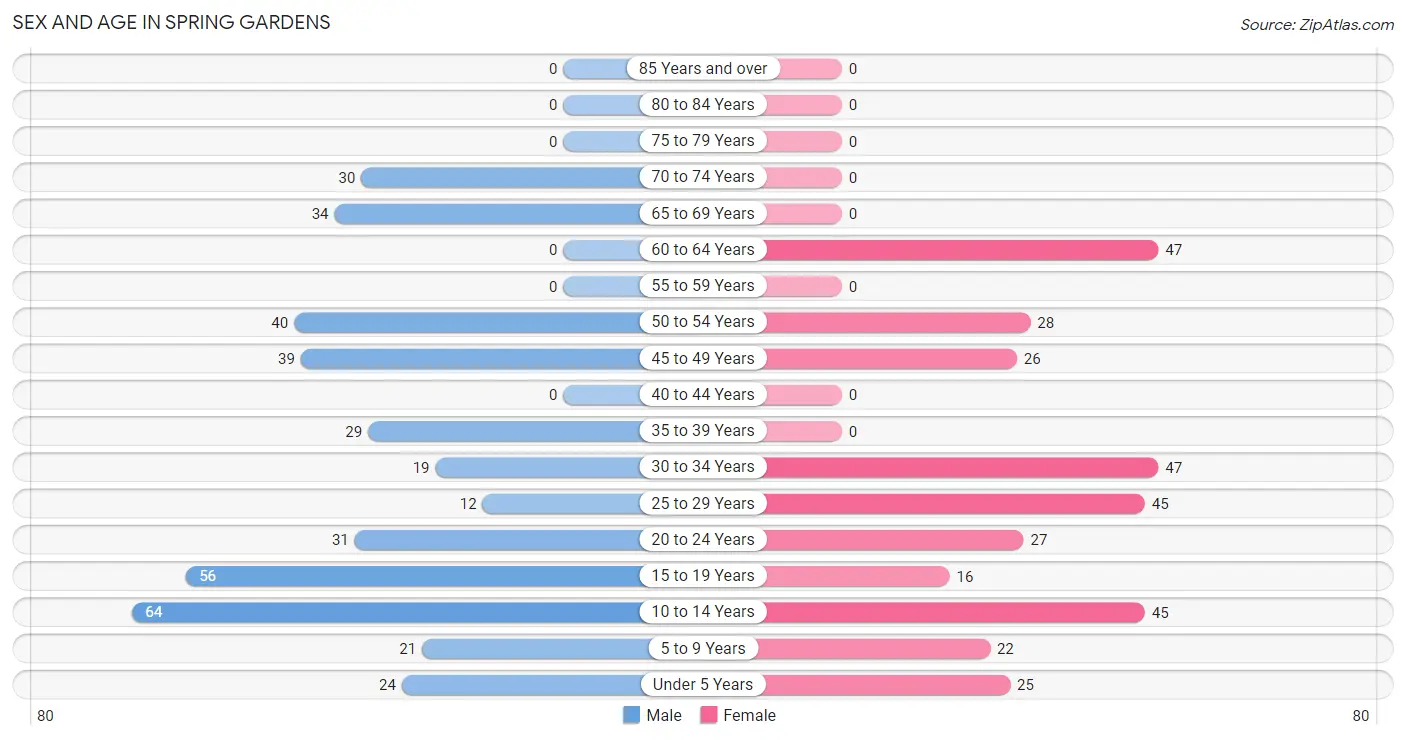
| Age Bracket | Male | Female |
| Under 5 Years | 24 (6.0%) | 25 (7.6%) |
| 5 to 9 Years | 21 (5.3%) | 22 (6.7%) |
| 10 to 14 Years | 64 (16.0%) | 45 (13.7%) |
| 15 to 19 Years | 56 (14.0%) | 16 (4.9%) |
| 20 to 24 Years | 31 (7.8%) | 27 (8.2%) |
| 25 to 29 Years | 12 (3.0%) | 45 (13.7%) |
| 30 to 34 Years | 19 (4.8%) | 47 (14.3%) |
| 35 to 39 Years | 29 (7.3%) | 0 (0.0%) |
| 40 to 44 Years | 0 (0.0%) | 0 (0.0%) |
| 45 to 49 Years | 39 (9.8%) | 26 (7.9%) |
| 50 to 54 Years | 40 (10.0%) | 28 (8.5%) |
| 55 to 59 Years | 0 (0.0%) | 0 (0.0%) |
| 60 to 64 Years | 0 (0.0%) | 47 (14.3%) |
| 65 to 69 Years | 34 (8.5%) | 0 (0.0%) |
| 70 to 74 Years | 30 (7.5%) | 0 (0.0%) |
| 75 to 79 Years | 0 (0.0%) | 0 (0.0%) |
| 80 to 84 Years | 0 (0.0%) | 0 (0.0%) |
| 85 Years and over | 0 (0.0%) | 0 (0.0%) |
| Total | 399 (100.0%) | 328 (100.0%) |
Families and Households in Spring Gardens
Median Family Size in Spring Gardens
The median family size in Spring Gardens is 4.58 persons per family, with single female/mother families (25 | 16.2%) accounting for the largest median family size of 7.88 persons per family. On the other hand, single male/father families (55 | 35.7%) represent the smallest median family size with 2.13 persons per family.
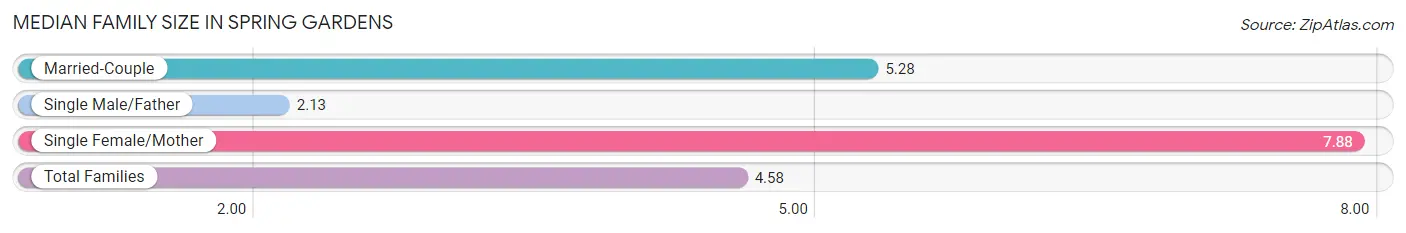
| Family Type | # Families | Family Size |
| Married-Couple | 74 (48.0%) | 5.28 |
| Single Male/Father | 55 (35.7%) | 2.13 |
| Single Female/Mother | 25 (16.2%) | 7.88 |
| Total Families | 154 (100.0%) | 4.58 |
Median Household Size in Spring Gardens
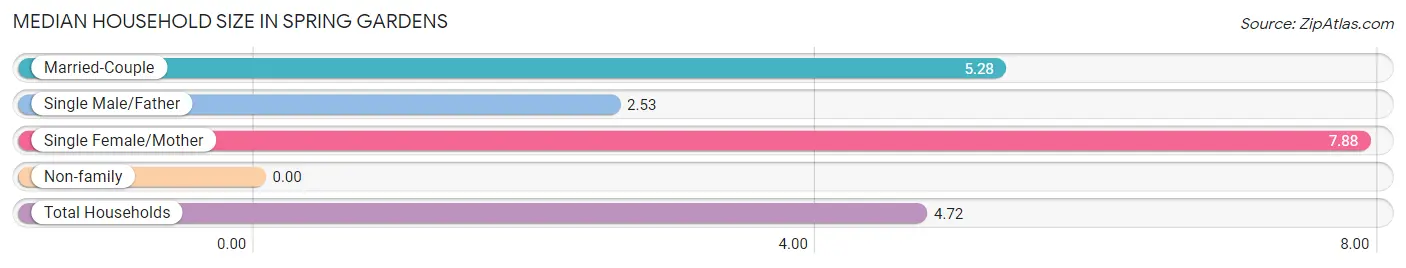
| Household Type | # Households | Household Size |
| Married-Couple | 74 (48.0%) | 5.28 |
| Single Male/Father | 55 (35.7%) | 2.53 |
| Single Female/Mother | 25 (16.2%) | 7.88 |
| Non-family | 0 (0.0%) | - |
| Total Households | 154 (100.0%) | 4.72 |
Household Size by Marriage Status in Spring Gardens
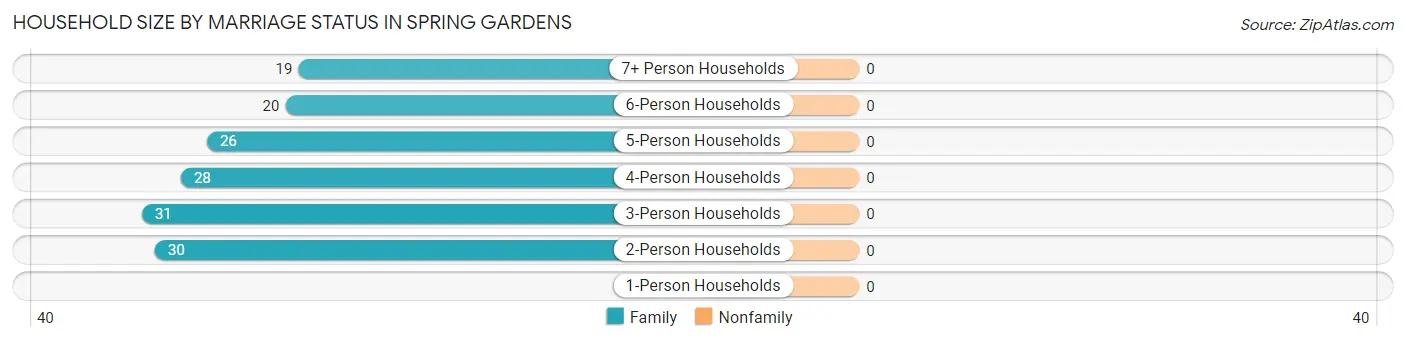
| Household Size | Family Households | Nonfamily Households |
| 1-Person Households | - | 0 (0.0%) |
| 2-Person Households | 30 (19.5%) | 0 (0.0%) |
| 3-Person Households | 31 (20.1%) | 0 (0.0%) |
| 4-Person Households | 28 (18.2%) | 0 (0.0%) |
| 5-Person Households | 26 (16.9%) | 0 (0.0%) |
| 6-Person Households | 20 (13.0%) | 0 (0.0%) |
| 7+ Person Households | 19 (12.3%) | 0 (0.0%) |
| Total | 154 (100.0%) | 0 (0.0%) |
Female Fertility in Spring Gardens
Fertility by Age in Spring Gardens
Average fertility rate in Spring Gardens is 68.0 births per 1,000 women. Women in the age bracket of 20 to 34 years have the highest fertility rate with 92.0 births per 1,000 women. Women in the age bracket of 20 to 34 years acount for 100.0% of all women with births.
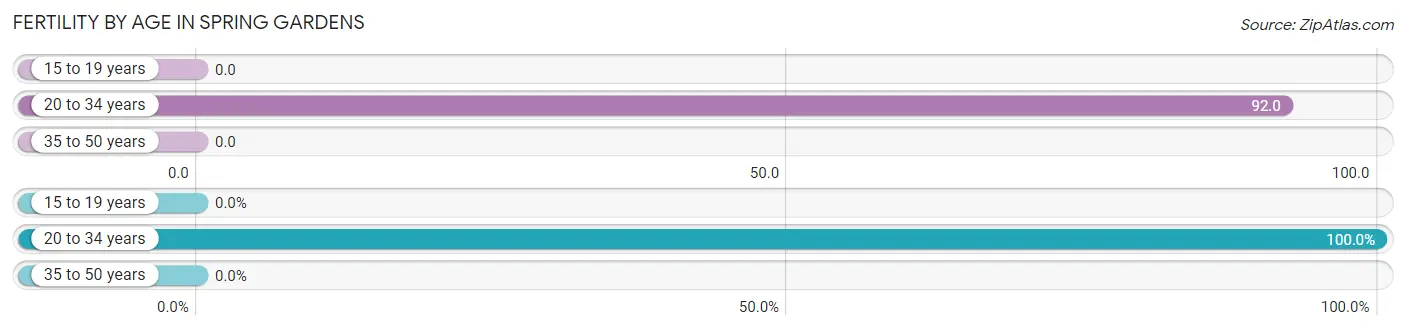
| Age Bracket | Women with Births | Births / 1,000 Women |
| 15 to 19 years | 0 (0.0%) | 0.0 |
| 20 to 34 years | 11 (100.0%) | 92.0 |
| 35 to 50 years | 0 (0.0%) | 0.0 |
| Total | 11 (100.0%) | 68.0 |
Fertility by Age by Marriage Status in Spring Gardens
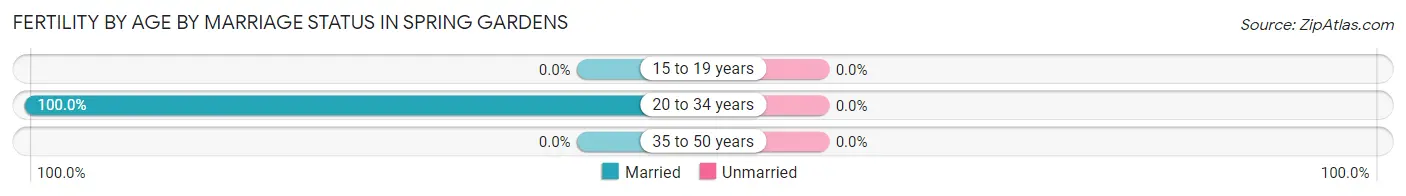
| Age Bracket | Married | Unmarried |
| 15 to 19 years | 0 (0.0%) | 0 (0.0%) |
| 20 to 34 years | 11 (100.0%) | 0 (0.0%) |
| 35 to 50 years | 0 (0.0%) | 0 (0.0%) |
| Total | 11 (100.0%) | 0 (0.0%) |
Fertility by Education in Spring Gardens
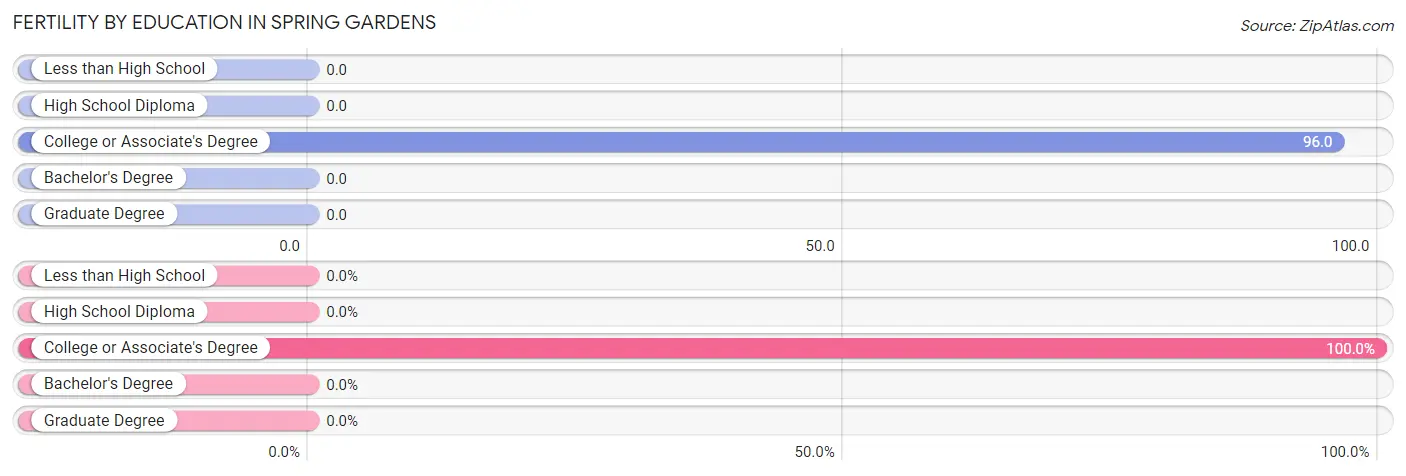
| Educational Attainment | Women with Births | Births / 1,000 Women |
| Less than High School | 0 (0.0%) | 0.0 |
| High School Diploma | 0 (0.0%) | 0.0 |
| College or Associate's Degree | 11 (100.0%) | 96.0 |
| Bachelor's Degree | 0 (0.0%) | 0.0 |
| Graduate Degree | 0 (0.0%) | 0.0 |
| Total | 11 (100.0%) | 68.0 |
Fertility by Education by Marriage Status in Spring Gardens
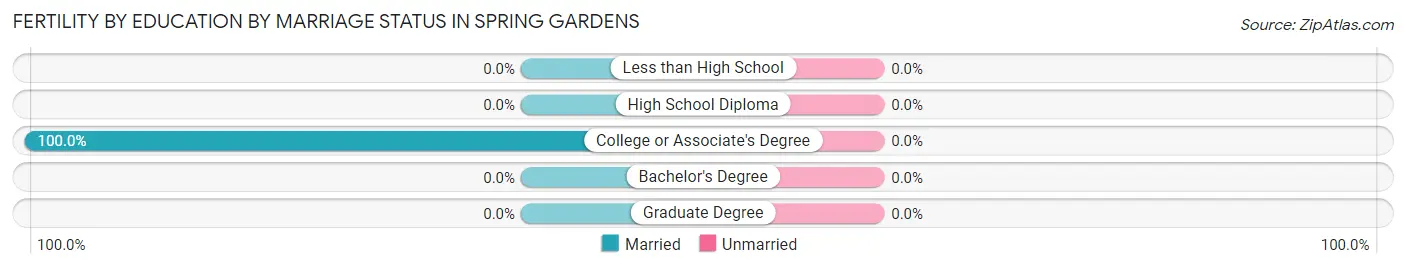
| Educational Attainment | Married | Unmarried |
| Less than High School | 0 (0.0%) | 0 (0.0%) |
| High School Diploma | 0 (0.0%) | 0 (0.0%) |
| College or Associate's Degree | 11 (100.0%) | 0 (0.0%) |
| Bachelor's Degree | 0 (0.0%) | 0 (0.0%) |
| Graduate Degree | 0 (0.0%) | 0 (0.0%) |
| Total | 11 (100.0%) | 0 (0.0%) |
Employment Characteristics in Spring Gardens
Employment by Class of Employer in Spring Gardens
Among the 259 employed individuals in Spring Gardens, private company employees (133 | 51.3%), self-employed (not incorporated) (51 | 19.7%), and local government employees (33 | 12.7%) make up the most common classes of employment.
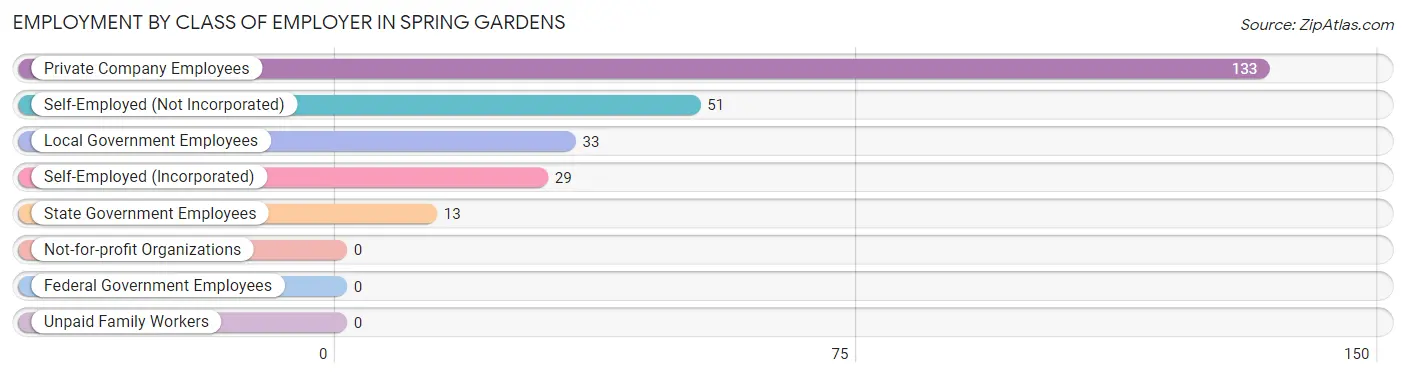
| Employer Class | # Employees | % Employees |
| Private Company Employees | 133 | 51.3% |
| Self-Employed (Incorporated) | 29 | 11.2% |
| Self-Employed (Not Incorporated) | 51 | 19.7% |
| Not-for-profit Organizations | 0 | 0.0% |
| Local Government Employees | 33 | 12.7% |
| State Government Employees | 13 | 5.0% |
| Federal Government Employees | 0 | 0.0% |
| Unpaid Family Workers | 0 | 0.0% |
| Total | 259 | 100.0% |
Employment Status by Age in Spring Gardens
According to the labor force statistics for Spring Gardens, out of the total population over 16 years of age (526), 59.7% or 314 individuals are in the labor force, with 17.5% or 55 of them unemployed. The age group with the highest labor force participation rate is 25 to 29 years, with 100.0% or 57 individuals in the labor force. Within the labor force, the 16 to 19 years age range has the highest percentage of unemployed individuals, with 100.0% or 28 of them being unemployed.
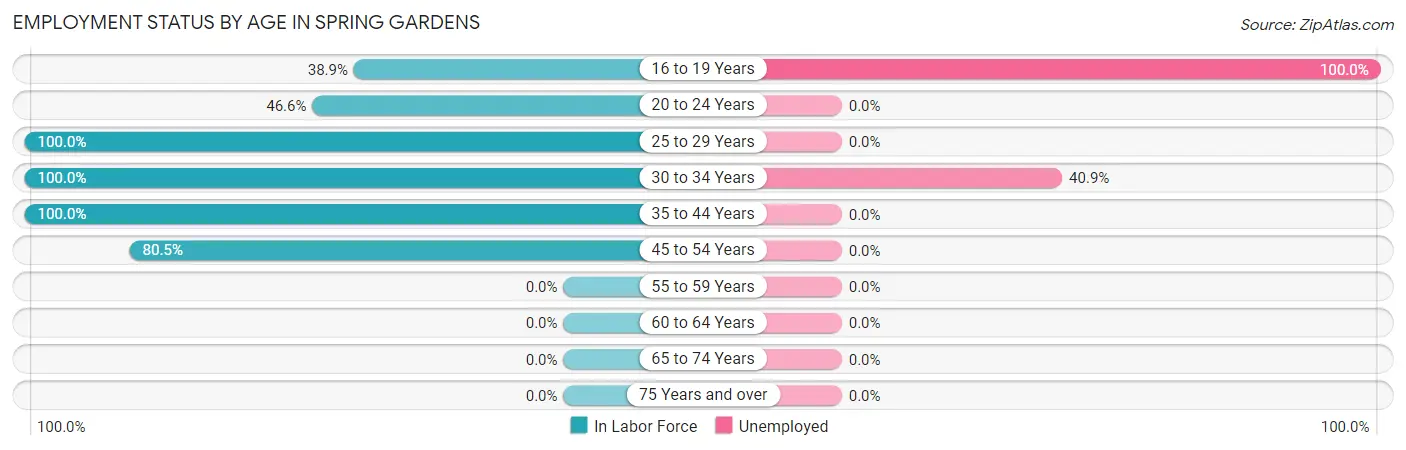
| Age Bracket | In Labor Force | Unemployed |
| 16 to 19 Years | 28 (38.9%) | 28 (100.0%) |
| 20 to 24 Years | 27 (46.6%) | 0 (0.0%) |
| 25 to 29 Years | 57 (100.0%) | 0 (0.0%) |
| 30 to 34 Years | 66 (100.0%) | 27 (40.9%) |
| 35 to 44 Years | 29 (100.0%) | 0 (0.0%) |
| 45 to 54 Years | 107 (80.5%) | 0 (0.0%) |
| 55 to 59 Years | 0 (0.0%) | 0 (0.0%) |
| 60 to 64 Years | 0 (0.0%) | 0 (0.0%) |
| 65 to 74 Years | 0 (0.0%) | 0 (0.0%) |
| 75 Years and over | 0 (0.0%) | 0 (0.0%) |
| Total | 314 (59.7%) | 55 (17.5%) |
Employment Status by Educational Attainment in Spring Gardens
According to labor force statistics for Spring Gardens, 78.0% of individuals (259) out of the total population between 25 and 64 years of age (332) are in the labor force, with 10.4% or 27 of them being unemployed. The group with the highest labor force participation rate are those with the educational attainment of high school diploma, with 100.0% or 148 individuals in the labor force. Within the labor force, individuals with high school diploma education have the highest percentage of unemployment, with 18.2% or 27 of them being unemployed.
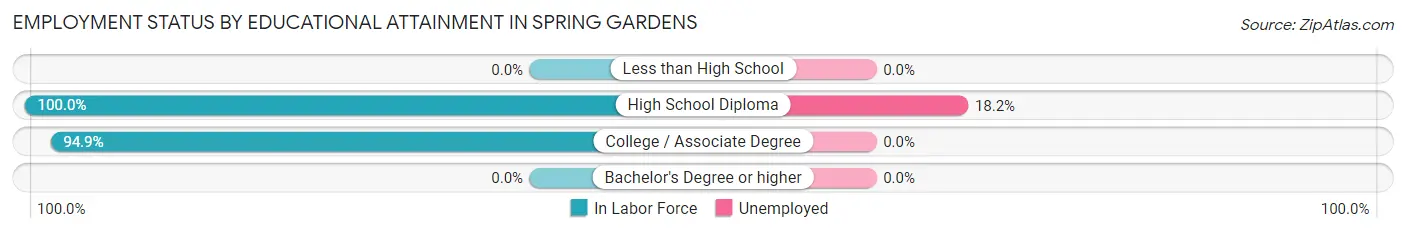
| Educational Attainment | In Labor Force | Unemployed |
| Less than High School | 0 (0.0%) | 0 (0.0%) |
| High School Diploma | 148 (100.0%) | 27 (18.2%) |
| College / Associate Degree | 111 (94.9%) | 0 (0.0%) |
| Bachelor's Degree or higher | 0 (0.0%) | 0 (0.0%) |
| Total | 259 (78.0%) | 35 (10.4%) |
Employment Occupations by Sex in Spring Gardens
Management, Business, Science and Arts Occupations
The most common Management, Business, Science and Arts occupations in Spring Gardens are Community & Social Service (33 | 12.7%), and Education Instruction & Library (33 | 12.7%).
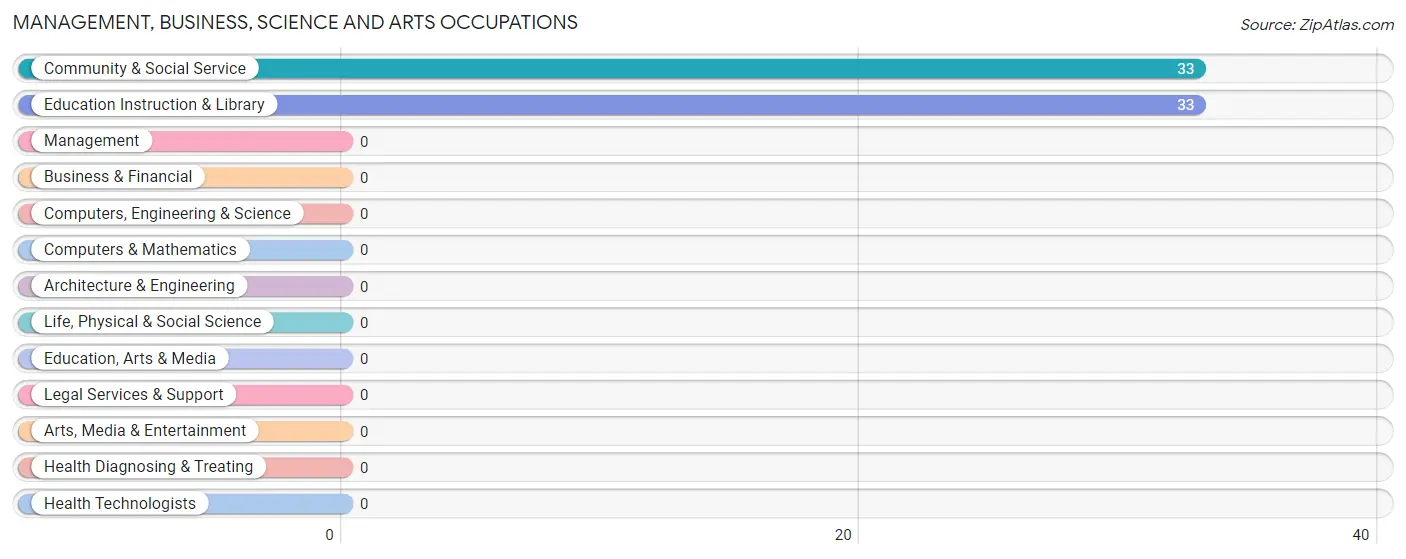
Management, Business, Science and Arts Occupations by Sex
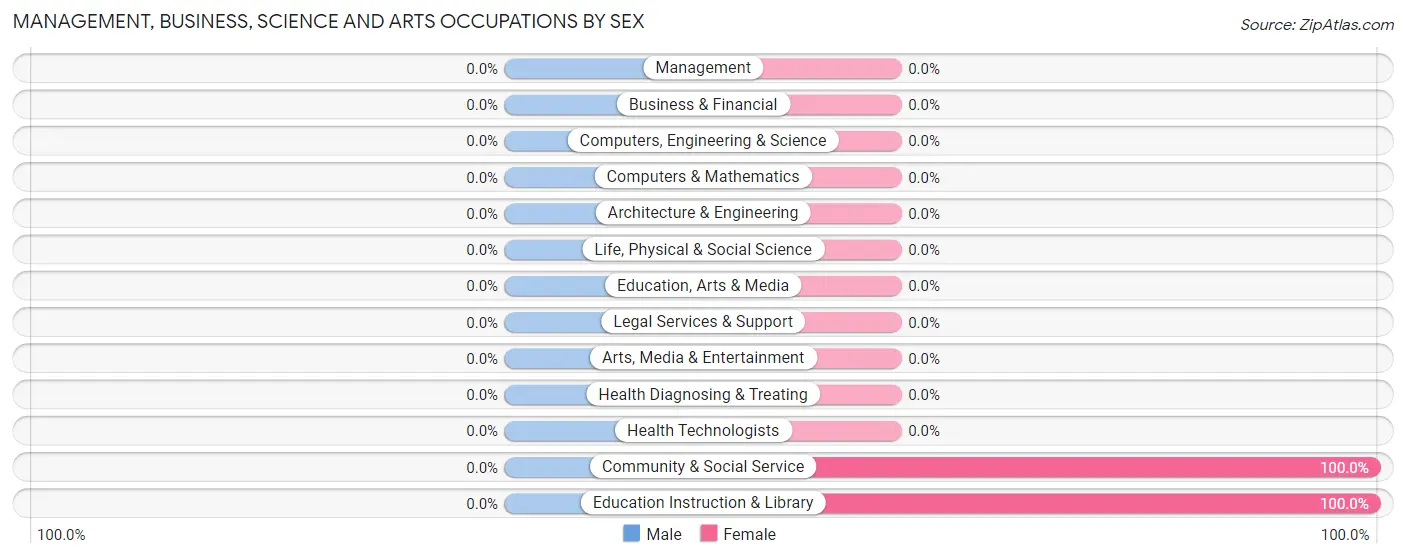
| Occupation | Male | Female |
| Management | 0 (0.0%) | 0 (0.0%) |
| Business & Financial | 0 (0.0%) | 0 (0.0%) |
| Computers, Engineering & Science | 0 (0.0%) | 0 (0.0%) |
| Computers & Mathematics | 0 (0.0%) | 0 (0.0%) |
| Architecture & Engineering | 0 (0.0%) | 0 (0.0%) |
| Life, Physical & Social Science | 0 (0.0%) | 0 (0.0%) |
| Community & Social Service | 0 (0.0%) | 33 (100.0%) |
| Education, Arts & Media | 0 (0.0%) | 0 (0.0%) |
| Legal Services & Support | 0 (0.0%) | 0 (0.0%) |
| Education Instruction & Library | 0 (0.0%) | 33 (100.0%) |
| Arts, Media & Entertainment | 0 (0.0%) | 0 (0.0%) |
| Health Diagnosing & Treating | 0 (0.0%) | 0 (0.0%) |
| Health Technologists | 0 (0.0%) | 0 (0.0%) |
| Total (Category) | 0 (0.0%) | 33 (100.0%) |
| Total (Overall) | 113 (43.6%) | 146 (56.4%) |
Services Occupations
The most common Services occupations in Spring Gardens are Cleaning & Maintenance (60 | 23.2%), Personal Care & Service (38 | 14.7%), and Food Preparation & Serving (13 | 5.0%).
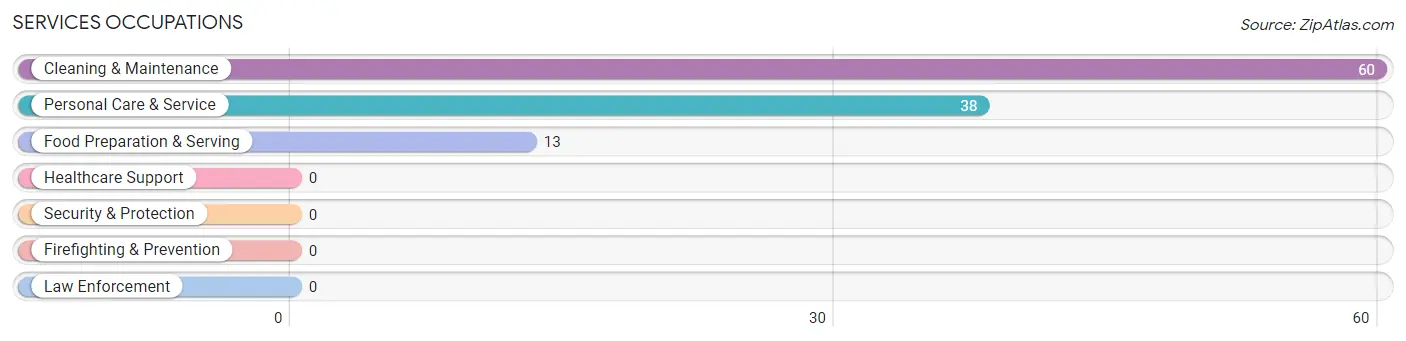
Services Occupations by Sex
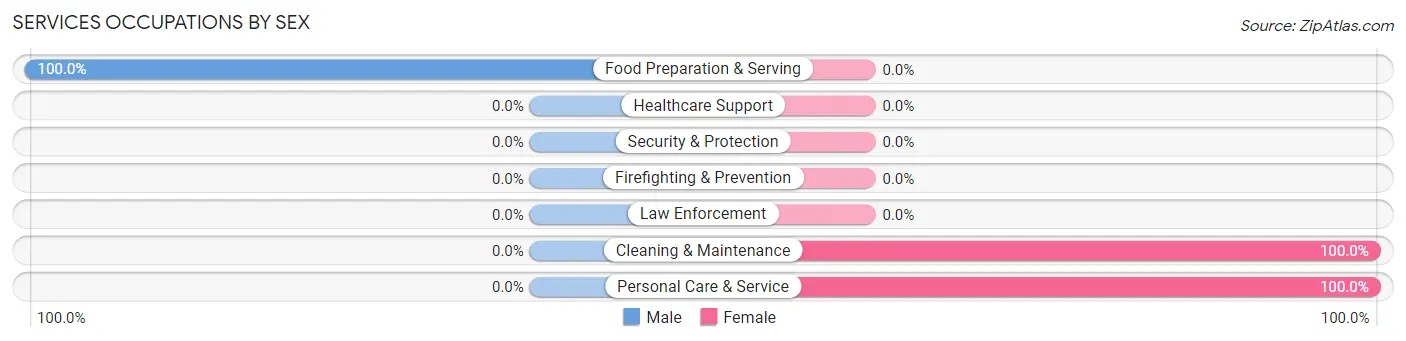
| Occupation | Male | Female |
| Healthcare Support | 0 (0.0%) | 0 (0.0%) |
| Security & Protection | 0 (0.0%) | 0 (0.0%) |
| Firefighting & Prevention | 0 (0.0%) | 0 (0.0%) |
| Law Enforcement | 0 (0.0%) | 0 (0.0%) |
| Food Preparation & Serving | 13 (100.0%) | 0 (0.0%) |
| Cleaning & Maintenance | 0 (0.0%) | 60 (100.0%) |
| Personal Care & Service | 0 (0.0%) | 38 (100.0%) |
| Total (Category) | 13 (11.7%) | 98 (88.3%) |
| Total (Overall) | 113 (43.6%) | 146 (56.4%) |
Sales and Office Occupations
The most common Sales and Office occupations in Spring Gardens are Sales & Related (15 | 5.8%), and Office & Administration (12 | 4.6%).
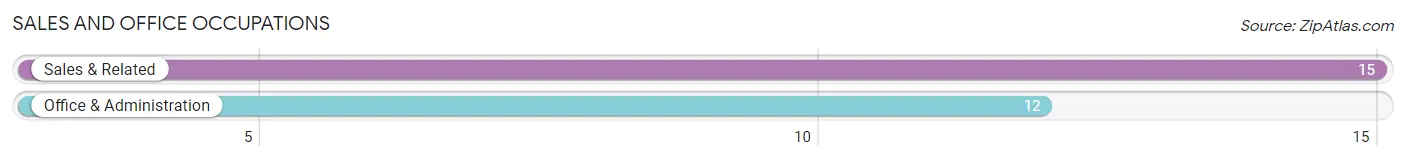
Sales and Office Occupations by Sex
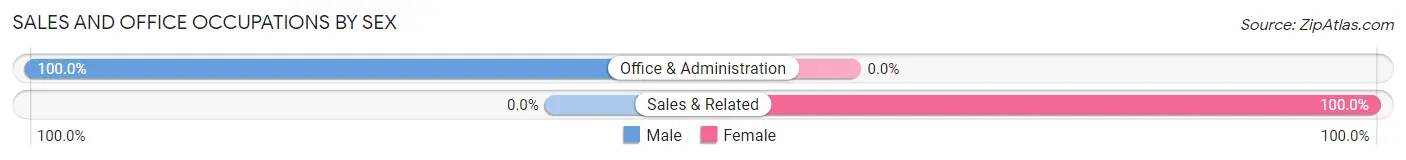
| Occupation | Male | Female |
| Sales & Related | 0 (0.0%) | 15 (100.0%) |
| Office & Administration | 12 (100.0%) | 0 (0.0%) |
| Total (Category) | 12 (44.4%) | 15 (55.6%) |
| Total (Overall) | 113 (43.6%) | 146 (56.4%) |
Natural Resources, Construction and Maintenance Occupations
The most common Natural Resources, Construction and Maintenance occupations in Spring Gardens are Construction & Extraction (29 | 11.2%), and Installation, Maintenance & Repair (25 | 9.7%).
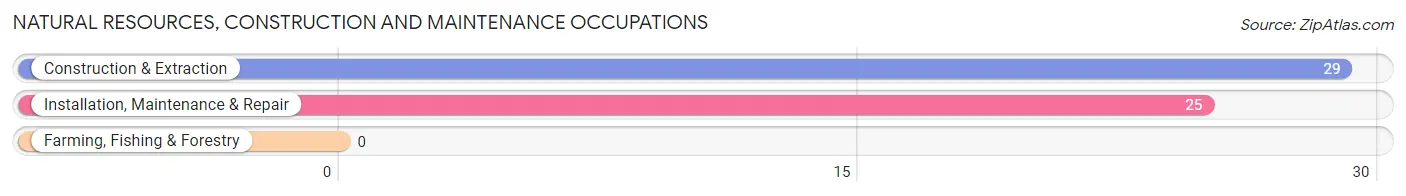
Natural Resources, Construction and Maintenance Occupations by Sex
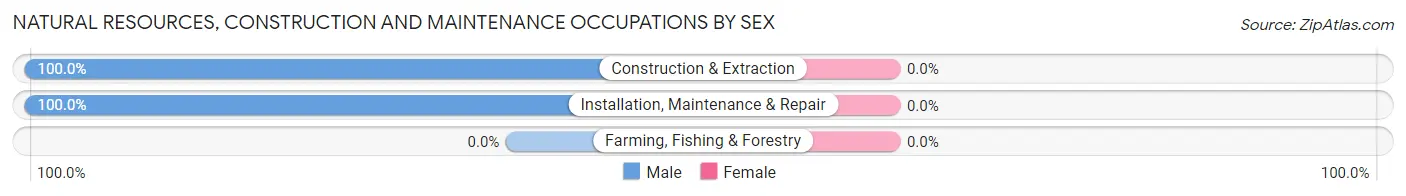
| Occupation | Male | Female |
| Farming, Fishing & Forestry | 0 (0.0%) | 0 (0.0%) |
| Construction & Extraction | 29 (100.0%) | 0 (0.0%) |
| Installation, Maintenance & Repair | 25 (100.0%) | 0 (0.0%) |
| Total (Category) | 54 (100.0%) | 0 (0.0%) |
| Total (Overall) | 113 (43.6%) | 146 (56.4%) |
Production, Transportation and Moving Occupations
The most common Production, Transportation and Moving occupations in Spring Gardens are Transportation (19 | 7.3%), and Production (15 | 5.8%).
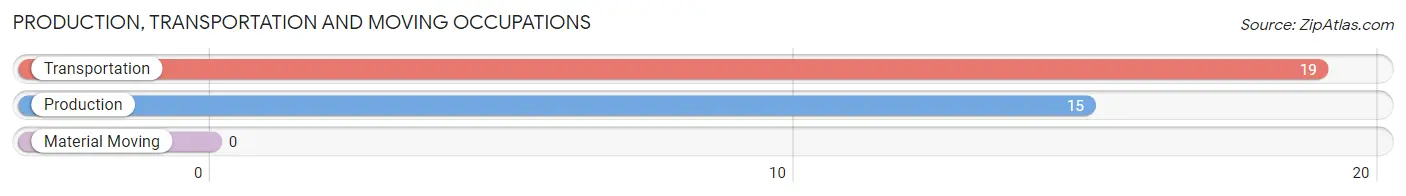
Production, Transportation and Moving Occupations by Sex
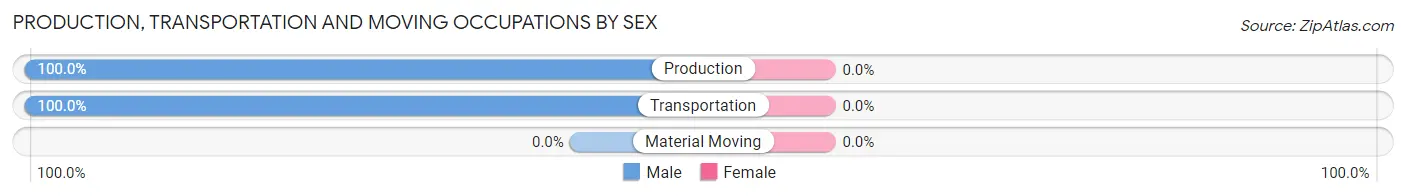
| Occupation | Male | Female |
| Production | 15 (100.0%) | 0 (0.0%) |
| Transportation | 19 (100.0%) | 0 (0.0%) |
| Material Moving | 0 (0.0%) | 0 (0.0%) |
| Total (Category) | 34 (100.0%) | 0 (0.0%) |
| Total (Overall) | 113 (43.6%) | 146 (56.4%) |
Employment Industries by Sex in Spring Gardens
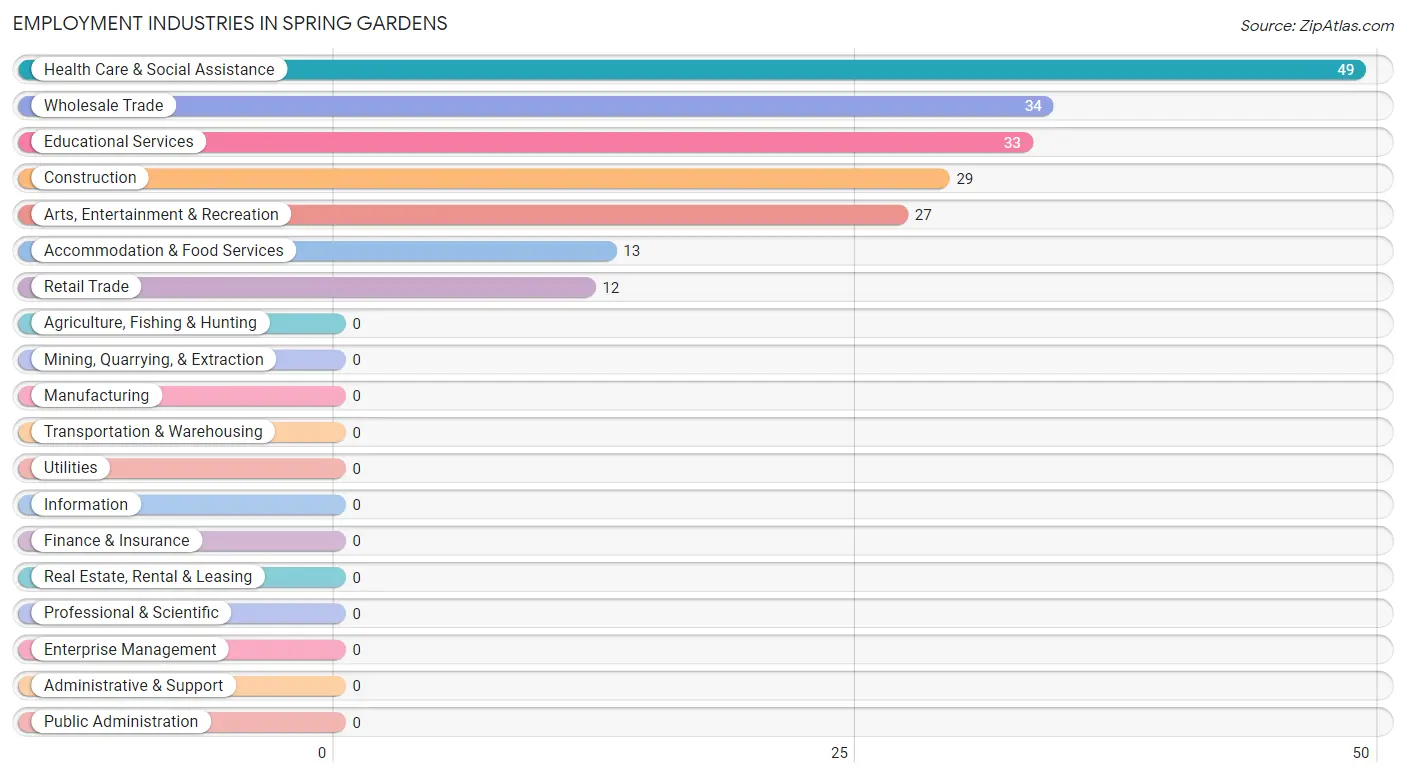
Employment Industries in Spring Gardens
The major employment industries in Spring Gardens include Health Care & Social Assistance (49 | 18.9%), Wholesale Trade (34 | 13.1%), Educational Services (33 | 12.7%), Construction (29 | 11.2%), and Arts, Entertainment & Recreation (27 | 10.4%).
Employment Industries by Sex in Spring Gardens
The Spring Gardens industries that see more men than women are Construction (100.0%), Wholesale Trade (100.0%), and Retail Trade (100.0%), whereas the industries that tend to have a higher number of women are Educational Services (100.0%), Health Care & Social Assistance (100.0%), and Arts, Entertainment & Recreation (100.0%).
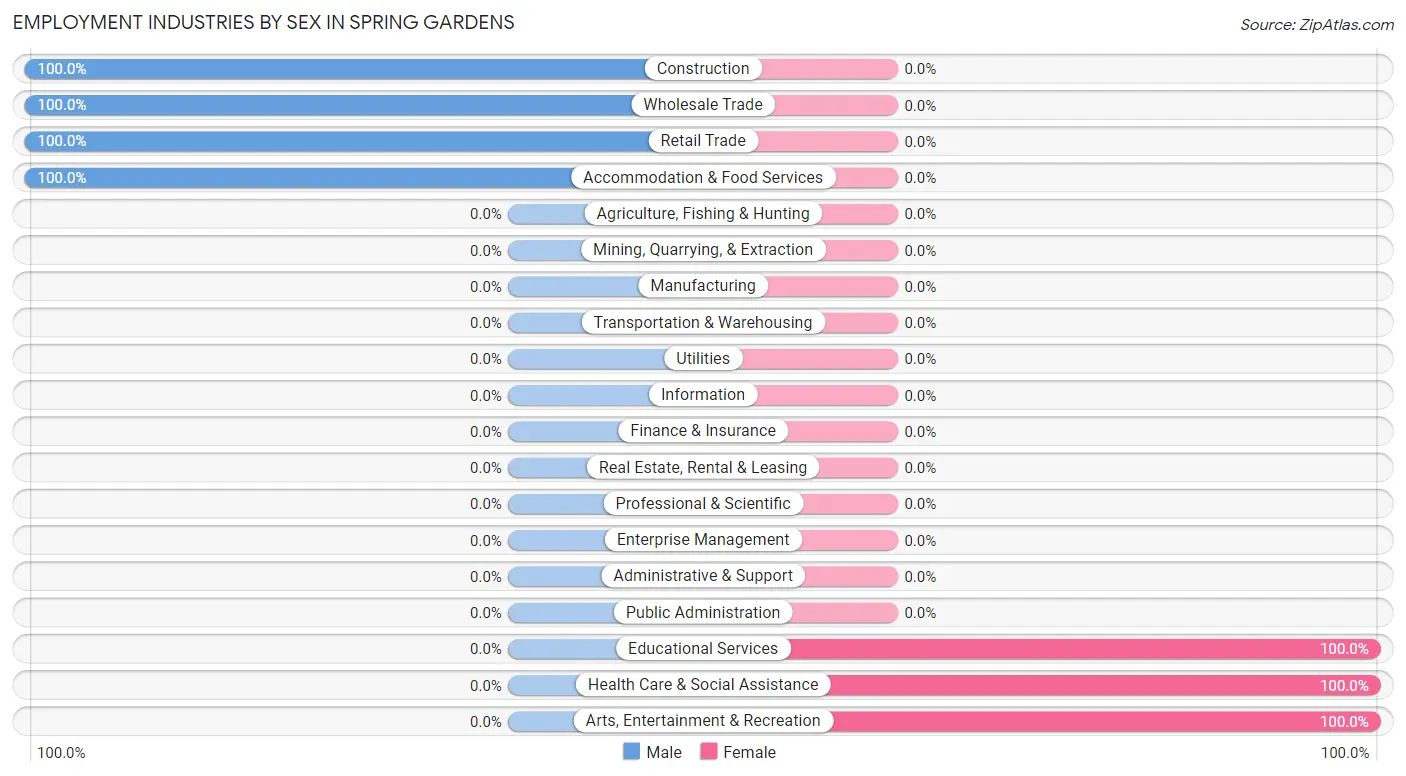
| Industry | Male | Female |
| Agriculture, Fishing & Hunting | 0 (0.0%) | 0 (0.0%) |
| Mining, Quarrying, & Extraction | 0 (0.0%) | 0 (0.0%) |
| Construction | 29 (100.0%) | 0 (0.0%) |
| Manufacturing | 0 (0.0%) | 0 (0.0%) |
| Wholesale Trade | 34 (100.0%) | 0 (0.0%) |
| Retail Trade | 12 (100.0%) | 0 (0.0%) |
| Transportation & Warehousing | 0 (0.0%) | 0 (0.0%) |
| Utilities | 0 (0.0%) | 0 (0.0%) |
| Information | 0 (0.0%) | 0 (0.0%) |
| Finance & Insurance | 0 (0.0%) | 0 (0.0%) |
| Real Estate, Rental & Leasing | 0 (0.0%) | 0 (0.0%) |
| Professional & Scientific | 0 (0.0%) | 0 (0.0%) |
| Enterprise Management | 0 (0.0%) | 0 (0.0%) |
| Administrative & Support | 0 (0.0%) | 0 (0.0%) |
| Educational Services | 0 (0.0%) | 33 (100.0%) |
| Health Care & Social Assistance | 0 (0.0%) | 49 (100.0%) |
| Arts, Entertainment & Recreation | 0 (0.0%) | 27 (100.0%) |
| Accommodation & Food Services | 13 (100.0%) | 0 (0.0%) |
| Public Administration | 0 (0.0%) | 0 (0.0%) |
| Total | 113 (43.6%) | 146 (56.4%) |
Education in Spring Gardens
School Enrollment in Spring Gardens
The most common levels of schooling among the 331 students in Spring Gardens are middle school (109 | 32.9%), college / undergraduate (86 | 26.0%), and nursery / preschool (49 | 14.8%).
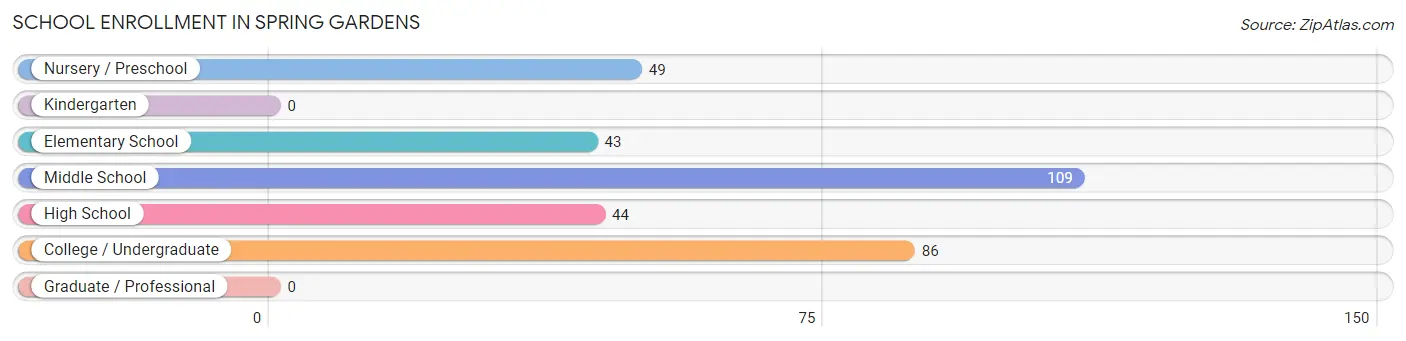
| School Level | # Students | % Students |
| Nursery / Preschool | 49 | 14.8% |
| Kindergarten | 0 | 0.0% |
| Elementary School | 43 | 13.0% |
| Middle School | 109 | 32.9% |
| High School | 44 | 13.3% |
| College / Undergraduate | 86 | 26.0% |
| Graduate / Professional | 0 | 0.0% |
| Total | 331 | 100.0% |
School Enrollment by Age by Funding Source in Spring Gardens
Out of a total of 331 students who are enrolled in schools in Spring Gardens, 15 (4.5%) attend a private institution, while the remaining 316 (95.5%) are enrolled in public schools. The age group of 20 to 24 year olds has the highest likelihood of being enrolled in private schools, with 15 (25.9% in the age bracket) enrolled. Conversely, the age group of 3 to 4 year olds has the lowest likelihood of being enrolled in a private school, with 49 (100.0% in the age bracket) attending a public institution.
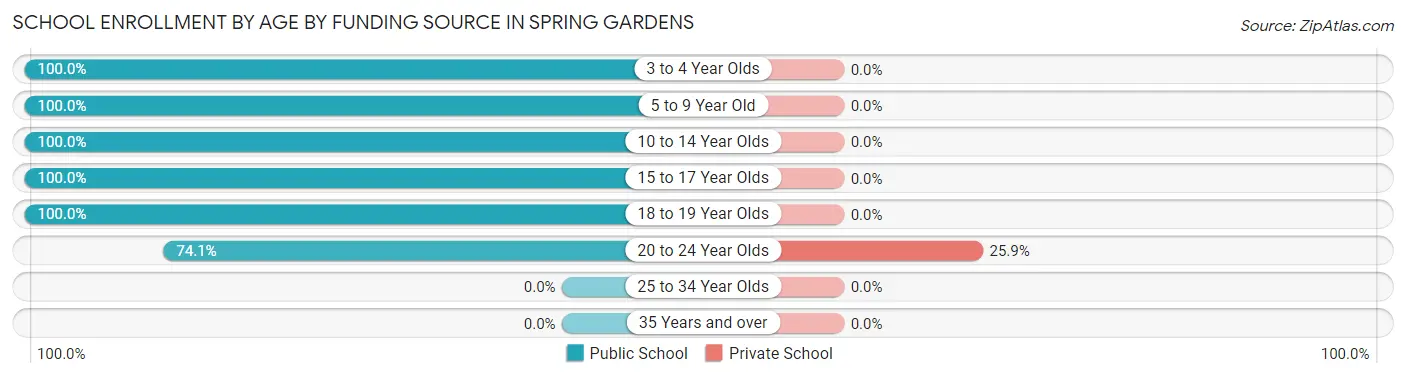
| Age Bracket | Public School | Private School |
| 3 to 4 Year Olds | 49 (100.0%) | 0 (0.0%) |
| 5 to 9 Year Old | 43 (100.0%) | 0 (0.0%) |
| 10 to 14 Year Olds | 109 (100.0%) | 0 (0.0%) |
| 15 to 17 Year Olds | 44 (100.0%) | 0 (0.0%) |
| 18 to 19 Year Olds | 28 (100.0%) | 0 (0.0%) |
| 20 to 24 Year Olds | 43 (74.1%) | 15 (25.9%) |
| 25 to 34 Year Olds | 0 (0.0%) | 0 (0.0%) |
| 35 Years and over | 0 (0.0%) | 0 (0.0%) |
| Total | 316 (95.5%) | 15 (4.5%) |
Educational Attainment by Field of Study in Spring Gardens
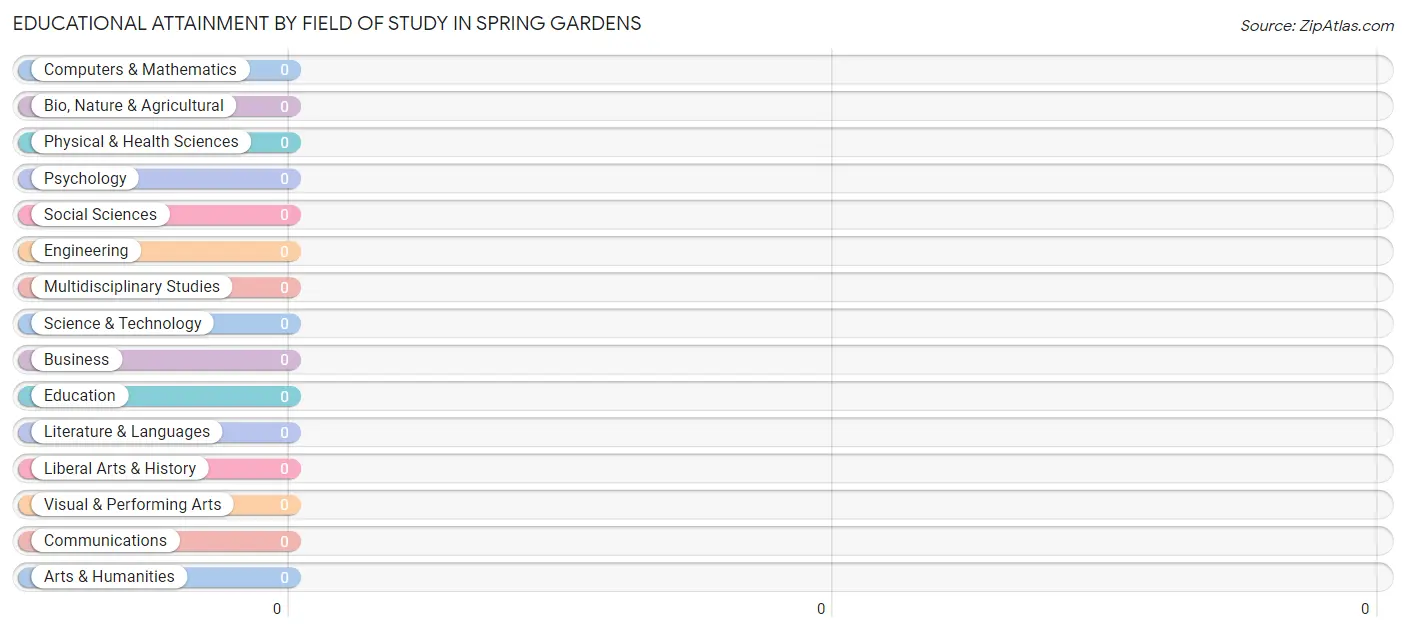
| Field of Study | # Graduates | % Graduates |
| Computers & Mathematics | 0 | 0.0% |
| Bio, Nature & Agricultural | 0 | 0.0% |
| Physical & Health Sciences | 0 | 0.0% |
| Psychology | 0 | 0.0% |
| Social Sciences | 0 | 0.0% |
| Engineering | 0 | 0.0% |
| Multidisciplinary Studies | 0 | 0.0% |
| Science & Technology | 0 | 0.0% |
| Business | 0 | 0.0% |
| Education | 0 | 0.0% |
| Literature & Languages | 0 | 0.0% |
| Liberal Arts & History | 0 | 0.0% |
| Visual & Performing Arts | 0 | 0.0% |
| Communications | 0 | 0.0% |
| Arts & Humanities | 0 | 0.0% |
| Total | 0 | 0.0% |
Transportation & Commute in Spring Gardens
Vehicle Availability by Sex in Spring Gardens
The most prevalent vehicle ownership categories in Spring Gardens are males with 4 vehicles (50, accounting for 44.3%) and females with 4 vehicles (24, making up 34.3%).
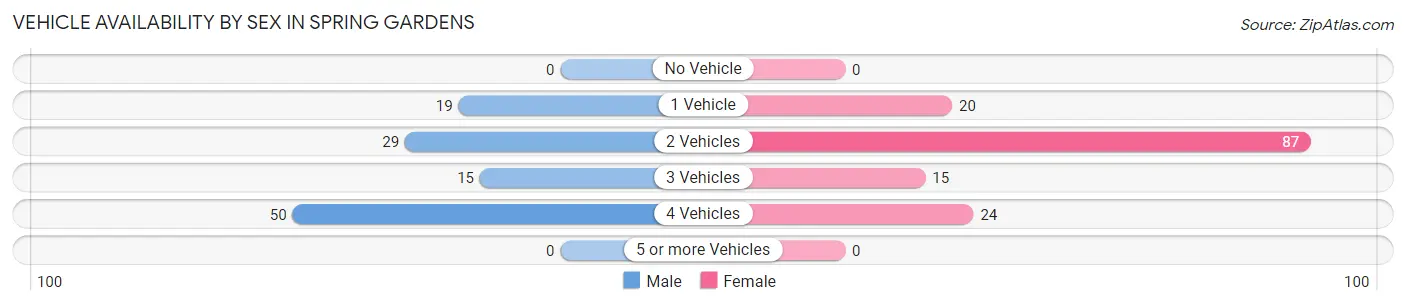
| Vehicles Available | Male | Female |
| No Vehicle | 0 (0.0%) | 0 (0.0%) |
| 1 Vehicle | 19 (16.8%) | 20 (13.7%) |
| 2 Vehicles | 29 (25.7%) | 87 (59.6%) |
| 3 Vehicles | 15 (13.3%) | 15 (10.3%) |
| 4 Vehicles | 50 (44.3%) | 24 (16.4%) |
| 5 or more Vehicles | 0 (0.0%) | 0 (0.0%) |
| Total | 113 (100.0%) | 146 (100.0%) |
Commute Time in Spring Gardens
The most frequently occuring commute durations in Spring Gardens are 25 to 29 minutes (61 commuters, 23.5%), 5 to 9 minutes (44 commuters, 17.0%), and 20 to 24 minutes (40 commuters, 15.4%).
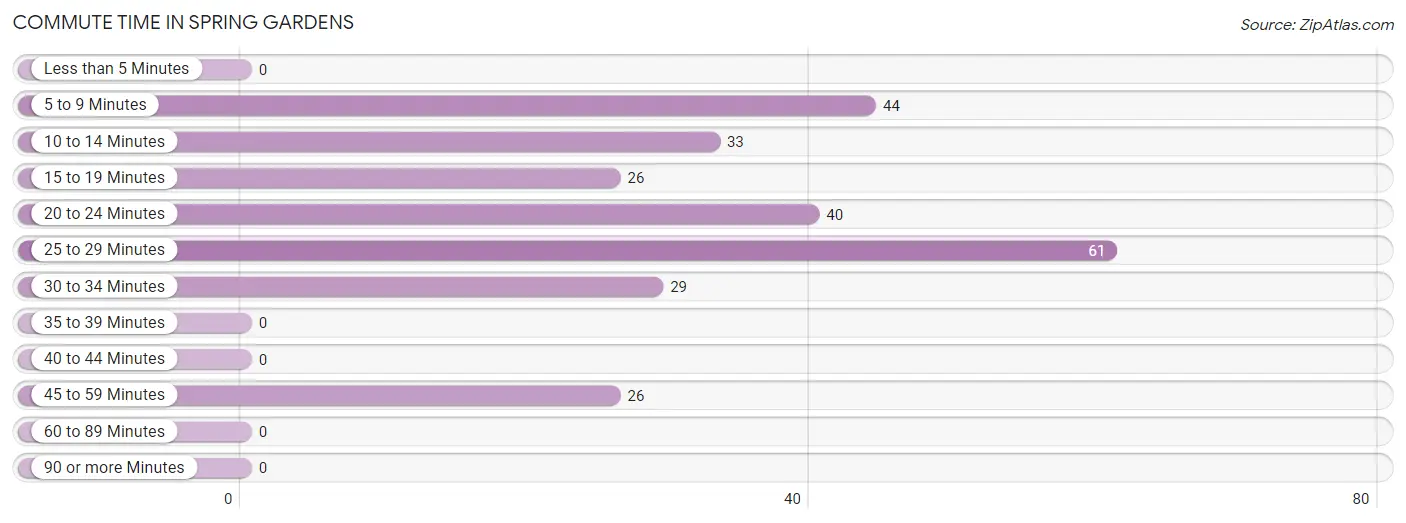
| Commute Time | # Commuters | % Commuters |
| Less than 5 Minutes | 0 | 0.0% |
| 5 to 9 Minutes | 44 | 17.0% |
| 10 to 14 Minutes | 33 | 12.7% |
| 15 to 19 Minutes | 26 | 10.0% |
| 20 to 24 Minutes | 40 | 15.4% |
| 25 to 29 Minutes | 61 | 23.5% |
| 30 to 34 Minutes | 29 | 11.2% |
| 35 to 39 Minutes | 0 | 0.0% |
| 40 to 44 Minutes | 0 | 0.0% |
| 45 to 59 Minutes | 26 | 10.0% |
| 60 to 89 Minutes | 0 | 0.0% |
| 90 or more Minutes | 0 | 0.0% |
Commute Time by Sex in Spring Gardens
The most common commute times in Spring Gardens are 5 to 9 minutes (44 commuters, 38.9%) for males and 25 to 29 minutes (34 commuters, 23.3%) for females.
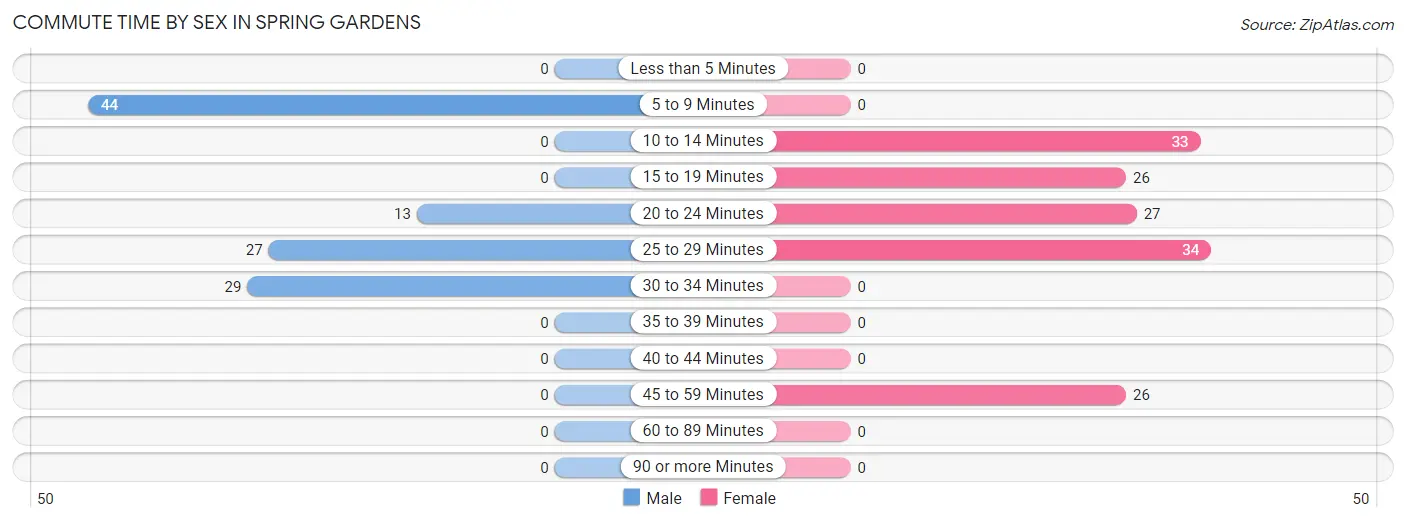
| Commute Time | Male | Female |
| Less than 5 Minutes | 0 (0.0%) | 0 (0.0%) |
| 5 to 9 Minutes | 44 (38.9%) | 0 (0.0%) |
| 10 to 14 Minutes | 0 (0.0%) | 33 (22.6%) |
| 15 to 19 Minutes | 0 (0.0%) | 26 (17.8%) |
| 20 to 24 Minutes | 13 (11.5%) | 27 (18.5%) |
| 25 to 29 Minutes | 27 (23.9%) | 34 (23.3%) |
| 30 to 34 Minutes | 29 (25.7%) | 0 (0.0%) |
| 35 to 39 Minutes | 0 (0.0%) | 0 (0.0%) |
| 40 to 44 Minutes | 0 (0.0%) | 0 (0.0%) |
| 45 to 59 Minutes | 0 (0.0%) | 26 (17.8%) |
| 60 to 89 Minutes | 0 (0.0%) | 0 (0.0%) |
| 90 or more Minutes | 0 (0.0%) | 0 (0.0%) |
Time of Departure to Work by Sex in Spring Gardens
The most frequent times of departure to work in Spring Gardens are 6:00 AM to 6:29 AM (32, 28.3%) for males and 6:00 AM to 6:29 AM (87, 59.6%) for females.
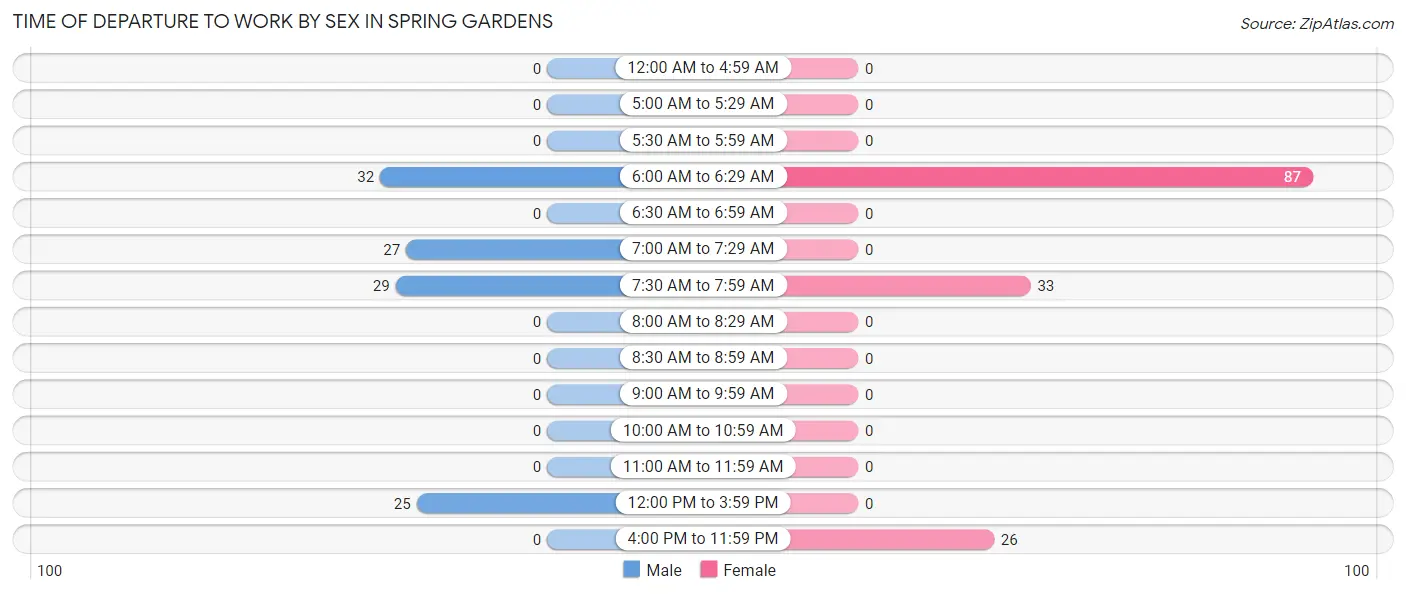
| Time of Departure | Male | Female |
| 12:00 AM to 4:59 AM | 0 (0.0%) | 0 (0.0%) |
| 5:00 AM to 5:29 AM | 0 (0.0%) | 0 (0.0%) |
| 5:30 AM to 5:59 AM | 0 (0.0%) | 0 (0.0%) |
| 6:00 AM to 6:29 AM | 32 (28.3%) | 87 (59.6%) |
| 6:30 AM to 6:59 AM | 0 (0.0%) | 0 (0.0%) |
| 7:00 AM to 7:29 AM | 27 (23.9%) | 0 (0.0%) |
| 7:30 AM to 7:59 AM | 29 (25.7%) | 33 (22.6%) |
| 8:00 AM to 8:29 AM | 0 (0.0%) | 0 (0.0%) |
| 8:30 AM to 8:59 AM | 0 (0.0%) | 0 (0.0%) |
| 9:00 AM to 9:59 AM | 0 (0.0%) | 0 (0.0%) |
| 10:00 AM to 10:59 AM | 0 (0.0%) | 0 (0.0%) |
| 11:00 AM to 11:59 AM | 0 (0.0%) | 0 (0.0%) |
| 12:00 PM to 3:59 PM | 25 (22.1%) | 0 (0.0%) |
| 4:00 PM to 11:59 PM | 0 (0.0%) | 26 (17.8%) |
| Total | 113 (100.0%) | 146 (100.0%) |
Housing Occupancy in Spring Gardens
Occupancy by Ownership in Spring Gardens
Of the total 154 dwellings in Spring Gardens, owner-occupied units account for 134 (87.0%), while renter-occupied units make up 20 (13.0%).
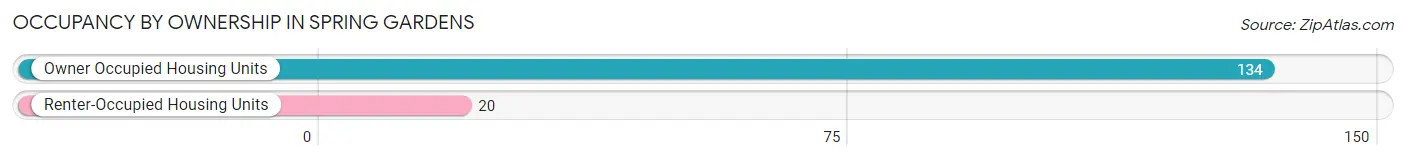
| Occupancy | # Housing Units | % Housing Units |
| Owner Occupied Housing Units | 134 | 87.0% |
| Renter-Occupied Housing Units | 20 | 13.0% |
| Total Occupied Housing Units | 154 | 100.0% |
Occupancy by Household Size in Spring Gardens
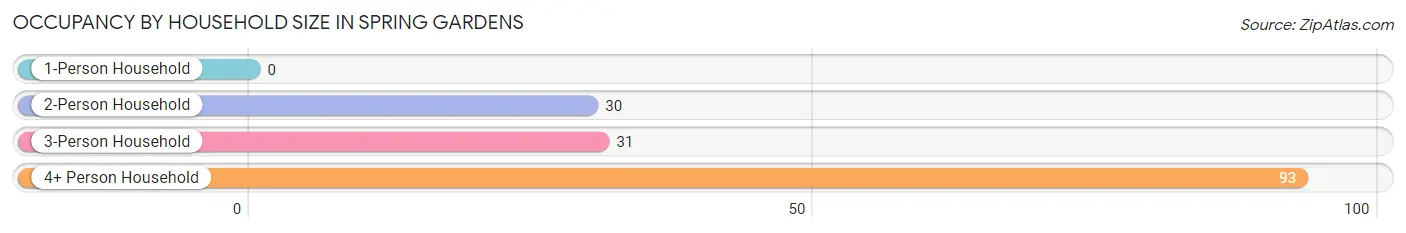
| Household Size | # Housing Units | % Housing Units |
| 1-Person Household | 0 | 0.0% |
| 2-Person Household | 30 | 19.5% |
| 3-Person Household | 31 | 20.1% |
| 4+ Person Household | 93 | 60.4% |
| Total Housing Units | 154 | 100.0% |
Occupancy by Ownership by Household Size in Spring Gardens
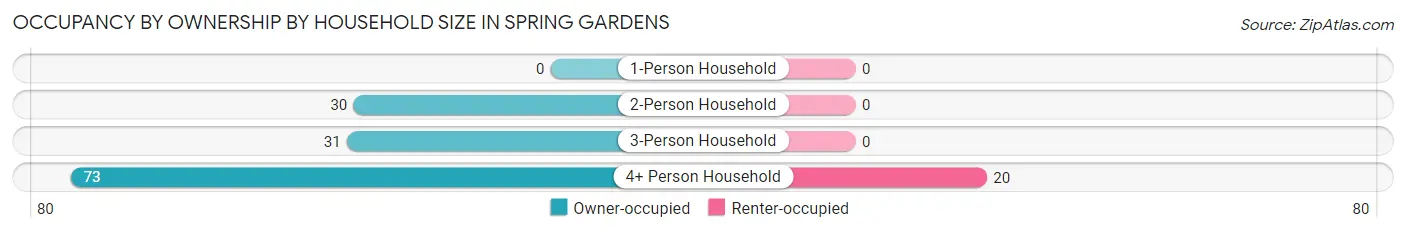
| Household Size | Owner-occupied | Renter-occupied |
| 1-Person Household | 0 (0.0%) | 0 (0.0%) |
| 2-Person Household | 30 (100.0%) | 0 (0.0%) |
| 3-Person Household | 31 (100.0%) | 0 (0.0%) |
| 4+ Person Household | 73 (78.5%) | 20 (21.5%) |
| Total Housing Units | 134 (87.0%) | 20 (13.0%) |
Occupancy by Educational Attainment in Spring Gardens
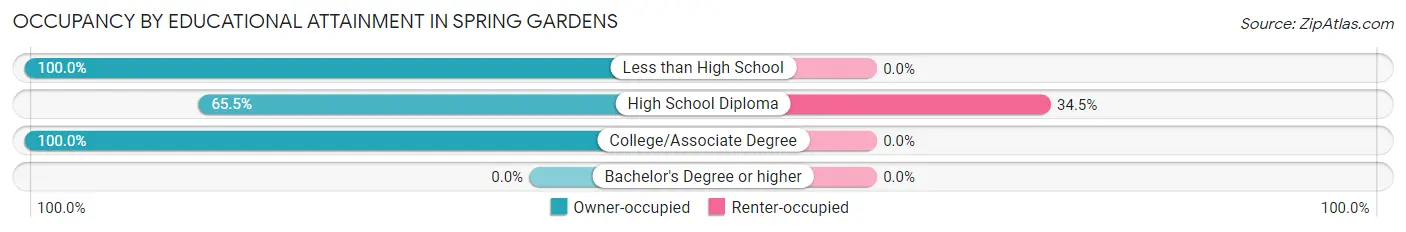
| Household Size | Owner-occupied | Renter-occupied |
| Less than High School | 19 (100.0%) | 0 (0.0%) |
| High School Diploma | 38 (65.5%) | 20 (34.5%) |
| College/Associate Degree | 77 (100.0%) | 0 (0.0%) |
| Bachelor's Degree or higher | 0 (0.0%) | 0 (0.0%) |
Occupancy by Age of Householder in Spring Gardens
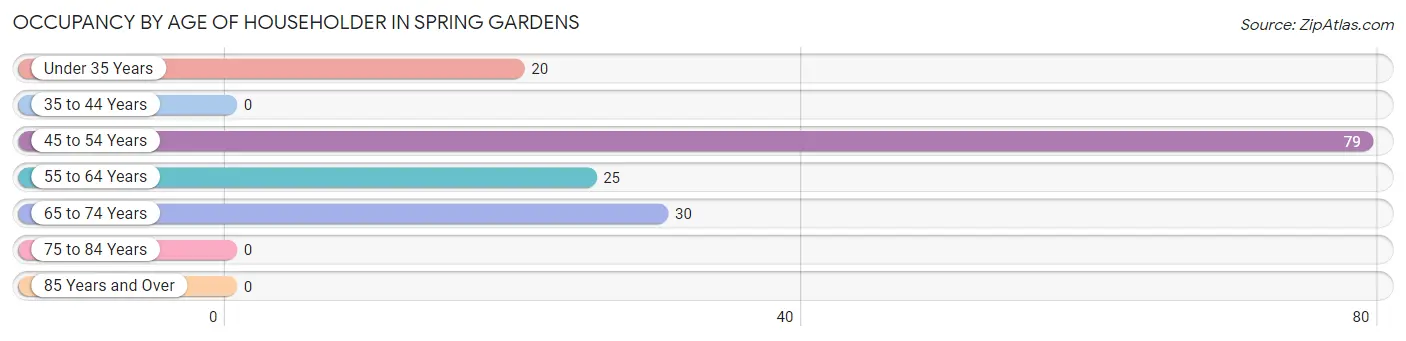
| Age Bracket | # Households | % Households |
| Under 35 Years | 20 | 13.0% |
| 35 to 44 Years | 0 | 0.0% |
| 45 to 54 Years | 79 | 51.3% |
| 55 to 64 Years | 25 | 16.2% |
| 65 to 74 Years | 30 | 19.5% |
| 75 to 84 Years | 0 | 0.0% |
| 85 Years and Over | 0 | 0.0% |
| Total | 154 | 100.0% |
Housing Finances in Spring Gardens
Median Income by Occupancy in Spring Gardens
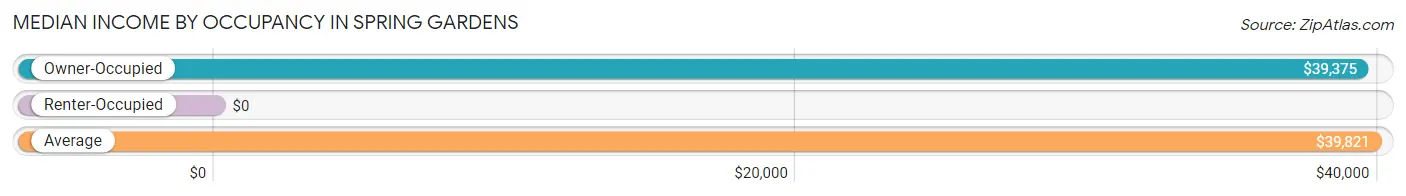
| Occupancy Type | # Households | Median Income |
| Owner-Occupied | 134 (87.0%) | $39,375 |
| Renter-Occupied | 20 (13.0%) | $0 |
| Average | 154 (100.0%) | $39,821 |
Occupancy by Householder Income Bracket in Spring Gardens
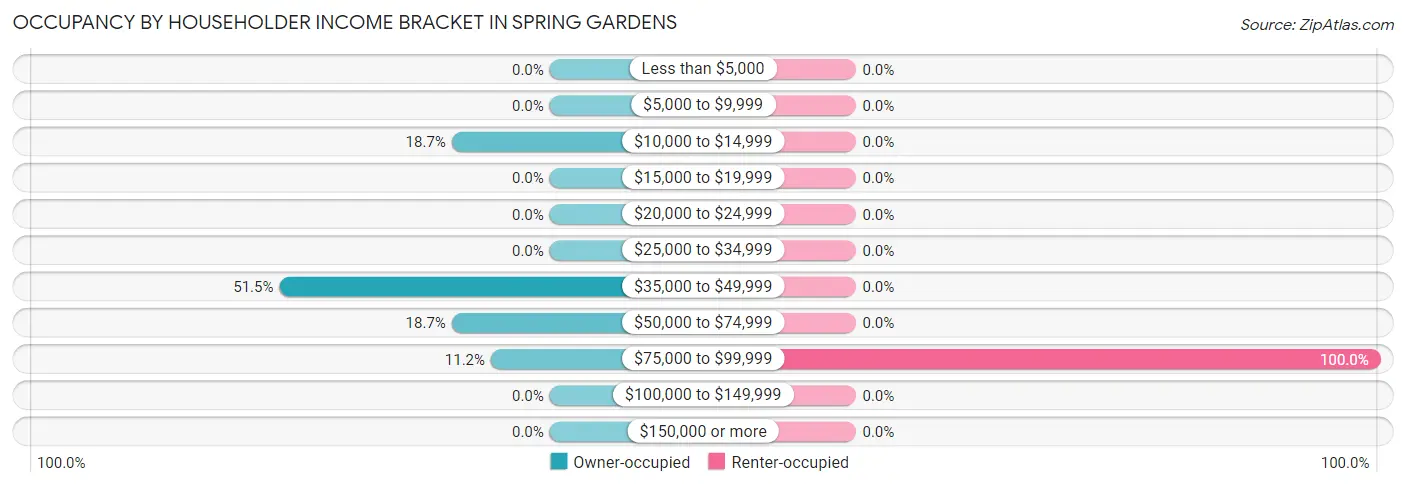
| Income Bracket | Owner-occupied | Renter-occupied |
| Less than $5,000 | 0 (0.0%) | 0 (0.0%) |
| $5,000 to $9,999 | 0 (0.0%) | 0 (0.0%) |
| $10,000 to $14,999 | 25 (18.7%) | 0 (0.0%) |
| $15,000 to $19,999 | 0 (0.0%) | 0 (0.0%) |
| $20,000 to $24,999 | 0 (0.0%) | 0 (0.0%) |
| $25,000 to $34,999 | 0 (0.0%) | 0 (0.0%) |
| $35,000 to $49,999 | 69 (51.5%) | 0 (0.0%) |
| $50,000 to $74,999 | 25 (18.7%) | 0 (0.0%) |
| $75,000 to $99,999 | 15 (11.2%) | 20 (100.0%) |
| $100,000 to $149,999 | 0 (0.0%) | 0 (0.0%) |
| $150,000 or more | 0 (0.0%) | 0 (0.0%) |
| Total | 134 (100.0%) | 20 (100.0%) |
Monthly Housing Cost Tiers in Spring Gardens
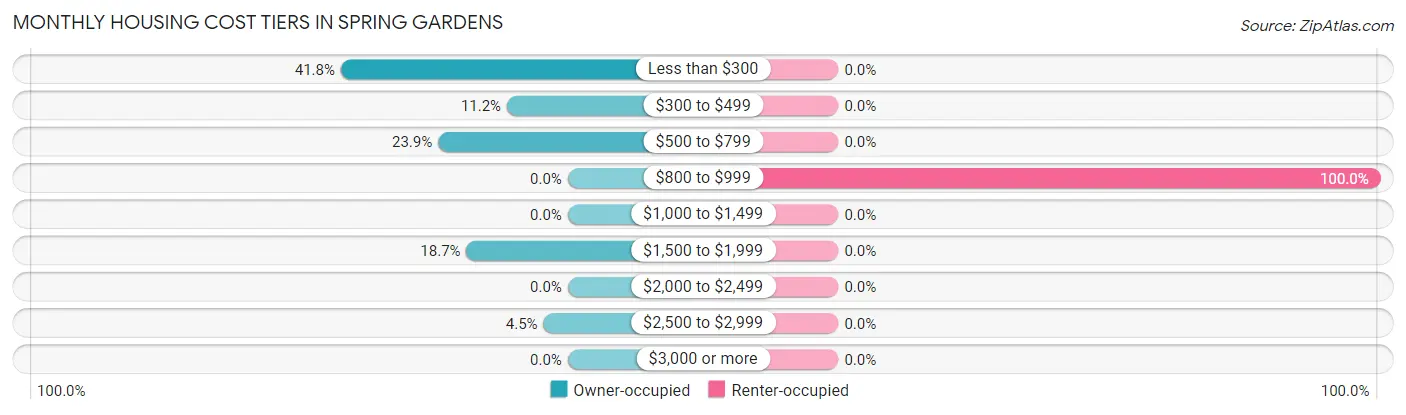
| Monthly Cost | Owner-occupied | Renter-occupied |
| Less than $300 | 56 (41.8%) | 0 (0.0%) |
| $300 to $499 | 15 (11.2%) | 0 (0.0%) |
| $500 to $799 | 32 (23.9%) | 0 (0.0%) |
| $800 to $999 | 0 (0.0%) | 20 (100.0%) |
| $1,000 to $1,499 | 0 (0.0%) | 0 (0.0%) |
| $1,500 to $1,999 | 25 (18.7%) | 0 (0.0%) |
| $2,000 to $2,499 | 0 (0.0%) | 0 (0.0%) |
| $2,500 to $2,999 | 6 (4.5%) | 0 (0.0%) |
| $3,000 or more | 0 (0.0%) | 0 (0.0%) |
| Total | 134 (100.0%) | 20 (100.0%) |
Physical Housing Characteristics in Spring Gardens
Housing Structures in Spring Gardens
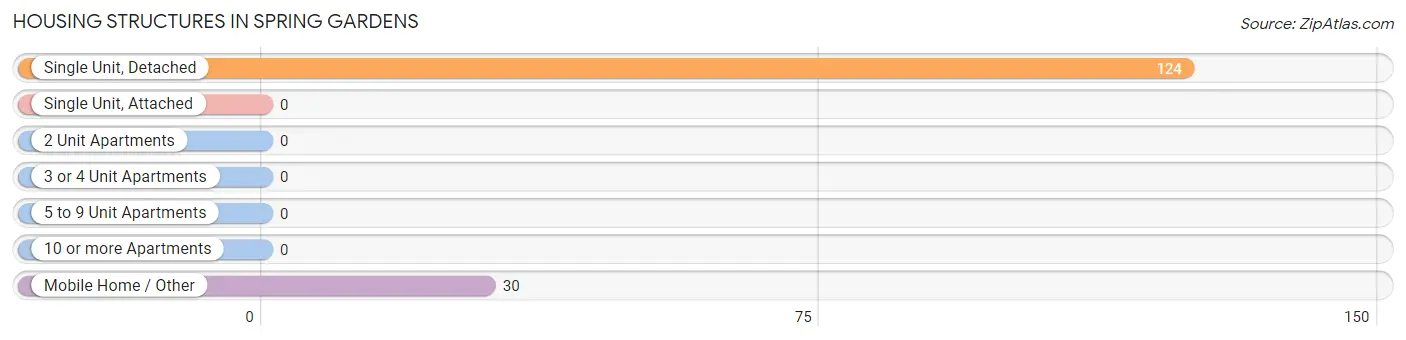
| Structure Type | # Housing Units | % Housing Units |
| Single Unit, Detached | 124 | 80.5% |
| Single Unit, Attached | 0 | 0.0% |
| 2 Unit Apartments | 0 | 0.0% |
| 3 or 4 Unit Apartments | 0 | 0.0% |
| 5 to 9 Unit Apartments | 0 | 0.0% |
| 10 or more Apartments | 0 | 0.0% |
| Mobile Home / Other | 30 | 19.5% |
| Total | 154 | 100.0% |
Housing Structures by Occupancy in Spring Gardens
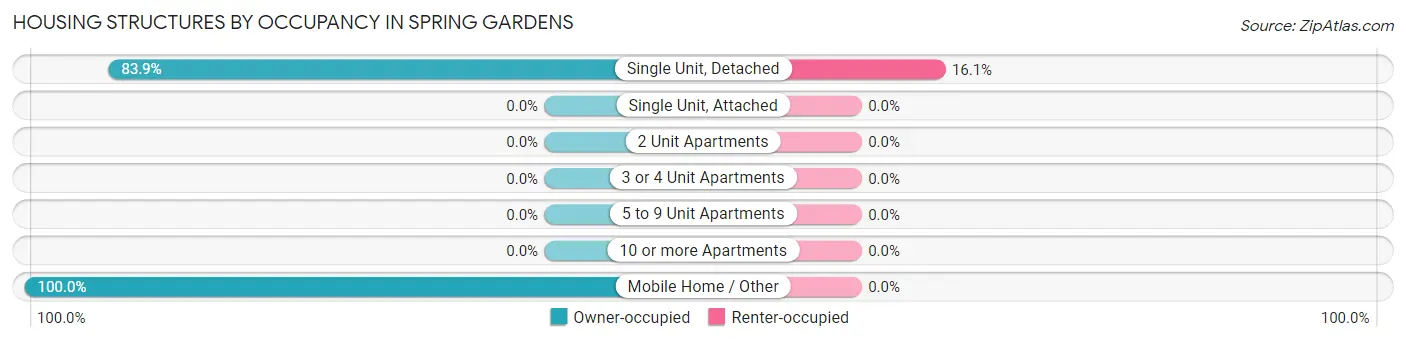
| Structure Type | Owner-occupied | Renter-occupied |
| Single Unit, Detached | 104 (83.9%) | 20 (16.1%) |
| Single Unit, Attached | 0 (0.0%) | 0 (0.0%) |
| 2 Unit Apartments | 0 (0.0%) | 0 (0.0%) |
| 3 or 4 Unit Apartments | 0 (0.0%) | 0 (0.0%) |
| 5 to 9 Unit Apartments | 0 (0.0%) | 0 (0.0%) |
| 10 or more Apartments | 0 (0.0%) | 0 (0.0%) |
| Mobile Home / Other | 30 (100.0%) | 0 (0.0%) |
| Total | 134 (87.0%) | 20 (13.0%) |
Housing Structures by Number of Rooms in Spring Gardens
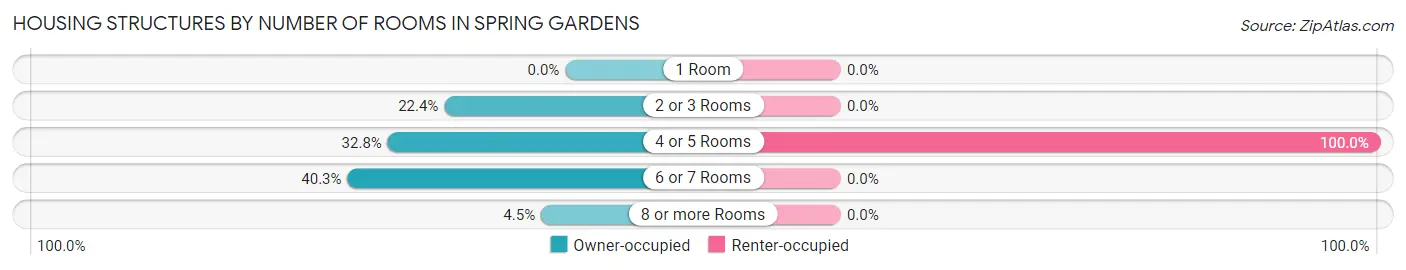
| Number of Rooms | Owner-occupied | Renter-occupied |
| 1 Room | 0 (0.0%) | 0 (0.0%) |
| 2 or 3 Rooms | 30 (22.4%) | 0 (0.0%) |
| 4 or 5 Rooms | 44 (32.8%) | 20 (100.0%) |
| 6 or 7 Rooms | 54 (40.3%) | 0 (0.0%) |
| 8 or more Rooms | 6 (4.5%) | 0 (0.0%) |
| Total | 134 (100.0%) | 20 (100.0%) |
Housing Structure by Heating Type in Spring Gardens
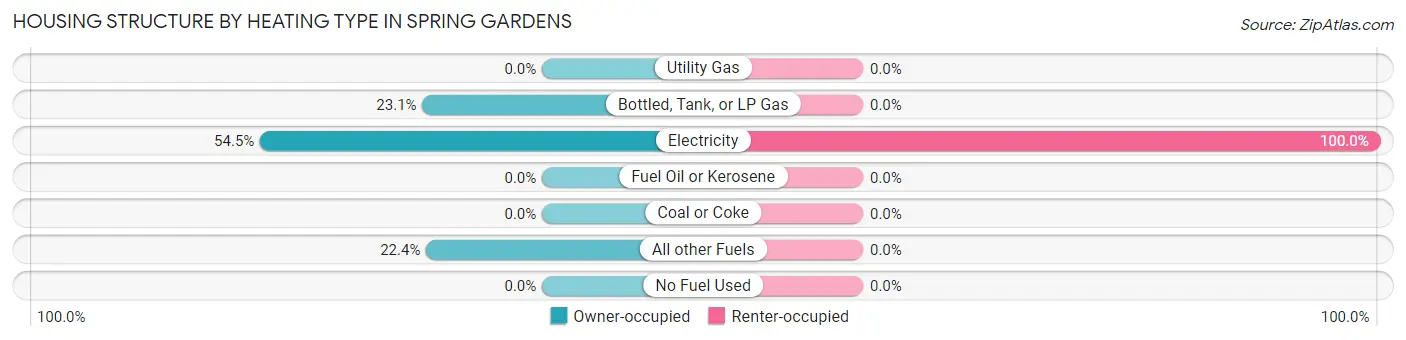
| Heating Type | Owner-occupied | Renter-occupied |
| Utility Gas | 0 (0.0%) | 0 (0.0%) |
| Bottled, Tank, or LP Gas | 31 (23.1%) | 0 (0.0%) |
| Electricity | 73 (54.5%) | 20 (100.0%) |
| Fuel Oil or Kerosene | 0 (0.0%) | 0 (0.0%) |
| Coal or Coke | 0 (0.0%) | 0 (0.0%) |
| All other Fuels | 30 (22.4%) | 0 (0.0%) |
| No Fuel Used | 0 (0.0%) | 0 (0.0%) |
| Total | 134 (100.0%) | 20 (100.0%) |
Household Vehicle Usage in Spring Gardens
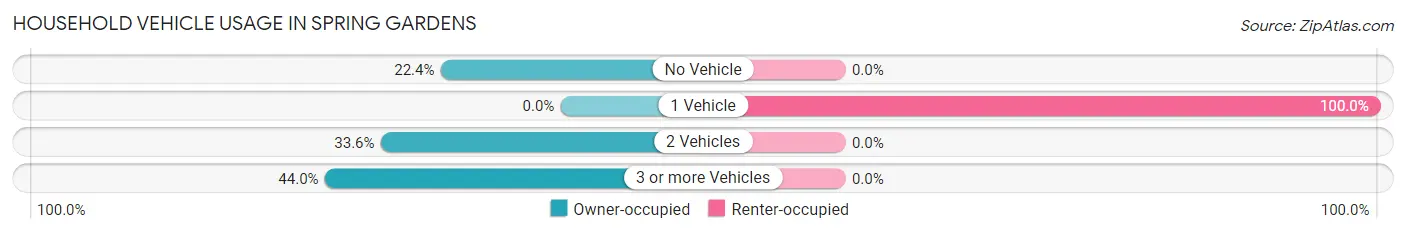
| Vehicles per Household | Owner-occupied | Renter-occupied |
| No Vehicle | 30 (22.4%) | 0 (0.0%) |
| 1 Vehicle | 0 (0.0%) | 20 (100.0%) |
| 2 Vehicles | 45 (33.6%) | 0 (0.0%) |
| 3 or more Vehicles | 59 (44.0%) | 0 (0.0%) |
| Total | 134 (100.0%) | 20 (100.0%) |
Real Estate & Mortgages in Spring Gardens
Real Estate and Mortgage Overview in Spring Gardens
| Characteristic | Without Mortgage | With Mortgage |
| Housing Units | 103 | 31 |
| Median Property Value | $129,300 | $0 |
| Median Household Income | $39,799 | $0 |
| Monthly Housing Costs | - | - |
| Real Estate Taxes | $1,425 | $0 |
Property Value by Mortgage Status in Spring Gardens
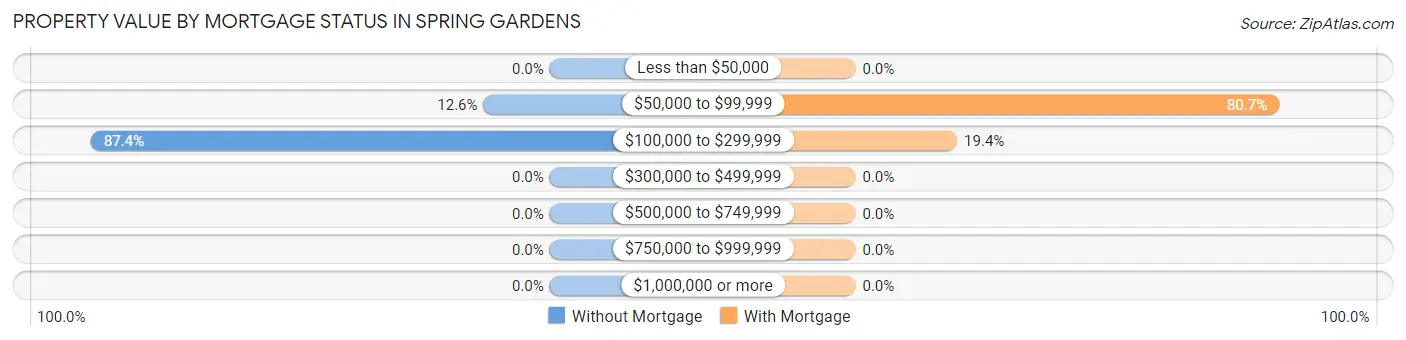
| Property Value | Without Mortgage | With Mortgage |
| Less than $50,000 | 0 (0.0%) | 0 (0.0%) |
| $50,000 to $99,999 | 13 (12.6%) | 25 (80.6%) |
| $100,000 to $299,999 | 90 (87.4%) | 6 (19.4%) |
| $300,000 to $499,999 | 0 (0.0%) | 0 (0.0%) |
| $500,000 to $749,999 | 0 (0.0%) | 0 (0.0%) |
| $750,000 to $999,999 | 0 (0.0%) | 0 (0.0%) |
| $1,000,000 or more | 0 (0.0%) | 0 (0.0%) |
| Total | 103 (100.0%) | 31 (100.0%) |
Household Income by Mortgage Status in Spring Gardens
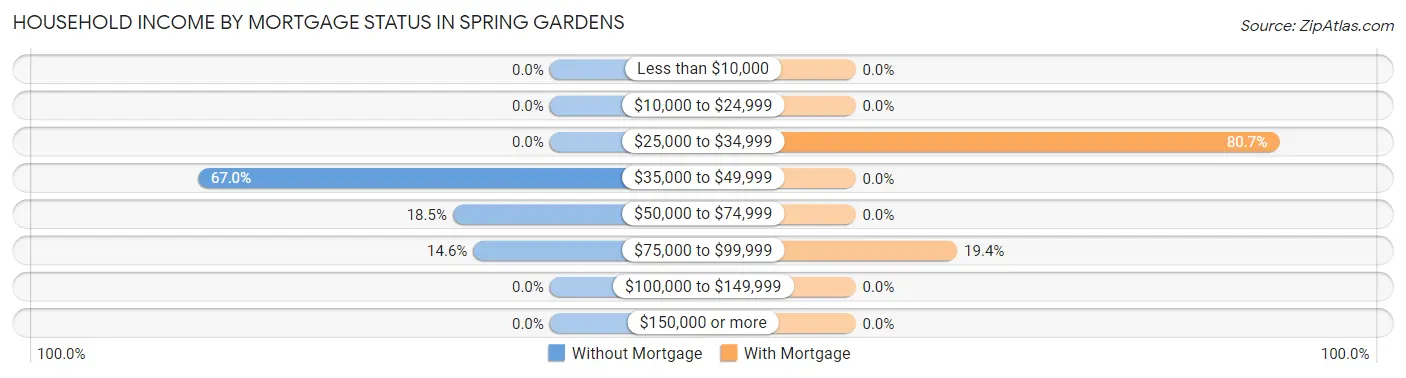
| Household Income | Without Mortgage | With Mortgage |
| Less than $10,000 | 0 (0.0%) | 0 (0.0%) |
| $10,000 to $24,999 | 0 (0.0%) | 0 (0.0%) |
| $25,000 to $34,999 | 0 (0.0%) | 25 (80.6%) |
| $35,000 to $49,999 | 69 (67.0%) | 0 (0.0%) |
| $50,000 to $74,999 | 19 (18.4%) | 0 (0.0%) |
| $75,000 to $99,999 | 15 (14.6%) | 6 (19.4%) |
| $100,000 to $149,999 | 0 (0.0%) | 0 (0.0%) |
| $150,000 or more | 0 (0.0%) | 0 (0.0%) |
| Total | 103 (100.0%) | 31 (100.0%) |
Property Value to Household Income Ratio in Spring Gardens
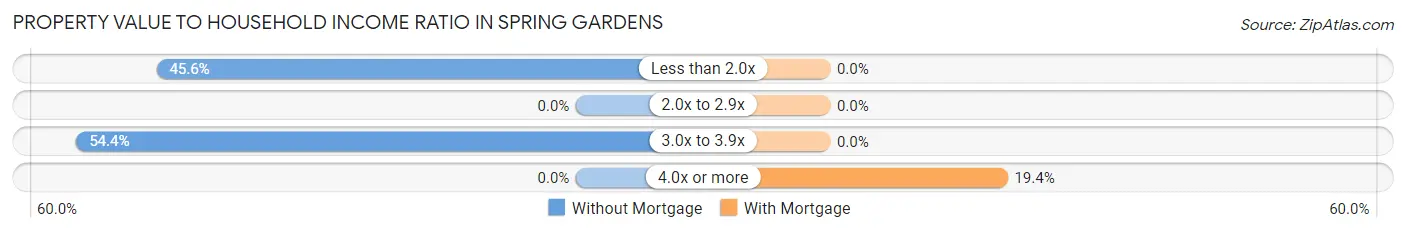
| Value-to-Income Ratio | Without Mortgage | With Mortgage |
| Less than 2.0x | 47 (45.6%) | 0 (0.0%) |
| 2.0x to 2.9x | 0 (0.0%) | 0 (0.0%) |
| 3.0x to 3.9x | 56 (54.4%) | 0 (0.0%) |
| 4.0x or more | 0 (0.0%) | 6 (19.4%) |
| Total | 103 (100.0%) | 31 (100.0%) |
Real Estate Taxes by Mortgage Status in Spring Gardens
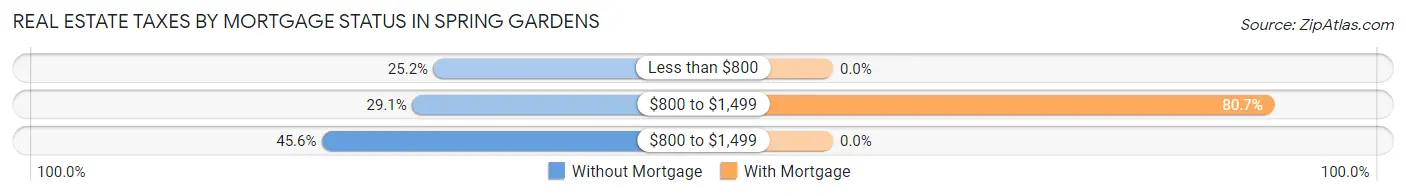
| Property Taxes | Without Mortgage | With Mortgage |
| Less than $800 | 26 (25.2%) | 0 (0.0%) |
| $800 to $1,499 | 30 (29.1%) | 25 (80.6%) |
| $800 to $1,499 | 47 (45.6%) | 0 (0.0%) |
| Total | 103 (100.0%) | 31 (100.0%) |
Health & Disability in Spring Gardens
Health Insurance Coverage by Age in Spring Gardens
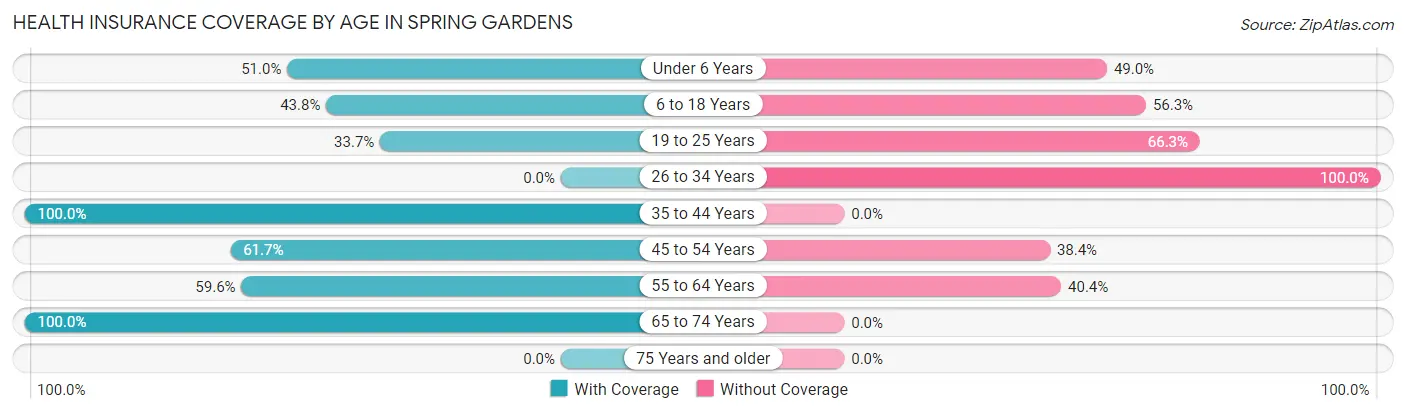
| Age Bracket | With Coverage | Without Coverage |
| Under 6 Years | 25 (51.0%) | 24 (49.0%) |
| 6 to 18 Years | 98 (43.8%) | 126 (56.2%) |
| 19 to 25 Years | 31 (33.7%) | 61 (66.3%) |
| 26 to 34 Years | 0 (0.0%) | 89 (100.0%) |
| 35 to 44 Years | 29 (100.0%) | 0 (0.0%) |
| 45 to 54 Years | 82 (61.7%) | 51 (38.4%) |
| 55 to 64 Years | 28 (59.6%) | 19 (40.4%) |
| 65 to 74 Years | 64 (100.0%) | 0 (0.0%) |
| 75 Years and older | 0 (0.0%) | 0 (0.0%) |
| Total | 357 (49.1%) | 370 (50.9%) |
Health Insurance Coverage by Citizenship Status in Spring Gardens
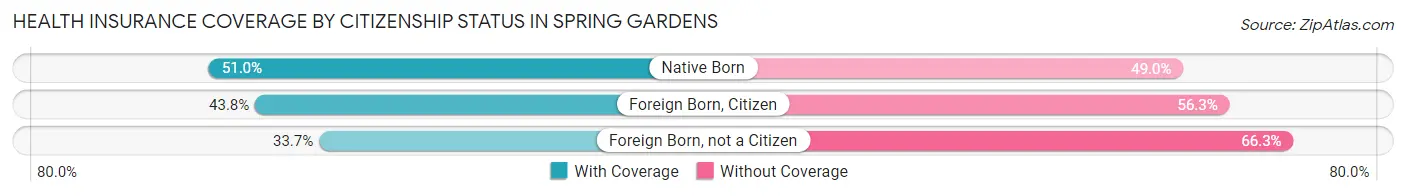
| Citizenship Status | With Coverage | Without Coverage |
| Native Born | 25 (51.0%) | 24 (49.0%) |
| Foreign Born, Citizen | 98 (43.8%) | 126 (56.2%) |
| Foreign Born, not a Citizen | 31 (33.7%) | 61 (66.3%) |
Health Insurance Coverage by Household Income in Spring Gardens
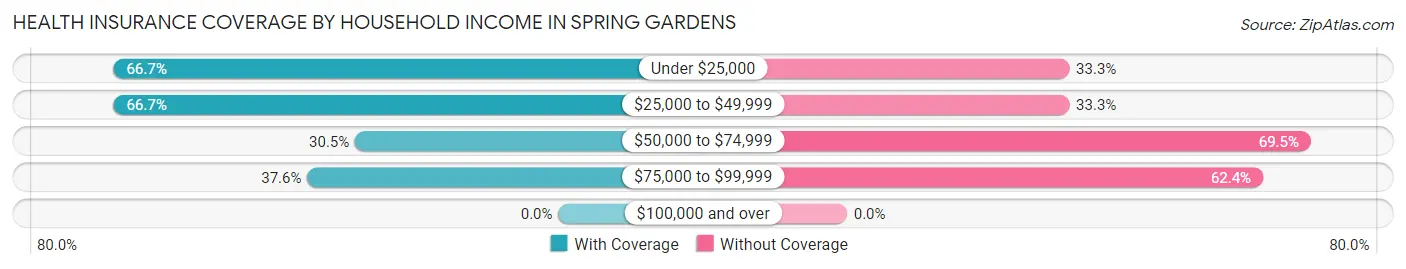
| Household Income | With Coverage | Without Coverage |
| Under $25,000 | 50 (66.7%) | 25 (33.3%) |
| $25,000 to $49,999 | 174 (66.7%) | 87 (33.3%) |
| $50,000 to $74,999 | 60 (30.5%) | 137 (69.5%) |
| $75,000 to $99,999 | 73 (37.6%) | 121 (62.4%) |
| $100,000 and over | 0 (0.0%) | 0 (0.0%) |
Public vs Private Health Insurance Coverage by Age in Spring Gardens
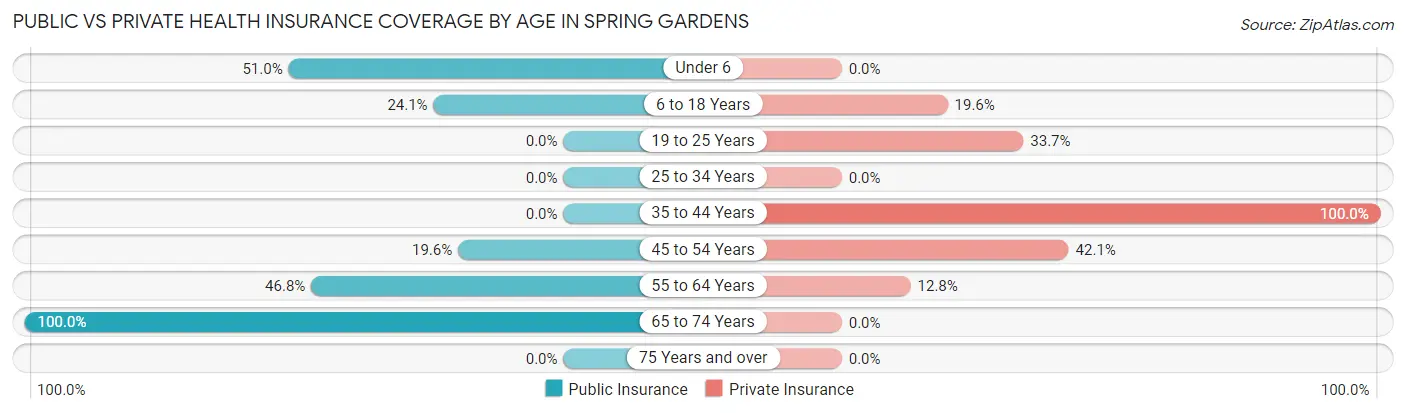
| Age Bracket | Public Insurance | Private Insurance |
| Under 6 | 25 (51.0%) | 0 (0.0%) |
| 6 to 18 Years | 54 (24.1%) | 44 (19.6%) |
| 19 to 25 Years | 0 (0.0%) | 31 (33.7%) |
| 25 to 34 Years | 0 (0.0%) | 0 (0.0%) |
| 35 to 44 Years | 0 (0.0%) | 29 (100.0%) |
| 45 to 54 Years | 26 (19.6%) | 56 (42.1%) |
| 55 to 64 Years | 22 (46.8%) | 6 (12.8%) |
| 65 to 74 Years | 64 (100.0%) | 0 (0.0%) |
| 75 Years and over | 0 (0.0%) | 0 (0.0%) |
| Total | 191 (26.3%) | 166 (22.8%) |
Disability Status by Sex by Age in Spring Gardens
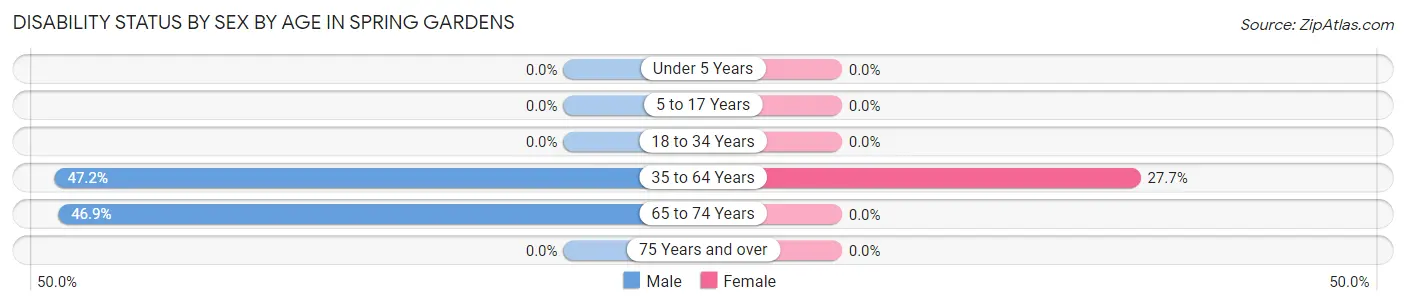
| Age Bracket | Male | Female |
| Under 5 Years | 0 (0.0%) | 0 (0.0%) |
| 5 to 17 Years | 0 (0.0%) | 0 (0.0%) |
| 18 to 34 Years | 0 (0.0%) | 0 (0.0%) |
| 35 to 64 Years | 51 (47.2%) | 28 (27.7%) |
| 65 to 74 Years | 30 (46.9%) | 0 (0.0%) |
| 75 Years and over | 0 (0.0%) | 0 (0.0%) |
Disability Class by Sex by Age in Spring Gardens
Disability Class: Hearing Difficulty
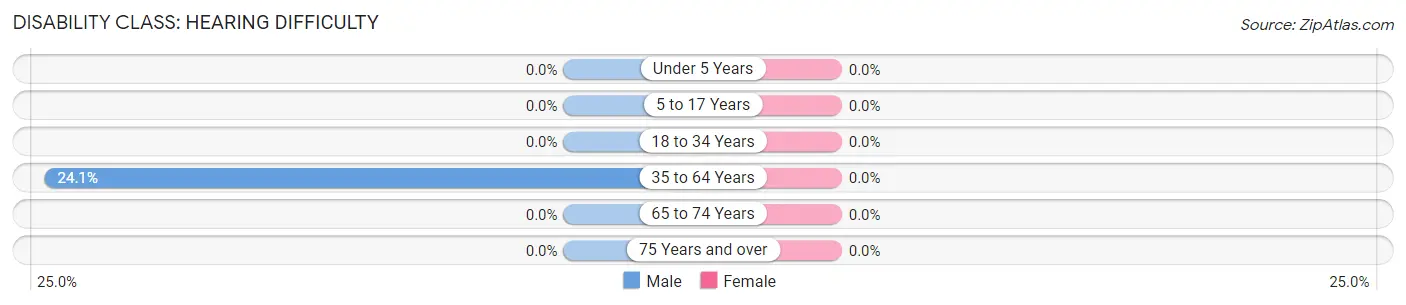
| Age Bracket | Male | Female |
| Under 5 Years | 0 (0.0%) | 0 (0.0%) |
| 5 to 17 Years | 0 (0.0%) | 0 (0.0%) |
| 18 to 34 Years | 0 (0.0%) | 0 (0.0%) |
| 35 to 64 Years | 26 (24.1%) | 0 (0.0%) |
| 65 to 74 Years | 0 (0.0%) | 0 (0.0%) |
| 75 Years and over | 0 (0.0%) | 0 (0.0%) |
Disability Class: Vision Difficulty
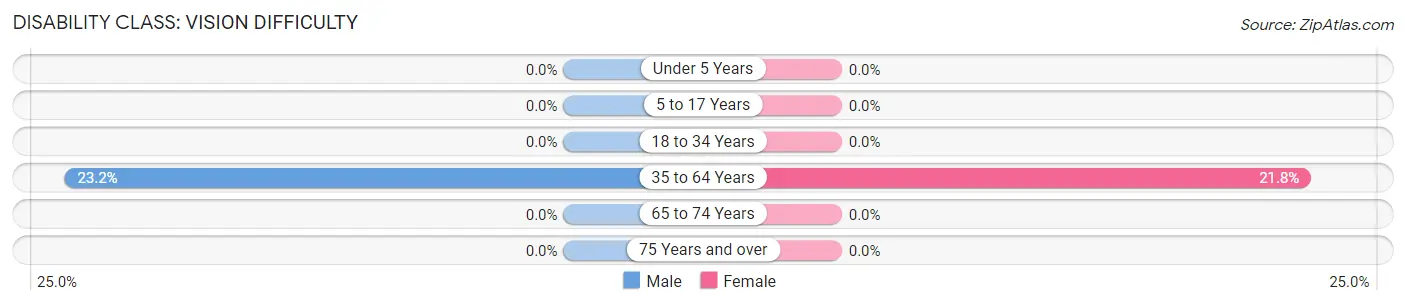
| Age Bracket | Male | Female |
| Under 5 Years | 0 (0.0%) | 0 (0.0%) |
| 5 to 17 Years | 0 (0.0%) | 0 (0.0%) |
| 18 to 34 Years | 0 (0.0%) | 0 (0.0%) |
| 35 to 64 Years | 25 (23.2%) | 22 (21.8%) |
| 65 to 74 Years | 0 (0.0%) | 0 (0.0%) |
| 75 Years and over | 0 (0.0%) | 0 (0.0%) |
Disability Class: Cognitive Difficulty

| Age Bracket | Male | Female |
| 5 to 17 Years | 0 (0.0%) | 0 (0.0%) |
| 18 to 34 Years | 0 (0.0%) | 0 (0.0%) |
| 35 to 64 Years | 51 (47.2%) | 22 (21.8%) |
| 65 to 74 Years | 0 (0.0%) | 0 (0.0%) |
| 75 Years and over | 0 (0.0%) | 0 (0.0%) |
Disability Class: Ambulatory Difficulty
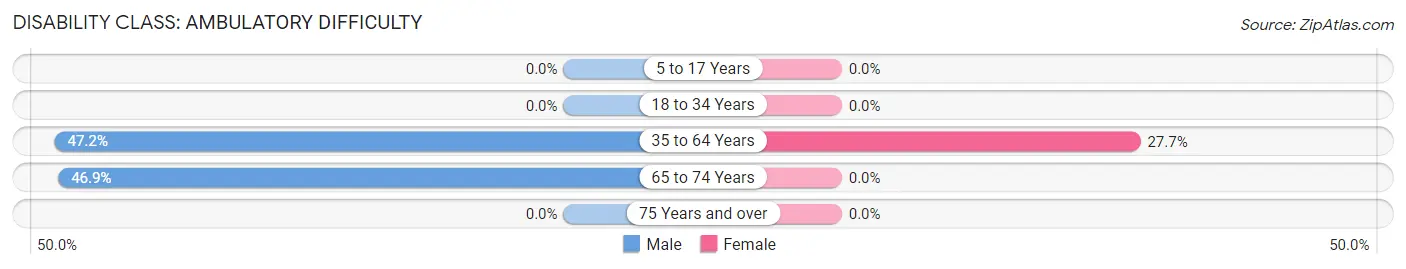
| Age Bracket | Male | Female |
| 5 to 17 Years | 0 (0.0%) | 0 (0.0%) |
| 18 to 34 Years | 0 (0.0%) | 0 (0.0%) |
| 35 to 64 Years | 51 (47.2%) | 28 (27.7%) |
| 65 to 74 Years | 30 (46.9%) | 0 (0.0%) |
| 75 Years and over | 0 (0.0%) | 0 (0.0%) |
Disability Class: Self-Care Difficulty
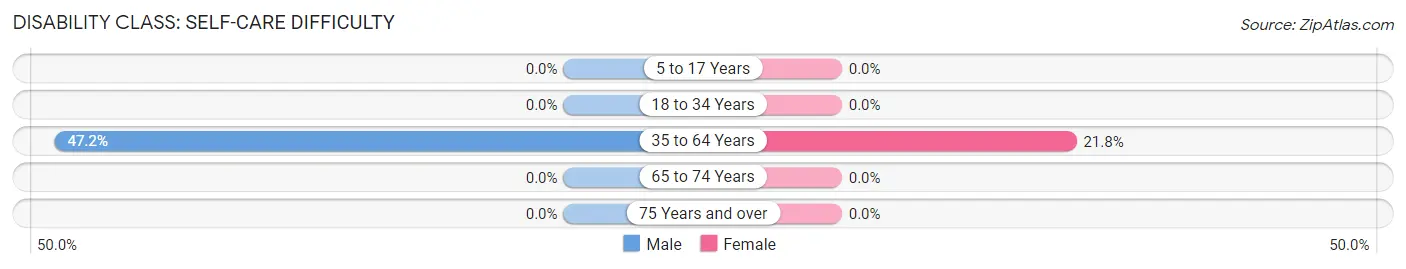
| Age Bracket | Male | Female |
| 5 to 17 Years | 0 (0.0%) | 0 (0.0%) |
| 18 to 34 Years | 0 (0.0%) | 0 (0.0%) |
| 35 to 64 Years | 51 (47.2%) | 22 (21.8%) |
| 65 to 74 Years | 0 (0.0%) | 0 (0.0%) |
| 75 Years and over | 0 (0.0%) | 0 (0.0%) |
Technology Access in Spring Gardens
Computing Device Access in Spring Gardens
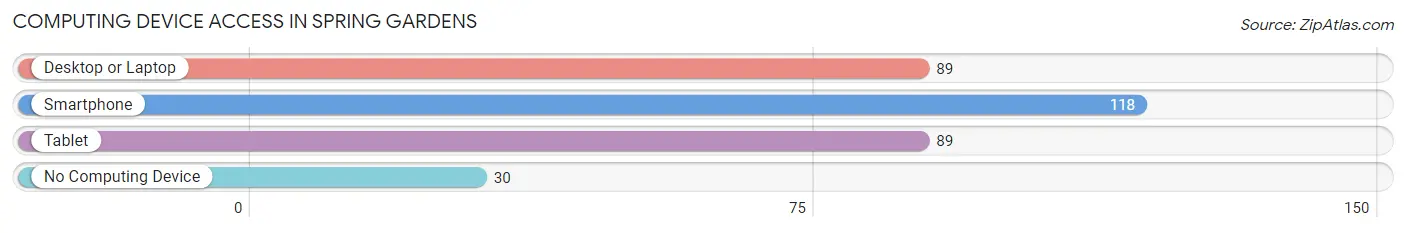
| Device Type | # Households | % Households |
| Desktop or Laptop | 89 | 57.8% |
| Smartphone | 118 | 76.6% |
| Tablet | 89 | 57.8% |
| No Computing Device | 30 | 19.5% |
| Total | 154 | 100.0% |
Internet Access in Spring Gardens
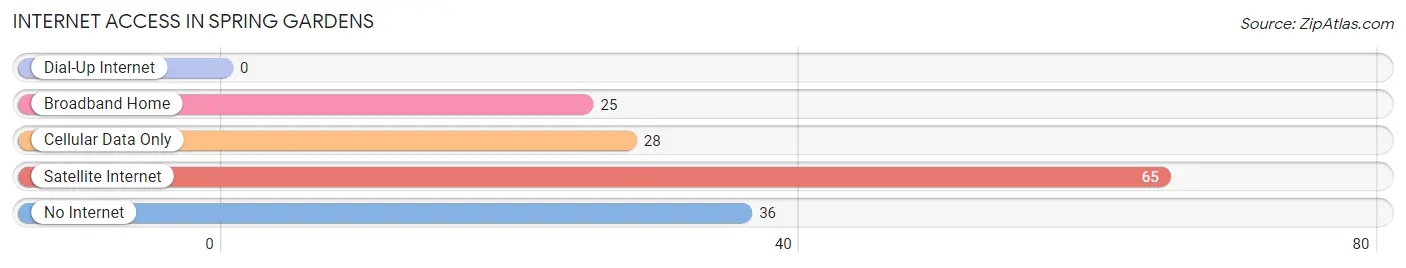
| Internet Type | # Households | % Households |
| Dial-Up Internet | 0 | 0.0% |
| Broadband Home | 25 | 16.2% |
| Cellular Data Only | 28 | 18.2% |
| Satellite Internet | 65 | 42.2% |
| No Internet | 36 | 23.4% |
| Total | 154 | 100.0% |
Spring Gardens Summary
History
Spring Gardens is a small unincorporated community located in the state of Texas, in the United States. It is situated in the southeastern part of the state, in the county of Harris. The community was first established in the late 19th century, when a group of settlers from the nearby town of Spring arrived in the area. The settlers were looking for a place to settle and farm, and they found the area to be ideal for their needs. The community was named after the nearby spring, which provided the settlers with a reliable source of water.
The community of Spring Gardens was officially established in 1891, when the first post office was opened. The post office was located in the home of one of the settlers, and it served as the center of the community. The post office was later moved to a larger building, and it served as the center of the community until it was closed in the early 20th century.
The community of Spring Gardens grew slowly over the years, and by the mid-20th century, it had become a small farming community. The community was home to a few small businesses, including a general store, a blacksmith shop, and a few other small businesses. The community also had a school, which served the local children.
Geography
Spring Gardens is located in the southeastern part of the state of Texas, in the county of Harris. It is situated in the Houston-The Woodlands-Sugar Land metropolitan area, which is the fifth-largest metropolitan area in the United States. The community is located about 25 miles southeast of downtown Houston, and it is situated near the intersection of Interstate 45 and Highway 6.
The community of Spring Gardens is situated on a flat, open plain, and it is surrounded by farmland and wooded areas. The area is known for its mild climate, and it receives an average of about 50 inches of rain per year. The area is also known for its hot summers and mild winters.
Economy
The economy of Spring Gardens is largely based on agriculture. The area is home to several farms, which produce a variety of crops, including corn, soybeans, cotton, and wheat. The area is also home to several small businesses, including a general store, a blacksmith shop, and a few other small businesses.
The community of Spring Gardens is also home to a few small manufacturing companies, which produce a variety of products, including furniture, clothing, and other items. The area is also home to a few small restaurants and bars, which serve the local population.
Demographics
As of the 2010 census, the population of Spring Gardens was 1,845. The population is largely composed of white individuals, who make up about 85% of the population. The remaining 15% of the population is composed of African Americans, Hispanics, and other ethnic groups. The median household income in the area is about $50,000, and the median home value is about $150,000. The area is served by the Spring Independent School District, which serves the local population.
Common Questions
What is Per Capita Income in Spring Gardens?
Per Capita income in Spring Gardens is $12,328.
What is the Median Family Income in Spring Gardens?
Median Family Income in Spring Gardens is $39,821.
What is the Median Household income in Spring Gardens?
Median Household Income in Spring Gardens is $39,821.
What is Inequality or Gini Index in Spring Gardens?
Inequality or Gini Index in Spring Gardens is 0.30.
What is the Total Population of Spring Gardens?
Total Population of Spring Gardens is 727.
What is the Total Male Population of Spring Gardens?
Total Male Population of Spring Gardens is 399.
What is the Total Female Population of Spring Gardens?
Total Female Population of Spring Gardens is 328.
What is the Ratio of Males per 100 Females in Spring Gardens?
There are 121.65 Males per 100 Females in Spring Gardens.
What is the Ratio of Females per 100 Males in Spring Gardens?
There are 82.21 Females per 100 Males in Spring Gardens.
What is the Median Population Age in Spring Gardens?
Median Population Age in Spring Gardens is 26.0 Years.
What is the Average Family Size in Spring Gardens
Average Family Size in Spring Gardens is 4.6 People.
What is the Average Household Size in Spring Gardens
Average Household Size in Spring Gardens is 4.7 People.
How Large is the Labor Force in Spring Gardens?
There are 314 People in the Labor Forcein in Spring Gardens.
What is the Percentage of People in the Labor Force in Spring Gardens?
59.7% of People are in the Labor Force in Spring Gardens.
What is the Unemployment Rate in Spring Gardens?
Unemployment Rate in Spring Gardens is 17.5%.