Oak Trail Shores, TX Map & Demographics
Oak Trail Shores Map
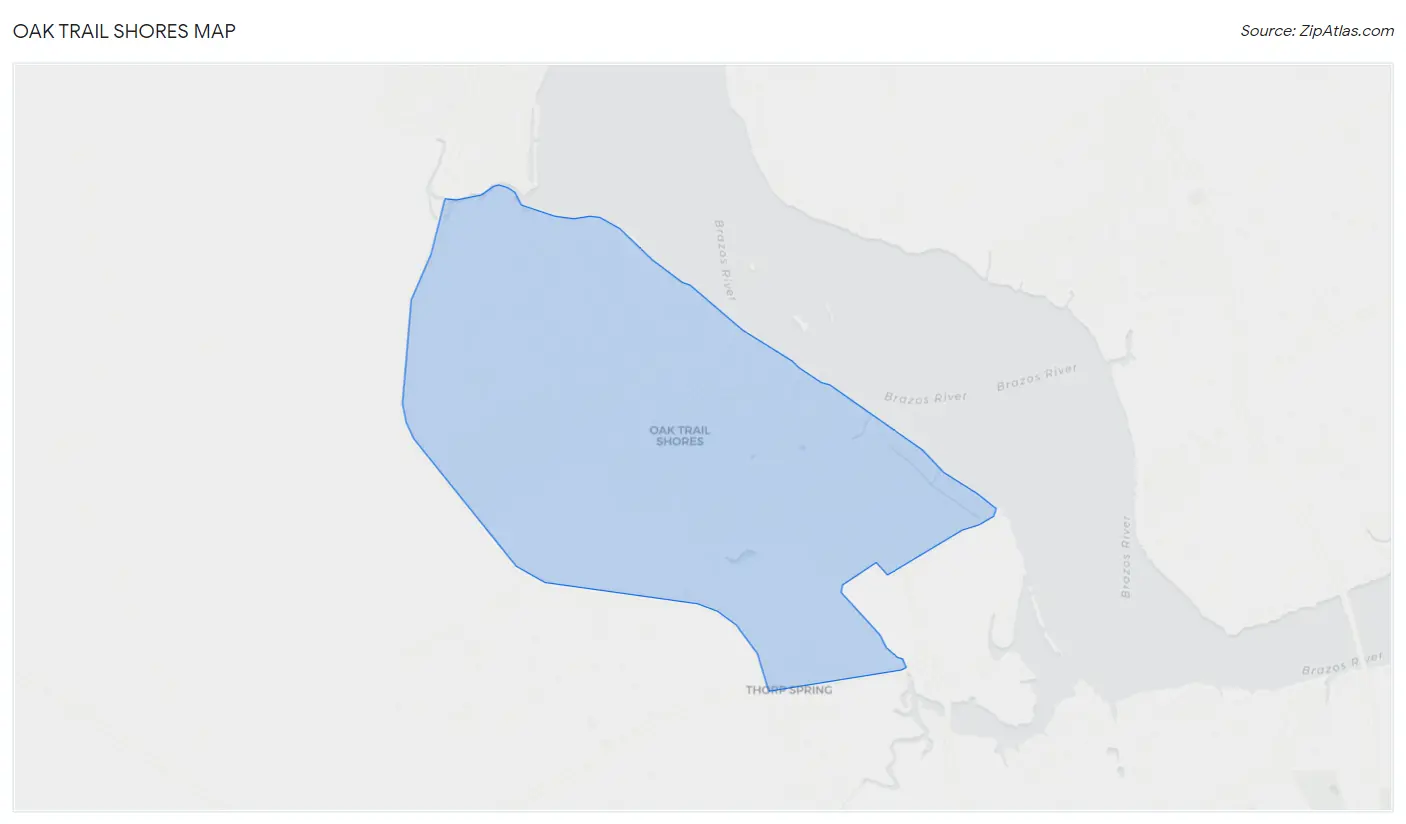
Oak Trail Shores Overview
$20,074
PER CAPITA INCOME
$58,628
AVG FAMILY INCOME
$31,768
AVG HOUSEHOLD INCOME
0.45
INEQUALITY / GINI INDEX
3,224
TOTAL POPULATION
1,749
MALE POPULATION
1,475
FEMALE POPULATION
118.58
MALES / 100 FEMALES
84.33
FEMALES / 100 MALES
33.9
MEDIAN AGE
3.3
AVG FAMILY SIZE
2.3
AVG HOUSEHOLD SIZE
1,339
LABOR FORCE [ PEOPLE ]
54.2%
PERCENT IN LABOR FORCE
3.7%
UNEMPLOYMENT RATE
Income in Oak Trail Shores
Income Overview in Oak Trail Shores
Per Capita Income in Oak Trail Shores is $20,074, while median incomes of families and households are $58,628 and $31,768 respectively.
| Characteristic | Number | Measure |
| Per Capita Income | 3,224 | $20,074 |
| Median Family Income | 759 | $58,628 |
| Mean Family Income | 759 | $65,740 |
| Median Household Income | 1,416 | $31,768 |
| Mean Household Income | 1,416 | $45,721 |
| Income Deficit | 759 | $0 |
| Wage / Income Gap (%) | 3,224 | 0.00% |
| Wage / Income Gap ($) | 3,224 | 100.00¢ per $1 |
| Gini / Inequality Index | 3,224 | 0.45 |
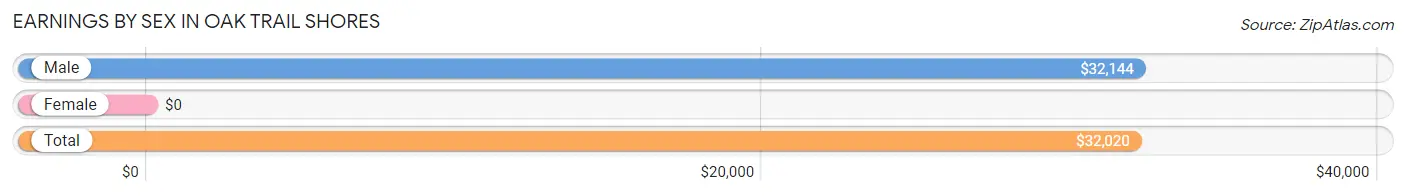
Earnings by Sex in Oak Trail Shores
| Sex | Number | Average Earnings |
| Male | 1,020 (73.8%) | $32,144 |
| Female | 363 (26.3%) | $0 |
| Total | 1,383 (100.0%) | $32,020 |
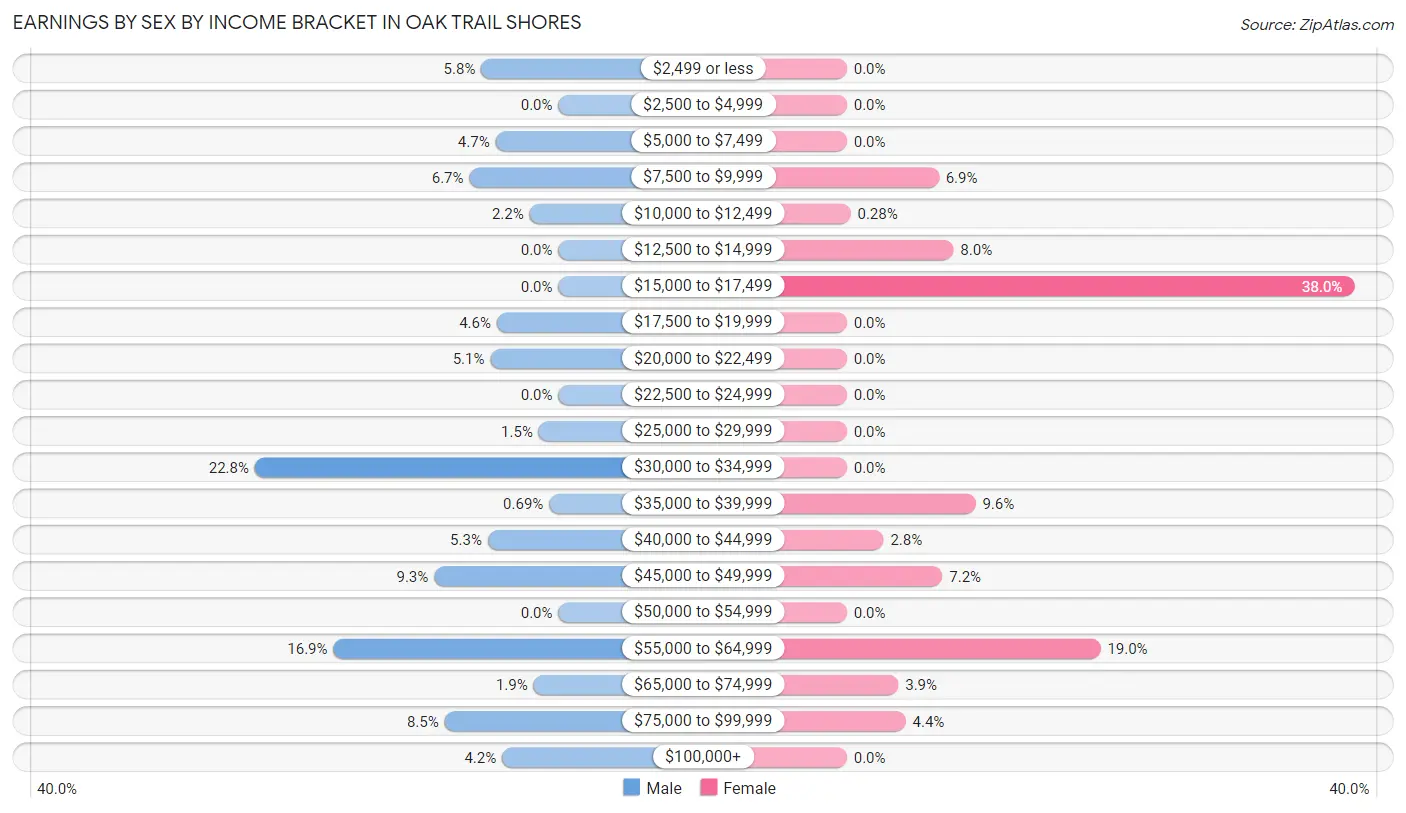
Earnings by Sex by Income Bracket in Oak Trail Shores
The most common earnings brackets in Oak Trail Shores are $30,000 to $34,999 for men (232 | 22.8%) and $15,000 to $17,499 for women (138 | 38.0%).
| Income | Male | Female |
| $2,499 or less | 59 (5.8%) | 0 (0.0%) |
| $2,500 to $4,999 | 0 (0.0%) | 0 (0.0%) |
| $5,000 to $7,499 | 48 (4.7%) | 0 (0.0%) |
| $7,500 to $9,999 | 68 (6.7%) | 25 (6.9%) |
| $10,000 to $12,499 | 22 (2.2%) | 1 (0.3%) |
| $12,500 to $14,999 | 0 (0.0%) | 29 (8.0%) |
| $15,000 to $17,499 | 0 (0.0%) | 138 (38.0%) |
| $17,500 to $19,999 | 47 (4.6%) | 0 (0.0%) |
| $20,000 to $22,499 | 52 (5.1%) | 0 (0.0%) |
| $22,500 to $24,999 | 0 (0.0%) | 0 (0.0%) |
| $25,000 to $29,999 | 15 (1.5%) | 0 (0.0%) |
| $30,000 to $34,999 | 232 (22.8%) | 0 (0.0%) |
| $35,000 to $39,999 | 7 (0.7%) | 35 (9.6%) |
| $40,000 to $44,999 | 54 (5.3%) | 10 (2.8%) |
| $45,000 to $49,999 | 95 (9.3%) | 26 (7.2%) |
| $50,000 to $54,999 | 0 (0.0%) | 0 (0.0%) |
| $55,000 to $64,999 | 172 (16.9%) | 69 (19.0%) |
| $65,000 to $74,999 | 19 (1.9%) | 14 (3.9%) |
| $75,000 to $99,999 | 87 (8.5%) | 16 (4.4%) |
| $100,000+ | 43 (4.2%) | 0 (0.0%) |
| Total | 1,020 (100.0%) | 363 (100.0%) |
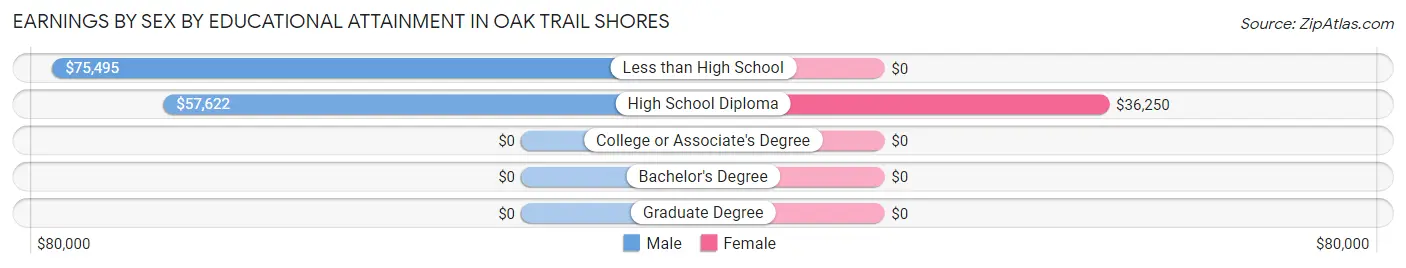
Earnings by Sex by Educational Attainment in Oak Trail Shores
Average earnings in Oak Trail Shores are $46,776 for men and $44,875 for women, a difference of 4.1%. Men with an educational attainment of less than high school enjoy the highest average annual earnings of $75,495, while those with high school diploma education earn the least with $57,622. Women with an educational attainment of high school diploma earn the most with the average annual earnings of $36,250, while those with high school diploma education have the smallest earnings of $36,250.
| Educational Attainment | Male Income | Female Income |
| Less than High School | $75,495 | $0 |
| High School Diploma | $57,622 | $36,250 |
| College or Associate's Degree | - | - |
| Bachelor's Degree | - | - |
| Graduate Degree | - | - |
| Total | $46,776 | $44,875 |
Family Income in Oak Trail Shores
Family Income Brackets in Oak Trail Shores
According to the Oak Trail Shores family income data, there are 187 families falling into the $50,000 to $74,999 income range, which is the most common income bracket and makes up 24.6% of all families.
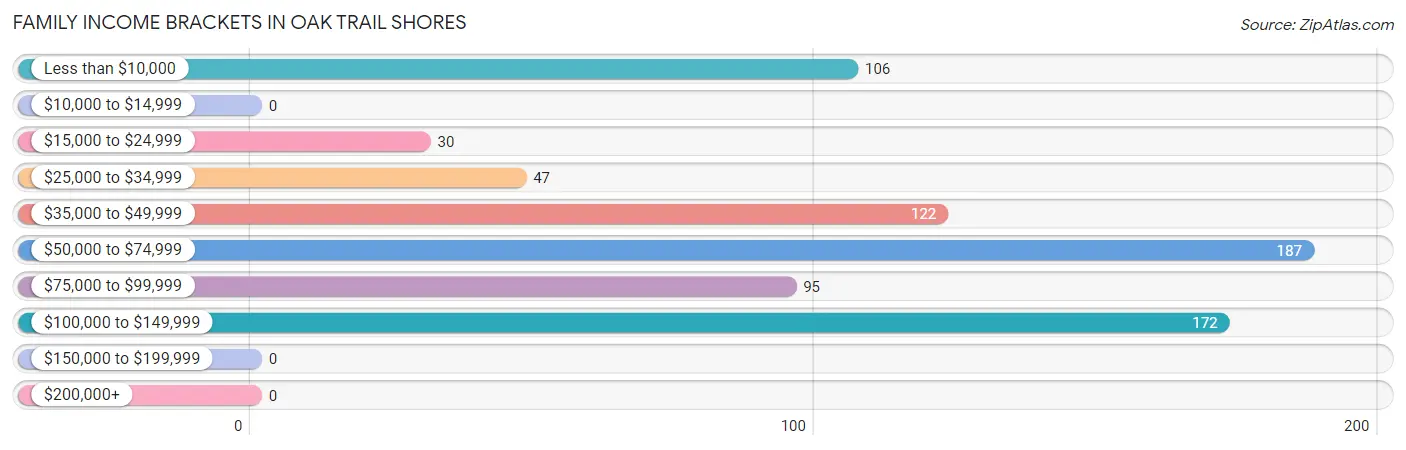
| Income Bracket | # Families | % Families |
| Less than $10,000 | 106 | 14.0% |
| $10,000 to $14,999 | 0 | 0.0% |
| $15,000 to $24,999 | 30 | 4.0% |
| $25,000 to $34,999 | 47 | 6.2% |
| $35,000 to $49,999 | 122 | 16.1% |
| $50,000 to $74,999 | 187 | 24.6% |
| $75,000 to $99,999 | 95 | 12.5% |
| $100,000 to $149,999 | 172 | 22.7% |
| $150,000 to $199,999 | 0 | 0.0% |
| $200,000+ | 0 | 0.0% |
Family Income by Famaliy Size in Oak Trail Shores
3-person families (101 | 13.3%) account for the highest median family income in Oak Trail Shores with $129,013 per family, while 3-person families (101 | 13.3%) have the highest median income of $43,004 per family member.
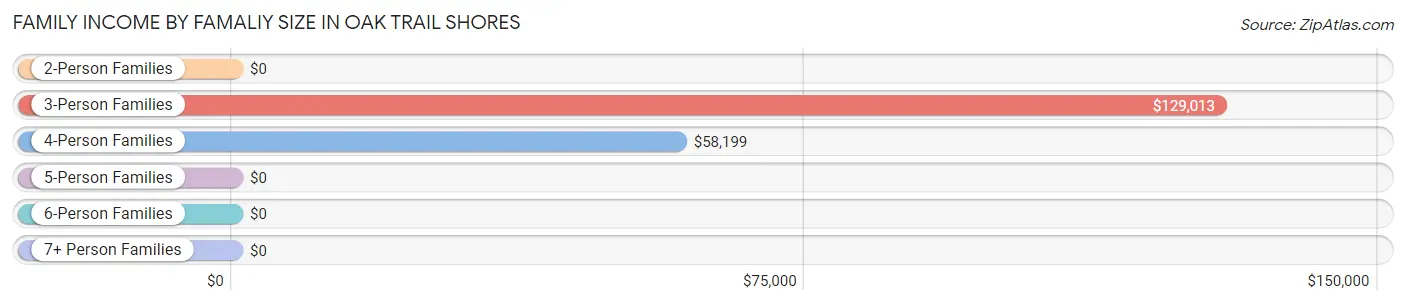
| Income Bracket | # Families | Median Income |
| 2-Person Families | 244 (32.2%) | $0 |
| 3-Person Families | 101 (13.3%) | $129,013 |
| 4-Person Families | 382 (50.3%) | $58,199 |
| 5-Person Families | 32 (4.2%) | $0 |
| 6-Person Families | 0 (0.0%) | $0 |
| 7+ Person Families | 0 (0.0%) | $0 |
| Total | 759 (100.0%) | $58,628 |
Family Income by Number of Earners in Oak Trail Shores
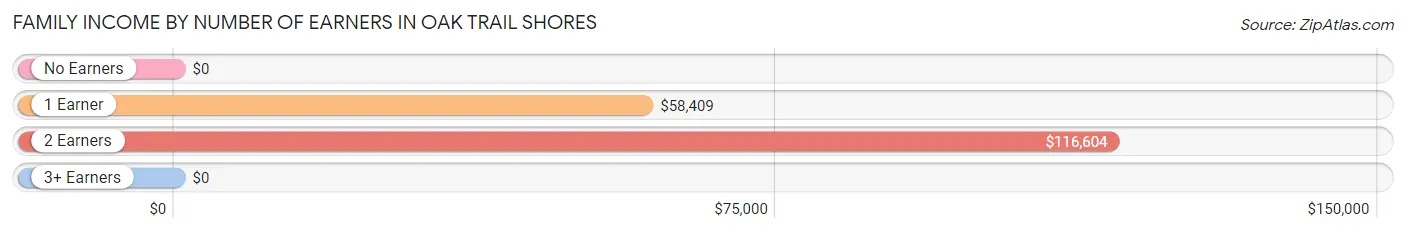
| Number of Earners | # Families | Median Income |
| No Earners | 107 (14.1%) | $0 |
| 1 Earner | 462 (60.9%) | $58,409 |
| 2 Earners | 190 (25.0%) | $116,604 |
| 3+ Earners | 0 (0.0%) | $0 |
| Total | 759 (100.0%) | $58,628 |
Household Income in Oak Trail Shores
Household Income Brackets in Oak Trail Shores
With 333 households falling in the category, the $25,000 to $34,999 income range is the most frequent in Oak Trail Shores, accounting for 23.5% of all households.
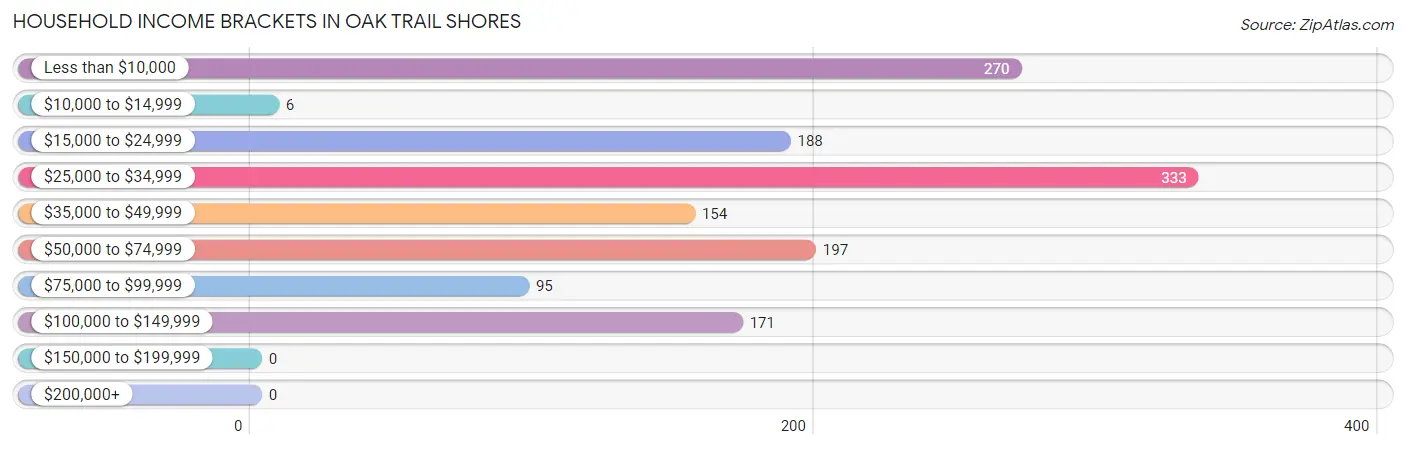
| Income Bracket | # Households | % Households |
| Less than $10,000 | 270 | 19.1% |
| $10,000 to $14,999 | 6 | 0.4% |
| $15,000 to $24,999 | 188 | 13.3% |
| $25,000 to $34,999 | 333 | 23.5% |
| $35,000 to $49,999 | 154 | 10.9% |
| $50,000 to $74,999 | 197 | 13.9% |
| $75,000 to $99,999 | 95 | 6.7% |
| $100,000 to $149,999 | 171 | 12.1% |
| $150,000 to $199,999 | 0 | 0.0% |
| $200,000+ | 0 | 0.0% |
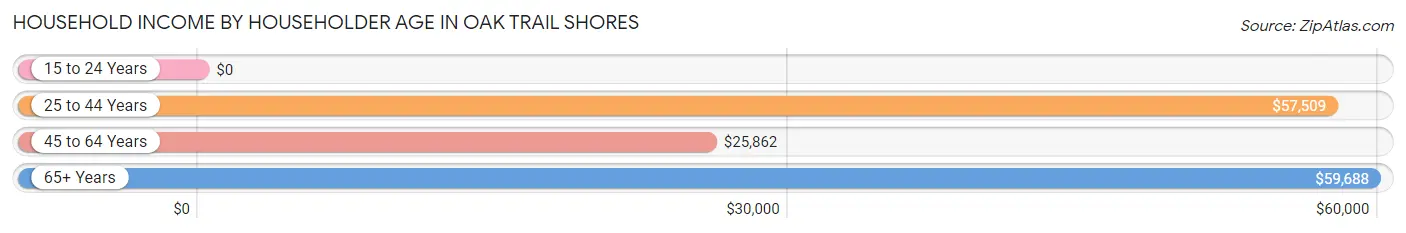
Household Income by Householder Age in Oak Trail Shores
The median household income in Oak Trail Shores is $31,768, with the highest median household income of $59,688 found in the 65+ years age bracket for the primary householder. A total of 253 households (17.9%) fall into this category. Meanwhile, the 15 to 24 years age bracket for the primary householder has the lowest median household income of $0, with 336 households (23.7%) in this group.
| Income Bracket | # Households | Median Income |
| 15 to 24 Years | 336 (23.7%) | $0 |
| 25 to 44 Years | 323 (22.8%) | $57,509 |
| 45 to 64 Years | 504 (35.6%) | $25,862 |
| 65+ Years | 253 (17.9%) | $59,688 |
| Total | 1,416 (100.0%) | $31,768 |
Poverty in Oak Trail Shores
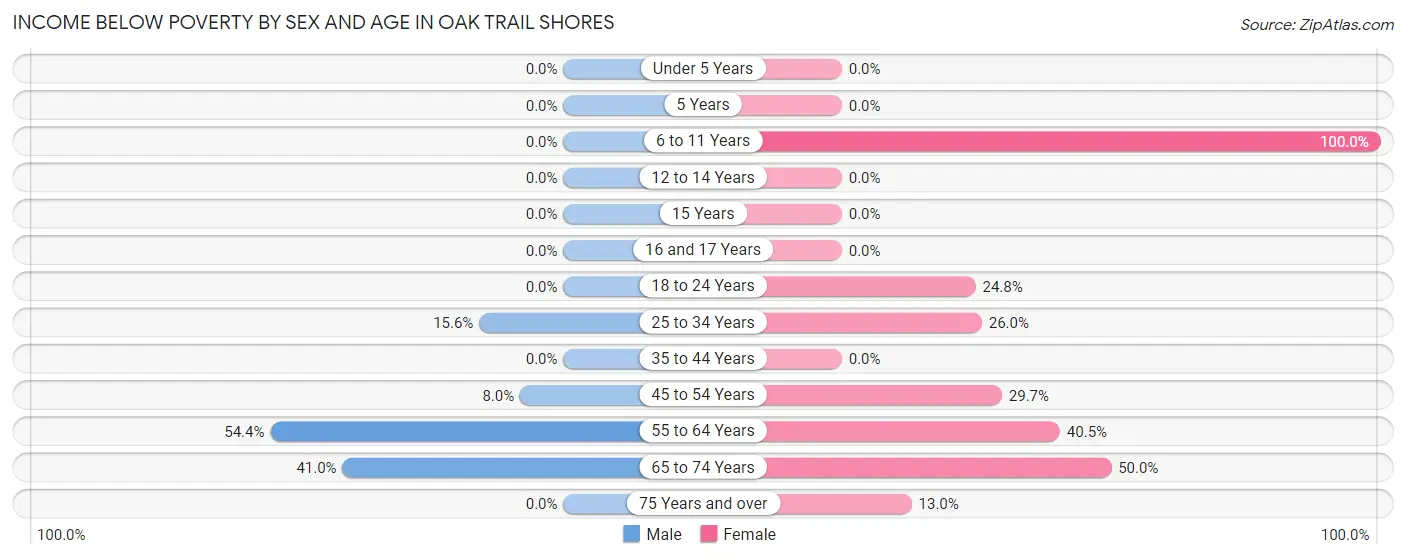
Income Below Poverty by Sex and Age in Oak Trail Shores
With 12.1% poverty level for males and 23.7% for females among the residents of Oak Trail Shores, 55 to 64 year old males and 6 to 11 year old females are the most vulnerable to poverty, with 124 males (54.4%) and 76 females (100.0%) in their respective age groups living below the poverty level.
| Age Bracket | Male | Female |
| Under 5 Years | 0 (0.0%) | 0 (0.0%) |
| 5 Years | 0 (0.0%) | 0 (0.0%) |
| 6 to 11 Years | 0 (0.0%) | 76 (100.0%) |
| 12 to 14 Years | 0 (0.0%) | 0 (0.0%) |
| 15 Years | 0 (0.0%) | 0 (0.0%) |
| 16 and 17 Years | 0 (0.0%) | 0 (0.0%) |
| 18 to 24 Years | 0 (0.0%) | 37 (24.8%) |
| 25 to 34 Years | 30 (15.6%) | 46 (26.0%) |
| 35 to 44 Years | 0 (0.0%) | 0 (0.0%) |
| 45 to 54 Years | 16 (8.0%) | 41 (29.7%) |
| 55 to 64 Years | 124 (54.4%) | 102 (40.5%) |
| 65 to 74 Years | 41 (41.0%) | 34 (50.0%) |
| 75 Years and over | 0 (0.0%) | 14 (13.0%) |
| Total | 211 (12.1%) | 350 (23.7%) |
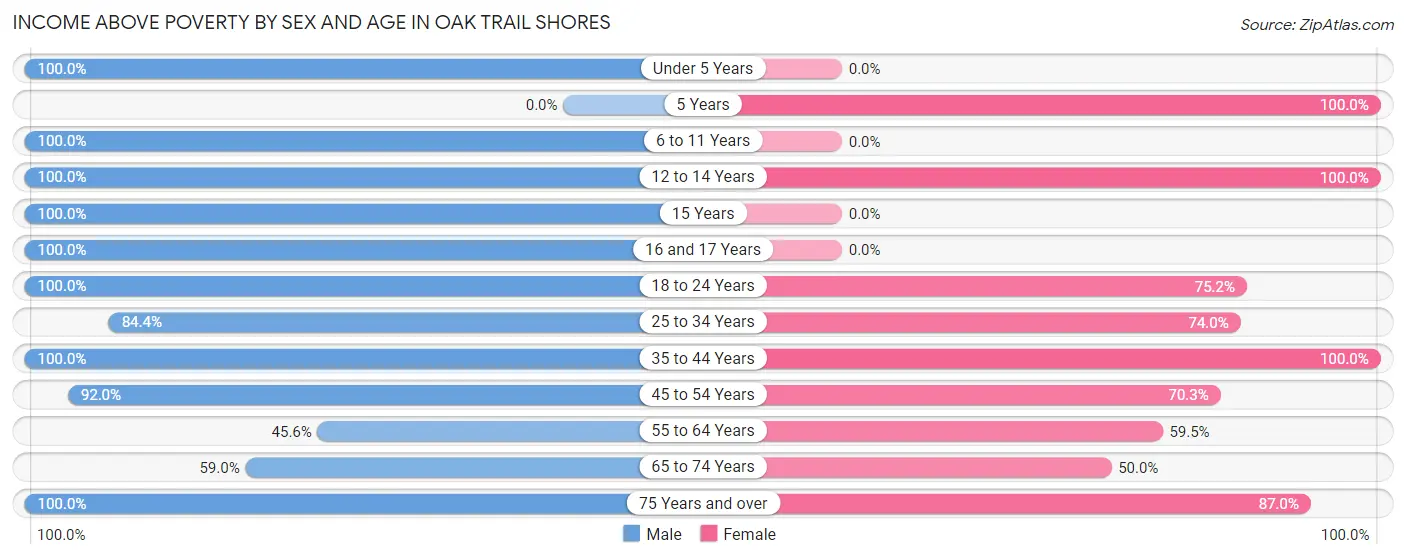
Income Above Poverty by Sex and Age in Oak Trail Shores
According to the poverty statistics in Oak Trail Shores, males aged under 5 years and females aged 5 years are the age groups that are most secure financially, with 100.0% of males and 100.0% of females in these age groups living above the poverty line.
| Age Bracket | Male | Female |
| Under 5 Years | 43 (100.0%) | 0 (0.0%) |
| 5 Years | 0 (0.0%) | 27 (100.0%) |
| 6 to 11 Years | 275 (100.0%) | 0 (0.0%) |
| 12 to 14 Years | 33 (100.0%) | 196 (100.0%) |
| 15 Years | 103 (100.0%) | 0 (0.0%) |
| 16 and 17 Years | 39 (100.0%) | 0 (0.0%) |
| 18 to 24 Years | 308 (100.0%) | 112 (75.2%) |
| 25 to 34 Years | 162 (84.4%) | 131 (74.0%) |
| 35 to 44 Years | 134 (100.0%) | 284 (100.0%) |
| 45 to 54 Years | 183 (92.0%) | 97 (70.3%) |
| 55 to 64 Years | 104 (45.6%) | 150 (59.5%) |
| 65 to 74 Years | 59 (59.0%) | 34 (50.0%) |
| 75 Years and over | 95 (100.0%) | 94 (87.0%) |
| Total | 1,538 (87.9%) | 1,125 (76.3%) |
Income Below Poverty Among Married-Couple Families in Oak Trail Shores
The poverty statistics for married-couple families in Oak Trail Shores show that 20.4% or 116 of the total 568 families live below the poverty line. Families with no children have the highest poverty rate of 50.6%, comprising of 86 families. On the other hand, families with 1 or 2 children have the lowest poverty rate of 7.5%, which includes 30 families.

| Children | Above Poverty | Below Poverty |
| No Children | 84 (49.4%) | 86 (50.6%) |
| 1 or 2 Children | 368 (92.5%) | 30 (7.5%) |
| 3 or 4 Children | 0 (0.0%) | 0 (0.0%) |
| 5 or more Children | 0 (0.0%) | 0 (0.0%) |
| Total | 452 (79.6%) | 116 (20.4%) |
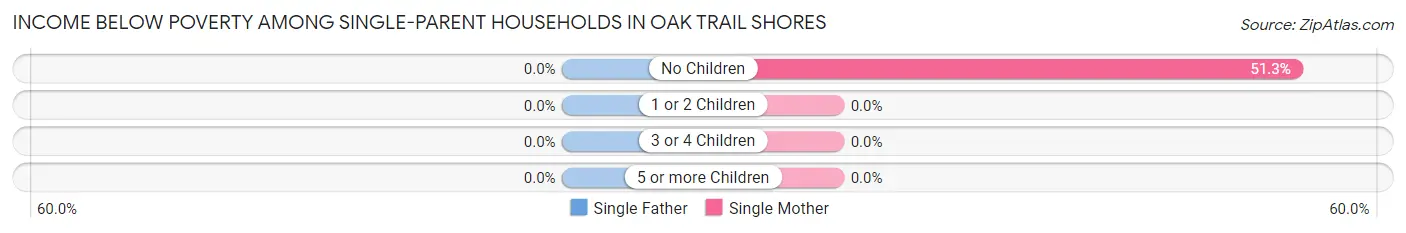
Income Below Poverty Among Single-Parent Households in Oak Trail Shores
| Children | Single Father | Single Mother |
| No Children | 0 (0.0%) | 20 (51.3%) |
| 1 or 2 Children | 0 (0.0%) | 0 (0.0%) |
| 3 or 4 Children | 0 (0.0%) | 0 (0.0%) |
| 5 or more Children | 0 (0.0%) | 0 (0.0%) |
| Total | 0 (0.0%) | 20 (30.8%) |
Income Below Poverty Among Married-Couple vs Single-Parent Households in Oak Trail Shores
The poverty data for Oak Trail Shores shows that 116 of the married-couple family households (20.4%) and 20 of the single-parent households (10.5%) are living below the poverty level. Within the married-couple family households, those with no children have the highest poverty rate, with 86 households (50.6%) falling below the poverty line. Among the single-parent households, those with no children have the highest poverty rate, with 20 household (15.4%) living below poverty.
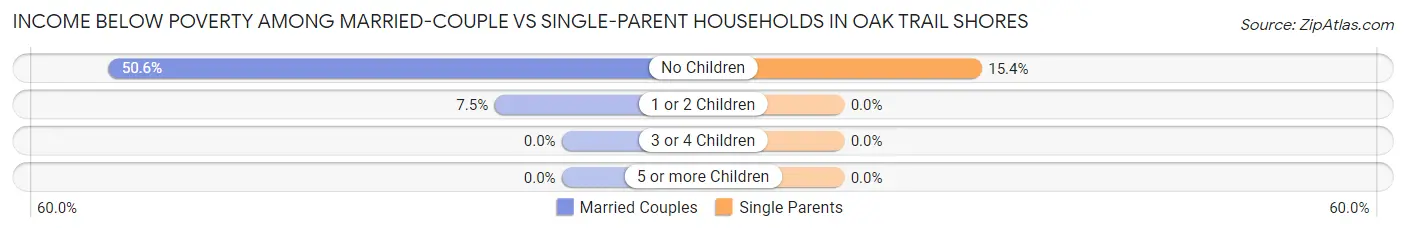
| Children | Married-Couple Families | Single-Parent Households |
| No Children | 86 (50.6%) | 20 (15.4%) |
| 1 or 2 Children | 30 (7.5%) | 0 (0.0%) |
| 3 or 4 Children | 0 (0.0%) | 0 (0.0%) |
| 5 or more Children | 0 (0.0%) | 0 (0.0%) |
| Total | 116 (20.4%) | 20 (10.5%) |
Race in Oak Trail Shores
The most populous races in Oak Trail Shores are White / Caucasian (2,406 | 74.6%), Hispanic or Latino (1,130 | 35.0%), and Two or more Races (496 | 15.4%).
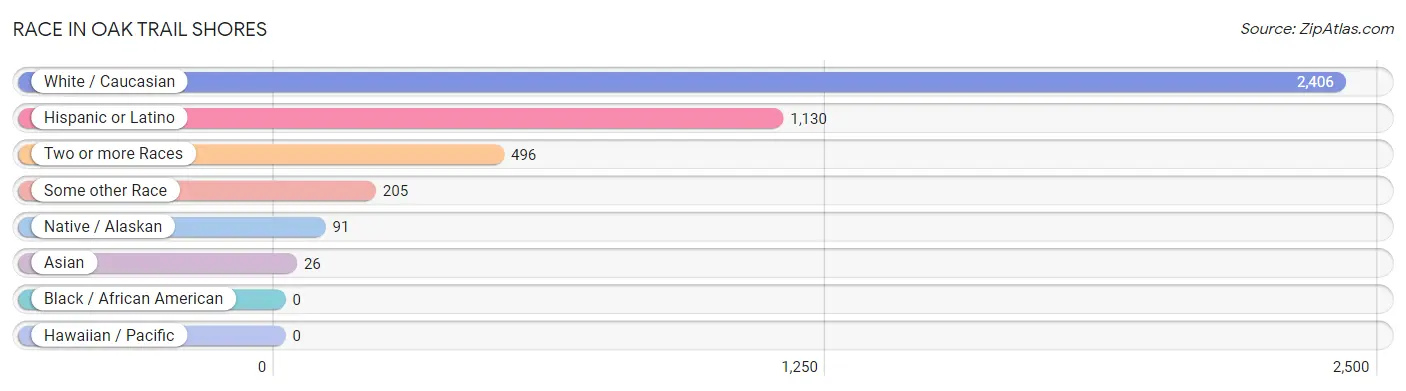
| Race | # Population | % Population |
| Asian | 26 | 0.8% |
| Black / African American | 0 | 0.0% |
| Hawaiian / Pacific | 0 | 0.0% |
| Hispanic or Latino | 1,130 | 35.0% |
| Native / Alaskan | 91 | 2.8% |
| White / Caucasian | 2,406 | 74.6% |
| Two or more Races | 496 | 15.4% |
| Some other Race | 205 | 6.4% |
| Total | 3,224 | 100.0% |
Ancestry in Oak Trail Shores
The most populous ancestries reported in Oak Trail Shores are Mexican (1,041 | 32.3%), American (1,008 | 31.3%), English (324 | 10.1%), German (108 | 3.4%), and Italian (96 | 3.0%), together accounting for 79.9% of all Oak Trail Shores residents.
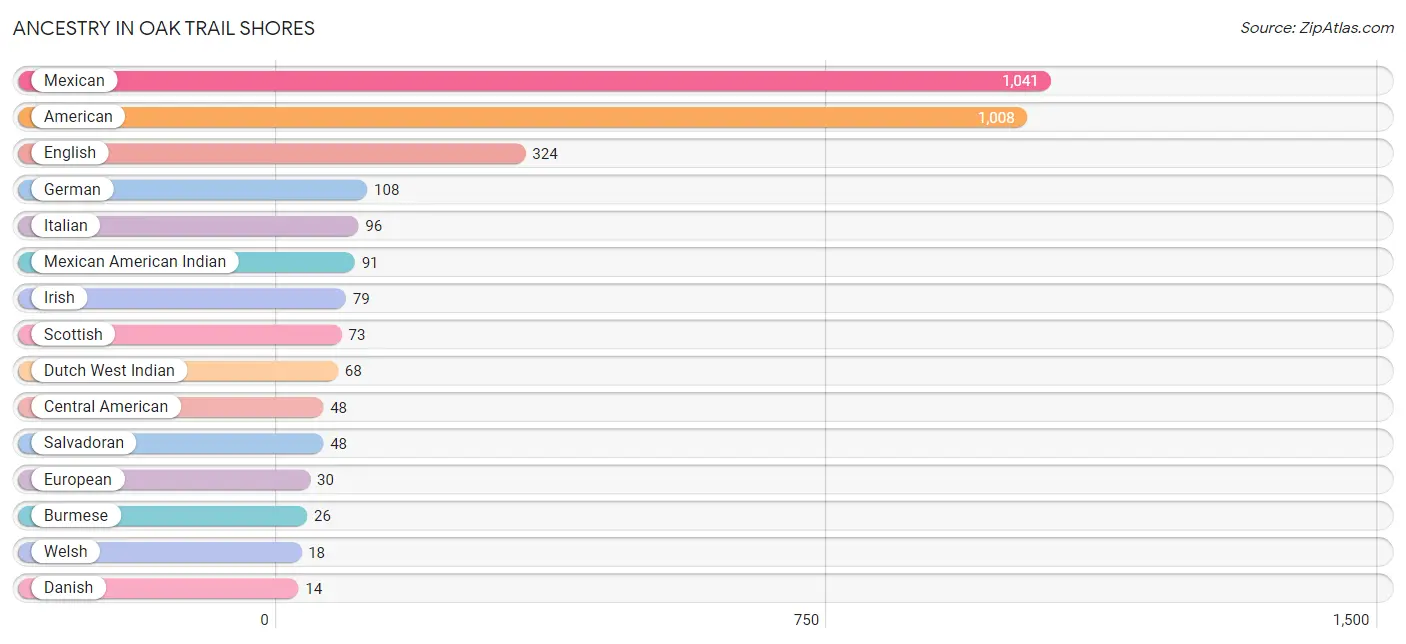
| Ancestry | # Population | % Population |
| American | 1,008 | 31.3% |
| Burmese | 26 | 0.8% |
| Central American | 48 | 1.5% |
| Danish | 14 | 0.4% |
| Dutch West Indian | 68 | 2.1% |
| English | 324 | 10.1% |
| European | 30 | 0.9% |
| French | 5 | 0.2% |
| German | 108 | 3.4% |
| Irish | 79 | 2.5% |
| Italian | 96 | 3.0% |
| Mexican | 1,041 | 32.3% |
| Mexican American Indian | 91 | 2.8% |
| Portuguese | 8 | 0.3% |
| Salvadoran | 48 | 1.5% |
| Scottish | 73 | 2.3% |
| Welsh | 18 | 0.6% | View All 17 Rows |
Immigrants in Oak Trail Shores
The most numerous immigrant groups reported in Oak Trail Shores came from Central America (349 | 10.8%), Latin America (349 | 10.8%), Mexico (301 | 9.3%), El Salvador (48 | 1.5%), and Asia (26 | 0.8%), together accounting for 33.3% of all Oak Trail Shores residents.
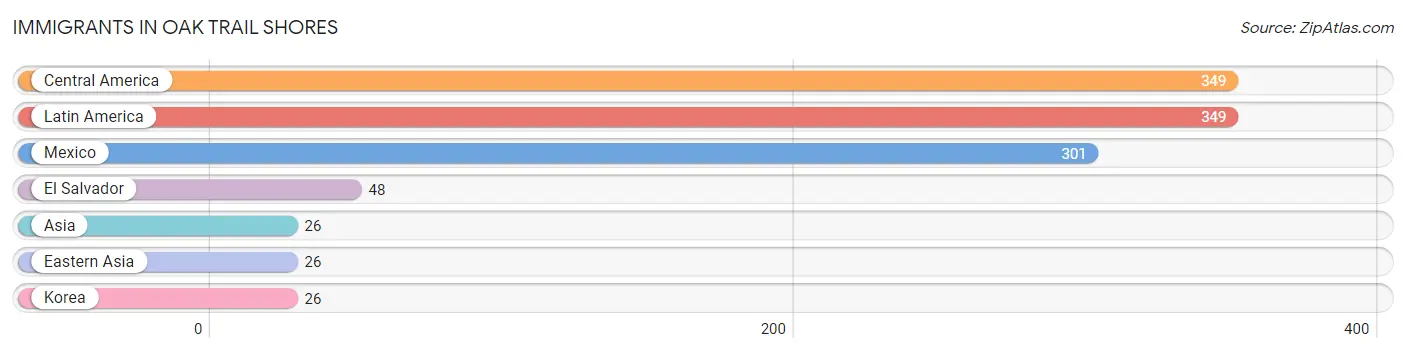
| Immigration Origin | # Population | % Population |
| Asia | 26 | 0.8% |
| Central America | 349 | 10.8% |
| Eastern Asia | 26 | 0.8% |
| El Salvador | 48 | 1.5% |
| Korea | 26 | 0.8% |
| Latin America | 349 | 10.8% |
| Mexico | 301 | 9.3% | View All 7 Rows |
Sex and Age in Oak Trail Shores
Sex and Age in Oak Trail Shores
The most populous age groups in Oak Trail Shores are 20 to 24 Years (298 | 17.0%) for men and 10 to 14 Years (234 | 15.9%) for women.
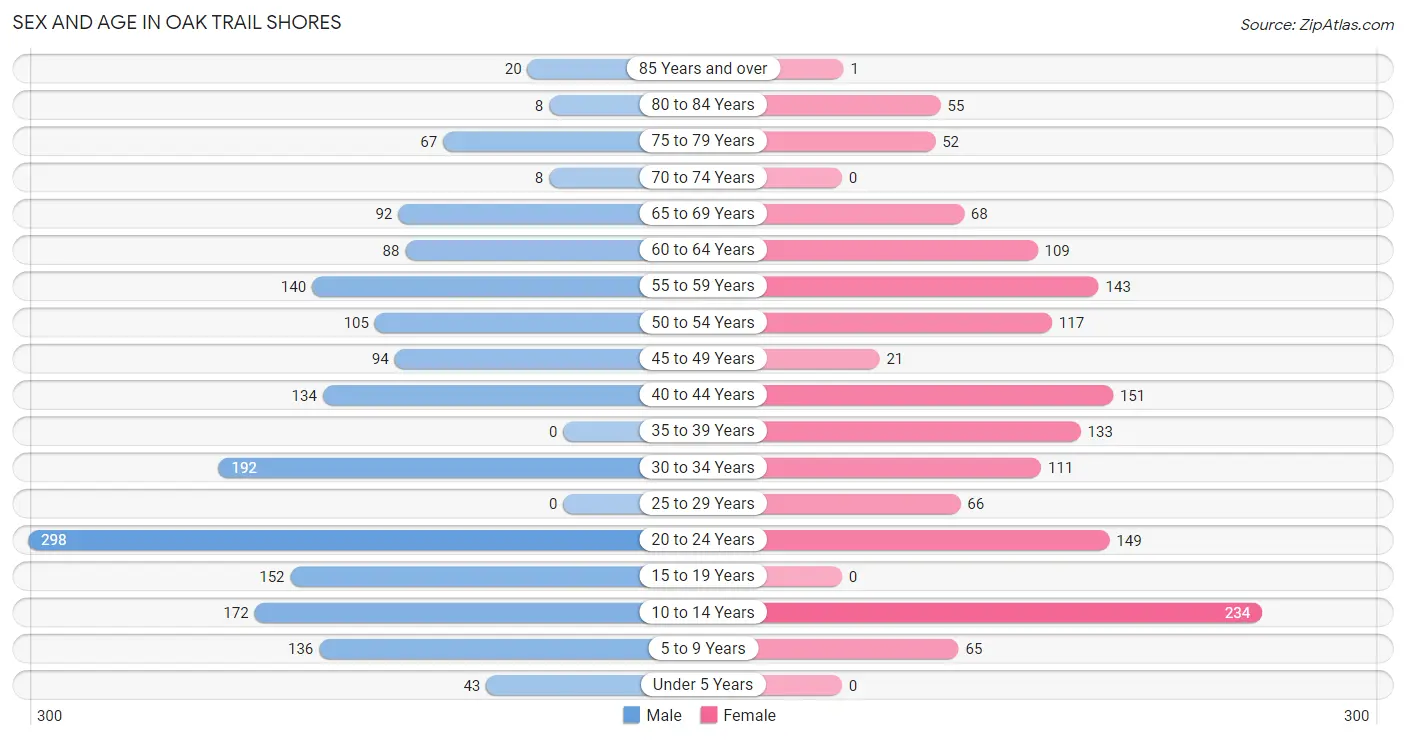
| Age Bracket | Male | Female |
| Under 5 Years | 43 (2.5%) | 0 (0.0%) |
| 5 to 9 Years | 136 (7.8%) | 65 (4.4%) |
| 10 to 14 Years | 172 (9.8%) | 234 (15.9%) |
| 15 to 19 Years | 152 (8.7%) | 0 (0.0%) |
| 20 to 24 Years | 298 (17.0%) | 149 (10.1%) |
| 25 to 29 Years | 0 (0.0%) | 66 (4.5%) |
| 30 to 34 Years | 192 (11.0%) | 111 (7.5%) |
| 35 to 39 Years | 0 (0.0%) | 133 (9.0%) |
| 40 to 44 Years | 134 (7.7%) | 151 (10.2%) |
| 45 to 49 Years | 94 (5.4%) | 21 (1.4%) |
| 50 to 54 Years | 105 (6.0%) | 117 (7.9%) |
| 55 to 59 Years | 140 (8.0%) | 143 (9.7%) |
| 60 to 64 Years | 88 (5.0%) | 109 (7.4%) |
| 65 to 69 Years | 92 (5.3%) | 68 (4.6%) |
| 70 to 74 Years | 8 (0.5%) | 0 (0.0%) |
| 75 to 79 Years | 67 (3.8%) | 52 (3.5%) |
| 80 to 84 Years | 8 (0.5%) | 55 (3.7%) |
| 85 Years and over | 20 (1.1%) | 1 (0.1%) |
| Total | 1,749 (100.0%) | 1,475 (100.0%) |
Families and Households in Oak Trail Shores
Median Family Size in Oak Trail Shores
The median family size in Oak Trail Shores is 3.30 persons per family, with married-couple families (568 | 74.8%) accounting for the largest median family size of 3.5 persons per family. On the other hand, single female/mother families (65 | 8.6%) represent the smallest median family size with 2.29 persons per family.
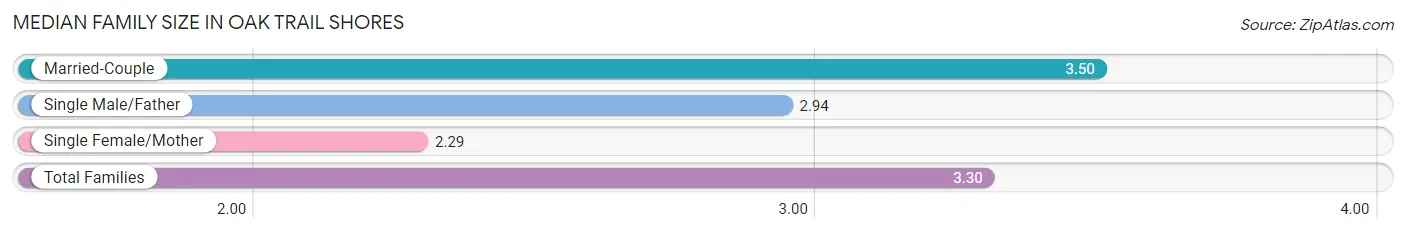
| Family Type | # Families | Family Size |
| Married-Couple | 568 (74.8%) | 3.50 |
| Single Male/Father | 126 (16.6%) | 2.94 |
| Single Female/Mother | 65 (8.6%) | 2.29 |
| Total Families | 759 (100.0%) | 3.30 |
Median Household Size in Oak Trail Shores
The median household size in Oak Trail Shores is 2.28 persons per household, with married-couple households (568 | 40.1%) accounting for the largest median household size of 3.5 persons per household. non-family households (657 | 46.4%) represent the smallest median household size with 1.09 persons per household.
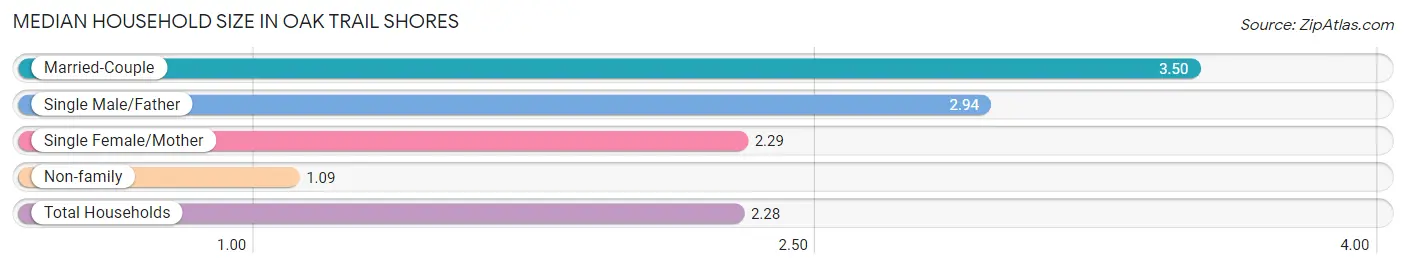
| Household Type | # Households | Household Size |
| Married-Couple | 568 (40.1%) | 3.50 |
| Single Male/Father | 126 (8.9%) | 2.94 |
| Single Female/Mother | 65 (4.6%) | 2.29 |
| Non-family | 657 (46.4%) | 1.09 |
| Total Households | 1,416 (100.0%) | 2.28 |
Household Size by Marriage Status in Oak Trail Shores
Out of a total of 1,416 households in Oak Trail Shores, 759 (53.6%) are family households, while 657 (46.4%) are nonfamily households. The most numerous type of family households are 4-person households, comprising 382, and the most common type of nonfamily households are 1-person households, comprising 607.
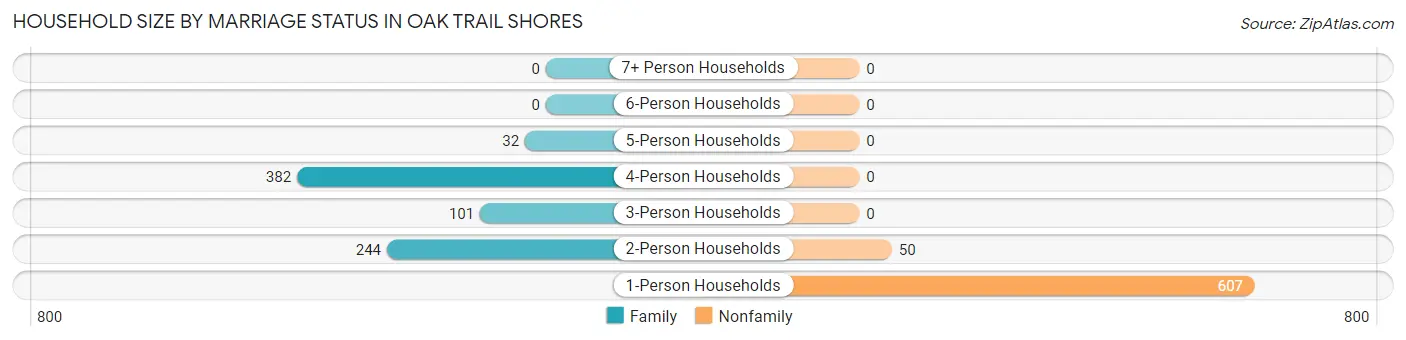
| Household Size | Family Households | Nonfamily Households |
| 1-Person Households | - | 607 (42.9%) |
| 2-Person Households | 244 (17.2%) | 50 (3.5%) |
| 3-Person Households | 101 (7.1%) | 0 (0.0%) |
| 4-Person Households | 382 (27.0%) | 0 (0.0%) |
| 5-Person Households | 32 (2.3%) | 0 (0.0%) |
| 6-Person Households | 0 (0.0%) | 0 (0.0%) |
| 7+ Person Households | 0 (0.0%) | 0 (0.0%) |
| Total | 759 (53.6%) | 657 (46.4%) |
Female Fertility in Oak Trail Shores
Fertility by Age in Oak Trail Shores
| Age Bracket | Women with Births | Births / 1,000 Women |
| 15 to 19 years | 0 (0.0%) | 0.0 |
| 20 to 34 years | 0 (0.0%) | 0.0 |
| 35 to 50 years | 0 (0.0%) | 0.0 |
| Total | 0 (0.0%) | 0.0 |
Fertility by Age by Marriage Status in Oak Trail Shores
| Age Bracket | Married | Unmarried |
| 15 to 19 years | 0 (0.0%) | 0 (0.0%) |
| 20 to 34 years | 0 (0.0%) | 0 (0.0%) |
| 35 to 50 years | 0 (0.0%) | 0 (0.0%) |
| Total | 0 (0.0%) | 0 (0.0%) |
Fertility by Education in Oak Trail Shores
| Educational Attainment | Women with Births | Births / 1,000 Women |
| Less than High School | 0 (0.0%) | 0.0 |
| High School Diploma | 0 (0.0%) | 0.0 |
| College or Associate's Degree | 0 (0.0%) | 0.0 |
| Bachelor's Degree | 0 (0.0%) | 0.0 |
| Graduate Degree | 0 (0.0%) | 0.0 |
| Total | 0 (0.0%) | 0.0 |
Fertility by Education by Marriage Status in Oak Trail Shores
| Educational Attainment | Married | Unmarried |
| Less than High School | 0 (0.0%) | 0 (0.0%) |
| High School Diploma | 0 (0.0%) | 0 (0.0%) |
| College or Associate's Degree | 0 (0.0%) | 0 (0.0%) |
| Bachelor's Degree | 0 (0.0%) | 0 (0.0%) |
| Graduate Degree | 0 (0.0%) | 0 (0.0%) |
| Total | 0 (0.0%) | 0 (0.0%) |
Employment Characteristics in Oak Trail Shores
Employment by Class of Employer in Oak Trail Shores
Among the 1,290 employed individuals in Oak Trail Shores, private company employees (700 | 54.3%), self-employed (not incorporated) (336 | 26.1%), and local government employees (142 | 11.0%) make up the most common classes of employment.
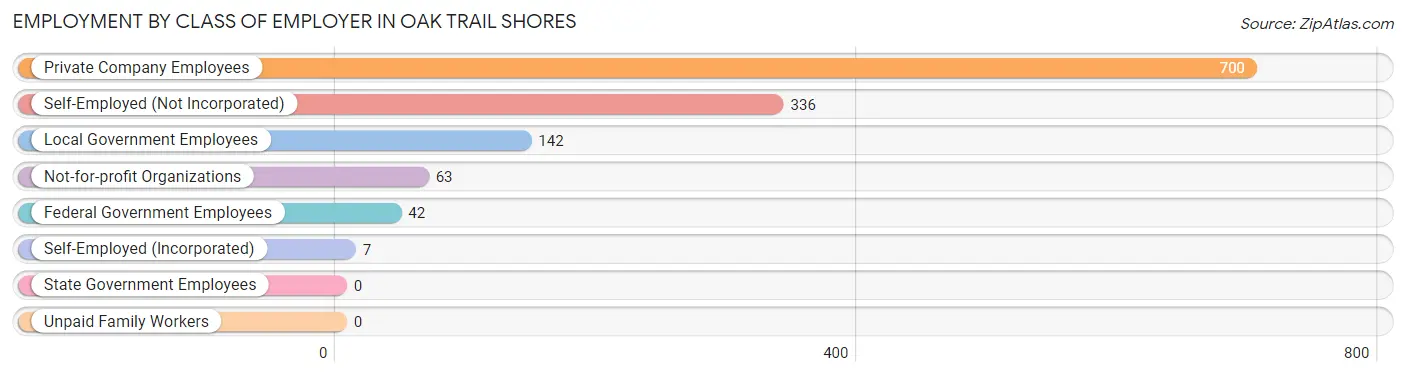
| Employer Class | # Employees | % Employees |
| Private Company Employees | 700 | 54.3% |
| Self-Employed (Incorporated) | 7 | 0.5% |
| Self-Employed (Not Incorporated) | 336 | 26.1% |
| Not-for-profit Organizations | 63 | 4.9% |
| Local Government Employees | 142 | 11.0% |
| State Government Employees | 0 | 0.0% |
| Federal Government Employees | 42 | 3.3% |
| Unpaid Family Workers | 0 | 0.0% |
| Total | 1,290 | 100.0% |
Employment Status by Age in Oak Trail Shores
According to the labor force statistics for Oak Trail Shores, out of the total population over 16 years of age (2,471), 54.2% or 1,339 individuals are in the labor force, with 3.7% or 50 of them unemployed. The age group with the highest labor force participation rate is 20 to 24 years, with 91.7% or 410 individuals in the labor force. Within the labor force, the 16 to 19 years age range has the highest percentage of unemployed individuals, with 100.0% or 25 of them being unemployed.
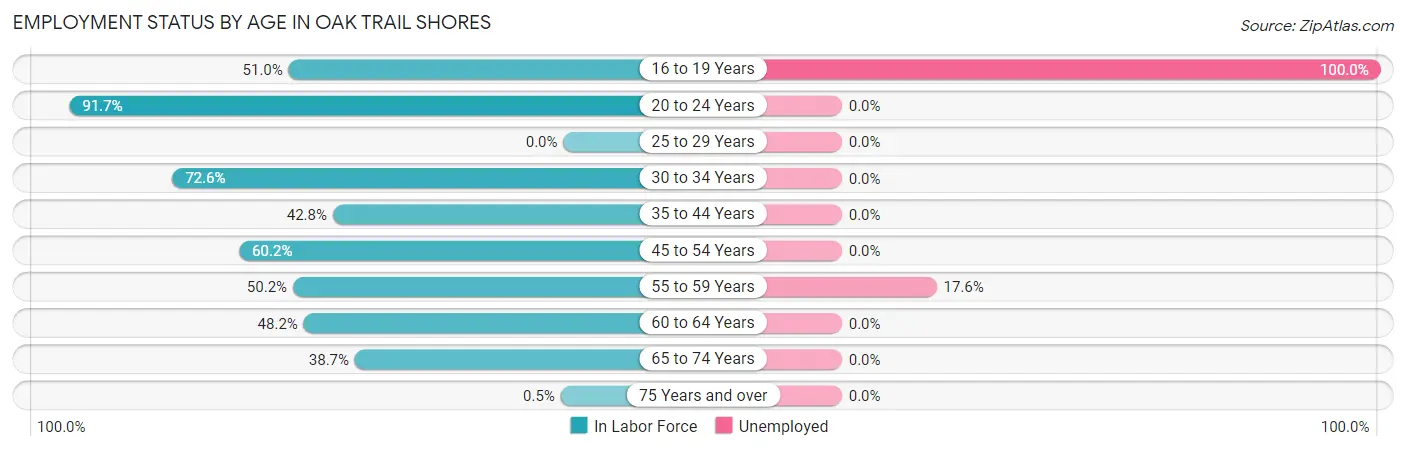
| Age Bracket | In Labor Force | Unemployed |
| 16 to 19 Years | 25 (51.0%) | 25 (100.0%) |
| 20 to 24 Years | 410 (91.7%) | 0 (0.0%) |
| 25 to 29 Years | 0 (0.0%) | 0 (0.0%) |
| 30 to 34 Years | 220 (72.6%) | 0 (0.0%) |
| 35 to 44 Years | 179 (42.8%) | 0 (0.0%) |
| 45 to 54 Years | 203 (60.2%) | 0 (0.0%) |
| 55 to 59 Years | 142 (50.2%) | 25 (17.6%) |
| 60 to 64 Years | 95 (48.2%) | 0 (0.0%) |
| 65 to 74 Years | 65 (38.7%) | 0 (0.0%) |
| 75 Years and over | 1 (0.5%) | 0 (0.0%) |
| Total | 1,339 (54.2%) | 50 (3.7%) |
Employment Status by Educational Attainment in Oak Trail Shores
According to labor force statistics for Oak Trail Shores, 52.3% of individuals (839) out of the total population between 25 and 64 years of age (1,604) are in the labor force, with 3.0% or 25 of them being unemployed. The group with the highest labor force participation rate are those with the educational attainment of college / associate degree, with 77.2% or 227 individuals in the labor force. Within the labor force, individuals with college / associate degree education have the highest percentage of unemployment, with 11.0% or 25 of them being unemployed.
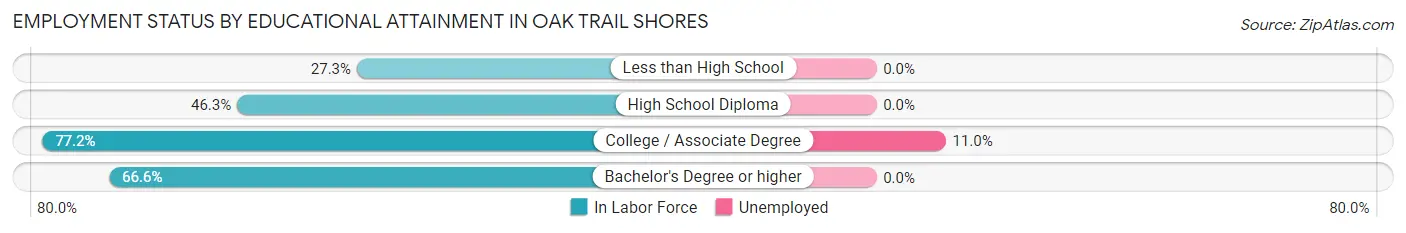
| Educational Attainment | In Labor Force | Unemployed |
| Less than High School | 85 (27.3%) | 0 (0.0%) |
| High School Diploma | 316 (46.3%) | 0 (0.0%) |
| College / Associate Degree | 227 (77.2%) | 32 (11.0%) |
| Bachelor's Degree or higher | 211 (66.6%) | 0 (0.0%) |
| Total | 839 (52.3%) | 48 (3.0%) |
Employment Occupations by Sex in Oak Trail Shores
Management, Business, Science and Arts Occupations
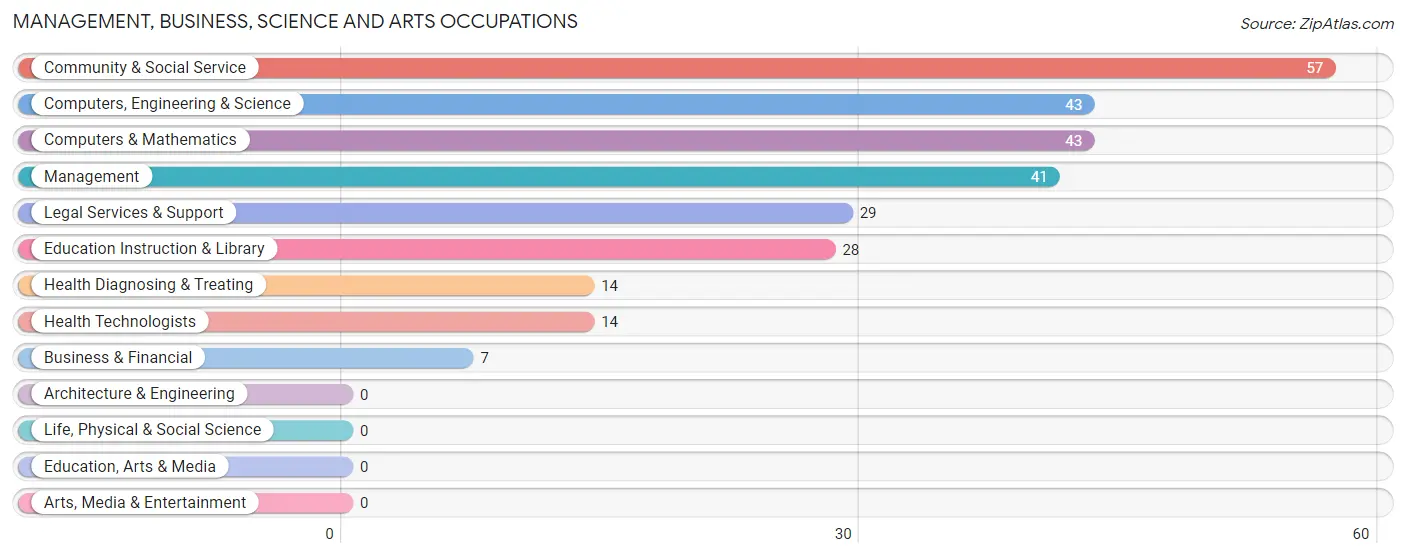
The most common Management, Business, Science and Arts occupations in Oak Trail Shores are Community & Social Service (57 | 4.4%), Computers, Engineering & Science (43 | 3.3%), Computers & Mathematics (43 | 3.3%), Management (41 | 3.2%), and Legal Services & Support (29 | 2.2%).
Management, Business, Science and Arts Occupations by Sex
Within the Management, Business, Science and Arts occupations in Oak Trail Shores, the most male-oriented occupations are Business & Financial (100.0%), Computers, Engineering & Science (100.0%), and Computers & Mathematics (100.0%), while the most female-oriented occupations are Management (100.0%), Education Instruction & Library (100.0%), and Health Diagnosing & Treating (100.0%).
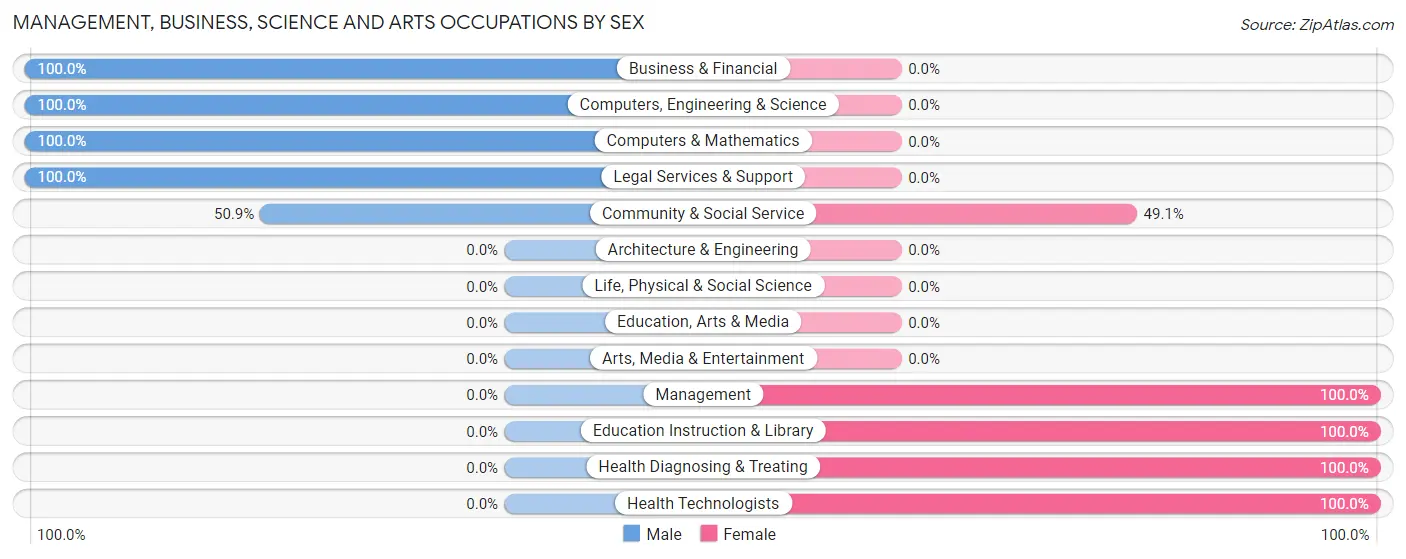
| Occupation | Male | Female |
| Management | 0 (0.0%) | 41 (100.0%) |
| Business & Financial | 7 (100.0%) | 0 (0.0%) |
| Computers, Engineering & Science | 43 (100.0%) | 0 (0.0%) |
| Computers & Mathematics | 43 (100.0%) | 0 (0.0%) |
| Architecture & Engineering | 0 (0.0%) | 0 (0.0%) |
| Life, Physical & Social Science | 0 (0.0%) | 0 (0.0%) |
| Community & Social Service | 29 (50.9%) | 28 (49.1%) |
| Education, Arts & Media | 0 (0.0%) | 0 (0.0%) |
| Legal Services & Support | 29 (100.0%) | 0 (0.0%) |
| Education Instruction & Library | 0 (0.0%) | 28 (100.0%) |
| Arts, Media & Entertainment | 0 (0.0%) | 0 (0.0%) |
| Health Diagnosing & Treating | 0 (0.0%) | 14 (100.0%) |
| Health Technologists | 0 (0.0%) | 14 (100.0%) |
| Total (Category) | 79 (48.8%) | 83 (51.2%) |
| Total (Overall) | 952 (73.8%) | 338 (26.2%) |
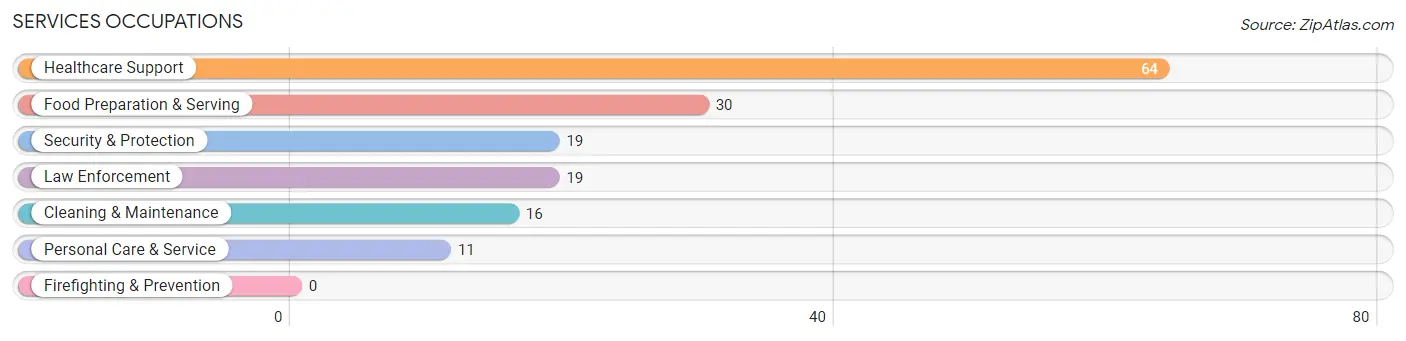
Services Occupations
The most common Services occupations in Oak Trail Shores are Healthcare Support (64 | 5.0%), Food Preparation & Serving (30 | 2.3%), Security & Protection (19 | 1.5%), Law Enforcement (19 | 1.5%), and Cleaning & Maintenance (16 | 1.2%).
Services Occupations by Sex
Within the Services occupations in Oak Trail Shores, the most male-oriented occupations are Security & Protection (100.0%), Law Enforcement (100.0%), and Food Preparation & Serving (100.0%), while the most female-oriented occupations are Healthcare Support (100.0%), and Personal Care & Service (100.0%).
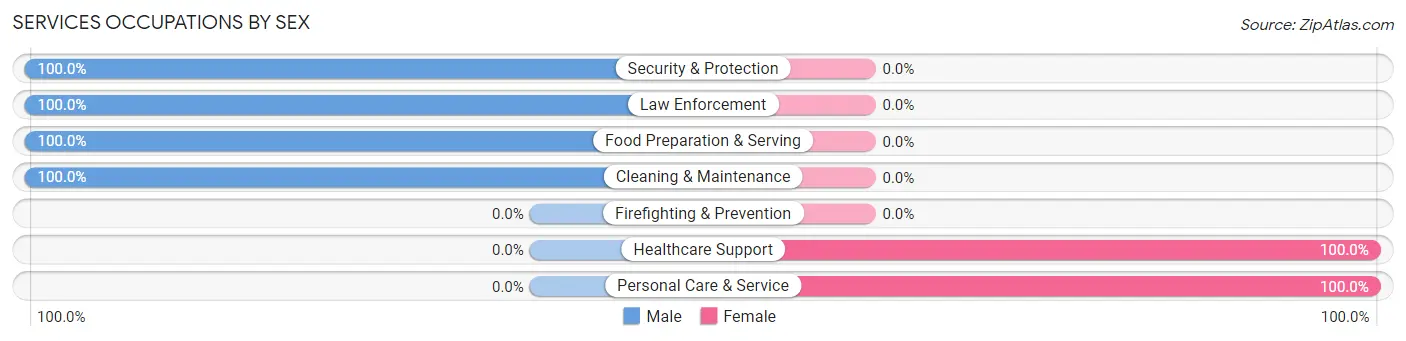
| Occupation | Male | Female |
| Healthcare Support | 0 (0.0%) | 64 (100.0%) |
| Security & Protection | 19 (100.0%) | 0 (0.0%) |
| Firefighting & Prevention | 0 (0.0%) | 0 (0.0%) |
| Law Enforcement | 19 (100.0%) | 0 (0.0%) |
| Food Preparation & Serving | 30 (100.0%) | 0 (0.0%) |
| Cleaning & Maintenance | 16 (100.0%) | 0 (0.0%) |
| Personal Care & Service | 0 (0.0%) | 11 (100.0%) |
| Total (Category) | 65 (46.4%) | 75 (53.6%) |
| Total (Overall) | 952 (73.8%) | 338 (26.2%) |
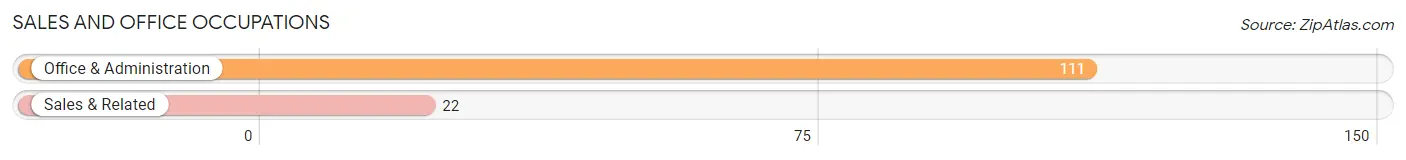
Sales and Office Occupations
The most common Sales and Office occupations in Oak Trail Shores are Office & Administration (111 | 8.6%), and Sales & Related (22 | 1.7%).
Sales and Office Occupations by Sex
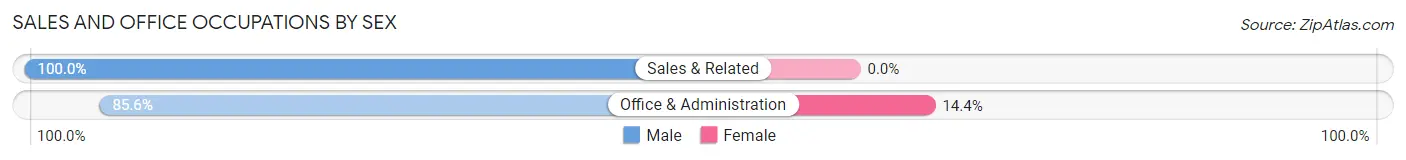
| Occupation | Male | Female |
| Sales & Related | 22 (100.0%) | 0 (0.0%) |
| Office & Administration | 95 (85.6%) | 16 (14.4%) |
| Total (Category) | 117 (88.0%) | 16 (12.0%) |
| Total (Overall) | 952 (73.8%) | 338 (26.2%) |
Natural Resources, Construction and Maintenance Occupations
The most common Natural Resources, Construction and Maintenance occupations in Oak Trail Shores are , and Construction & Extraction (256 | 19.8%).
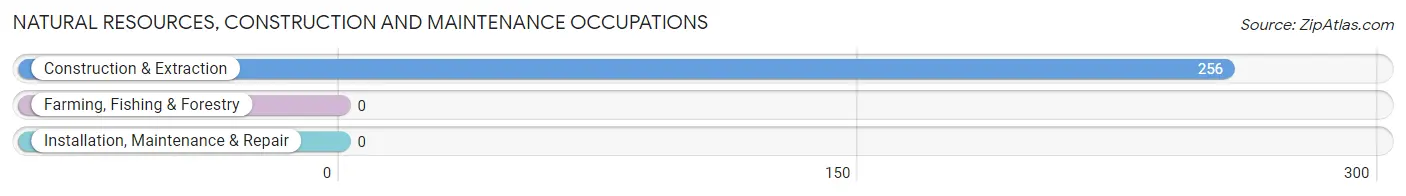
Natural Resources, Construction and Maintenance Occupations by Sex
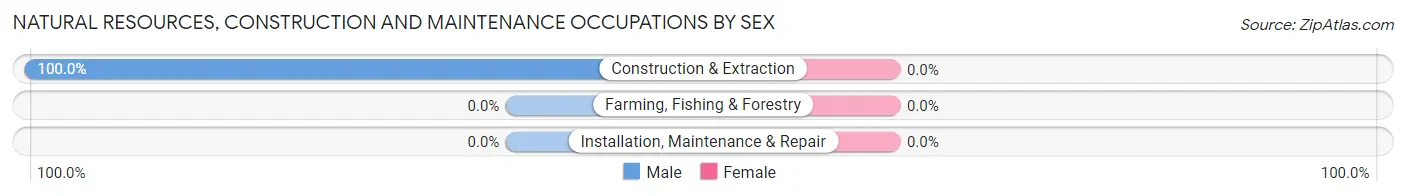
| Occupation | Male | Female |
| Farming, Fishing & Forestry | 0 (0.0%) | 0 (0.0%) |
| Construction & Extraction | 256 (100.0%) | 0 (0.0%) |
| Installation, Maintenance & Repair | 0 (0.0%) | 0 (0.0%) |
| Total (Category) | 256 (100.0%) | 0 (0.0%) |
| Total (Overall) | 952 (73.8%) | 338 (26.2%) |
Production, Transportation and Moving Occupations
The most common Production, Transportation and Moving occupations in Oak Trail Shores are Material Moving (367 | 28.4%), Production (143 | 11.1%), and Transportation (89 | 6.9%).
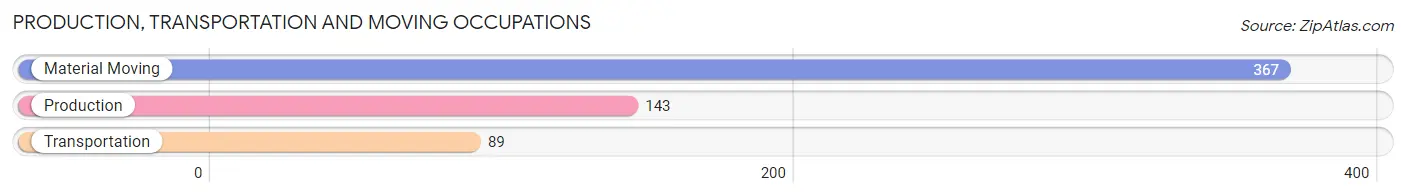
Production, Transportation and Moving Occupations by Sex
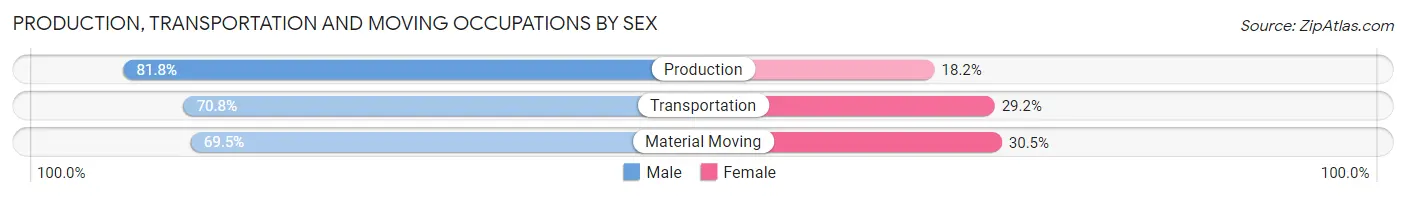
| Occupation | Male | Female |
| Production | 117 (81.8%) | 26 (18.2%) |
| Transportation | 63 (70.8%) | 26 (29.2%) |
| Material Moving | 255 (69.5%) | 112 (30.5%) |
| Total (Category) | 435 (72.6%) | 164 (27.4%) |
| Total (Overall) | 952 (73.8%) | 338 (26.2%) |
Employment Industries by Sex in Oak Trail Shores
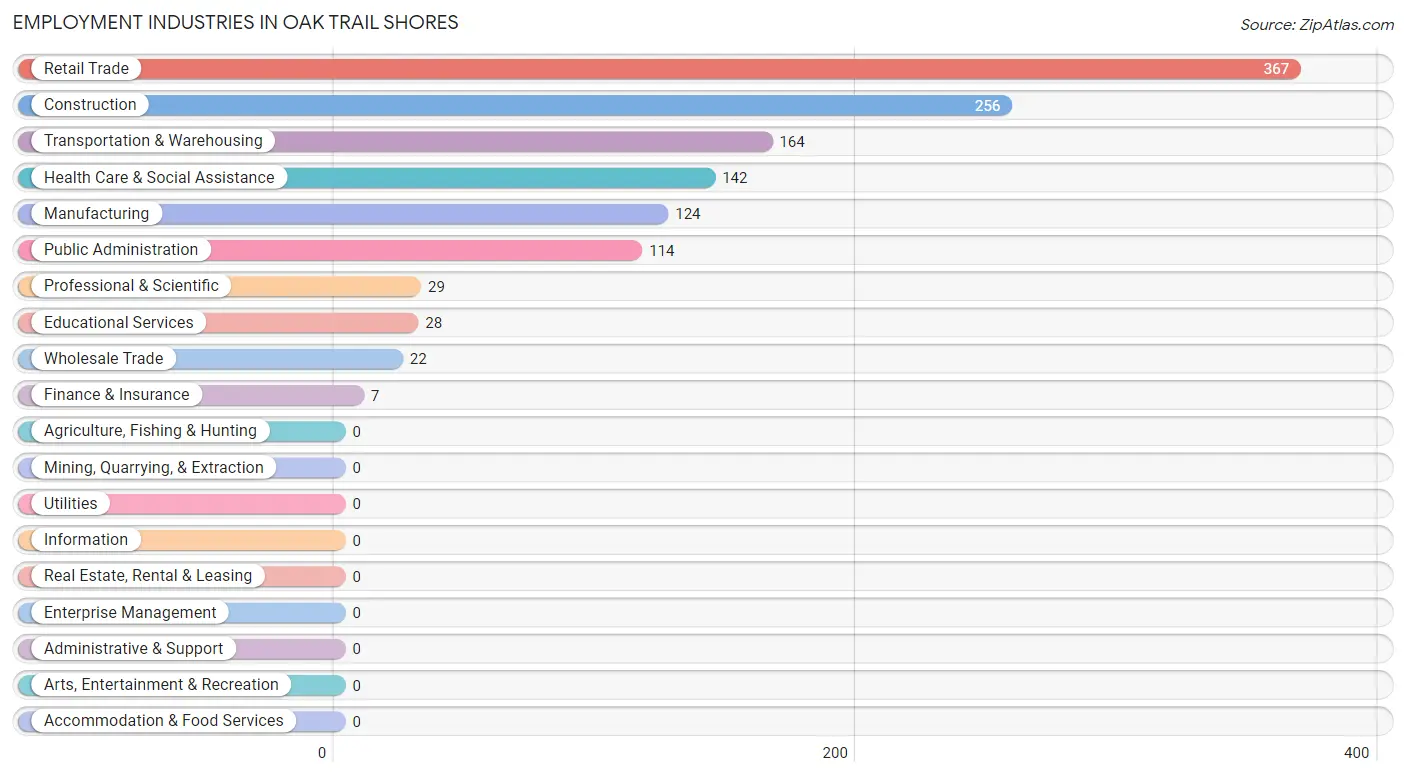
Employment Industries in Oak Trail Shores
The major employment industries in Oak Trail Shores include Retail Trade (367 | 28.4%), Construction (256 | 19.8%), Transportation & Warehousing (164 | 12.7%), Health Care & Social Assistance (142 | 11.0%), and Manufacturing (124 | 9.6%).
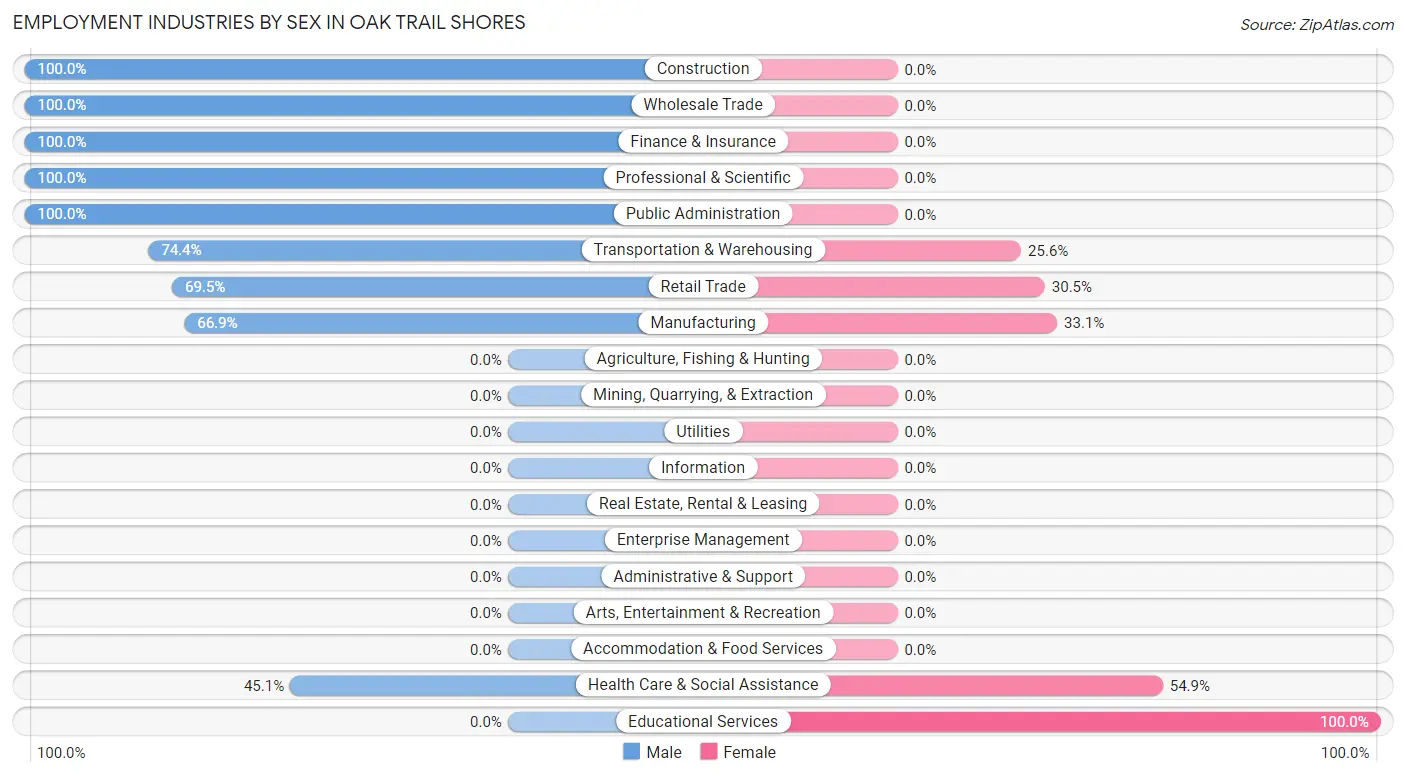
Employment Industries by Sex in Oak Trail Shores
The Oak Trail Shores industries that see more men than women are Construction (100.0%), Wholesale Trade (100.0%), and Finance & Insurance (100.0%), whereas the industries that tend to have a higher number of women are Educational Services (100.0%), Health Care & Social Assistance (54.9%), and Manufacturing (33.1%).
| Industry | Male | Female |
| Agriculture, Fishing & Hunting | 0 (0.0%) | 0 (0.0%) |
| Mining, Quarrying, & Extraction | 0 (0.0%) | 0 (0.0%) |
| Construction | 256 (100.0%) | 0 (0.0%) |
| Manufacturing | 83 (66.9%) | 41 (33.1%) |
| Wholesale Trade | 22 (100.0%) | 0 (0.0%) |
| Retail Trade | 255 (69.5%) | 112 (30.5%) |
| Transportation & Warehousing | 122 (74.4%) | 42 (25.6%) |
| Utilities | 0 (0.0%) | 0 (0.0%) |
| Information | 0 (0.0%) | 0 (0.0%) |
| Finance & Insurance | 7 (100.0%) | 0 (0.0%) |
| Real Estate, Rental & Leasing | 0 (0.0%) | 0 (0.0%) |
| Professional & Scientific | 29 (100.0%) | 0 (0.0%) |
| Enterprise Management | 0 (0.0%) | 0 (0.0%) |
| Administrative & Support | 0 (0.0%) | 0 (0.0%) |
| Educational Services | 0 (0.0%) | 28 (100.0%) |
| Health Care & Social Assistance | 64 (45.1%) | 78 (54.9%) |
| Arts, Entertainment & Recreation | 0 (0.0%) | 0 (0.0%) |
| Accommodation & Food Services | 0 (0.0%) | 0 (0.0%) |
| Public Administration | 114 (100.0%) | 0 (0.0%) |
| Total | 952 (73.8%) | 338 (26.2%) |
Education in Oak Trail Shores
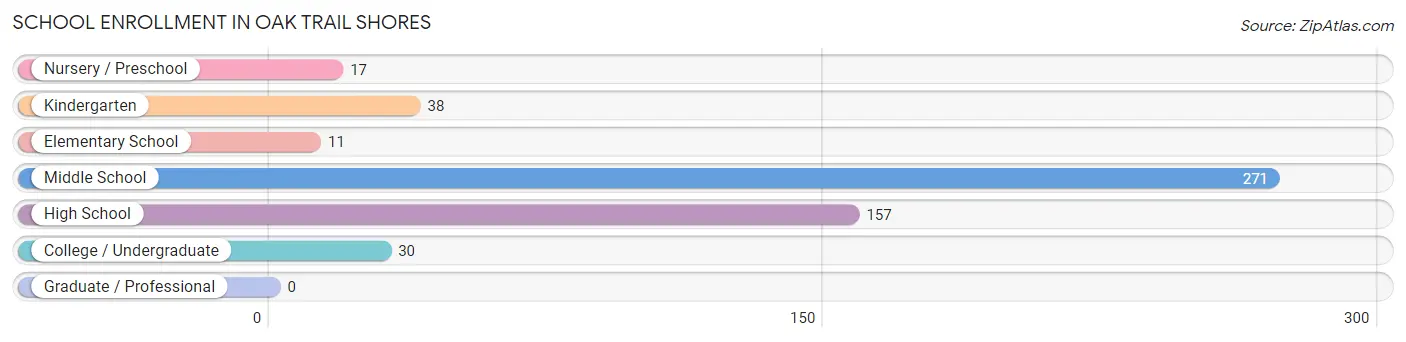
School Enrollment in Oak Trail Shores
The most common levels of schooling among the 524 students in Oak Trail Shores are middle school (271 | 51.7%), high school (157 | 30.0%), and kindergarten (38 | 7.2%).
| School Level | # Students | % Students |
| Nursery / Preschool | 17 | 3.2% |
| Kindergarten | 38 | 7.2% |
| Elementary School | 11 | 2.1% |
| Middle School | 271 | 51.7% |
| High School | 157 | 30.0% |
| College / Undergraduate | 30 | 5.7% |
| Graduate / Professional | 0 | 0.0% |
| Total | 524 | 100.0% |
School Enrollment by Age by Funding Source in Oak Trail Shores
Out of a total of 524 students who are enrolled in schools in Oak Trail Shores, 17 (3.2%) attend a private institution, while the remaining 507 (96.8%) are enrolled in public schools. The age group of 3 to 4 year olds has the highest likelihood of being enrolled in private schools, with 17 (100.0% in the age bracket) enrolled. Conversely, the age group of 5 to 9 year old has the lowest likelihood of being enrolled in a private school, with 49 (100.0% in the age bracket) attending a public institution.
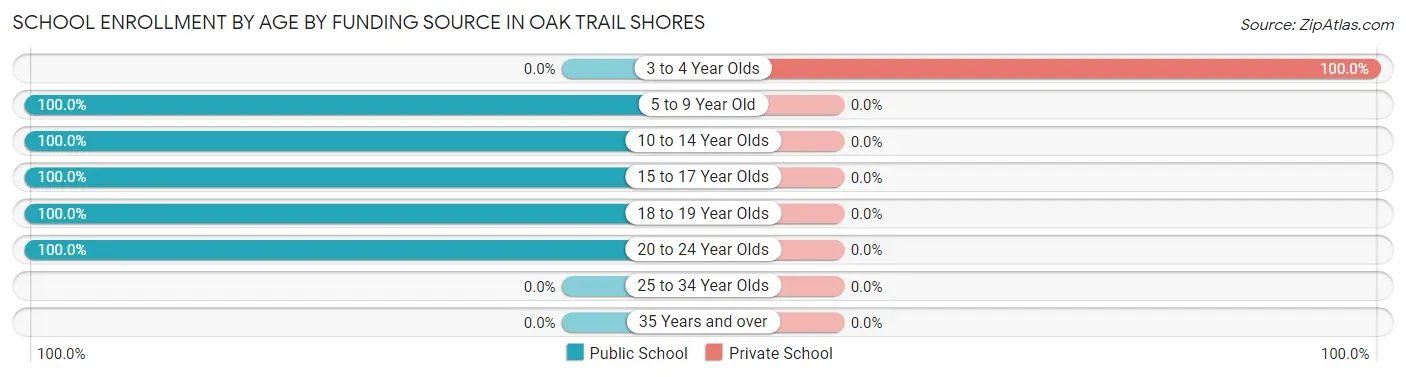
| Age Bracket | Public School | Private School |
| 3 to 4 Year Olds | 0 (0.0%) | 17 (100.0%) |
| 5 to 9 Year Old | 49 (100.0%) | 0 (0.0%) |
| 10 to 14 Year Olds | 379 (100.0%) | 0 (0.0%) |
| 15 to 17 Year Olds | 39 (100.0%) | 0 (0.0%) |
| 18 to 19 Year Olds | 10 (100.0%) | 0 (0.0%) |
| 20 to 24 Year Olds | 30 (100.0%) | 0 (0.0%) |
| 25 to 34 Year Olds | 0 (0.0%) | 0 (0.0%) |
| 35 Years and over | 0 (0.0%) | 0 (0.0%) |
| Total | 507 (96.8%) | 17 (3.2%) |
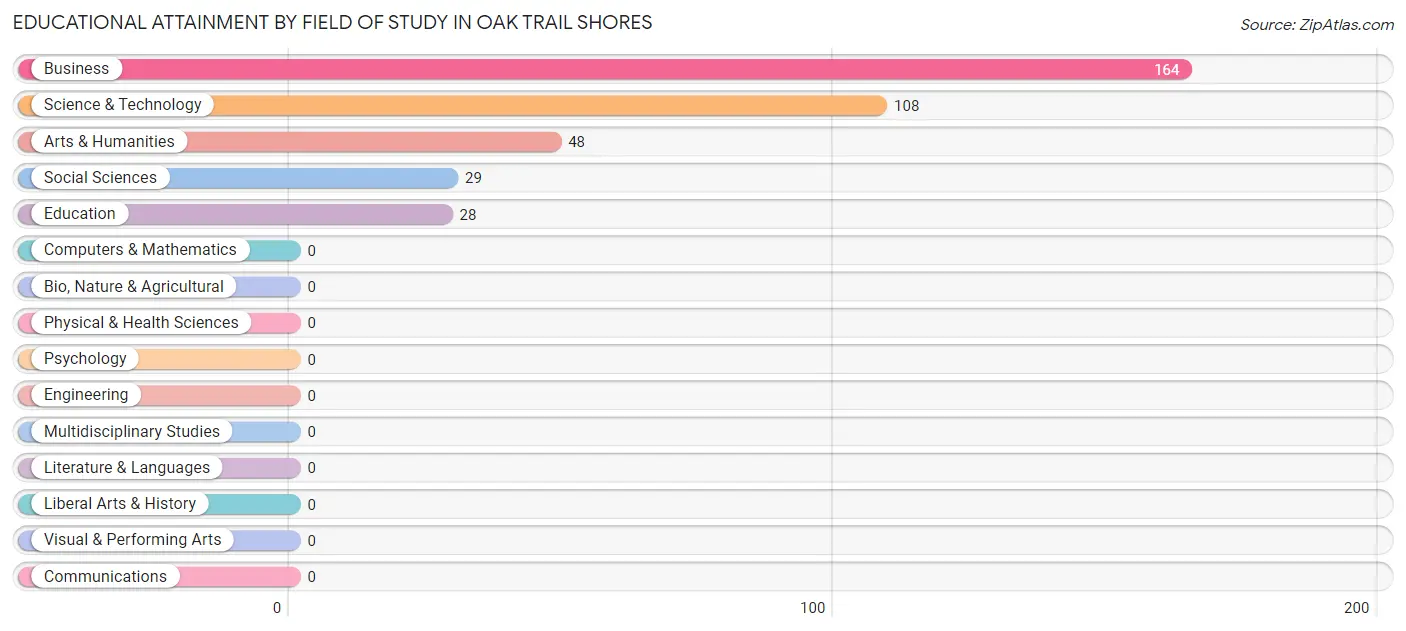
Educational Attainment by Field of Study in Oak Trail Shores
Business (164 | 43.5%), science & technology (108 | 28.6%), arts & humanities (48 | 12.7%), social sciences (29 | 7.7%), and education (28 | 7.4%) are the most common fields of study among 377 individuals in Oak Trail Shores who have obtained a bachelor's degree or higher.
| Field of Study | # Graduates | % Graduates |
| Computers & Mathematics | 0 | 0.0% |
| Bio, Nature & Agricultural | 0 | 0.0% |
| Physical & Health Sciences | 0 | 0.0% |
| Psychology | 0 | 0.0% |
| Social Sciences | 29 | 7.7% |
| Engineering | 0 | 0.0% |
| Multidisciplinary Studies | 0 | 0.0% |
| Science & Technology | 108 | 28.6% |
| Business | 164 | 43.5% |
| Education | 28 | 7.4% |
| Literature & Languages | 0 | 0.0% |
| Liberal Arts & History | 0 | 0.0% |
| Visual & Performing Arts | 0 | 0.0% |
| Communications | 0 | 0.0% |
| Arts & Humanities | 48 | 12.7% |
| Total | 377 | 100.0% |
Transportation & Commute in Oak Trail Shores
Vehicle Availability by Sex in Oak Trail Shores
The most prevalent vehicle ownership categories in Oak Trail Shores are males with 2 vehicles (529, accounting for 55.6%) and females with 2 vehicles (127, making up 156.5%).
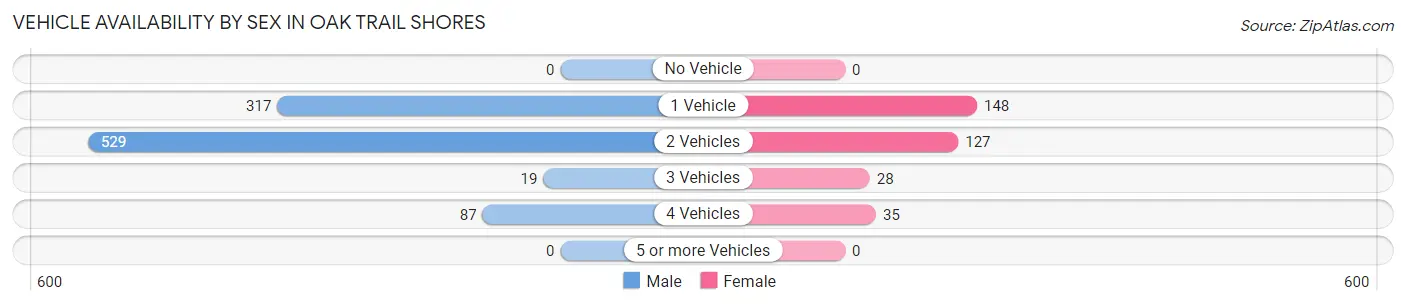
| Vehicles Available | Male | Female |
| No Vehicle | 0 (0.0%) | 0 (0.0%) |
| 1 Vehicle | 317 (33.3%) | 148 (43.8%) |
| 2 Vehicles | 529 (55.6%) | 127 (37.6%) |
| 3 Vehicles | 19 (2.0%) | 28 (8.3%) |
| 4 Vehicles | 87 (9.1%) | 35 (10.4%) |
| 5 or more Vehicles | 0 (0.0%) | 0 (0.0%) |
| Total | 952 (100.0%) | 338 (100.0%) |
Commute Time in Oak Trail Shores
The most frequently occuring commute durations in Oak Trail Shores are 5 to 9 minutes (292 commuters, 22.6%), 45 to 59 minutes (226 commuters, 17.5%), and 60 to 89 minutes (170 commuters, 13.2%).
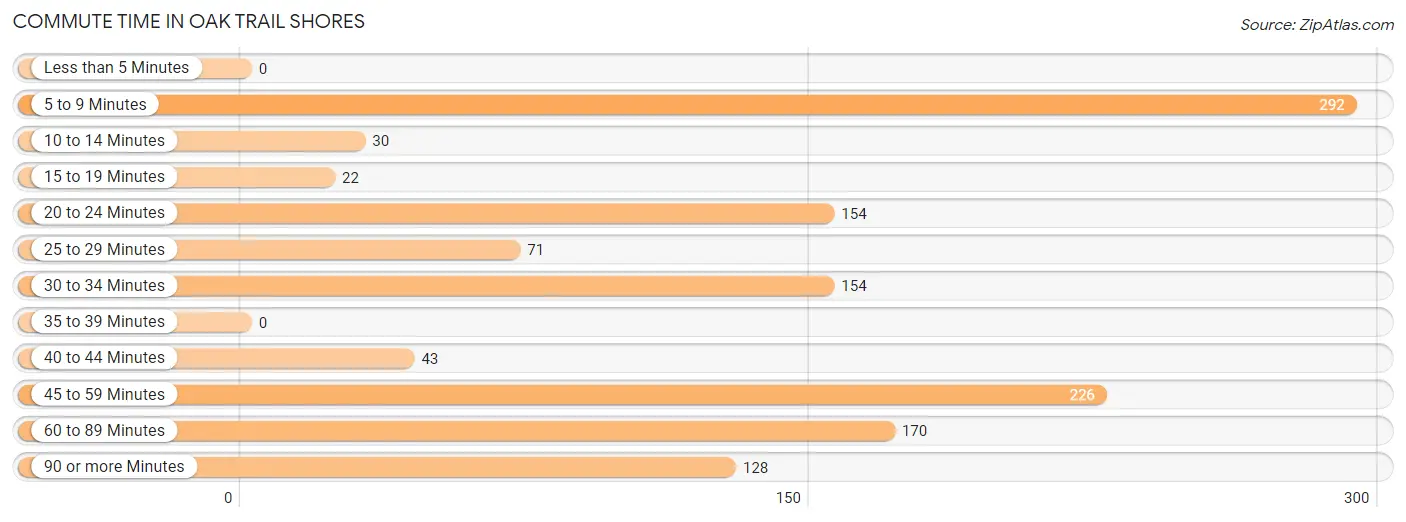
| Commute Time | # Commuters | % Commuters |
| Less than 5 Minutes | 0 | 0.0% |
| 5 to 9 Minutes | 292 | 22.6% |
| 10 to 14 Minutes | 30 | 2.3% |
| 15 to 19 Minutes | 22 | 1.7% |
| 20 to 24 Minutes | 154 | 11.9% |
| 25 to 29 Minutes | 71 | 5.5% |
| 30 to 34 Minutes | 154 | 11.9% |
| 35 to 39 Minutes | 0 | 0.0% |
| 40 to 44 Minutes | 43 | 3.3% |
| 45 to 59 Minutes | 226 | 17.5% |
| 60 to 89 Minutes | 170 | 13.2% |
| 90 or more Minutes | 128 | 9.9% |
Commute Time by Sex in Oak Trail Shores
The most common commute times in Oak Trail Shores are 5 to 9 minutes (292 commuters, 30.7%) for males and 30 to 34 minutes (154 commuters, 45.6%) for females.
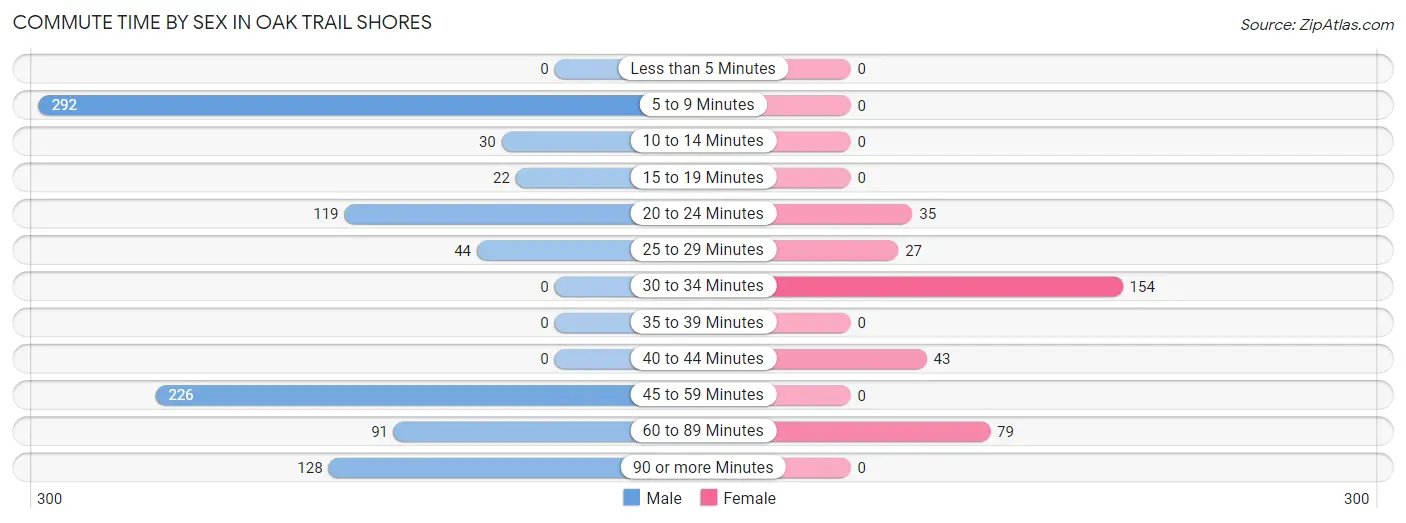
| Commute Time | Male | Female |
| Less than 5 Minutes | 0 (0.0%) | 0 (0.0%) |
| 5 to 9 Minutes | 292 (30.7%) | 0 (0.0%) |
| 10 to 14 Minutes | 30 (3.2%) | 0 (0.0%) |
| 15 to 19 Minutes | 22 (2.3%) | 0 (0.0%) |
| 20 to 24 Minutes | 119 (12.5%) | 35 (10.4%) |
| 25 to 29 Minutes | 44 (4.6%) | 27 (8.0%) |
| 30 to 34 Minutes | 0 (0.0%) | 154 (45.6%) |
| 35 to 39 Minutes | 0 (0.0%) | 0 (0.0%) |
| 40 to 44 Minutes | 0 (0.0%) | 43 (12.7%) |
| 45 to 59 Minutes | 226 (23.7%) | 0 (0.0%) |
| 60 to 89 Minutes | 91 (9.6%) | 79 (23.4%) |
| 90 or more Minutes | 128 (13.5%) | 0 (0.0%) |
Time of Departure to Work by Sex in Oak Trail Shores
The most frequent times of departure to work in Oak Trail Shores are 5:00 AM to 5:29 AM (224, 23.5%) for males and 7:00 AM to 7:29 AM (112, 33.1%) for females.
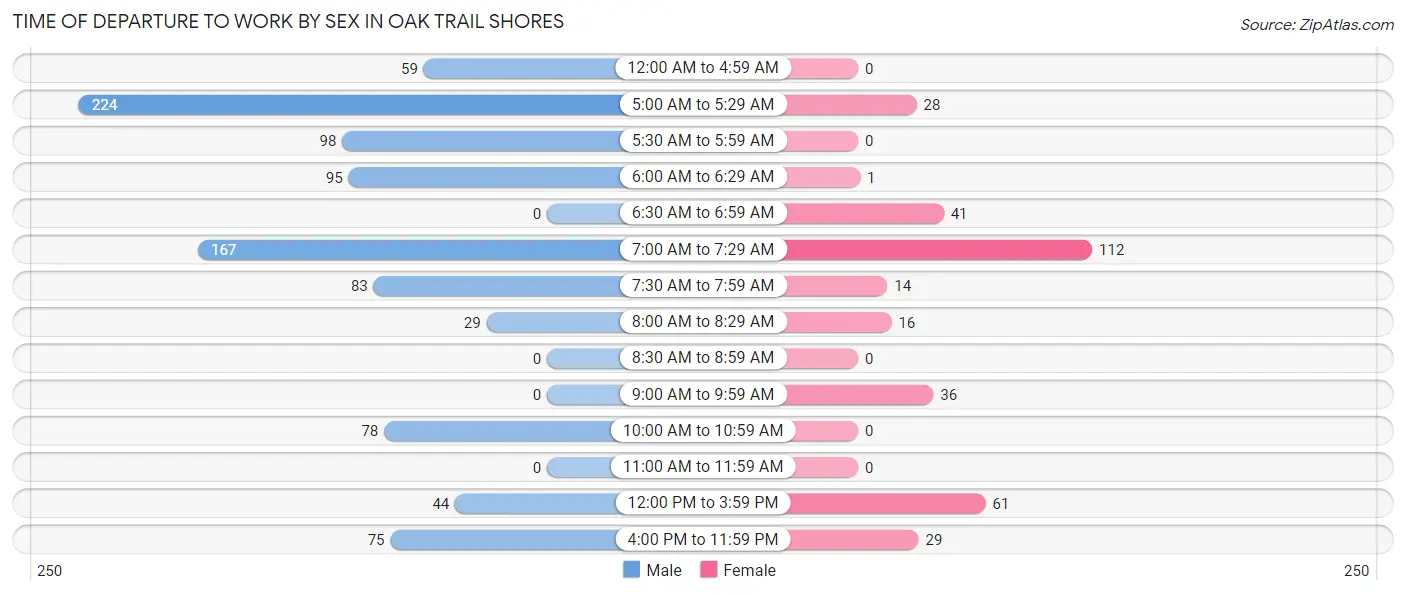
| Time of Departure | Male | Female |
| 12:00 AM to 4:59 AM | 59 (6.2%) | 0 (0.0%) |
| 5:00 AM to 5:29 AM | 224 (23.5%) | 28 (8.3%) |
| 5:30 AM to 5:59 AM | 98 (10.3%) | 0 (0.0%) |
| 6:00 AM to 6:29 AM | 95 (10.0%) | 1 (0.3%) |
| 6:30 AM to 6:59 AM | 0 (0.0%) | 41 (12.1%) |
| 7:00 AM to 7:29 AM | 167 (17.5%) | 112 (33.1%) |
| 7:30 AM to 7:59 AM | 83 (8.7%) | 14 (4.1%) |
| 8:00 AM to 8:29 AM | 29 (3.0%) | 16 (4.7%) |
| 8:30 AM to 8:59 AM | 0 (0.0%) | 0 (0.0%) |
| 9:00 AM to 9:59 AM | 0 (0.0%) | 36 (10.6%) |
| 10:00 AM to 10:59 AM | 78 (8.2%) | 0 (0.0%) |
| 11:00 AM to 11:59 AM | 0 (0.0%) | 0 (0.0%) |
| 12:00 PM to 3:59 PM | 44 (4.6%) | 61 (18.0%) |
| 4:00 PM to 11:59 PM | 75 (7.9%) | 29 (8.6%) |
| Total | 952 (100.0%) | 338 (100.0%) |
Housing Occupancy in Oak Trail Shores
Occupancy by Ownership in Oak Trail Shores
Of the total 1,416 dwellings in Oak Trail Shores, owner-occupied units account for 1,265 (89.3%), while renter-occupied units make up 151 (10.7%).
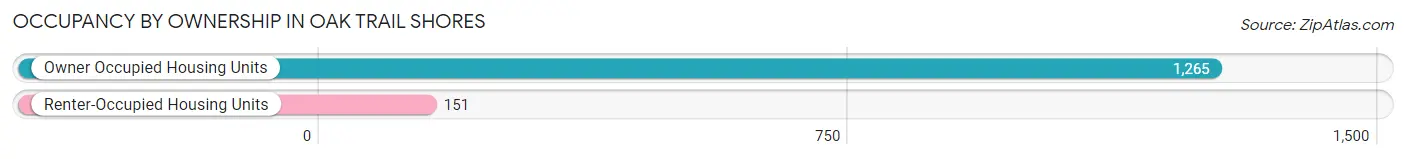
| Occupancy | # Housing Units | % Housing Units |
| Owner Occupied Housing Units | 1,265 | 89.3% |
| Renter-Occupied Housing Units | 151 | 10.7% |
| Total Occupied Housing Units | 1,416 | 100.0% |
Occupancy by Household Size in Oak Trail Shores
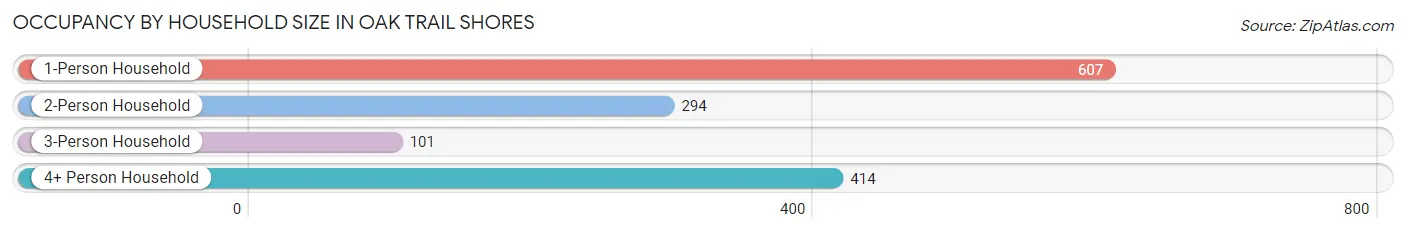
| Household Size | # Housing Units | % Housing Units |
| 1-Person Household | 607 | 42.9% |
| 2-Person Household | 294 | 20.8% |
| 3-Person Household | 101 | 7.1% |
| 4+ Person Household | 414 | 29.2% |
| Total Housing Units | 1,416 | 100.0% |
Occupancy by Ownership by Household Size in Oak Trail Shores
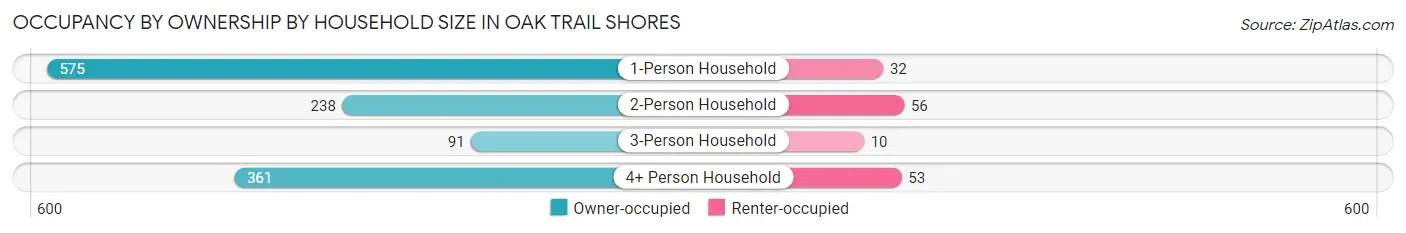
| Household Size | Owner-occupied | Renter-occupied |
| 1-Person Household | 575 (94.7%) | 32 (5.3%) |
| 2-Person Household | 238 (80.9%) | 56 (19.1%) |
| 3-Person Household | 91 (90.1%) | 10 (9.9%) |
| 4+ Person Household | 361 (87.2%) | 53 (12.8%) |
| Total Housing Units | 1,265 (89.3%) | 151 (10.7%) |
Occupancy by Educational Attainment in Oak Trail Shores
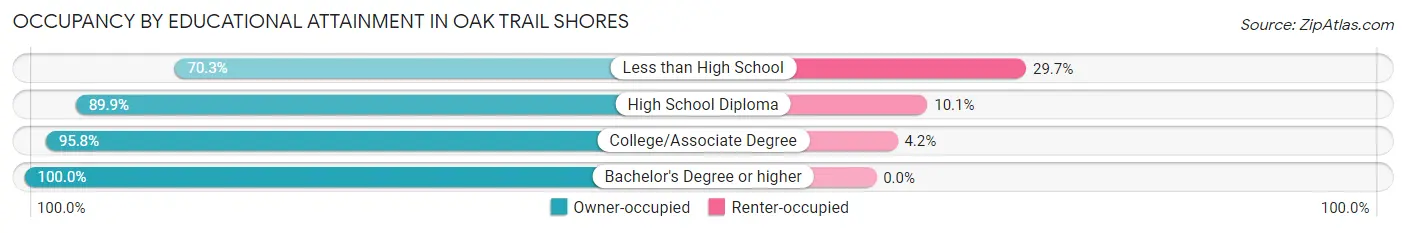
| Household Size | Owner-occupied | Renter-occupied |
| Less than High School | 175 (70.3%) | 74 (29.7%) |
| High School Diploma | 558 (89.9%) | 63 (10.1%) |
| College/Associate Degree | 318 (95.8%) | 14 (4.2%) |
| Bachelor's Degree or higher | 214 (100.0%) | 0 (0.0%) |
Occupancy by Age of Householder in Oak Trail Shores
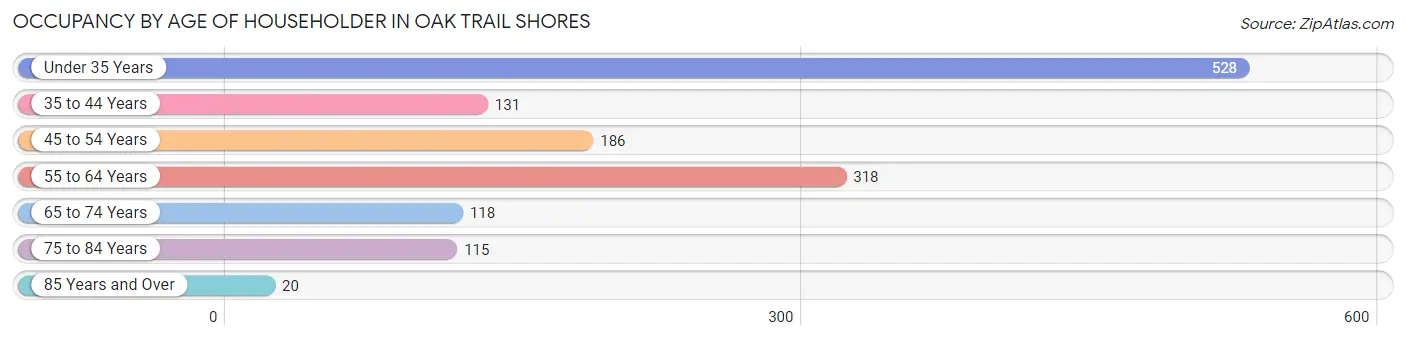
| Age Bracket | # Households | % Households |
| Under 35 Years | 528 | 37.3% |
| 35 to 44 Years | 131 | 9.2% |
| 45 to 54 Years | 186 | 13.1% |
| 55 to 64 Years | 318 | 22.5% |
| 65 to 74 Years | 118 | 8.3% |
| 75 to 84 Years | 115 | 8.1% |
| 85 Years and Over | 20 | 1.4% |
| Total | 1,416 | 100.0% |
Housing Finances in Oak Trail Shores
Median Income by Occupancy in Oak Trail Shores
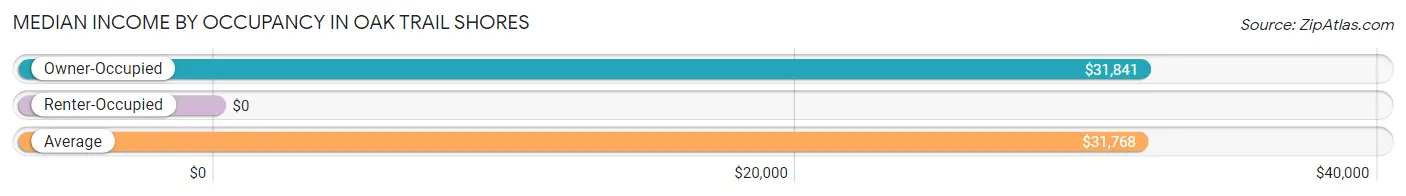
| Occupancy Type | # Households | Median Income |
| Owner-Occupied | 1,265 (89.3%) | $31,841 |
| Renter-Occupied | 151 (10.7%) | $0 |
| Average | 1,416 (100.0%) | $31,768 |
Occupancy by Householder Income Bracket in Oak Trail Shores
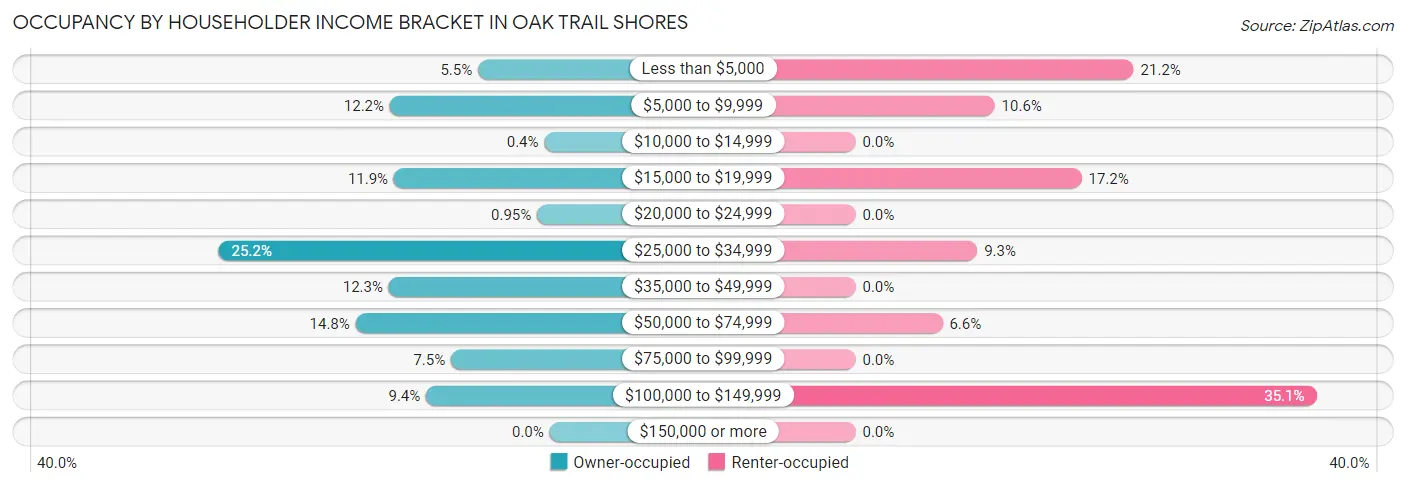
| Income Bracket | Owner-occupied | Renter-occupied |
| Less than $5,000 | 69 (5.4%) | 32 (21.2%) |
| $5,000 to $9,999 | 154 (12.2%) | 16 (10.6%) |
| $10,000 to $14,999 | 5 (0.4%) | 0 (0.0%) |
| $15,000 to $19,999 | 150 (11.9%) | 26 (17.2%) |
| $20,000 to $24,999 | 12 (0.9%) | 0 (0.0%) |
| $25,000 to $34,999 | 319 (25.2%) | 14 (9.3%) |
| $35,000 to $49,999 | 155 (12.2%) | 0 (0.0%) |
| $50,000 to $74,999 | 187 (14.8%) | 10 (6.6%) |
| $75,000 to $99,999 | 95 (7.5%) | 0 (0.0%) |
| $100,000 to $149,999 | 119 (9.4%) | 53 (35.1%) |
| $150,000 or more | 0 (0.0%) | 0 (0.0%) |
| Total | 1,265 (100.0%) | 151 (100.0%) |
Monthly Housing Cost Tiers in Oak Trail Shores
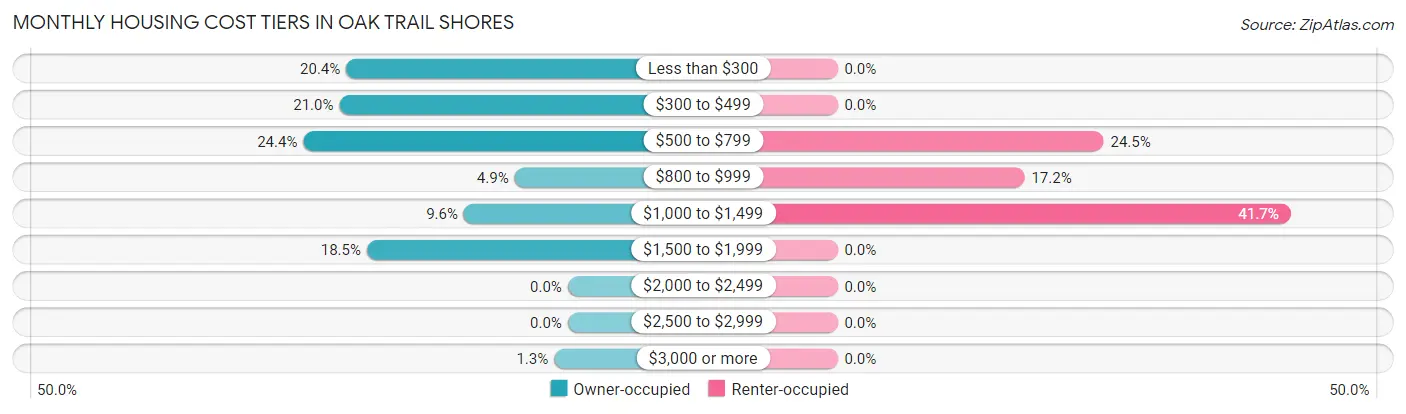
| Monthly Cost | Owner-occupied | Renter-occupied |
| Less than $300 | 258 (20.4%) | 0 (0.0%) |
| $300 to $499 | 266 (21.0%) | 0 (0.0%) |
| $500 to $799 | 308 (24.3%) | 37 (24.5%) |
| $800 to $999 | 62 (4.9%) | 26 (17.2%) |
| $1,000 to $1,499 | 121 (9.6%) | 63 (41.7%) |
| $1,500 to $1,999 | 234 (18.5%) | 0 (0.0%) |
| $2,000 to $2,499 | 0 (0.0%) | 0 (0.0%) |
| $2,500 to $2,999 | 0 (0.0%) | 0 (0.0%) |
| $3,000 or more | 16 (1.3%) | 0 (0.0%) |
| Total | 1,265 (100.0%) | 151 (100.0%) |
Physical Housing Characteristics in Oak Trail Shores
Housing Structures in Oak Trail Shores
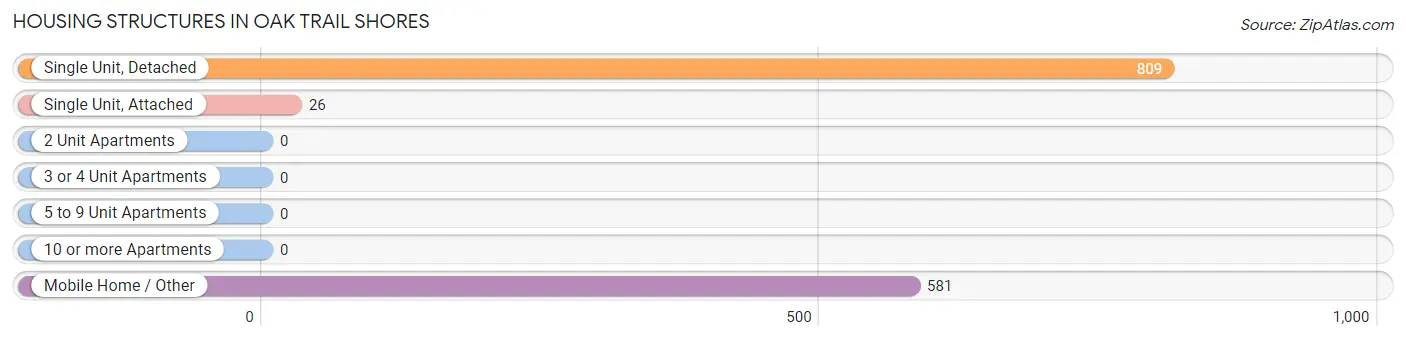
| Structure Type | # Housing Units | % Housing Units |
| Single Unit, Detached | 809 | 57.1% |
| Single Unit, Attached | 26 | 1.8% |
| 2 Unit Apartments | 0 | 0.0% |
| 3 or 4 Unit Apartments | 0 | 0.0% |
| 5 to 9 Unit Apartments | 0 | 0.0% |
| 10 or more Apartments | 0 | 0.0% |
| Mobile Home / Other | 581 | 41.0% |
| Total | 1,416 | 100.0% |
Housing Structures by Occupancy in Oak Trail Shores
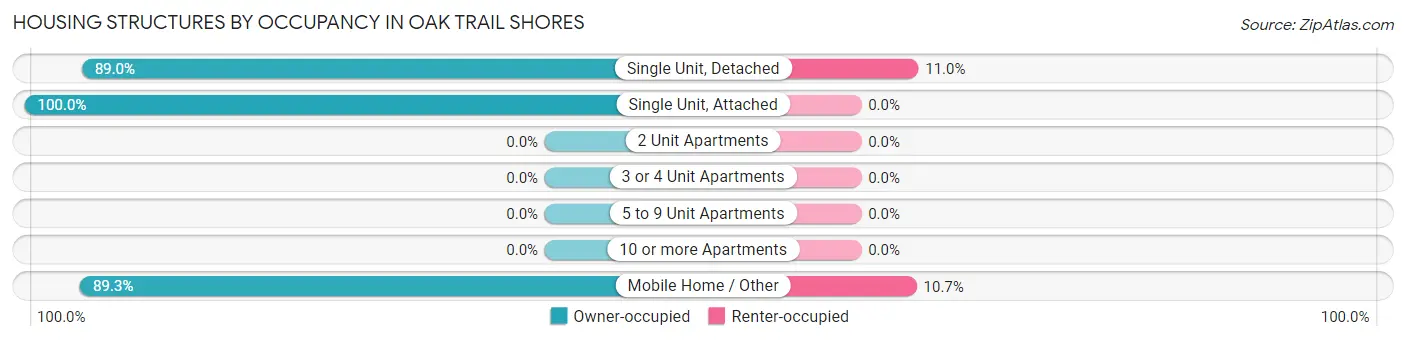
| Structure Type | Owner-occupied | Renter-occupied |
| Single Unit, Detached | 720 (89.0%) | 89 (11.0%) |
| Single Unit, Attached | 26 (100.0%) | 0 (0.0%) |
| 2 Unit Apartments | 0 (0.0%) | 0 (0.0%) |
| 3 or 4 Unit Apartments | 0 (0.0%) | 0 (0.0%) |
| 5 to 9 Unit Apartments | 0 (0.0%) | 0 (0.0%) |
| 10 or more Apartments | 0 (0.0%) | 0 (0.0%) |
| Mobile Home / Other | 519 (89.3%) | 62 (10.7%) |
| Total | 1,265 (89.3%) | 151 (10.7%) |
Housing Structures by Number of Rooms in Oak Trail Shores
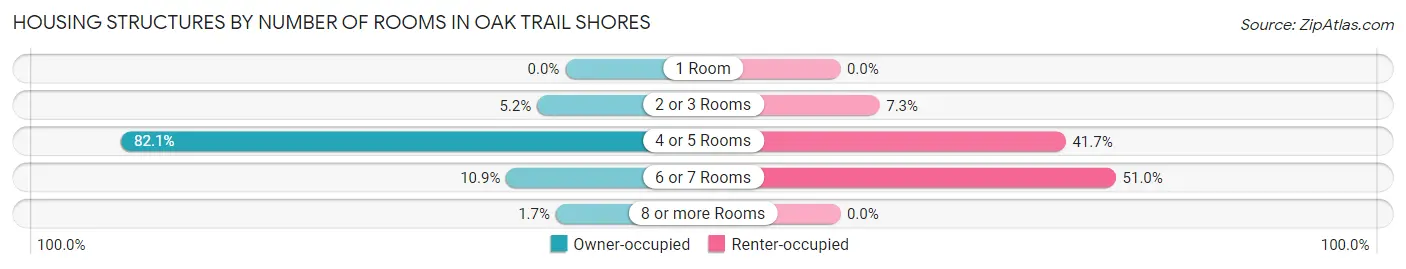
| Number of Rooms | Owner-occupied | Renter-occupied |
| 1 Room | 0 (0.0%) | 0 (0.0%) |
| 2 or 3 Rooms | 66 (5.2%) | 11 (7.3%) |
| 4 or 5 Rooms | 1,039 (82.1%) | 63 (41.7%) |
| 6 or 7 Rooms | 138 (10.9%) | 77 (51.0%) |
| 8 or more Rooms | 22 (1.7%) | 0 (0.0%) |
| Total | 1,265 (100.0%) | 151 (100.0%) |
Housing Structure by Heating Type in Oak Trail Shores
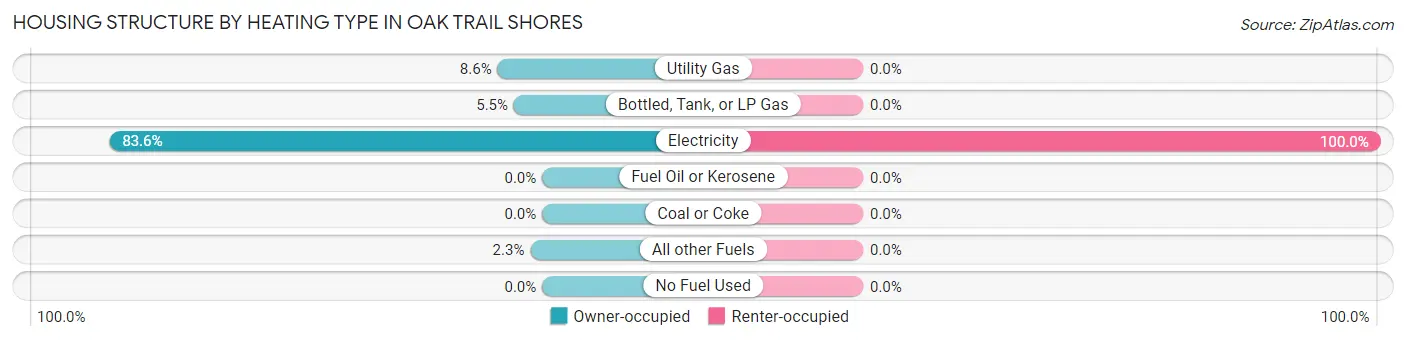
| Heating Type | Owner-occupied | Renter-occupied |
| Utility Gas | 109 (8.6%) | 0 (0.0%) |
| Bottled, Tank, or LP Gas | 69 (5.4%) | 0 (0.0%) |
| Electricity | 1,058 (83.6%) | 151 (100.0%) |
| Fuel Oil or Kerosene | 0 (0.0%) | 0 (0.0%) |
| Coal or Coke | 0 (0.0%) | 0 (0.0%) |
| All other Fuels | 29 (2.3%) | 0 (0.0%) |
| No Fuel Used | 0 (0.0%) | 0 (0.0%) |
| Total | 1,265 (100.0%) | 151 (100.0%) |
Household Vehicle Usage in Oak Trail Shores
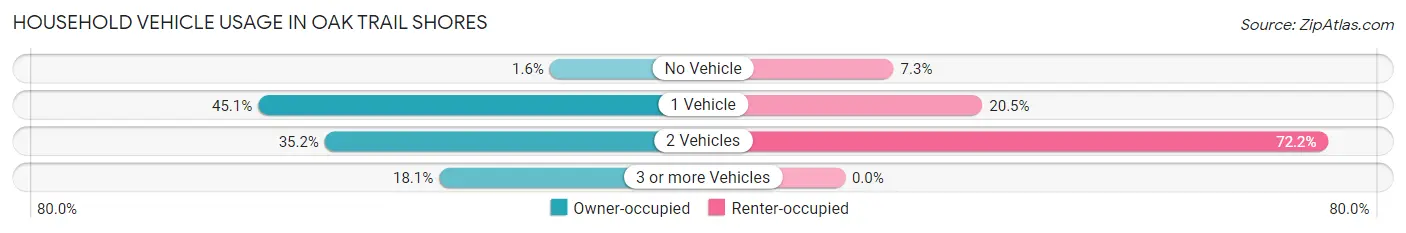
| Vehicles per Household | Owner-occupied | Renter-occupied |
| No Vehicle | 20 (1.6%) | 11 (7.3%) |
| 1 Vehicle | 571 (45.1%) | 31 (20.5%) |
| 2 Vehicles | 445 (35.2%) | 109 (72.2%) |
| 3 or more Vehicles | 229 (18.1%) | 0 (0.0%) |
| Total | 1,265 (100.0%) | 151 (100.0%) |
Real Estate & Mortgages in Oak Trail Shores
Real Estate and Mortgage Overview in Oak Trail Shores
| Characteristic | Without Mortgage | With Mortgage |
| Housing Units | 595 | 670 |
| Median Property Value | $52,600 | $152,800 |
| Median Household Income | $30,587 | $0 |
| Monthly Housing Costs | $345 | $16 |
| Real Estate Taxes | $400 | $0 |
Property Value by Mortgage Status in Oak Trail Shores
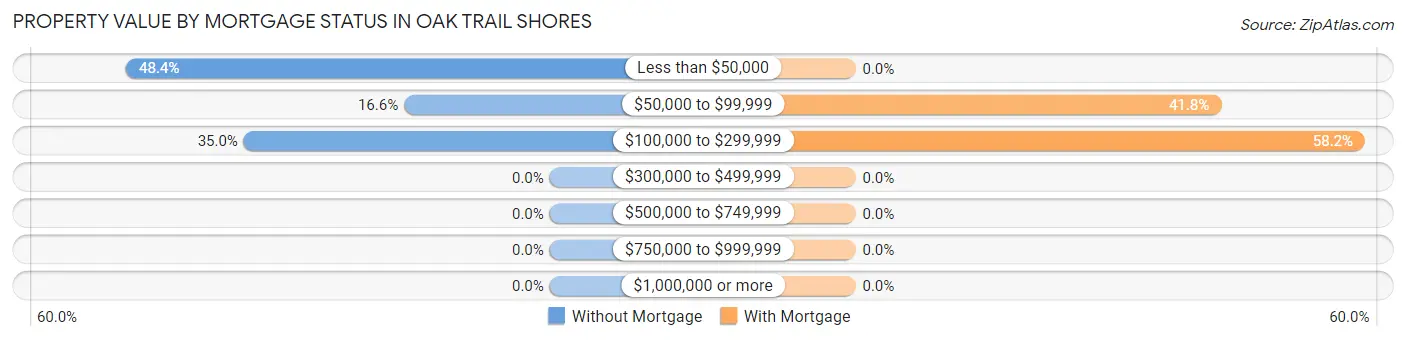
| Property Value | Without Mortgage | With Mortgage |
| Less than $50,000 | 288 (48.4%) | 0 (0.0%) |
| $50,000 to $99,999 | 99 (16.6%) | 280 (41.8%) |
| $100,000 to $299,999 | 208 (35.0%) | 390 (58.2%) |
| $300,000 to $499,999 | 0 (0.0%) | 0 (0.0%) |
| $500,000 to $749,999 | 0 (0.0%) | 0 (0.0%) |
| $750,000 to $999,999 | 0 (0.0%) | 0 (0.0%) |
| $1,000,000 or more | 0 (0.0%) | 0 (0.0%) |
| Total | 595 (100.0%) | 670 (100.0%) |
Household Income by Mortgage Status in Oak Trail Shores
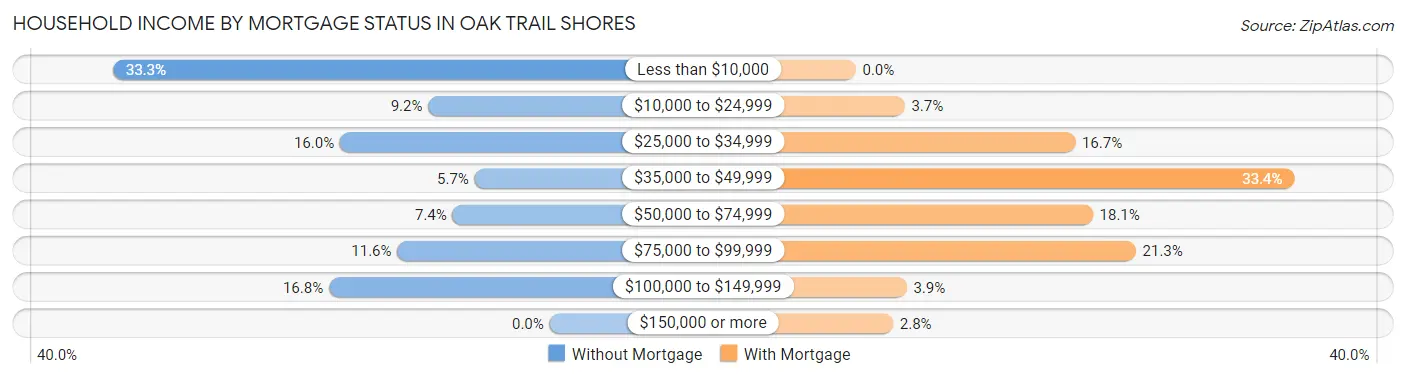
| Household Income | Without Mortgage | With Mortgage |
| Less than $10,000 | 198 (33.3%) | 0 (0.0%) |
| $10,000 to $24,999 | 55 (9.2%) | 25 (3.7%) |
| $25,000 to $34,999 | 95 (16.0%) | 112 (16.7%) |
| $35,000 to $49,999 | 34 (5.7%) | 224 (33.4%) |
| $50,000 to $74,999 | 44 (7.4%) | 121 (18.1%) |
| $75,000 to $99,999 | 69 (11.6%) | 143 (21.3%) |
| $100,000 to $149,999 | 100 (16.8%) | 26 (3.9%) |
| $150,000 or more | 0 (0.0%) | 19 (2.8%) |
| Total | 595 (100.0%) | 670 (100.0%) |
Property Value to Household Income Ratio in Oak Trail Shores
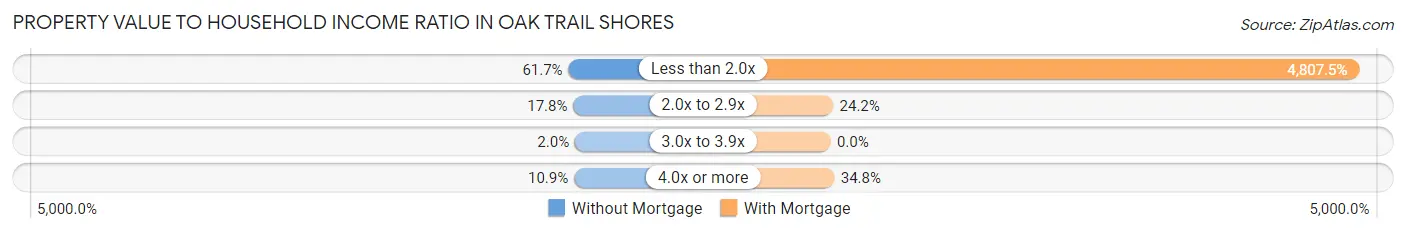
| Value-to-Income Ratio | Without Mortgage | With Mortgage |
| Less than 2.0x | 367 (61.7%) | 32,210 (4,807.5%) |
| 2.0x to 2.9x | 106 (17.8%) | 162 (24.2%) |
| 3.0x to 3.9x | 12 (2.0%) | 0 (0.0%) |
| 4.0x or more | 65 (10.9%) | 233 (34.8%) |
| Total | 595 (100.0%) | 670 (100.0%) |
Real Estate Taxes by Mortgage Status in Oak Trail Shores
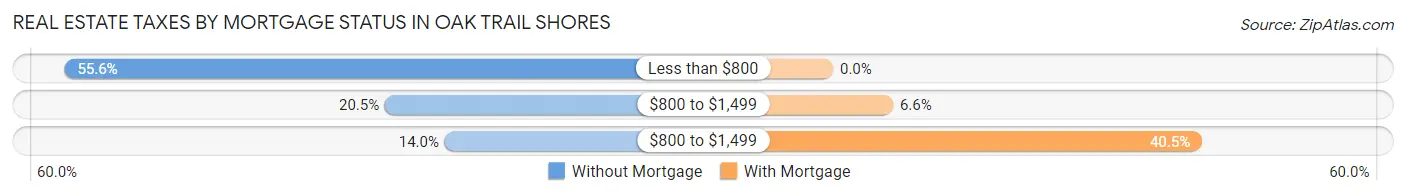
| Property Taxes | Without Mortgage | With Mortgage |
| Less than $800 | 331 (55.6%) | 0 (0.0%) |
| $800 to $1,499 | 122 (20.5%) | 44 (6.6%) |
| $800 to $1,499 | 83 (14.0%) | 271 (40.5%) |
| Total | 595 (100.0%) | 670 (100.0%) |
Health & Disability in Oak Trail Shores
Health Insurance Coverage by Age in Oak Trail Shores
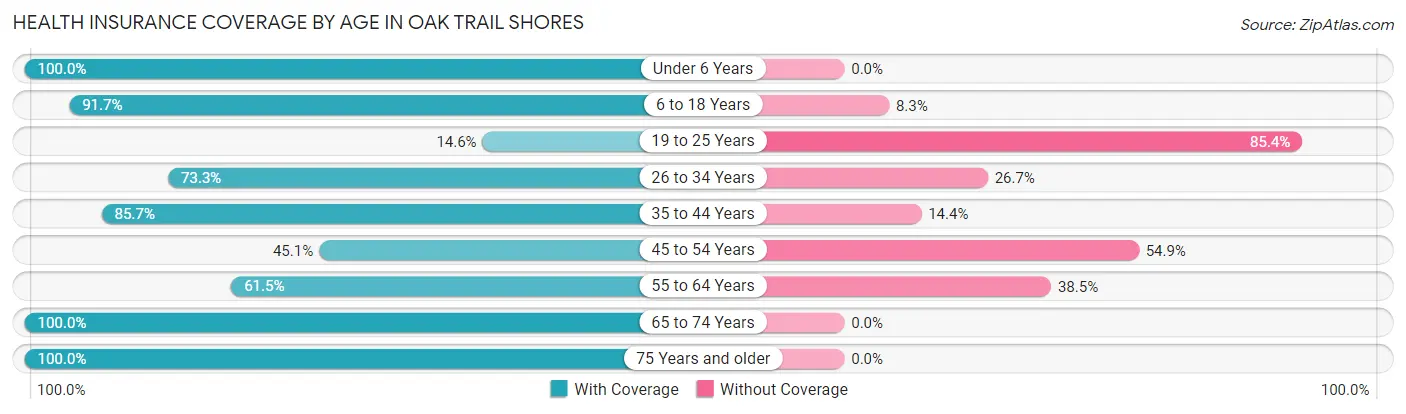
| Age Bracket | With Coverage | Without Coverage |
| Under 6 Years | 70 (100.0%) | 0 (0.0%) |
| 6 to 18 Years | 671 (91.7%) | 61 (8.3%) |
| 19 to 25 Years | 69 (14.6%) | 403 (85.4%) |
| 26 to 34 Years | 252 (73.3%) | 92 (26.7%) |
| 35 to 44 Years | 358 (85.7%) | 60 (14.3%) |
| 45 to 54 Years | 152 (45.1%) | 185 (54.9%) |
| 55 to 64 Years | 295 (61.5%) | 185 (38.5%) |
| 65 to 74 Years | 168 (100.0%) | 0 (0.0%) |
| 75 Years and older | 203 (100.0%) | 0 (0.0%) |
| Total | 2,238 (69.4%) | 986 (30.6%) |
Health Insurance Coverage by Citizenship Status in Oak Trail Shores
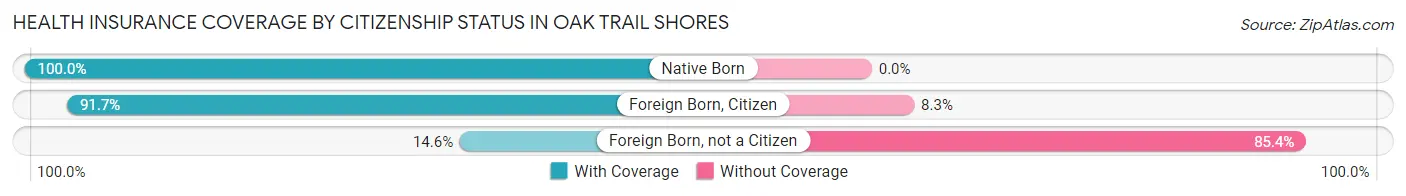
| Citizenship Status | With Coverage | Without Coverage |
| Native Born | 70 (100.0%) | 0 (0.0%) |
| Foreign Born, Citizen | 671 (91.7%) | 61 (8.3%) |
| Foreign Born, not a Citizen | 69 (14.6%) | 403 (85.4%) |
Health Insurance Coverage by Household Income in Oak Trail Shores
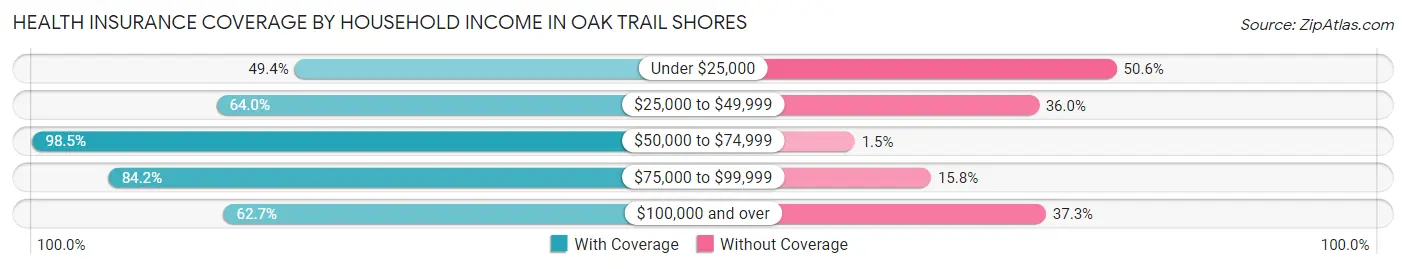
| Household Income | With Coverage | Without Coverage |
| Under $25,000 | 353 (49.4%) | 361 (50.6%) |
| $25,000 to $49,999 | 682 (64.0%) | 383 (36.0%) |
| $50,000 to $74,999 | 663 (98.5%) | 10 (1.5%) |
| $75,000 to $99,999 | 219 (84.2%) | 41 (15.8%) |
| $100,000 and over | 321 (62.7%) | 191 (37.3%) |
Public vs Private Health Insurance Coverage by Age in Oak Trail Shores
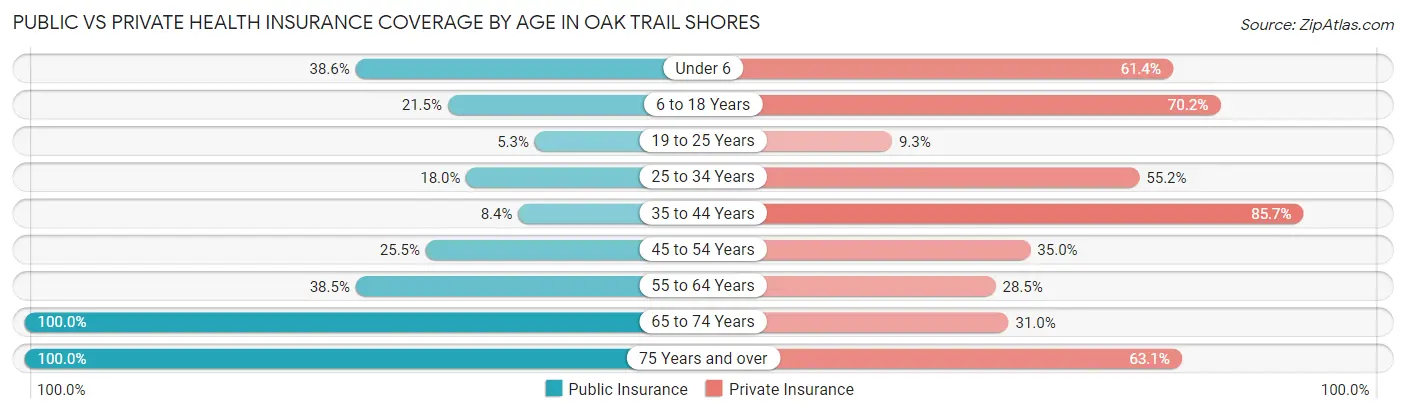
| Age Bracket | Public Insurance | Private Insurance |
| Under 6 | 27 (38.6%) | 43 (61.4%) |
| 6 to 18 Years | 157 (21.4%) | 514 (70.2%) |
| 19 to 25 Years | 25 (5.3%) | 44 (9.3%) |
| 25 to 34 Years | 62 (18.0%) | 190 (55.2%) |
| 35 to 44 Years | 35 (8.4%) | 358 (85.7%) |
| 45 to 54 Years | 86 (25.5%) | 118 (35.0%) |
| 55 to 64 Years | 185 (38.5%) | 137 (28.5%) |
| 65 to 74 Years | 168 (100.0%) | 52 (30.9%) |
| 75 Years and over | 203 (100.0%) | 128 (63.0%) |
| Total | 948 (29.4%) | 1,584 (49.1%) |
Disability Status by Sex by Age in Oak Trail Shores
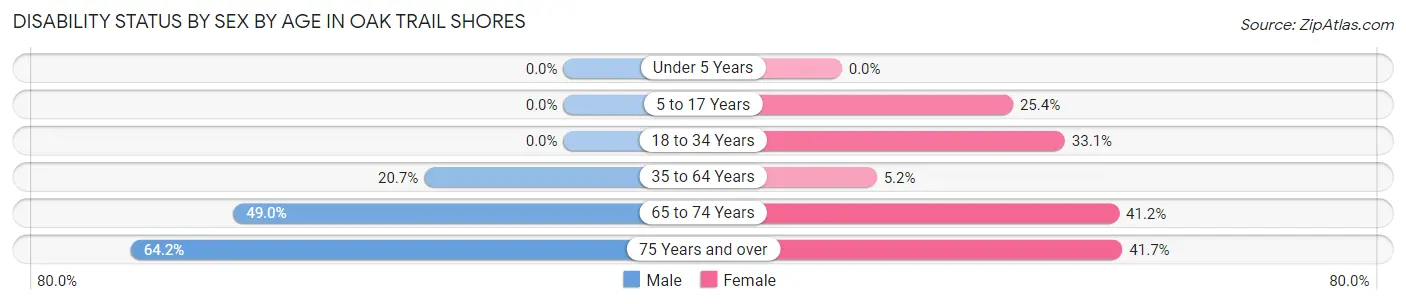
| Age Bracket | Male | Female |
| Under 5 Years | 0 (0.0%) | 0 (0.0%) |
| 5 to 17 Years | 0 (0.0%) | 76 (25.4%) |
| 18 to 34 Years | 0 (0.0%) | 108 (33.1%) |
| 35 to 64 Years | 116 (20.7%) | 35 (5.2%) |
| 65 to 74 Years | 49 (49.0%) | 28 (41.2%) |
| 75 Years and over | 61 (64.2%) | 45 (41.7%) |
Disability Class by Sex by Age in Oak Trail Shores
Disability Class: Hearing Difficulty
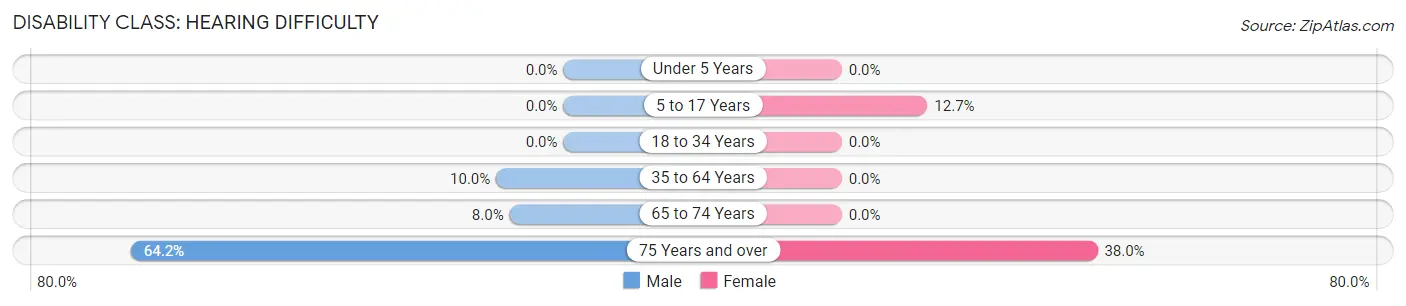
| Age Bracket | Male | Female |
| Under 5 Years | 0 (0.0%) | 0 (0.0%) |
| 5 to 17 Years | 0 (0.0%) | 38 (12.7%) |
| 18 to 34 Years | 0 (0.0%) | 0 (0.0%) |
| 35 to 64 Years | 56 (10.0%) | 0 (0.0%) |
| 65 to 74 Years | 8 (8.0%) | 0 (0.0%) |
| 75 Years and over | 61 (64.2%) | 41 (38.0%) |
Disability Class: Vision Difficulty
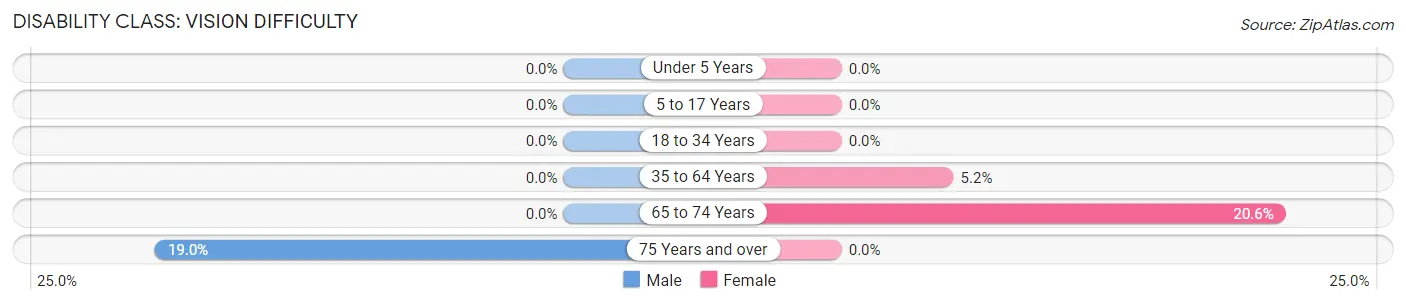
| Age Bracket | Male | Female |
| Under 5 Years | 0 (0.0%) | 0 (0.0%) |
| 5 to 17 Years | 0 (0.0%) | 0 (0.0%) |
| 18 to 34 Years | 0 (0.0%) | 0 (0.0%) |
| 35 to 64 Years | 0 (0.0%) | 35 (5.2%) |
| 65 to 74 Years | 0 (0.0%) | 14 (20.6%) |
| 75 Years and over | 18 (19.0%) | 0 (0.0%) |
Disability Class: Cognitive Difficulty
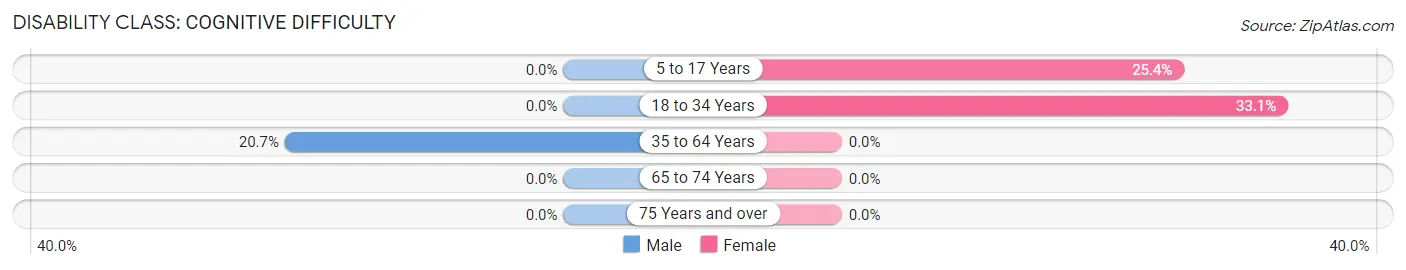
| Age Bracket | Male | Female |
| 5 to 17 Years | 0 (0.0%) | 76 (25.4%) |
| 18 to 34 Years | 0 (0.0%) | 108 (33.1%) |
| 35 to 64 Years | 116 (20.7%) | 0 (0.0%) |
| 65 to 74 Years | 0 (0.0%) | 0 (0.0%) |
| 75 Years and over | 0 (0.0%) | 0 (0.0%) |
Disability Class: Ambulatory Difficulty
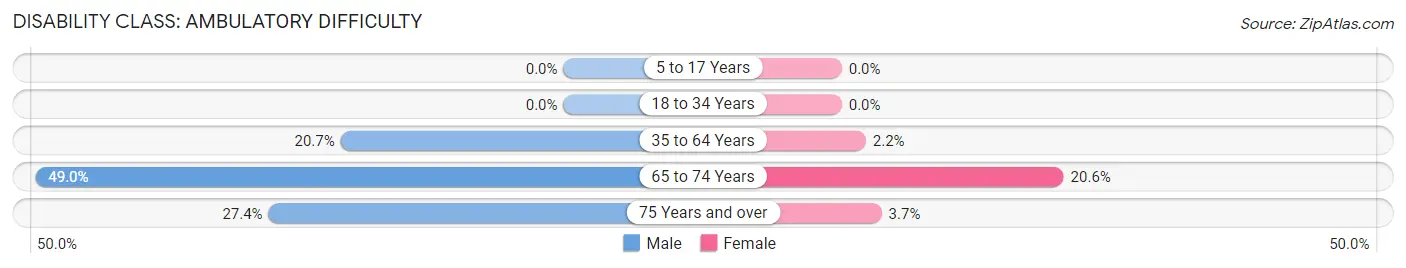
| Age Bracket | Male | Female |
| 5 to 17 Years | 0 (0.0%) | 0 (0.0%) |
| 18 to 34 Years | 0 (0.0%) | 0 (0.0%) |
| 35 to 64 Years | 116 (20.7%) | 15 (2.2%) |
| 65 to 74 Years | 49 (49.0%) | 14 (20.6%) |
| 75 Years and over | 26 (27.4%) | 4 (3.7%) |
Disability Class: Self-Care Difficulty
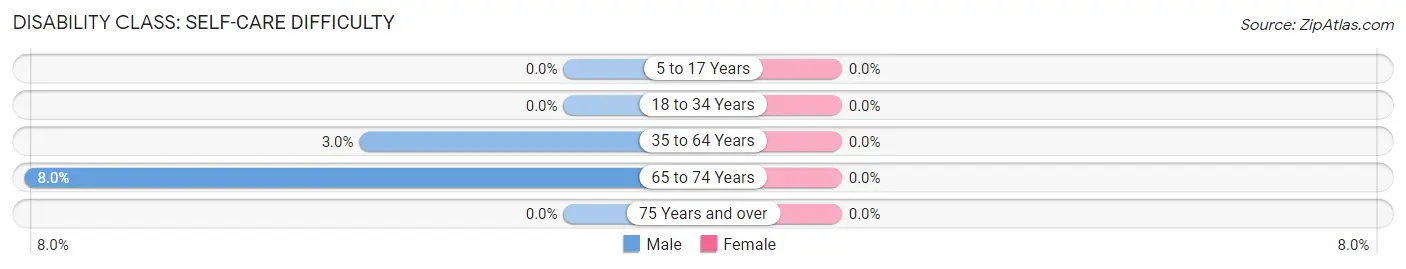
| Age Bracket | Male | Female |
| 5 to 17 Years | 0 (0.0%) | 0 (0.0%) |
| 18 to 34 Years | 0 (0.0%) | 0 (0.0%) |
| 35 to 64 Years | 17 (3.0%) | 0 (0.0%) |
| 65 to 74 Years | 8 (8.0%) | 0 (0.0%) |
| 75 Years and over | 0 (0.0%) | 0 (0.0%) |
Technology Access in Oak Trail Shores
Computing Device Access in Oak Trail Shores
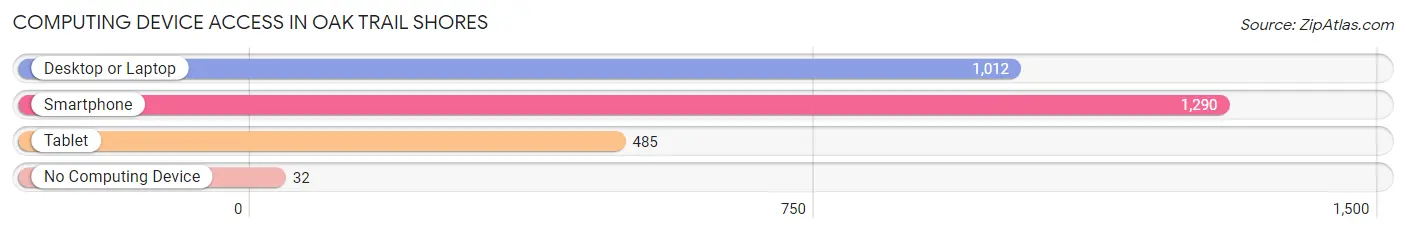
| Device Type | # Households | % Households |
| Desktop or Laptop | 1,012 | 71.5% |
| Smartphone | 1,290 | 91.1% |
| Tablet | 485 | 34.3% |
| No Computing Device | 32 | 2.3% |
| Total | 1,416 | 100.0% |
Internet Access in Oak Trail Shores
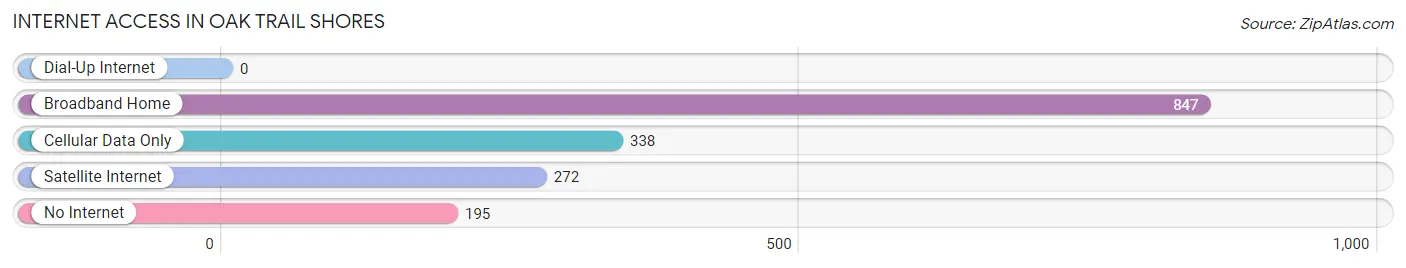
| Internet Type | # Households | % Households |
| Dial-Up Internet | 0 | 0.0% |
| Broadband Home | 847 | 59.8% |
| Cellular Data Only | 338 | 23.9% |
| Satellite Internet | 272 | 19.2% |
| No Internet | 195 | 13.8% |
| Total | 1,416 | 100.0% |
Oak Trail Shores Summary
Oak Trail Shores is a small unincorporated community located in the state of Texas, United States. It is situated in the southeastern part of the state, in the county of Brazoria. The community is located on the western shore of the Gulf of Mexico, approximately 25 miles south of Houston.
History
Oak Trail Shores was first settled in the late 1800s by a group of settlers from the nearby town of Angleton. The settlers were attracted to the area due to its proximity to the Gulf of Mexico and the abundance of fish and wildlife in the area. The settlers built a small fishing village and named it Oak Trail Shores.
The community grew slowly over the years, but remained relatively small until the 1950s when the oil industry began to boom in the area. This led to an influx of people and businesses to the area, and the population of Oak Trail Shores began to grow rapidly.
In the late 1970s, the community was incorporated as a city. This allowed the city to receive state and federal funding for infrastructure and other projects. The city also began to attract more businesses and tourists, and the population continued to grow.
Geography
Oak Trail Shores is located on the western shore of the Gulf of Mexico, approximately 25 miles south of Houston. The community is situated in the southeastern part of the state, in the county of Brazoria. The area is characterized by flat terrain and sandy beaches. The climate is generally warm and humid, with temperatures ranging from the mid-70s in the summer to the mid-50s in the winter.
Economy
The economy of Oak Trail Shores is largely based on tourism and the oil industry. The city is home to several tourist attractions, including a beach, a marina, and a golf course. The city also has a number of restaurants, bars, and shops.
The oil industry is also a major contributor to the economy of Oak Trail Shores. The city is home to several oil refineries and other related businesses.
Demographics
As of the 2010 census, the population of Oak Trail Shores was 2,845. The racial makeup of the city was 79.3% White, 11.2% African American, 0.7% Native American, 0.3% Asian, and 8.5% from other races. The median household income was $45,938, and the median family income was $51,938.
Conclusion
Oak Trail Shores is a small unincorporated community located in the southeastern part of the state of Texas. The community was first settled in the late 1800s and has since grown to become a popular tourist destination and a hub for the oil industry. The population of Oak Trail Shores is largely white, with a median household income of $45,938. The city is home to several tourist attractions, restaurants, bars, and shops, as well as several oil refineries and other related businesses.
Common Questions
What is Per Capita Income in Oak Trail Shores?
Per Capita income in Oak Trail Shores is $20,074.
What is the Median Family Income in Oak Trail Shores?
Median Family Income in Oak Trail Shores is $58,628.
What is the Median Household income in Oak Trail Shores?
Median Household Income in Oak Trail Shores is $31,768.
What is Inequality or Gini Index in Oak Trail Shores?
Inequality or Gini Index in Oak Trail Shores is 0.45.
What is the Total Population of Oak Trail Shores?
Total Population of Oak Trail Shores is 3,224.
What is the Total Male Population of Oak Trail Shores?
Total Male Population of Oak Trail Shores is 1,749.
What is the Total Female Population of Oak Trail Shores?
Total Female Population of Oak Trail Shores is 1,475.
What is the Ratio of Males per 100 Females in Oak Trail Shores?
There are 118.58 Males per 100 Females in Oak Trail Shores.
What is the Ratio of Females per 100 Males in Oak Trail Shores?
There are 84.33 Females per 100 Males in Oak Trail Shores.
What is the Median Population Age in Oak Trail Shores?
Median Population Age in Oak Trail Shores is 33.9 Years.
What is the Average Family Size in Oak Trail Shores
Average Family Size in Oak Trail Shores is 3.3 People.
What is the Average Household Size in Oak Trail Shores
Average Household Size in Oak Trail Shores is 2.3 People.
How Large is the Labor Force in Oak Trail Shores?
There are 1,339 People in the Labor Forcein in Oak Trail Shores.
What is the Percentage of People in the Labor Force in Oak Trail Shores?
54.2% of People are in the Labor Force in Oak Trail Shores.
What is the Unemployment Rate in Oak Trail Shores?
Unemployment Rate in Oak Trail Shores is 3.7%.