Rancho Alegre, TX Map & Demographics
Rancho Alegre Map
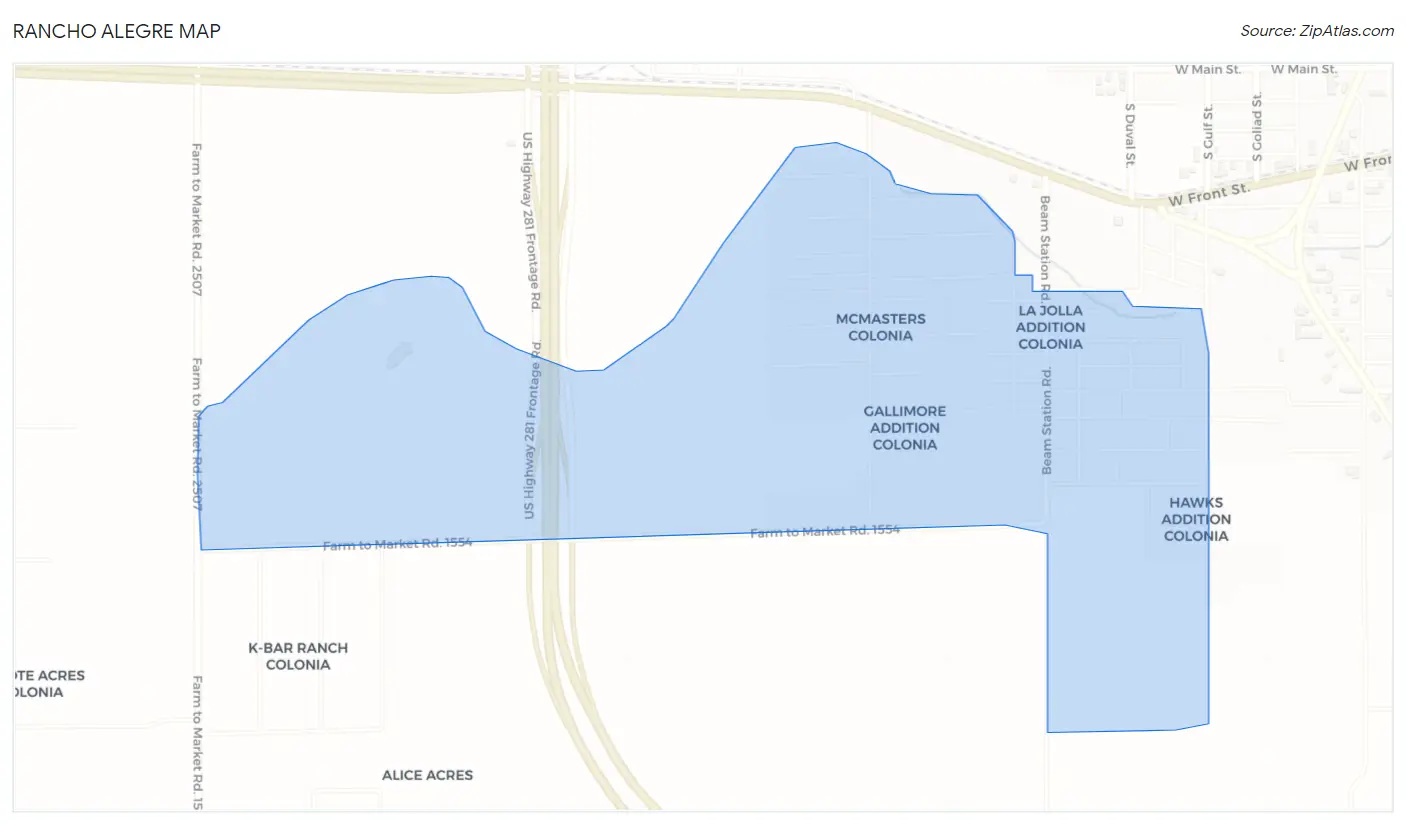
Rancho Alegre Overview
$7,635
PER CAPITA INCOME
$18,289
AVG HOUSEHOLD INCOME
46.9%
WAGE / INCOME GAP [ % ]
53.1¢/ $1
WAGE / INCOME GAP [ $ ]
0.46
INEQUALITY / GINI INDEX
1,099
TOTAL POPULATION
577
MALE POPULATION
522
FEMALE POPULATION
110.54
MALES / 100 FEMALES
90.47
FEMALES / 100 MALES
29.4
MEDIAN AGE
4.9
AVG FAMILY SIZE
3.7
AVG HOUSEHOLD SIZE
264
LABOR FORCE [ PEOPLE ]
31.6%
PERCENT IN LABOR FORCE
Income in Rancho Alegre
Income Overview in Rancho Alegre
| Characteristic | Number | Measure |
| Per Capita Income | 1,099 | $7,635 |
| Median Family Income | 200 | $0 |
| Mean Family Income | 200 | $36,030 |
| Median Household Income | 298 | $18,289 |
| Mean Household Income | 298 | $28,010 |
| Income Deficit | 200 | $0 |
| Wage / Income Gap (%) | 1,099 | 46.88% |
| Wage / Income Gap ($) | 1,099 | 53.12¢ per $1 |
| Gini / Inequality Index | 1,099 | 0.46 |
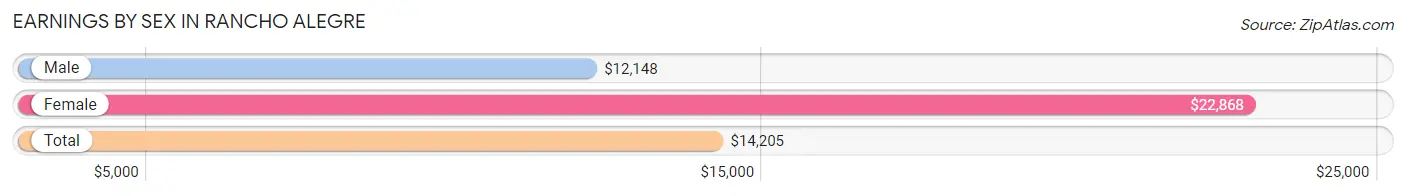
Earnings by Sex in Rancho Alegre
Average Earnings in Rancho Alegre are $14,205, $12,148 for men and $22,868 for women, a difference of 46.9%.
| Sex | Number | Average Earnings |
| Male | 101 (38.3%) | $12,148 |
| Female | 163 (61.7%) | $22,868 |
| Total | 264 (100.0%) | $14,205 |
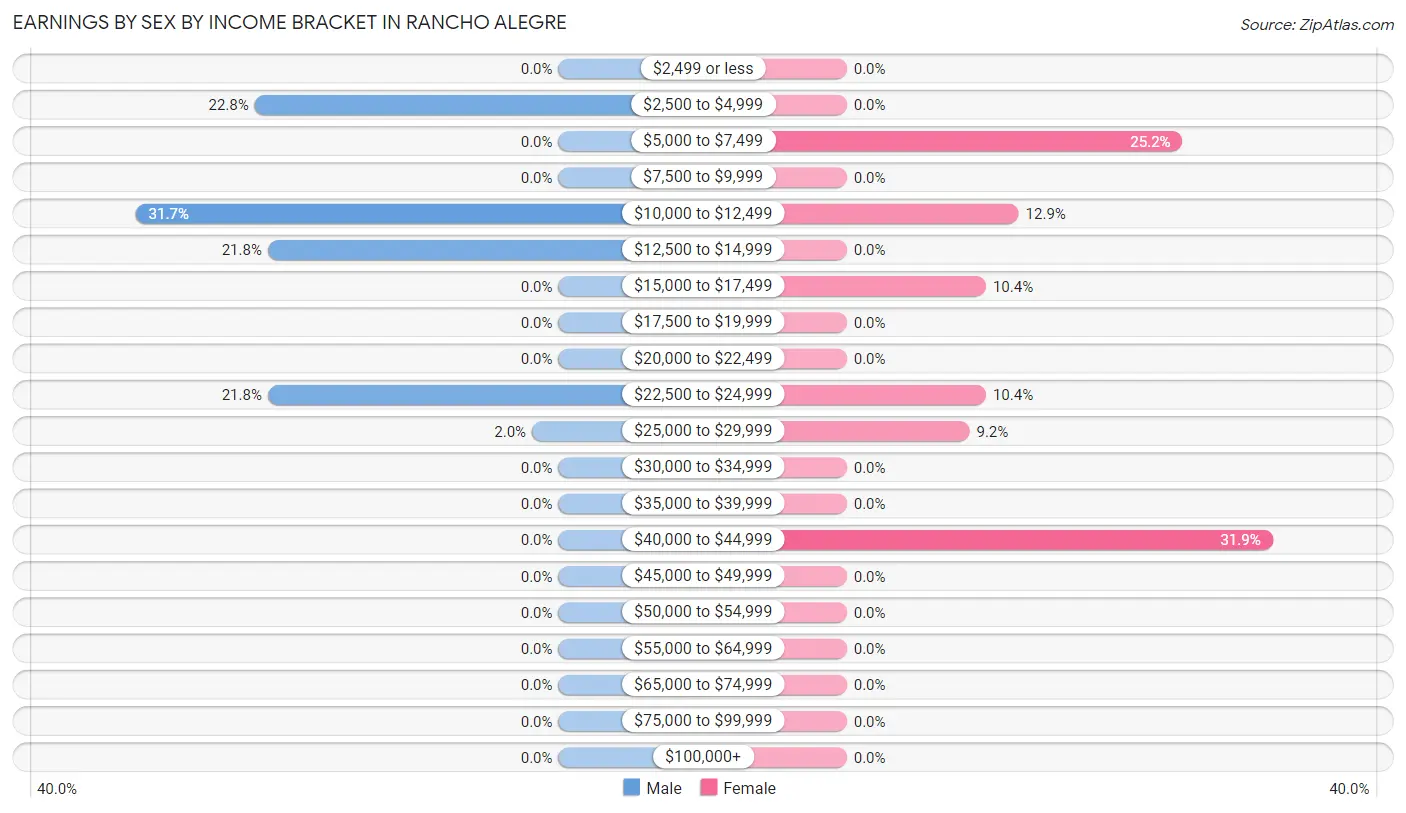
Earnings by Sex by Income Bracket in Rancho Alegre
The most common earnings brackets in Rancho Alegre are $10,000 to $12,499 for men (32 | 31.7%) and $40,000 to $44,999 for women (52 | 31.9%).
| Income | Male | Female |
| $2,499 or less | 0 (0.0%) | 0 (0.0%) |
| $2,500 to $4,999 | 23 (22.8%) | 0 (0.0%) |
| $5,000 to $7,499 | 0 (0.0%) | 41 (25.2%) |
| $7,500 to $9,999 | 0 (0.0%) | 0 (0.0%) |
| $10,000 to $12,499 | 32 (31.7%) | 21 (12.9%) |
| $12,500 to $14,999 | 22 (21.8%) | 0 (0.0%) |
| $15,000 to $17,499 | 0 (0.0%) | 17 (10.4%) |
| $17,500 to $19,999 | 0 (0.0%) | 0 (0.0%) |
| $20,000 to $22,499 | 0 (0.0%) | 0 (0.0%) |
| $22,500 to $24,999 | 22 (21.8%) | 17 (10.4%) |
| $25,000 to $29,999 | 2 (2.0%) | 15 (9.2%) |
| $30,000 to $34,999 | 0 (0.0%) | 0 (0.0%) |
| $35,000 to $39,999 | 0 (0.0%) | 0 (0.0%) |
| $40,000 to $44,999 | 0 (0.0%) | 52 (31.9%) |
| $45,000 to $49,999 | 0 (0.0%) | 0 (0.0%) |
| $50,000 to $54,999 | 0 (0.0%) | 0 (0.0%) |
| $55,000 to $64,999 | 0 (0.0%) | 0 (0.0%) |
| $65,000 to $74,999 | 0 (0.0%) | 0 (0.0%) |
| $75,000 to $99,999 | 0 (0.0%) | 0 (0.0%) |
| $100,000+ | 0 (0.0%) | 0 (0.0%) |
| Total | 101 (100.0%) | 163 (100.0%) |
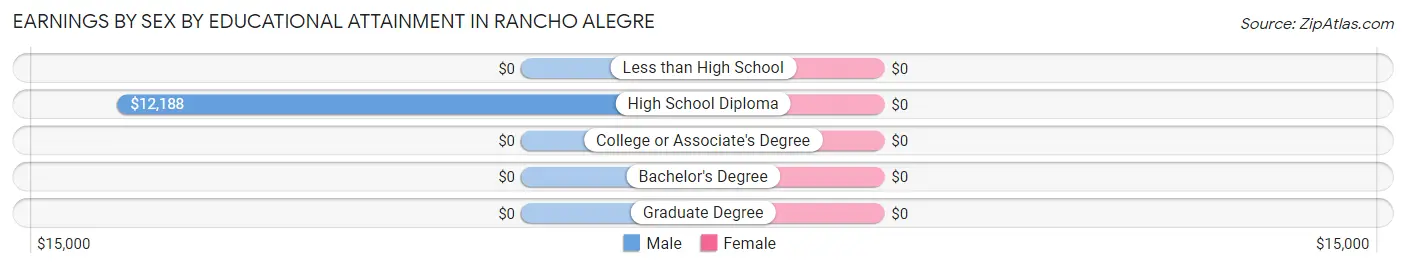
Earnings by Sex by Educational Attainment in Rancho Alegre
| Educational Attainment | Male Income | Female Income |
| Less than High School | - | - |
| High School Diploma | $12,188 | $0 |
| College or Associate's Degree | - | - |
| Bachelor's Degree | - | - |
| Graduate Degree | - | - |
| Total | $13,295 | $22,868 |
Family Income in Rancho Alegre
Family Income Brackets in Rancho Alegre
According to the Rancho Alegre family income data, there are 54 families falling into the $50,000 to $74,999 income range, which is the most common income bracket and makes up 27.0% of all families.
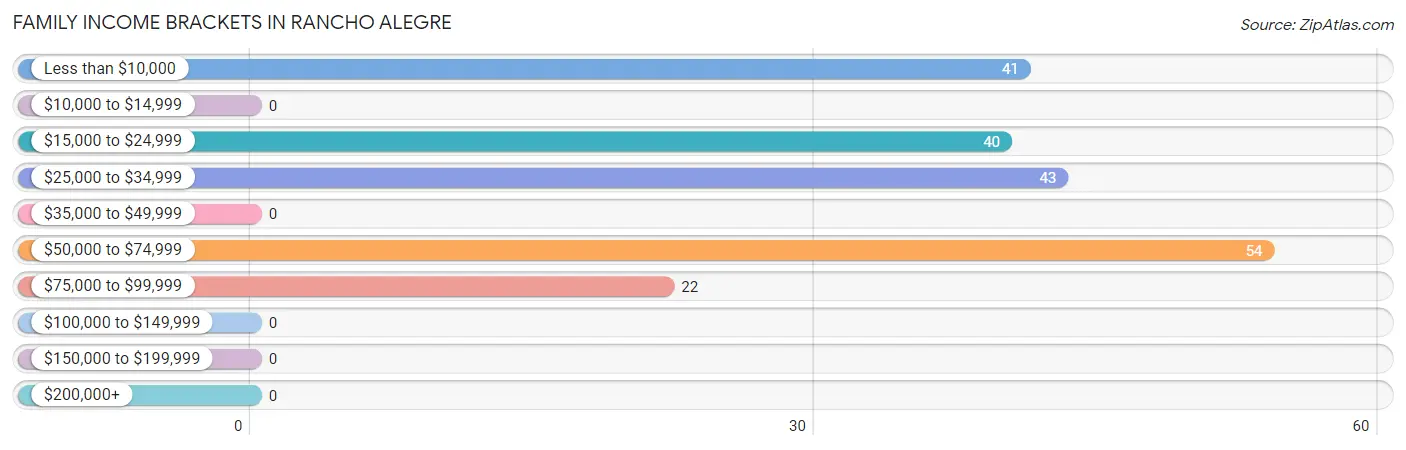
| Income Bracket | # Families | % Families |
| Less than $10,000 | 41 | 20.5% |
| $10,000 to $14,999 | 0 | 0.0% |
| $15,000 to $24,999 | 40 | 20.0% |
| $25,000 to $34,999 | 43 | 21.5% |
| $35,000 to $49,999 | 0 | 0.0% |
| $50,000 to $74,999 | 54 | 27.0% |
| $75,000 to $99,999 | 22 | 11.0% |
| $100,000 to $149,999 | 0 | 0.0% |
| $150,000 to $199,999 | 0 | 0.0% |
| $200,000+ | 0 | 0.0% |
Family Income by Famaliy Size in Rancho Alegre
2-person families (64 | 32.0%) account for the highest median family income in Rancho Alegre with $17,000 per family, while 2-person families (64 | 32.0%) have the highest median income of $8,500 per family member.
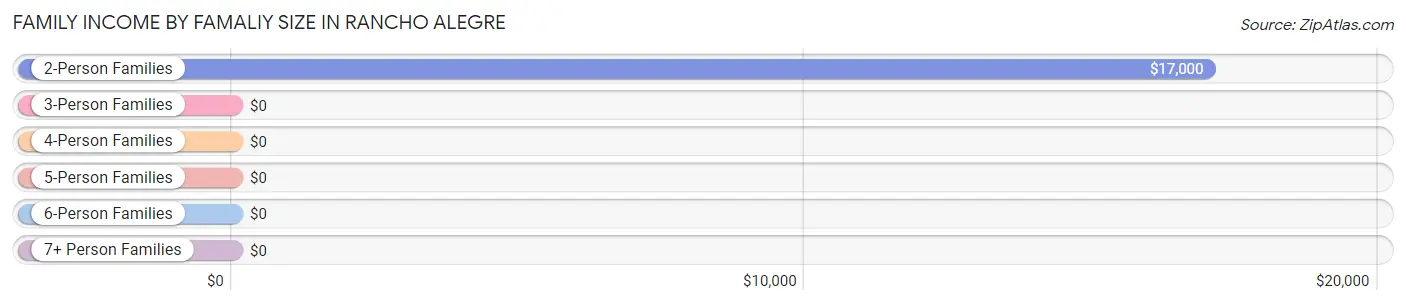
| Income Bracket | # Families | Median Income |
| 2-Person Families | 64 (32.0%) | $17,000 |
| 3-Person Families | 22 (11.0%) | $0 |
| 4-Person Families | 41 (20.5%) | $0 |
| 5-Person Families | 73 (36.5%) | $0 |
| 6-Person Families | 0 (0.0%) | $0 |
| 7+ Person Families | 0 (0.0%) | $0 |
| Total | 200 (100.0%) | $0 |
Family Income by Number of Earners in Rancho Alegre
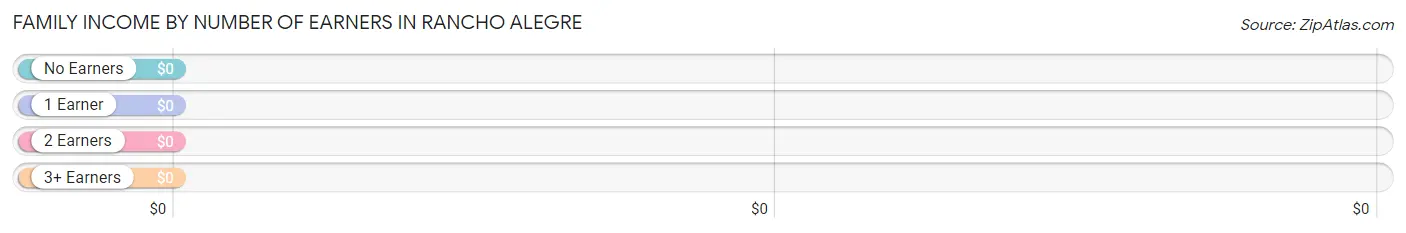
| Number of Earners | # Families | Median Income |
| No Earners | 40 (20.0%) | $0 |
| 1 Earner | 93 (46.5%) | $0 |
| 2 Earners | 46 (23.0%) | $0 |
| 3+ Earners | 21 (10.5%) | $0 |
| Total | 200 (100.0%) | $0 |
Household Income in Rancho Alegre
Household Income Brackets in Rancho Alegre
With 103 households falling in the category, the less than $10,000 income range is the most frequent in Rancho Alegre, accounting for 34.6% of all households.
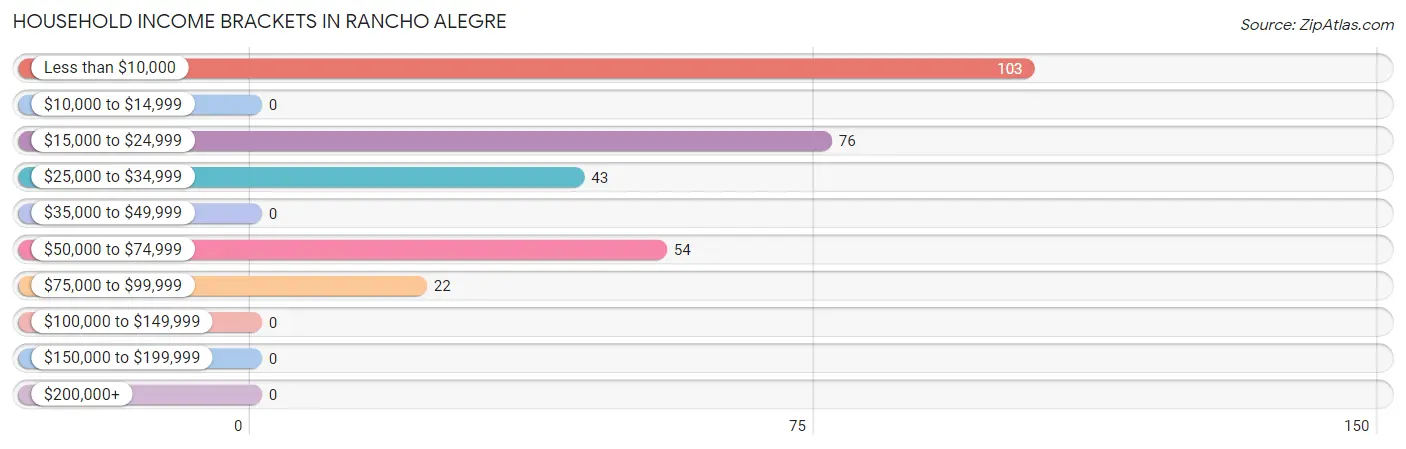
| Income Bracket | # Households | % Households |
| Less than $10,000 | 103 | 34.6% |
| $10,000 to $14,999 | 0 | 0.0% |
| $15,000 to $24,999 | 76 | 25.5% |
| $25,000 to $34,999 | 43 | 14.4% |
| $35,000 to $49,999 | 0 | 0.0% |
| $50,000 to $74,999 | 54 | 18.1% |
| $75,000 to $99,999 | 22 | 7.4% |
| $100,000 to $149,999 | 0 | 0.0% |
| $150,000 to $199,999 | 0 | 0.0% |
| $200,000+ | 0 | 0.0% |
Household Income by Householder Age in Rancho Alegre
| Income Bracket | # Households | Median Income |
| 15 to 24 Years | 0 (0.0%) | $0 |
| 25 to 44 Years | 21 (7.0%) | $0 |
| 45 to 64 Years | 151 (50.7%) | $0 |
| 65+ Years | 126 (42.3%) | $0 |
| Total | 298 (100.0%) | $18,289 |
Poverty in Rancho Alegre
Income Below Poverty by Sex and Age in Rancho Alegre
With 67.1% poverty level for males and 44.6% for females among the residents of Rancho Alegre, under 5 year old males and 12 to 14 year old females are the most vulnerable to poverty, with 79 males (100.0%) and 25 females (100.0%) in their respective age groups living below the poverty level.
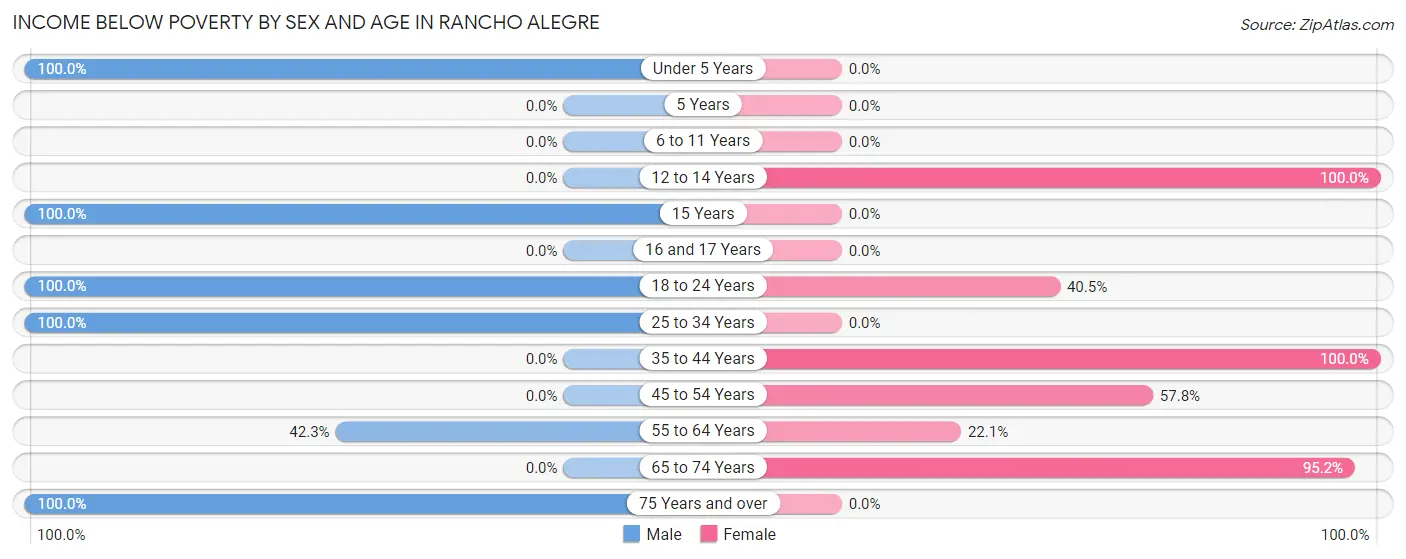
| Age Bracket | Male | Female |
| Under 5 Years | 79 (100.0%) | 0 (0.0%) |
| 5 Years | 0 (0.0%) | 0 (0.0%) |
| 6 to 11 Years | 0 (0.0%) | 0 (0.0%) |
| 12 to 14 Years | 0 (0.0%) | 25 (100.0%) |
| 15 Years | 26 (100.0%) | 0 (0.0%) |
| 16 and 17 Years | 0 (0.0%) | 0 (0.0%) |
| 18 to 24 Years | 23 (100.0%) | 81 (40.5%) |
| 25 to 34 Years | 153 (100.0%) | 0 (0.0%) |
| 35 to 44 Years | 0 (0.0%) | 21 (100.0%) |
| 45 to 54 Years | 0 (0.0%) | 41 (57.8%) |
| 55 to 64 Years | 44 (42.3%) | 25 (22.1%) |
| 65 to 74 Years | 0 (0.0%) | 40 (95.2%) |
| 75 Years and over | 62 (100.0%) | 0 (0.0%) |
| Total | 387 (67.1%) | 233 (44.6%) |
Income Above Poverty by Sex and Age in Rancho Alegre
According to the poverty statistics in Rancho Alegre, males aged 6 to 11 years and females aged under 5 years are the age groups that are most secure financially, with 100.0% of males and 100.0% of females in these age groups living above the poverty line.
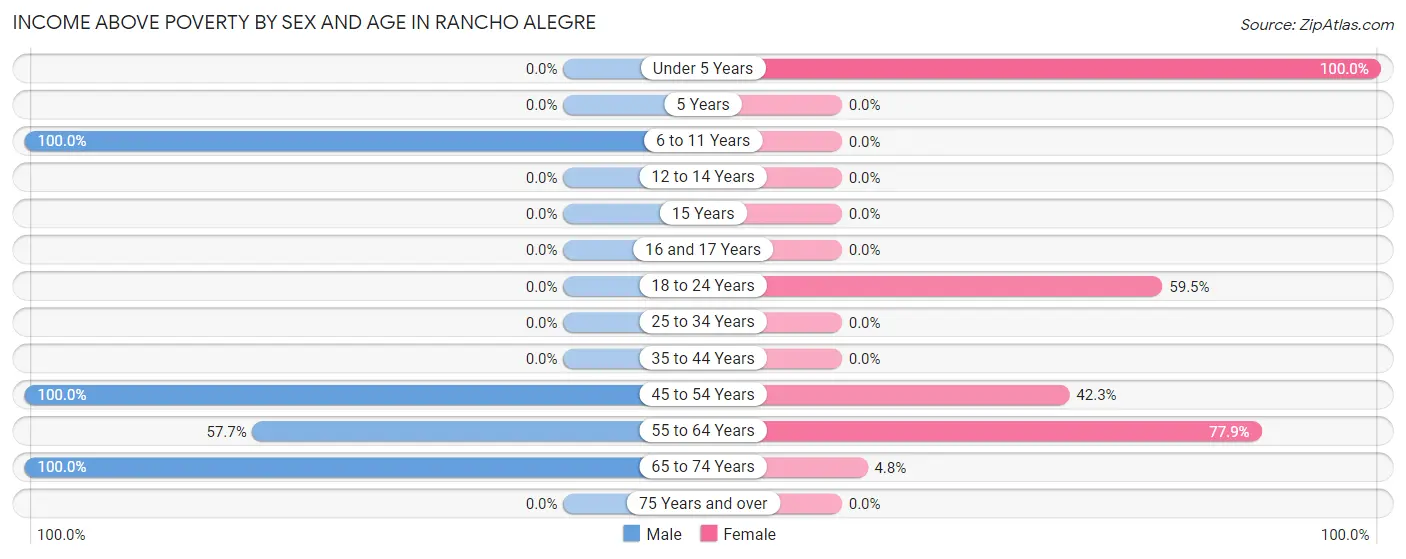
| Age Bracket | Male | Female |
| Under 5 Years | 0 (0.0%) | 50 (100.0%) |
| 5 Years | 0 (0.0%) | 0 (0.0%) |
| 6 to 11 Years | 84 (100.0%) | 0 (0.0%) |
| 12 to 14 Years | 0 (0.0%) | 0 (0.0%) |
| 15 Years | 0 (0.0%) | 0 (0.0%) |
| 16 and 17 Years | 0 (0.0%) | 0 (0.0%) |
| 18 to 24 Years | 0 (0.0%) | 119 (59.5%) |
| 25 to 34 Years | 0 (0.0%) | 0 (0.0%) |
| 35 to 44 Years | 0 (0.0%) | 0 (0.0%) |
| 45 to 54 Years | 22 (100.0%) | 30 (42.2%) |
| 55 to 64 Years | 60 (57.7%) | 88 (77.9%) |
| 65 to 74 Years | 24 (100.0%) | 2 (4.8%) |
| 75 Years and over | 0 (0.0%) | 0 (0.0%) |
| Total | 190 (32.9%) | 289 (55.4%) |
Income Below Poverty Among Married-Couple Families in Rancho Alegre
The poverty statistics for married-couple families in Rancho Alegre show that 38.4% or 61 of the total 159 families live below the poverty line. Families with no children have the highest poverty rate of 46.5%, comprising of 40 families. On the other hand, families with 1 or 2 children have the lowest poverty rate of 28.8%, which includes 21 families.
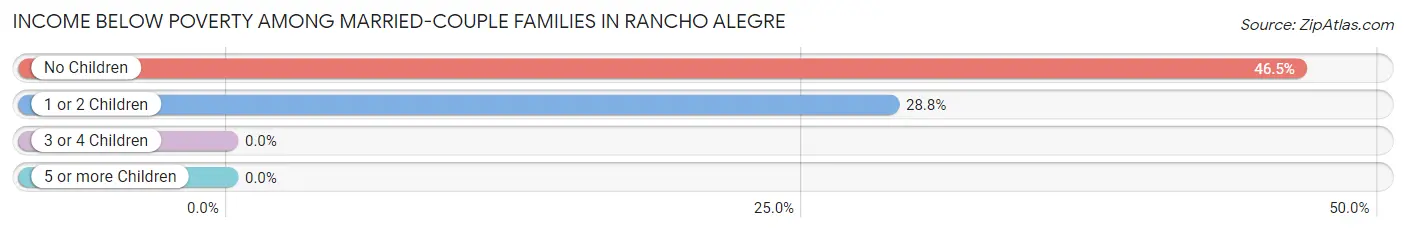
| Children | Above Poverty | Below Poverty |
| No Children | 46 (53.5%) | 40 (46.5%) |
| 1 or 2 Children | 52 (71.2%) | 21 (28.8%) |
| 3 or 4 Children | 0 (0.0%) | 0 (0.0%) |
| 5 or more Children | 0 (0.0%) | 0 (0.0%) |
| Total | 98 (61.6%) | 61 (38.4%) |
Income Below Poverty Among Single-Parent Households in Rancho Alegre
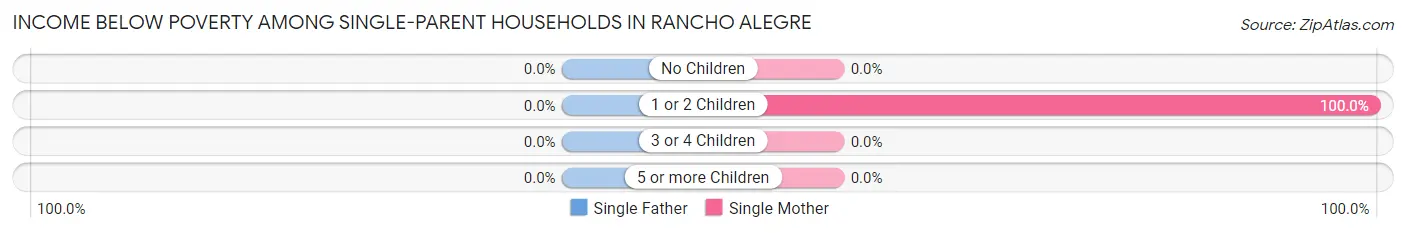
| Children | Single Father | Single Mother |
| No Children | 0 (0.0%) | 0 (0.0%) |
| 1 or 2 Children | 0 (0.0%) | 41 (100.0%) |
| 3 or 4 Children | 0 (0.0%) | 0 (0.0%) |
| 5 or more Children | 0 (0.0%) | 0 (0.0%) |
| Total | 0 (0.0%) | 41 (100.0%) |
Income Below Poverty Among Married-Couple vs Single-Parent Households in Rancho Alegre
The poverty data for Rancho Alegre shows that 61 of the married-couple family households (38.4%) and 41 of the single-parent households (100.0%) are living below the poverty level. Within the married-couple family households, those with no children have the highest poverty rate, with 40 households (46.5%) falling below the poverty line. Among the single-parent households, those with 1 or 2 children have the highest poverty rate, with 41 household (100.0%) living below poverty.
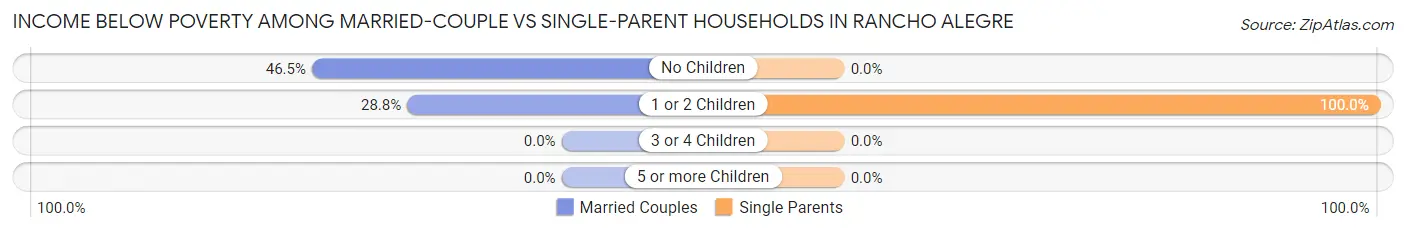
| Children | Married-Couple Families | Single-Parent Households |
| No Children | 40 (46.5%) | 0 (0.0%) |
| 1 or 2 Children | 21 (28.8%) | 41 (100.0%) |
| 3 or 4 Children | 0 (0.0%) | 0 (0.0%) |
| 5 or more Children | 0 (0.0%) | 0 (0.0%) |
| Total | 61 (38.4%) | 41 (100.0%) |
Race in Rancho Alegre
The most populous races in Rancho Alegre are Hispanic or Latino (1,099 | 100.0%), White / Caucasian (935 | 85.1%), and Some other Race (83 | 7.5%).
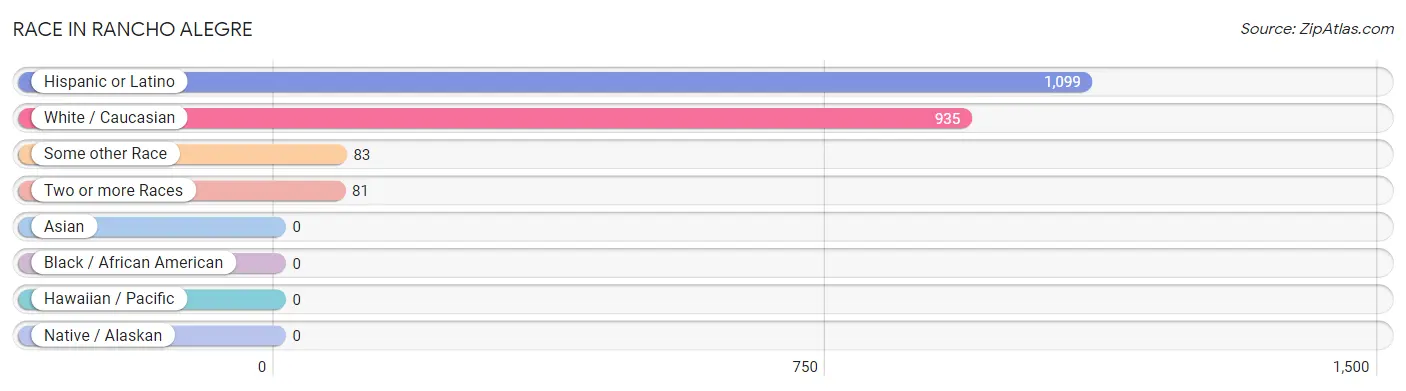
| Race | # Population | % Population |
| Asian | 0 | 0.0% |
| Black / African American | 0 | 0.0% |
| Hawaiian / Pacific | 0 | 0.0% |
| Hispanic or Latino | 1,099 | 100.0% |
| Native / Alaskan | 0 | 0.0% |
| White / Caucasian | 935 | 85.1% |
| Two or more Races | 81 | 7.4% |
| Some other Race | 83 | 7.5% |
| Total | 1,099 | 100.0% |
Ancestry in Rancho Alegre
The most populous ancestries reported in Rancho Alegre are Mexican (976 | 88.8%), and Spanish (17 | 1.5%), together accounting for 90.4% of all Rancho Alegre residents.
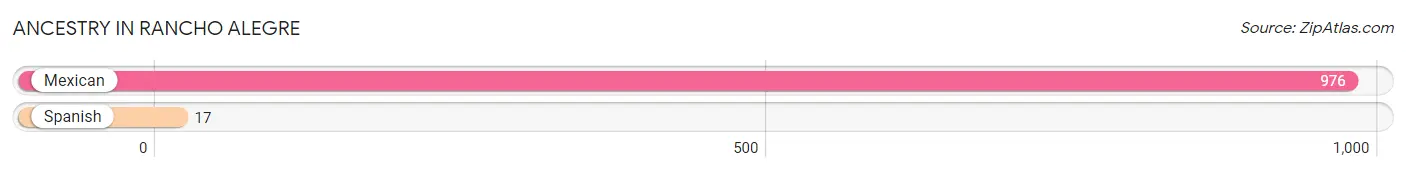
| Ancestry | # Population | % Population |
| Mexican | 976 | 88.8% |
| Spanish | 17 | 1.5% | View All 2 Rows |
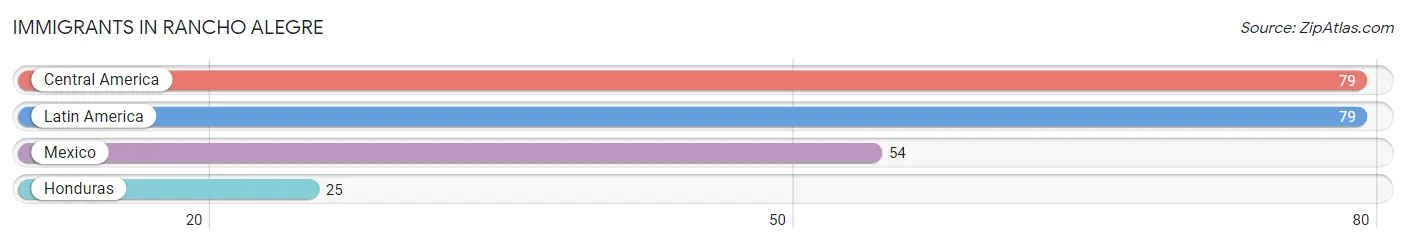
Immigrants in Rancho Alegre
The most numerous immigrant groups reported in Rancho Alegre came from Central America (79 | 7.2%), Latin America (79 | 7.2%), Mexico (54 | 4.9%), and Honduras (25 | 2.3%), together accounting for 21.6% of all Rancho Alegre residents.
| Immigration Origin | # Population | % Population |
| Central America | 79 | 7.2% |
| Honduras | 25 | 2.3% |
| Latin America | 79 | 7.2% |
| Mexico | 54 | 4.9% | View All 4 Rows |
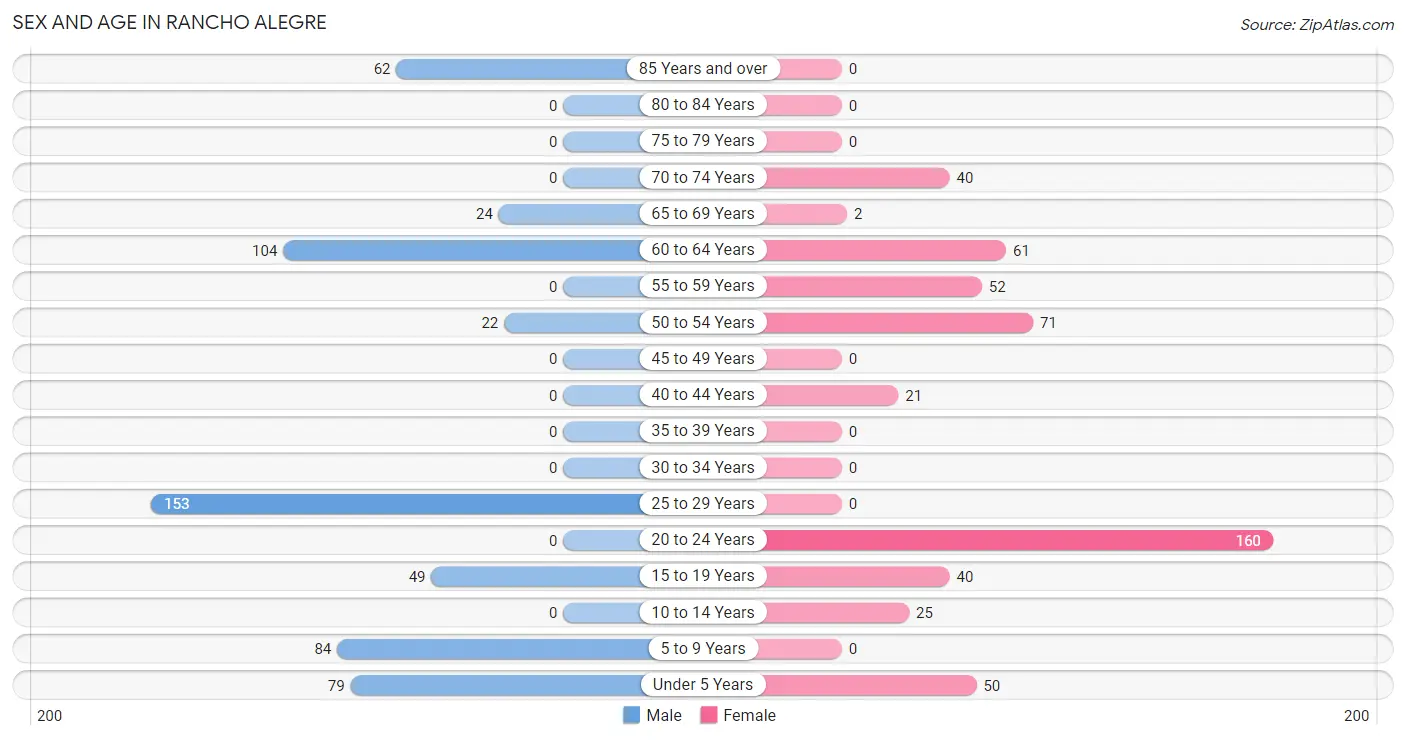
Sex and Age in Rancho Alegre
Sex and Age in Rancho Alegre
The most populous age groups in Rancho Alegre are 25 to 29 Years (153 | 26.5%) for men and 20 to 24 Years (160 | 30.6%) for women.
| Age Bracket | Male | Female |
| Under 5 Years | 79 (13.7%) | 50 (9.6%) |
| 5 to 9 Years | 84 (14.6%) | 0 (0.0%) |
| 10 to 14 Years | 0 (0.0%) | 25 (4.8%) |
| 15 to 19 Years | 49 (8.5%) | 40 (7.7%) |
| 20 to 24 Years | 0 (0.0%) | 160 (30.6%) |
| 25 to 29 Years | 153 (26.5%) | 0 (0.0%) |
| 30 to 34 Years | 0 (0.0%) | 0 (0.0%) |
| 35 to 39 Years | 0 (0.0%) | 0 (0.0%) |
| 40 to 44 Years | 0 (0.0%) | 21 (4.0%) |
| 45 to 49 Years | 0 (0.0%) | 0 (0.0%) |
| 50 to 54 Years | 22 (3.8%) | 71 (13.6%) |
| 55 to 59 Years | 0 (0.0%) | 52 (10.0%) |
| 60 to 64 Years | 104 (18.0%) | 61 (11.7%) |
| 65 to 69 Years | 24 (4.2%) | 2 (0.4%) |
| 70 to 74 Years | 0 (0.0%) | 40 (7.7%) |
| 75 to 79 Years | 0 (0.0%) | 0 (0.0%) |
| 80 to 84 Years | 0 (0.0%) | 0 (0.0%) |
| 85 Years and over | 62 (10.7%) | 0 (0.0%) |
| Total | 577 (100.0%) | 522 (100.0%) |
Families and Households in Rancho Alegre
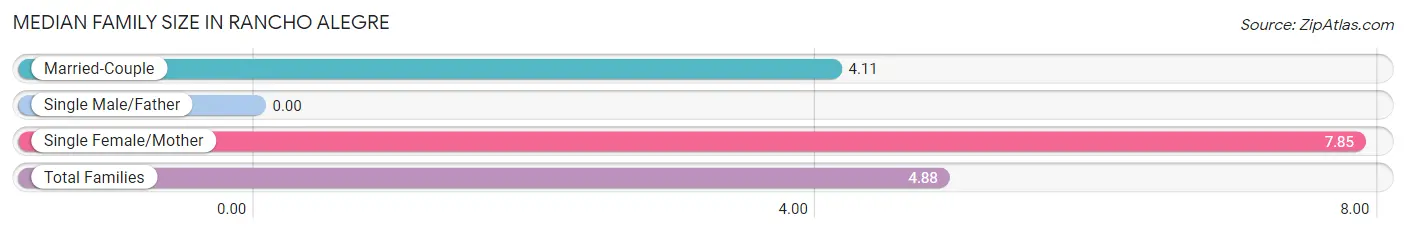
Median Family Size in Rancho Alegre
| Family Type | # Families | Family Size |
| Married-Couple | 159 (79.5%) | 4.11 |
| Single Male/Father | 0 (0.0%) | - |
| Single Female/Mother | 41 (20.5%) | 7.85 |
| Total Families | 200 (100.0%) | 4.88 |
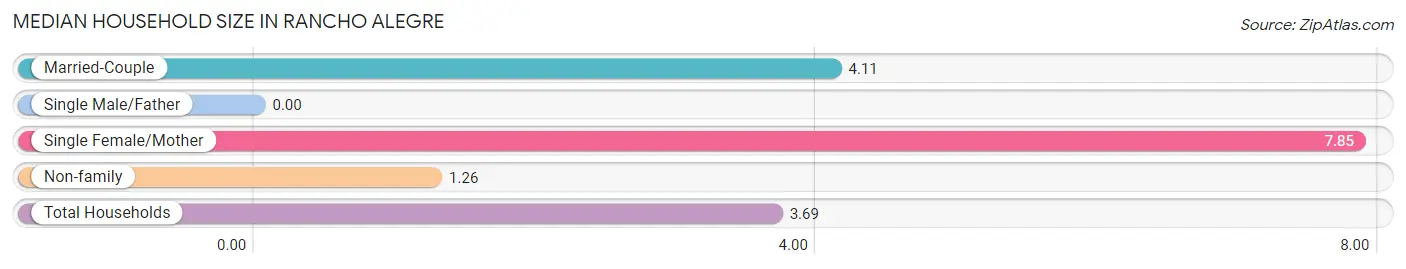
Median Household Size in Rancho Alegre
| Household Type | # Households | Household Size |
| Married-Couple | 159 (53.4%) | 4.11 |
| Single Male/Father | 0 (0.0%) | - |
| Single Female/Mother | 41 (13.8%) | 7.85 |
| Non-family | 98 (32.9%) | 1.26 |
| Total Households | 298 (100.0%) | 3.69 |
Household Size by Marriage Status in Rancho Alegre
Out of a total of 298 households in Rancho Alegre, 200 (67.1%) are family households, while 98 (32.9%) are nonfamily households. The most numerous type of family households are 5-person households, comprising 73, and the most common type of nonfamily households are 1-person households, comprising 79.
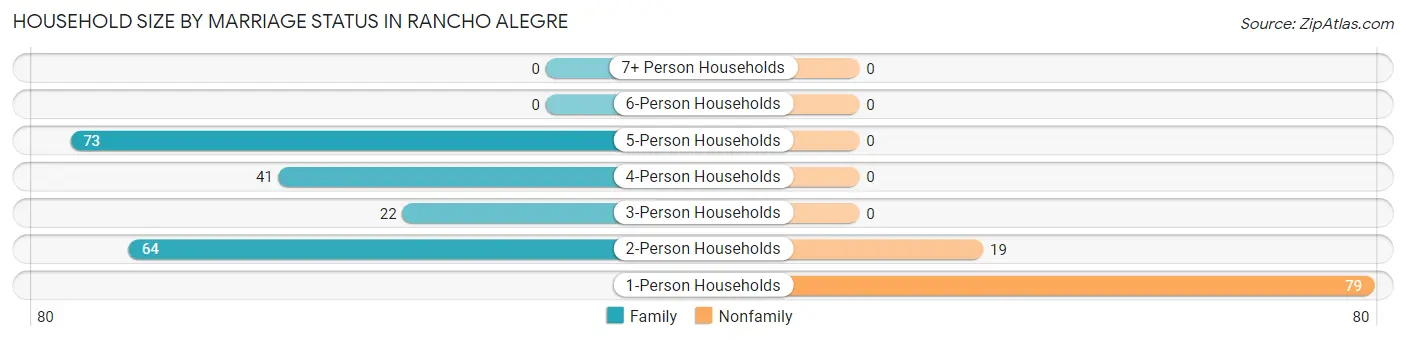
| Household Size | Family Households | Nonfamily Households |
| 1-Person Households | - | 79 (26.5%) |
| 2-Person Households | 64 (21.5%) | 19 (6.4%) |
| 3-Person Households | 22 (7.4%) | 0 (0.0%) |
| 4-Person Households | 41 (13.8%) | 0 (0.0%) |
| 5-Person Households | 73 (24.5%) | 0 (0.0%) |
| 6-Person Households | 0 (0.0%) | 0 (0.0%) |
| 7+ Person Households | 0 (0.0%) | 0 (0.0%) |
| Total | 200 (67.1%) | 98 (32.9%) |
Female Fertility in Rancho Alegre
Fertility by Age in Rancho Alegre
| Age Bracket | Women with Births | Births / 1,000 Women |
| 15 to 19 years | 0 (0.0%) | 0.0 |
| 20 to 34 years | 0 (0.0%) | 0.0 |
| 35 to 50 years | 0 (0.0%) | 0.0 |
| Total | 0 (0.0%) | 0.0 |
Fertility by Age by Marriage Status in Rancho Alegre
| Age Bracket | Married | Unmarried |
| 15 to 19 years | 0 (0.0%) | 0 (0.0%) |
| 20 to 34 years | 0 (0.0%) | 0 (0.0%) |
| 35 to 50 years | 0 (0.0%) | 0 (0.0%) |
| Total | 0 (0.0%) | 0 (0.0%) |
Fertility by Education in Rancho Alegre
| Educational Attainment | Women with Births | Births / 1,000 Women |
| Less than High School | 0 (0.0%) | 0.0 |
| High School Diploma | 0 (0.0%) | 0.0 |
| College or Associate's Degree | 0 (0.0%) | 0.0 |
| Bachelor's Degree | 0 (0.0%) | 0.0 |
| Graduate Degree | 0 (0.0%) | 0.0 |
| Total | 0 (0.0%) | 0.0 |
Fertility by Education by Marriage Status in Rancho Alegre
| Educational Attainment | Married | Unmarried |
| Less than High School | 0 (0.0%) | 0 (0.0%) |
| High School Diploma | 0 (0.0%) | 0 (0.0%) |
| College or Associate's Degree | 0 (0.0%) | 0 (0.0%) |
| Bachelor's Degree | 0 (0.0%) | 0 (0.0%) |
| Graduate Degree | 0 (0.0%) | 0 (0.0%) |
| Total | 0 (0.0%) | 0 (0.0%) |
Employment Characteristics in Rancho Alegre
Employment by Class of Employer in Rancho Alegre
Among the 260 employed individuals in Rancho Alegre, private company employees (123 | 47.3%), self-employed (not incorporated) (65 | 25.0%), and self-employed (incorporated) (55 | 21.1%) make up the most common classes of employment.
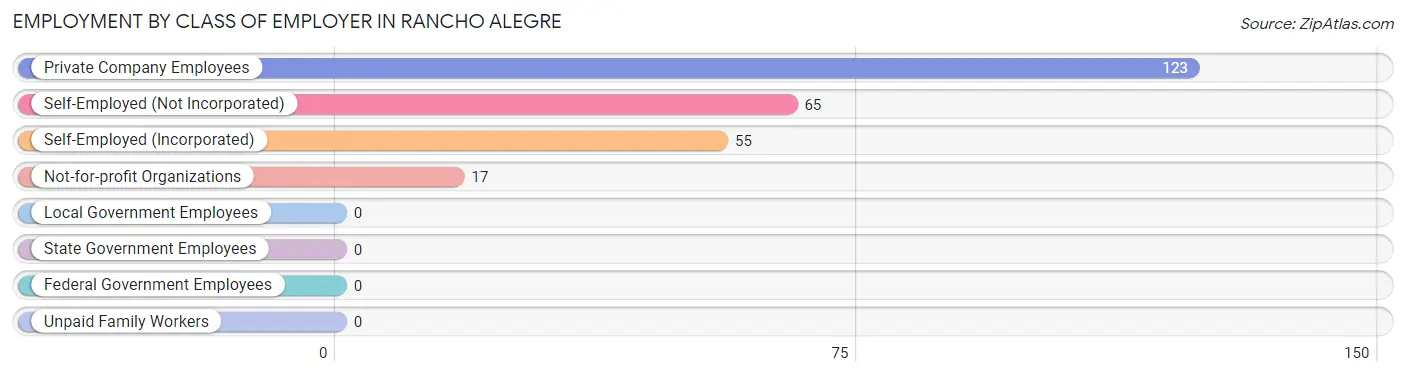
| Employer Class | # Employees | % Employees |
| Private Company Employees | 123 | 47.3% |
| Self-Employed (Incorporated) | 55 | 21.1% |
| Self-Employed (Not Incorporated) | 65 | 25.0% |
| Not-for-profit Organizations | 17 | 6.5% |
| Local Government Employees | 0 | 0.0% |
| State Government Employees | 0 | 0.0% |
| Federal Government Employees | 0 | 0.0% |
| Unpaid Family Workers | 0 | 0.0% |
| Total | 260 | 100.0% |
Employment Status by Age in Rancho Alegre
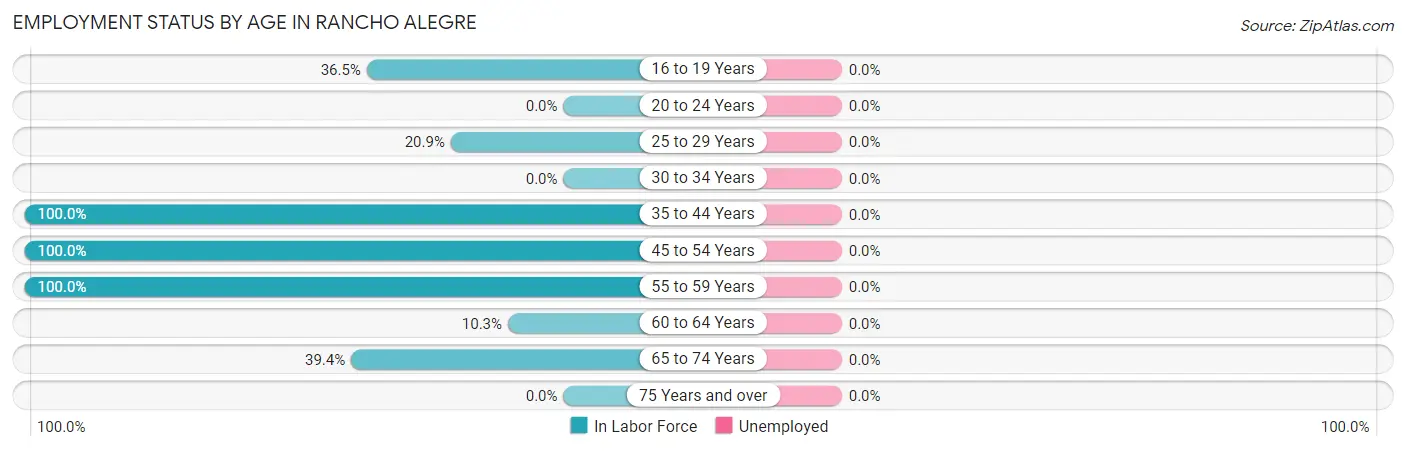
| Age Bracket | In Labor Force | Unemployed |
| 16 to 19 Years | 23 (36.5%) | 0 (0.0%) |
| 20 to 24 Years | 0 (0.0%) | 0 (0.0%) |
| 25 to 29 Years | 32 (20.9%) | 0 (0.0%) |
| 30 to 34 Years | 0 (0.0%) | 0 (0.0%) |
| 35 to 44 Years | 21 (100.0%) | 0 (0.0%) |
| 45 to 54 Years | 93 (100.0%) | 0 (0.0%) |
| 55 to 59 Years | 52 (100.0%) | 0 (0.0%) |
| 60 to 64 Years | 17 (10.3%) | 0 (0.0%) |
| 65 to 74 Years | 26 (39.4%) | 0 (0.0%) |
| 75 Years and over | 0 (0.0%) | 0 (0.0%) |
| Total | 264 (31.6%) | 0 (0.0%) |
Employment Status by Educational Attainment in Rancho Alegre
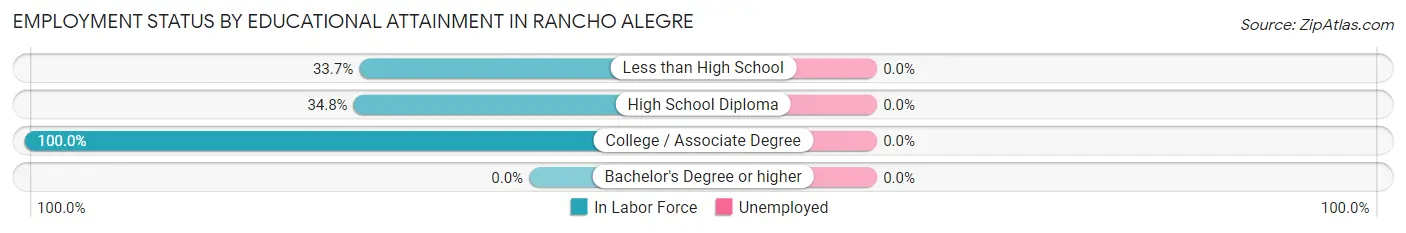
| Educational Attainment | In Labor Force | Unemployed |
| Less than High School | 32 (33.7%) | 0 (0.0%) |
| High School Diploma | 110 (34.8%) | 0 (0.0%) |
| College / Associate Degree | 73 (100.0%) | 0 (0.0%) |
| Bachelor's Degree or higher | 0 (0.0%) | 0 (0.0%) |
| Total | 215 (44.4%) | 0 (0.0%) |
Employment Occupations by Sex in Rancho Alegre
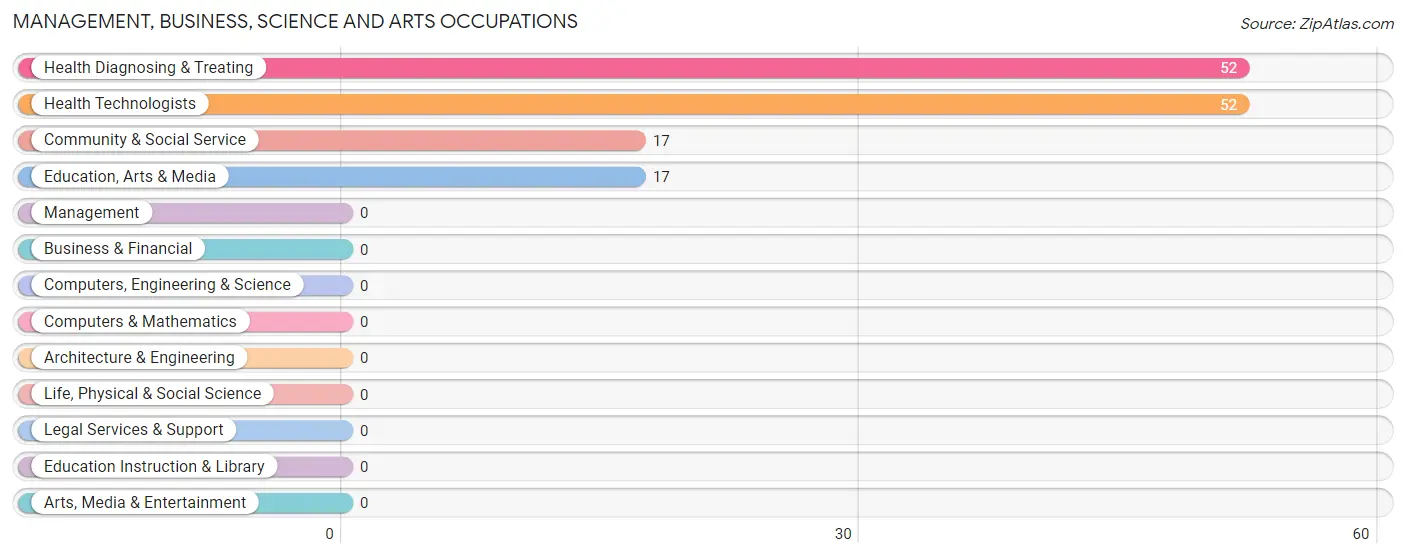
Management, Business, Science and Arts Occupations
The most common Management, Business, Science and Arts occupations in Rancho Alegre are Health Diagnosing & Treating (52 | 19.7%), Health Technologists (52 | 19.7%), Community & Social Service (17 | 6.4%), and Education, Arts & Media (17 | 6.4%).
Management, Business, Science and Arts Occupations by Sex
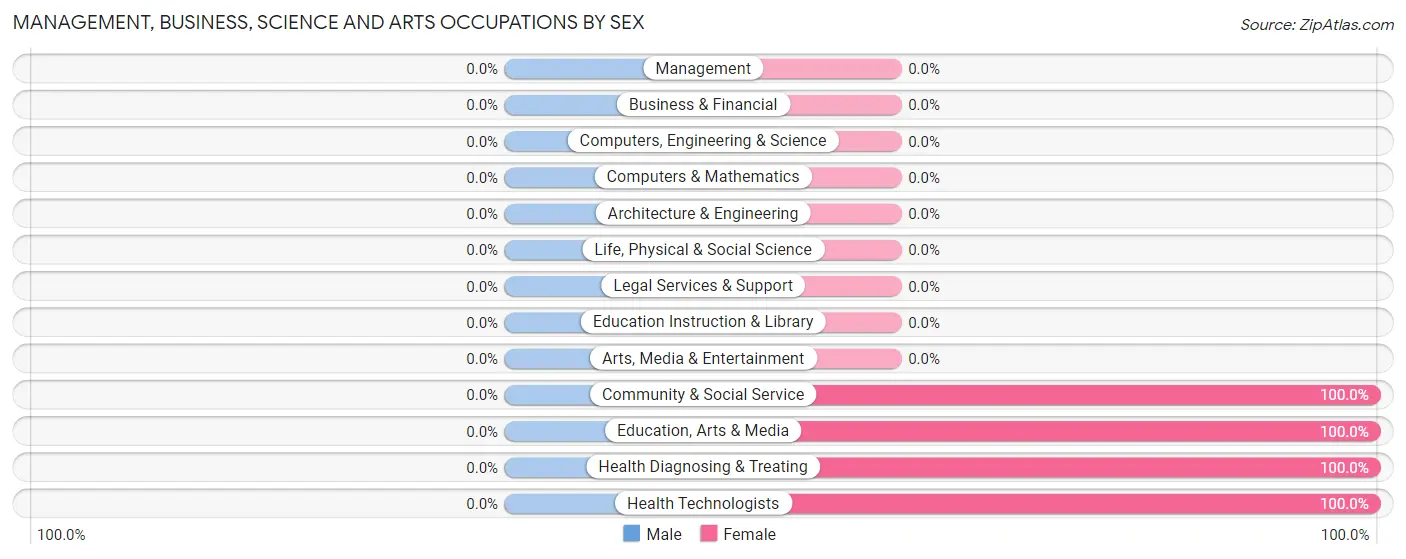
| Occupation | Male | Female |
| Management | 0 (0.0%) | 0 (0.0%) |
| Business & Financial | 0 (0.0%) | 0 (0.0%) |
| Computers, Engineering & Science | 0 (0.0%) | 0 (0.0%) |
| Computers & Mathematics | 0 (0.0%) | 0 (0.0%) |
| Architecture & Engineering | 0 (0.0%) | 0 (0.0%) |
| Life, Physical & Social Science | 0 (0.0%) | 0 (0.0%) |
| Community & Social Service | 0 (0.0%) | 17 (100.0%) |
| Education, Arts & Media | 0 (0.0%) | 17 (100.0%) |
| Legal Services & Support | 0 (0.0%) | 0 (0.0%) |
| Education Instruction & Library | 0 (0.0%) | 0 (0.0%) |
| Arts, Media & Entertainment | 0 (0.0%) | 0 (0.0%) |
| Health Diagnosing & Treating | 0 (0.0%) | 52 (100.0%) |
| Health Technologists | 0 (0.0%) | 52 (100.0%) |
| Total (Category) | 0 (0.0%) | 69 (100.0%) |
| Total (Overall) | 101 (38.3%) | 163 (61.7%) |
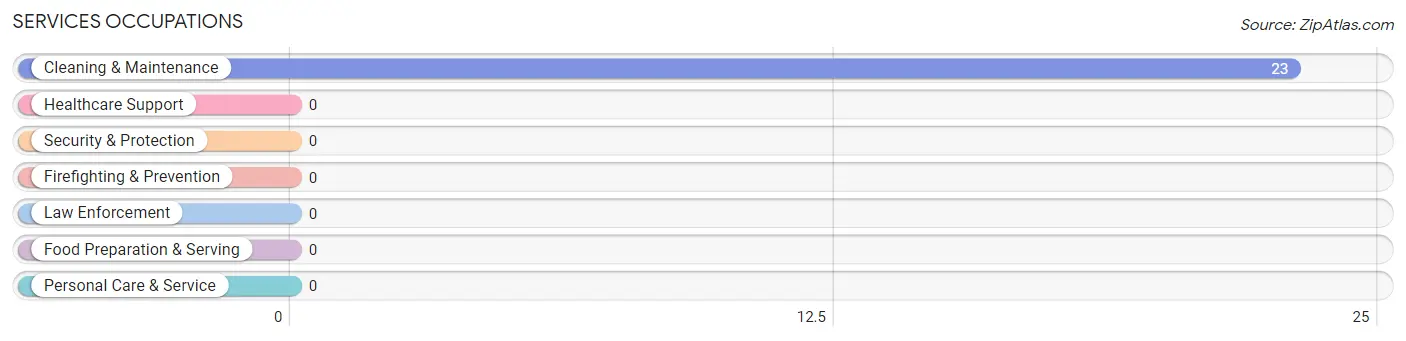
Services Occupations
The most common Services occupations in Rancho Alegre are , and Cleaning & Maintenance (23 | 8.7%).
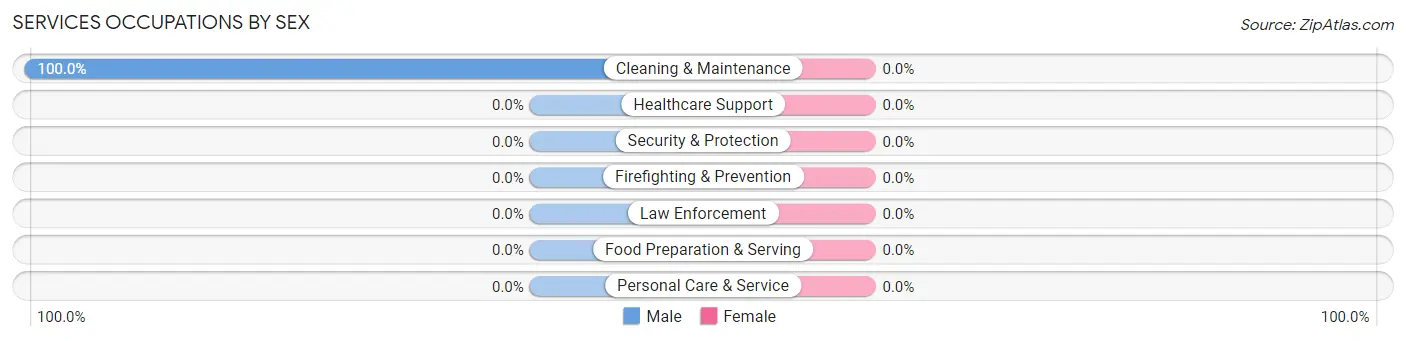
Services Occupations by Sex
| Occupation | Male | Female |
| Healthcare Support | 0 (0.0%) | 0 (0.0%) |
| Security & Protection | 0 (0.0%) | 0 (0.0%) |
| Firefighting & Prevention | 0 (0.0%) | 0 (0.0%) |
| Law Enforcement | 0 (0.0%) | 0 (0.0%) |
| Food Preparation & Serving | 0 (0.0%) | 0 (0.0%) |
| Cleaning & Maintenance | 23 (100.0%) | 0 (0.0%) |
| Personal Care & Service | 0 (0.0%) | 0 (0.0%) |
| Total (Category) | 23 (100.0%) | 0 (0.0%) |
| Total (Overall) | 101 (38.3%) | 163 (61.7%) |
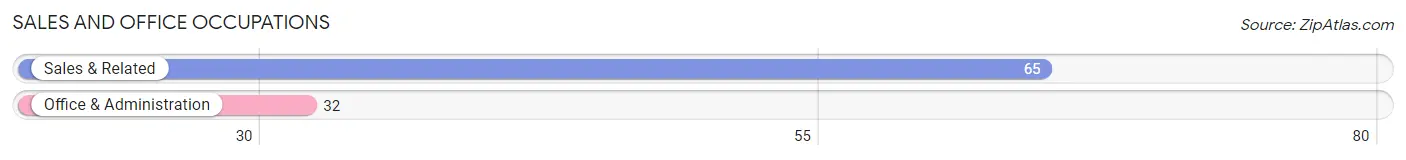
Sales and Office Occupations
The most common Sales and Office occupations in Rancho Alegre are Sales & Related (65 | 24.6%), and Office & Administration (32 | 12.1%).
Sales and Office Occupations by Sex
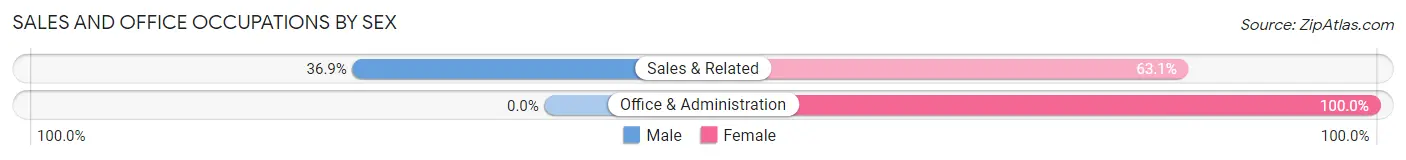
| Occupation | Male | Female |
| Sales & Related | 24 (36.9%) | 41 (63.1%) |
| Office & Administration | 0 (0.0%) | 32 (100.0%) |
| Total (Category) | 24 (24.7%) | 73 (75.3%) |
| Total (Overall) | 101 (38.3%) | 163 (61.7%) |
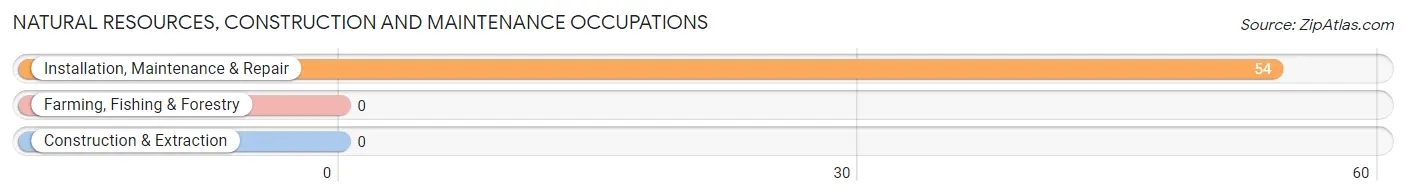
Natural Resources, Construction and Maintenance Occupations
The most common Natural Resources, Construction and Maintenance occupations in Rancho Alegre are , and Installation, Maintenance & Repair (54 | 20.4%).
Natural Resources, Construction and Maintenance Occupations by Sex
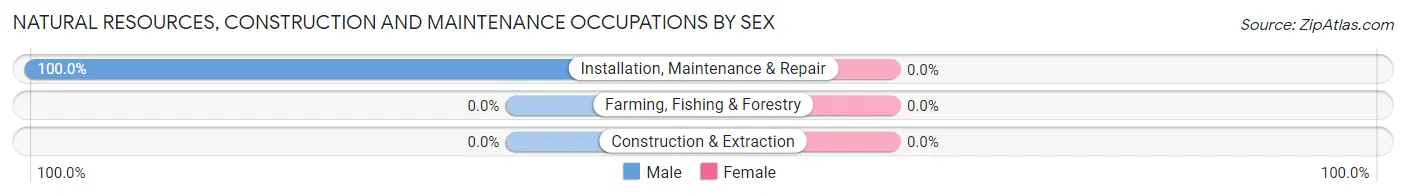
| Occupation | Male | Female |
| Farming, Fishing & Forestry | 0 (0.0%) | 0 (0.0%) |
| Construction & Extraction | 0 (0.0%) | 0 (0.0%) |
| Installation, Maintenance & Repair | 54 (100.0%) | 0 (0.0%) |
| Total (Category) | 54 (100.0%) | 0 (0.0%) |
| Total (Overall) | 101 (38.3%) | 163 (61.7%) |
Production, Transportation and Moving Occupations
The most common Production, Transportation and Moving occupations in Rancho Alegre are , and Transportation (21 | 8.0%).
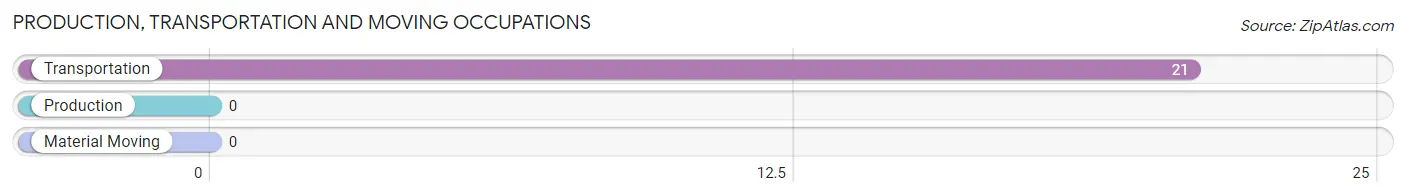
Production, Transportation and Moving Occupations by Sex
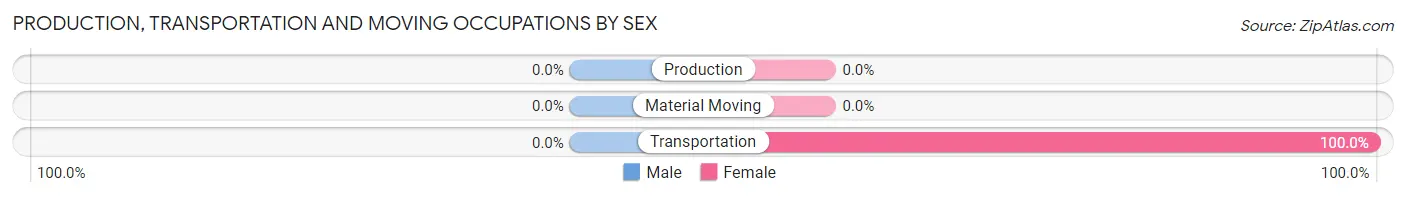
| Occupation | Male | Female |
| Production | 0 (0.0%) | 0 (0.0%) |
| Transportation | 0 (0.0%) | 21 (100.0%) |
| Material Moving | 0 (0.0%) | 0 (0.0%) |
| Total (Category) | 0 (0.0%) | 21 (100.0%) |
| Total (Overall) | 101 (38.3%) | 163 (61.7%) |
Employment Industries by Sex in Rancho Alegre
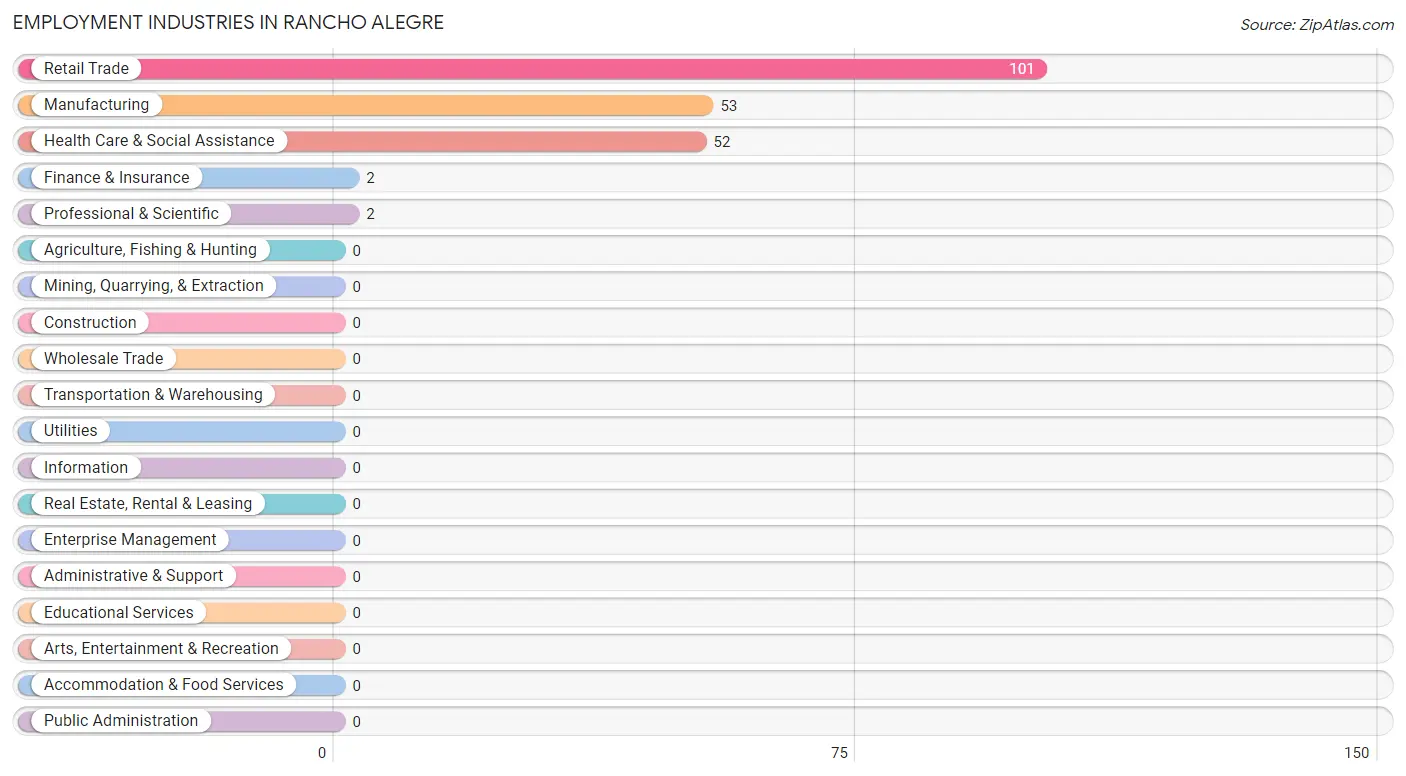
Employment Industries in Rancho Alegre
The major employment industries in Rancho Alegre include Retail Trade (101 | 38.3%), Manufacturing (53 | 20.1%), Health Care & Social Assistance (52 | 19.7%), Finance & Insurance (2 | 0.8%), and Professional & Scientific (2 | 0.8%).
Employment Industries by Sex in Rancho Alegre
The Rancho Alegre industries that see more men than women are Finance & Insurance (100.0%), Manufacturing (60.4%), and Retail Trade (44.6%), whereas the industries that tend to have a higher number of women are Professional & Scientific (100.0%), Health Care & Social Assistance (100.0%), and Retail Trade (55.4%).
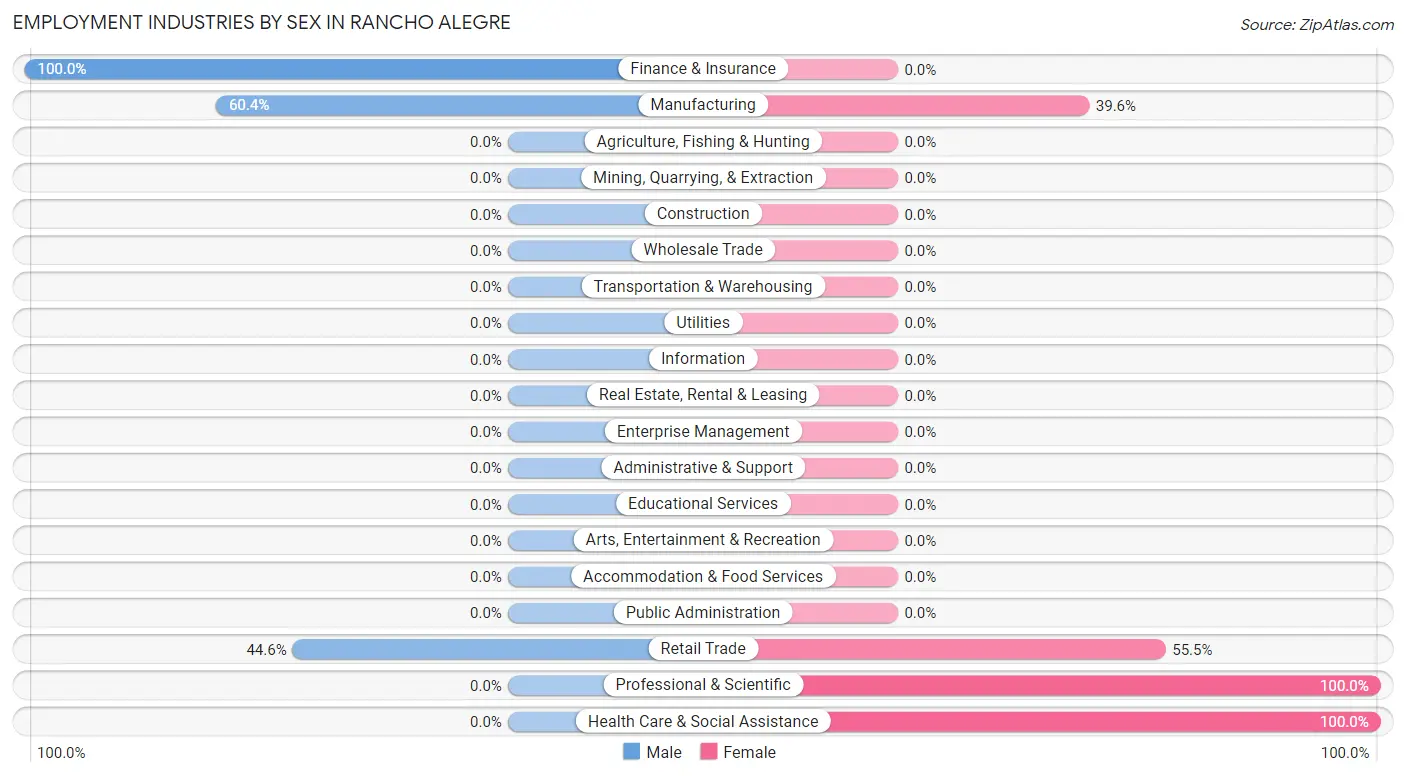
| Industry | Male | Female |
| Agriculture, Fishing & Hunting | 0 (0.0%) | 0 (0.0%) |
| Mining, Quarrying, & Extraction | 0 (0.0%) | 0 (0.0%) |
| Construction | 0 (0.0%) | 0 (0.0%) |
| Manufacturing | 32 (60.4%) | 21 (39.6%) |
| Wholesale Trade | 0 (0.0%) | 0 (0.0%) |
| Retail Trade | 45 (44.6%) | 56 (55.4%) |
| Transportation & Warehousing | 0 (0.0%) | 0 (0.0%) |
| Utilities | 0 (0.0%) | 0 (0.0%) |
| Information | 0 (0.0%) | 0 (0.0%) |
| Finance & Insurance | 2 (100.0%) | 0 (0.0%) |
| Real Estate, Rental & Leasing | 0 (0.0%) | 0 (0.0%) |
| Professional & Scientific | 0 (0.0%) | 2 (100.0%) |
| Enterprise Management | 0 (0.0%) | 0 (0.0%) |
| Administrative & Support | 0 (0.0%) | 0 (0.0%) |
| Educational Services | 0 (0.0%) | 0 (0.0%) |
| Health Care & Social Assistance | 0 (0.0%) | 52 (100.0%) |
| Arts, Entertainment & Recreation | 0 (0.0%) | 0 (0.0%) |
| Accommodation & Food Services | 0 (0.0%) | 0 (0.0%) |
| Public Administration | 0 (0.0%) | 0 (0.0%) |
| Total | 101 (38.3%) | 163 (61.7%) |
Education in Rancho Alegre
School Enrollment in Rancho Alegre
The most common levels of schooling among the 91 students in Rancho Alegre are college / undergraduate (40 | 44.0%), high school (26 | 28.6%), and middle school (25 | 27.5%).
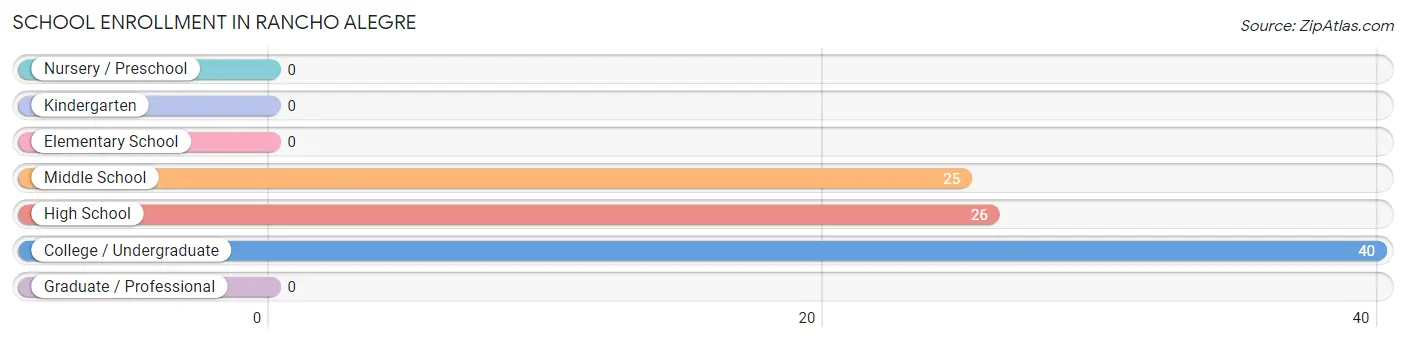
| School Level | # Students | % Students |
| Nursery / Preschool | 0 | 0.0% |
| Kindergarten | 0 | 0.0% |
| Elementary School | 0 | 0.0% |
| Middle School | 25 | 27.5% |
| High School | 26 | 28.6% |
| College / Undergraduate | 40 | 44.0% |
| Graduate / Professional | 0 | 0.0% |
| Total | 91 | 100.0% |
School Enrollment by Age by Funding Source in Rancho Alegre
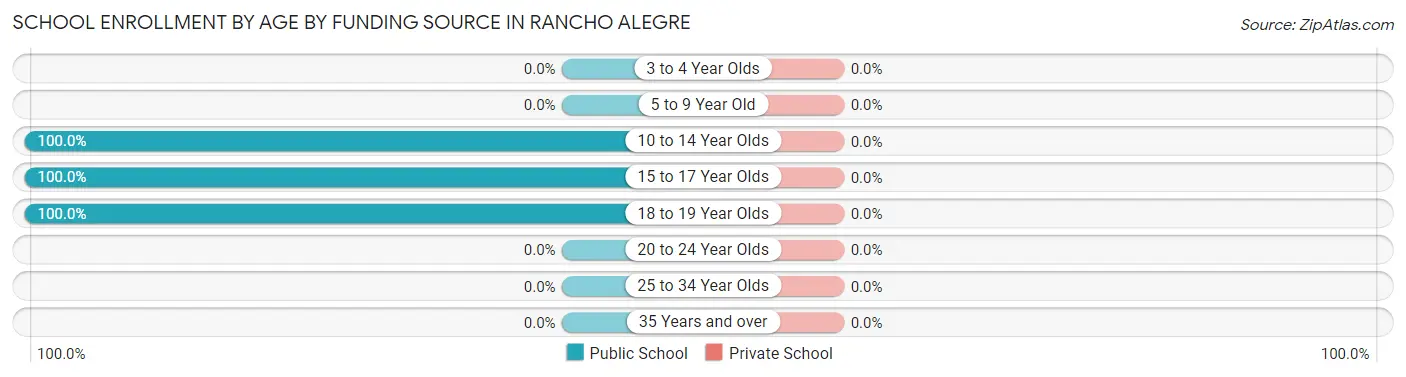
| Age Bracket | Public School | Private School |
| 3 to 4 Year Olds | 0 (0.0%) | 0 (0.0%) |
| 5 to 9 Year Old | 0 (0.0%) | 0 (0.0%) |
| 10 to 14 Year Olds | 25 (100.0%) | 0 (0.0%) |
| 15 to 17 Year Olds | 26 (100.0%) | 0 (0.0%) |
| 18 to 19 Year Olds | 40 (100.0%) | 0 (0.0%) |
| 20 to 24 Year Olds | 0 (0.0%) | 0 (0.0%) |
| 25 to 34 Year Olds | 0 (0.0%) | 0 (0.0%) |
| 35 Years and over | 0 (0.0%) | 0 (0.0%) |
| Total | 91 (100.0%) | 0 (0.0%) |
Educational Attainment by Field of Study in Rancho Alegre
, and business (22 | 100.0%) are the most common fields of study among 22 individuals in Rancho Alegre who have obtained a bachelor's degree or higher.
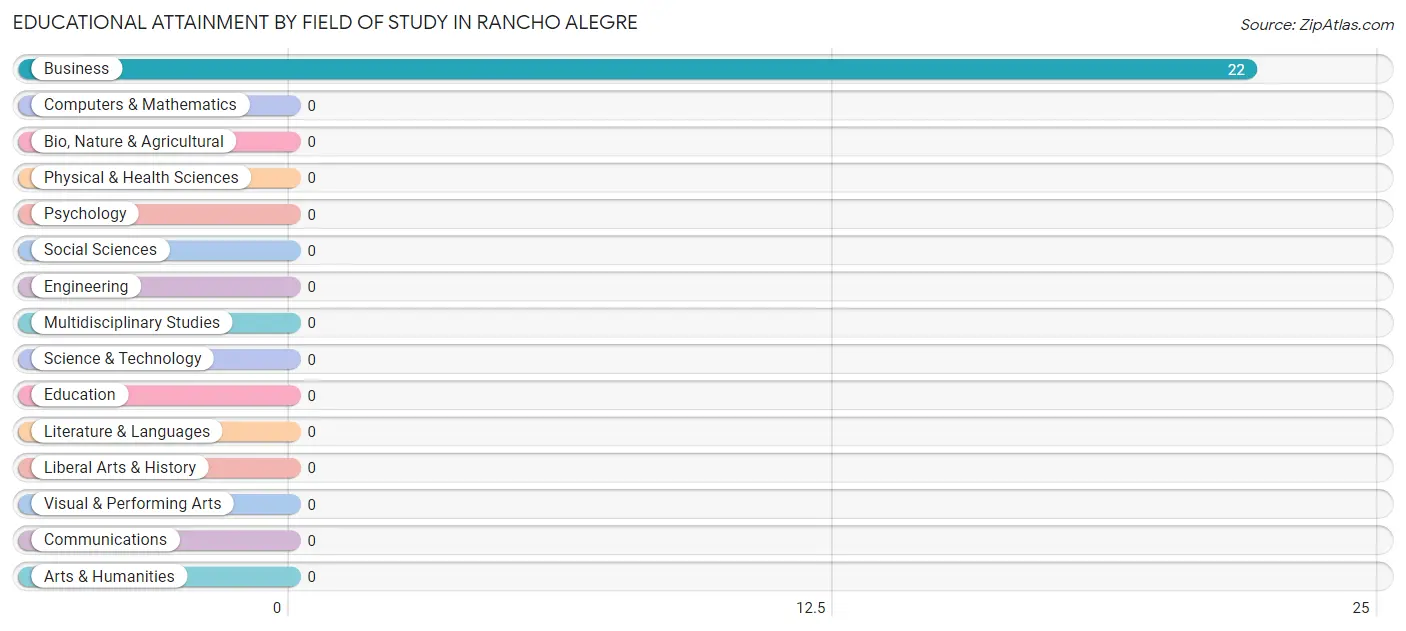
| Field of Study | # Graduates | % Graduates |
| Computers & Mathematics | 0 | 0.0% |
| Bio, Nature & Agricultural | 0 | 0.0% |
| Physical & Health Sciences | 0 | 0.0% |
| Psychology | 0 | 0.0% |
| Social Sciences | 0 | 0.0% |
| Engineering | 0 | 0.0% |
| Multidisciplinary Studies | 0 | 0.0% |
| Science & Technology | 0 | 0.0% |
| Business | 22 | 100.0% |
| Education | 0 | 0.0% |
| Literature & Languages | 0 | 0.0% |
| Liberal Arts & History | 0 | 0.0% |
| Visual & Performing Arts | 0 | 0.0% |
| Communications | 0 | 0.0% |
| Arts & Humanities | 0 | 0.0% |
| Total | 22 | 100.0% |
Transportation & Commute in Rancho Alegre
Vehicle Availability by Sex in Rancho Alegre
The most prevalent vehicle ownership categories in Rancho Alegre are males with 3 vehicles (55, accounting for 55.6%) and females with 3 vehicles (21, making up 34.2%).
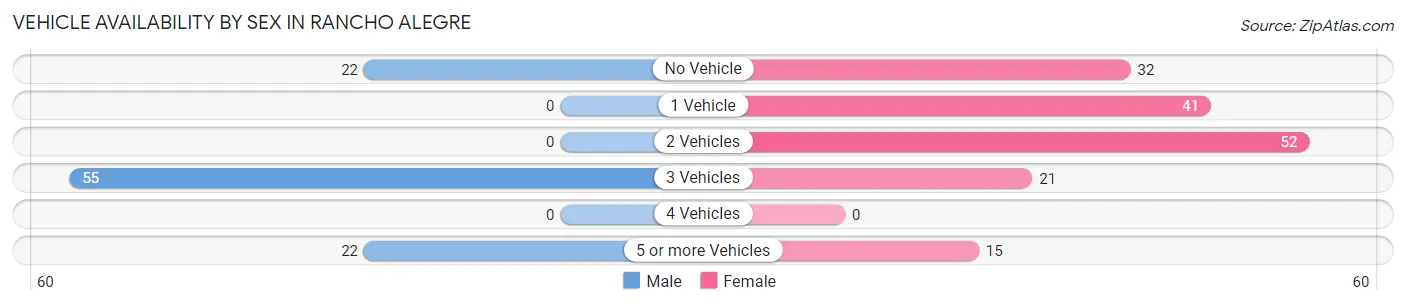
| Vehicles Available | Male | Female |
| No Vehicle | 22 (22.2%) | 32 (19.9%) |
| 1 Vehicle | 0 (0.0%) | 41 (25.5%) |
| 2 Vehicles | 0 (0.0%) | 52 (32.3%) |
| 3 Vehicles | 55 (55.6%) | 21 (13.0%) |
| 4 Vehicles | 0 (0.0%) | 0 (0.0%) |
| 5 or more Vehicles | 22 (22.2%) | 15 (9.3%) |
| Total | 99 (100.0%) | 161 (100.0%) |
Commute Time in Rancho Alegre
The most frequently occuring commute durations in Rancho Alegre are 10 to 14 minutes (95 commuters, 36.5%), 45 to 59 minutes (75 commuters, 28.8%), and 30 to 34 minutes (32 commuters, 12.3%).
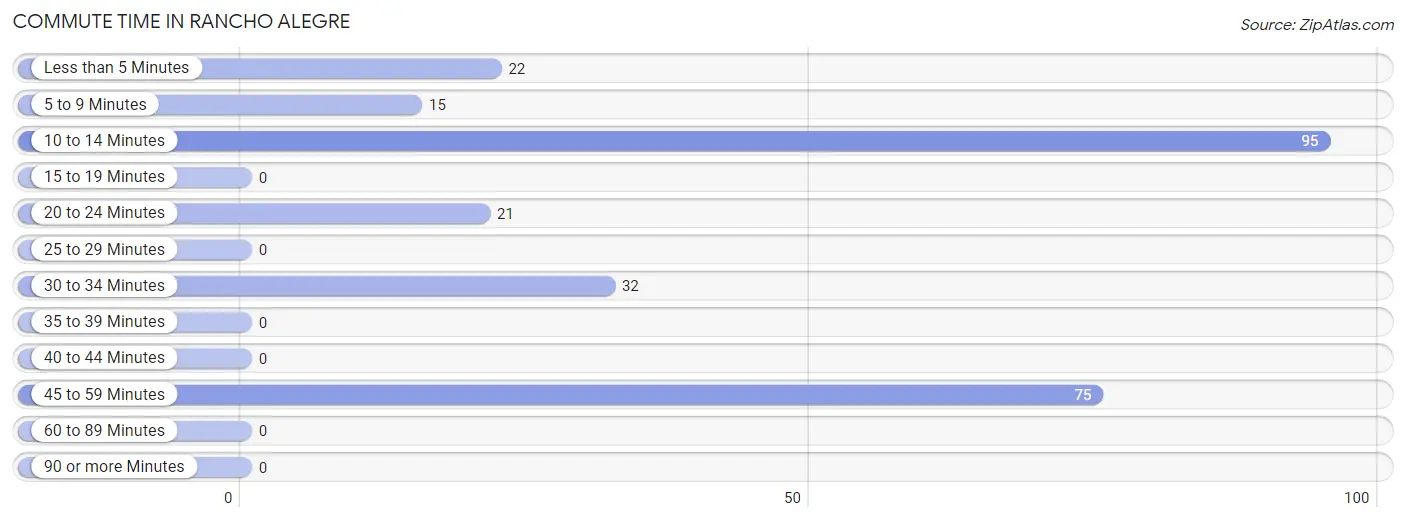
| Commute Time | # Commuters | % Commuters |
| Less than 5 Minutes | 22 | 8.5% |
| 5 to 9 Minutes | 15 | 5.8% |
| 10 to 14 Minutes | 95 | 36.5% |
| 15 to 19 Minutes | 0 | 0.0% |
| 20 to 24 Minutes | 21 | 8.1% |
| 25 to 29 Minutes | 0 | 0.0% |
| 30 to 34 Minutes | 32 | 12.3% |
| 35 to 39 Minutes | 0 | 0.0% |
| 40 to 44 Minutes | 0 | 0.0% |
| 45 to 59 Minutes | 75 | 28.8% |
| 60 to 89 Minutes | 0 | 0.0% |
| 90 or more Minutes | 0 | 0.0% |
Commute Time by Sex in Rancho Alegre
The most common commute times in Rancho Alegre are 30 to 34 minutes (32 commuters, 32.3%) for males and 10 to 14 minutes (73 commuters, 45.3%) for females.
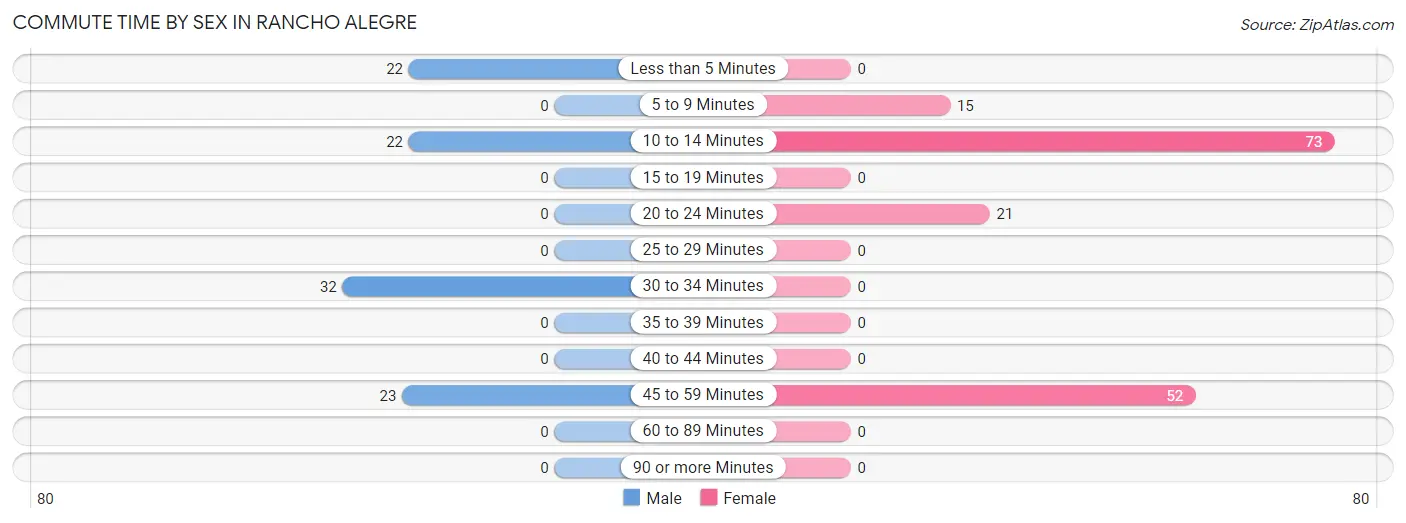
| Commute Time | Male | Female |
| Less than 5 Minutes | 22 (22.2%) | 0 (0.0%) |
| 5 to 9 Minutes | 0 (0.0%) | 15 (9.3%) |
| 10 to 14 Minutes | 22 (22.2%) | 73 (45.3%) |
| 15 to 19 Minutes | 0 (0.0%) | 0 (0.0%) |
| 20 to 24 Minutes | 0 (0.0%) | 21 (13.0%) |
| 25 to 29 Minutes | 0 (0.0%) | 0 (0.0%) |
| 30 to 34 Minutes | 32 (32.3%) | 0 (0.0%) |
| 35 to 39 Minutes | 0 (0.0%) | 0 (0.0%) |
| 40 to 44 Minutes | 0 (0.0%) | 0 (0.0%) |
| 45 to 59 Minutes | 23 (23.2%) | 52 (32.3%) |
| 60 to 89 Minutes | 0 (0.0%) | 0 (0.0%) |
| 90 or more Minutes | 0 (0.0%) | 0 (0.0%) |
Time of Departure to Work by Sex in Rancho Alegre
The most frequent times of departure to work in Rancho Alegre are 6:30 AM to 6:59 AM (32, 32.3%) for males and 12:00 PM to 3:59 PM (52, 32.3%) for females.
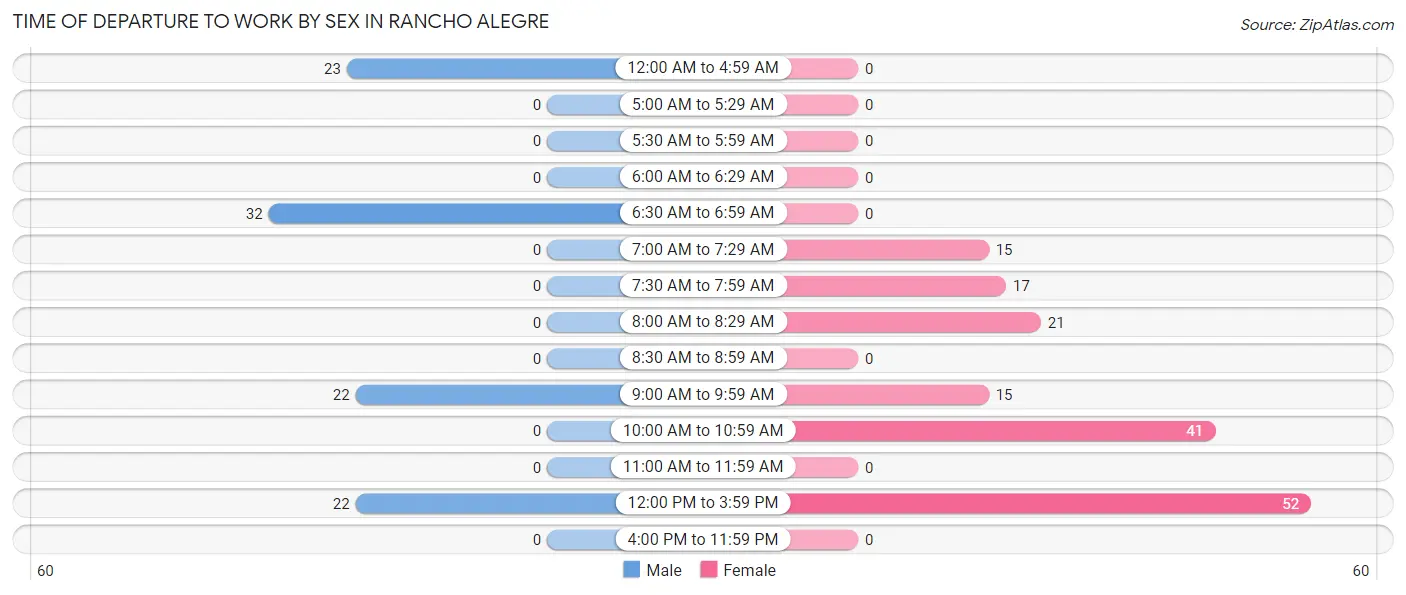
| Time of Departure | Male | Female |
| 12:00 AM to 4:59 AM | 23 (23.2%) | 0 (0.0%) |
| 5:00 AM to 5:29 AM | 0 (0.0%) | 0 (0.0%) |
| 5:30 AM to 5:59 AM | 0 (0.0%) | 0 (0.0%) |
| 6:00 AM to 6:29 AM | 0 (0.0%) | 0 (0.0%) |
| 6:30 AM to 6:59 AM | 32 (32.3%) | 0 (0.0%) |
| 7:00 AM to 7:29 AM | 0 (0.0%) | 15 (9.3%) |
| 7:30 AM to 7:59 AM | 0 (0.0%) | 17 (10.6%) |
| 8:00 AM to 8:29 AM | 0 (0.0%) | 21 (13.0%) |
| 8:30 AM to 8:59 AM | 0 (0.0%) | 0 (0.0%) |
| 9:00 AM to 9:59 AM | 22 (22.2%) | 15 (9.3%) |
| 10:00 AM to 10:59 AM | 0 (0.0%) | 41 (25.5%) |
| 11:00 AM to 11:59 AM | 0 (0.0%) | 0 (0.0%) |
| 12:00 PM to 3:59 PM | 22 (22.2%) | 52 (32.3%) |
| 4:00 PM to 11:59 PM | 0 (0.0%) | 0 (0.0%) |
| Total | 99 (100.0%) | 161 (100.0%) |
Housing Occupancy in Rancho Alegre
Occupancy by Ownership in Rancho Alegre
Of the total 298 dwellings in Rancho Alegre, owner-occupied units account for 279 (93.6%), while renter-occupied units make up 19 (6.4%).
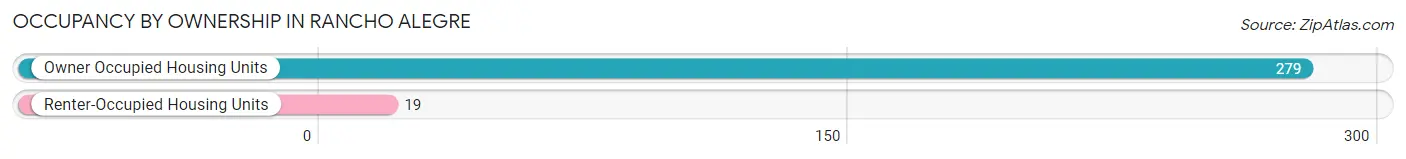
| Occupancy | # Housing Units | % Housing Units |
| Owner Occupied Housing Units | 279 | 93.6% |
| Renter-Occupied Housing Units | 19 | 6.4% |
| Total Occupied Housing Units | 298 | 100.0% |
Occupancy by Household Size in Rancho Alegre
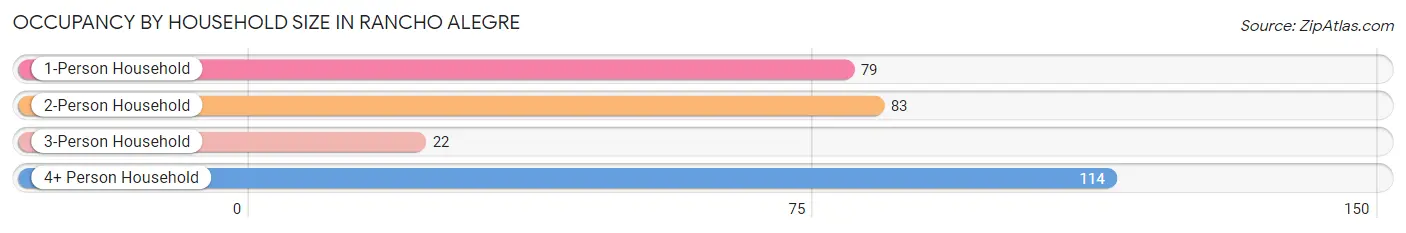
| Household Size | # Housing Units | % Housing Units |
| 1-Person Household | 79 | 26.5% |
| 2-Person Household | 83 | 27.9% |
| 3-Person Household | 22 | 7.4% |
| 4+ Person Household | 114 | 38.3% |
| Total Housing Units | 298 | 100.0% |
Occupancy by Ownership by Household Size in Rancho Alegre
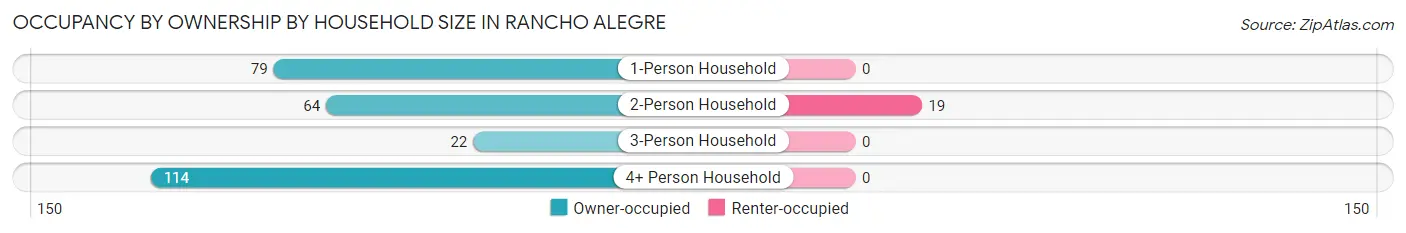
| Household Size | Owner-occupied | Renter-occupied |
| 1-Person Household | 79 (100.0%) | 0 (0.0%) |
| 2-Person Household | 64 (77.1%) | 19 (22.9%) |
| 3-Person Household | 22 (100.0%) | 0 (0.0%) |
| 4+ Person Household | 114 (100.0%) | 0 (0.0%) |
| Total Housing Units | 279 (93.6%) | 19 (6.4%) |
Occupancy by Educational Attainment in Rancho Alegre
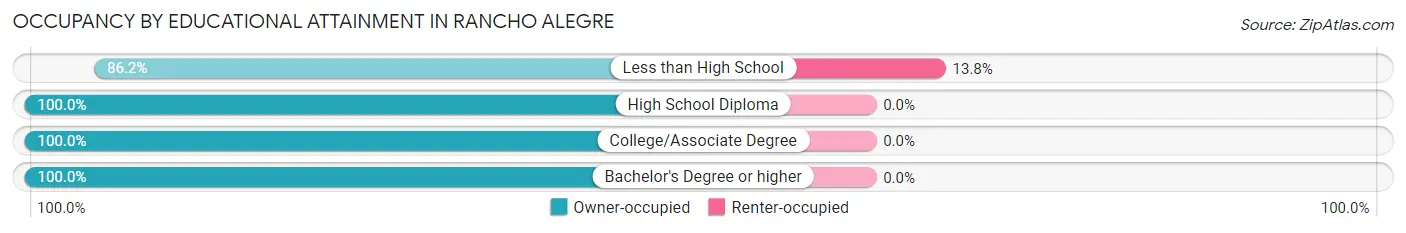
| Household Size | Owner-occupied | Renter-occupied |
| Less than High School | 119 (86.2%) | 19 (13.8%) |
| High School Diploma | 65 (100.0%) | 0 (0.0%) |
| College/Associate Degree | 73 (100.0%) | 0 (0.0%) |
| Bachelor's Degree or higher | 22 (100.0%) | 0 (0.0%) |
Occupancy by Age of Householder in Rancho Alegre
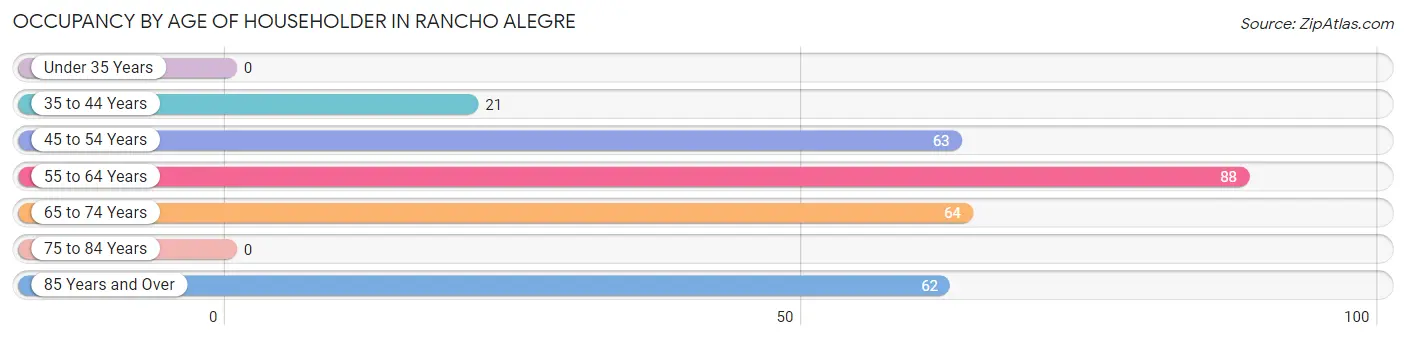
| Age Bracket | # Households | % Households |
| Under 35 Years | 0 | 0.0% |
| 35 to 44 Years | 21 | 7.0% |
| 45 to 54 Years | 63 | 21.1% |
| 55 to 64 Years | 88 | 29.5% |
| 65 to 74 Years | 64 | 21.5% |
| 75 to 84 Years | 0 | 0.0% |
| 85 Years and Over | 62 | 20.8% |
| Total | 298 | 100.0% |
Housing Finances in Rancho Alegre
Median Income by Occupancy in Rancho Alegre
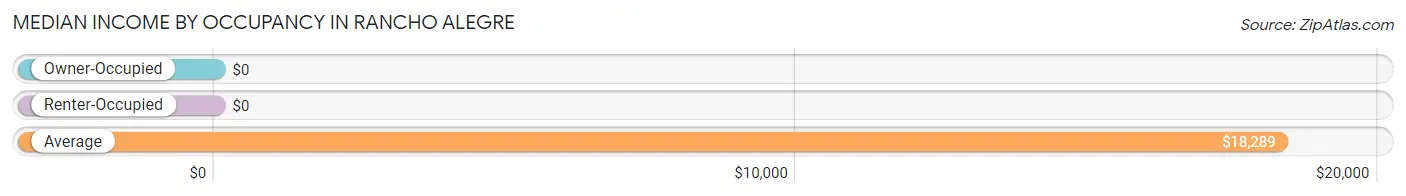
| Occupancy Type | # Households | Median Income |
| Owner-Occupied | 279 (93.6%) | $0 |
| Renter-Occupied | 19 (6.4%) | $0 |
| Average | 298 (100.0%) | $18,289 |
Occupancy by Householder Income Bracket in Rancho Alegre
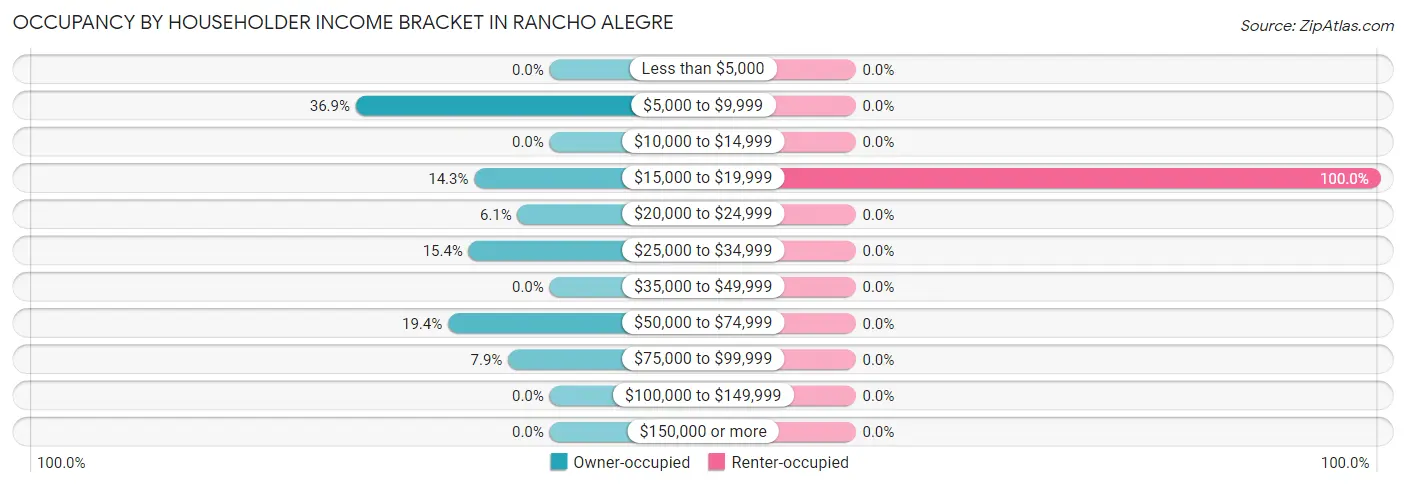
| Income Bracket | Owner-occupied | Renter-occupied |
| Less than $5,000 | 0 (0.0%) | 0 (0.0%) |
| $5,000 to $9,999 | 103 (36.9%) | 0 (0.0%) |
| $10,000 to $14,999 | 0 (0.0%) | 0 (0.0%) |
| $15,000 to $19,999 | 40 (14.3%) | 19 (100.0%) |
| $20,000 to $24,999 | 17 (6.1%) | 0 (0.0%) |
| $25,000 to $34,999 | 43 (15.4%) | 0 (0.0%) |
| $35,000 to $49,999 | 0 (0.0%) | 0 (0.0%) |
| $50,000 to $74,999 | 54 (19.4%) | 0 (0.0%) |
| $75,000 to $99,999 | 22 (7.9%) | 0 (0.0%) |
| $100,000 to $149,999 | 0 (0.0%) | 0 (0.0%) |
| $150,000 or more | 0 (0.0%) | 0 (0.0%) |
| Total | 279 (100.0%) | 19 (100.0%) |
Monthly Housing Cost Tiers in Rancho Alegre
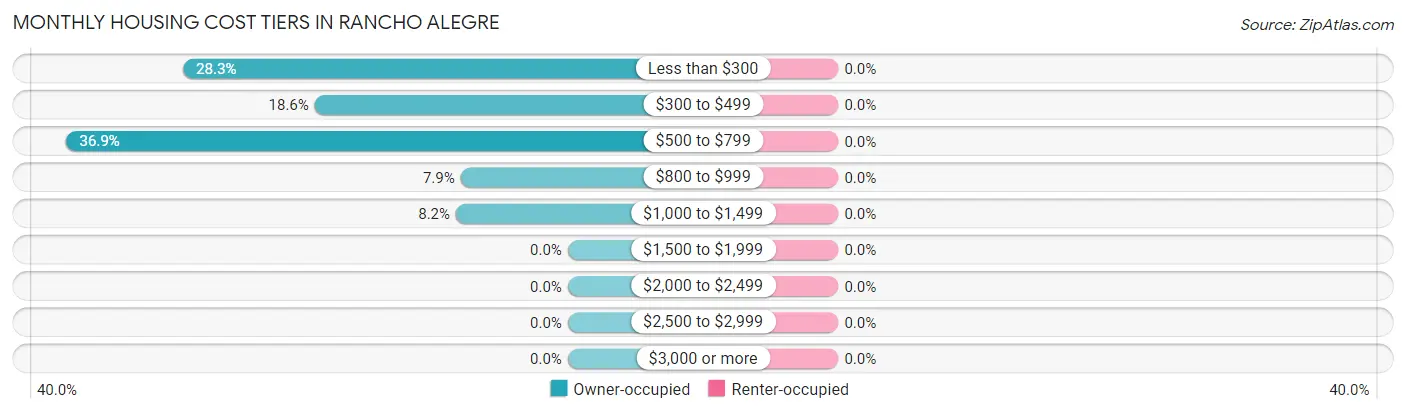
| Monthly Cost | Owner-occupied | Renter-occupied |
| Less than $300 | 79 (28.3%) | 0 (0.0%) |
| $300 to $499 | 52 (18.6%) | 0 (0.0%) |
| $500 to $799 | 103 (36.9%) | 0 (0.0%) |
| $800 to $999 | 22 (7.9%) | 0 (0.0%) |
| $1,000 to $1,499 | 23 (8.2%) | 0 (0.0%) |
| $1,500 to $1,999 | 0 (0.0%) | 0 (0.0%) |
| $2,000 to $2,499 | 0 (0.0%) | 0 (0.0%) |
| $2,500 to $2,999 | 0 (0.0%) | 0 (0.0%) |
| $3,000 or more | 0 (0.0%) | 0 (0.0%) |
| Total | 279 (100.0%) | 19 (100.0%) |
Physical Housing Characteristics in Rancho Alegre
Housing Structures in Rancho Alegre
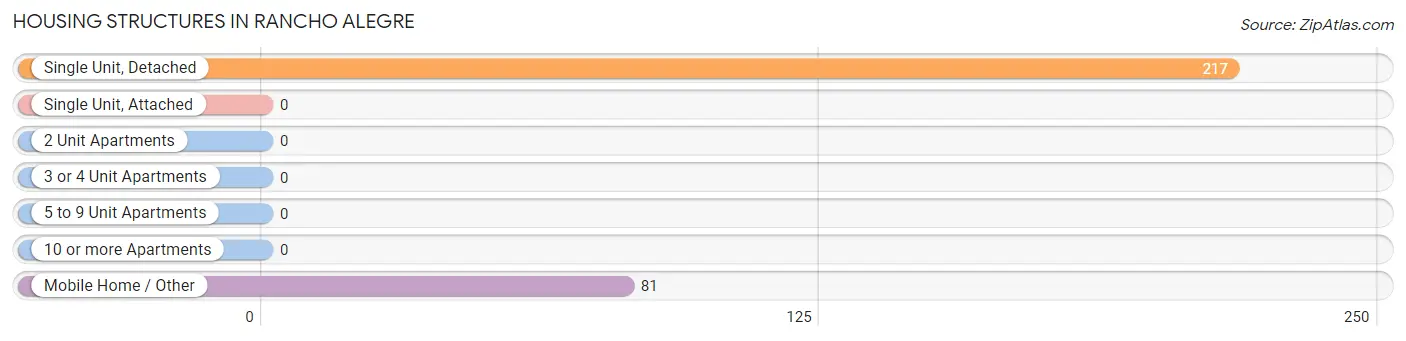
| Structure Type | # Housing Units | % Housing Units |
| Single Unit, Detached | 217 | 72.8% |
| Single Unit, Attached | 0 | 0.0% |
| 2 Unit Apartments | 0 | 0.0% |
| 3 or 4 Unit Apartments | 0 | 0.0% |
| 5 to 9 Unit Apartments | 0 | 0.0% |
| 10 or more Apartments | 0 | 0.0% |
| Mobile Home / Other | 81 | 27.2% |
| Total | 298 | 100.0% |
Housing Structures by Occupancy in Rancho Alegre
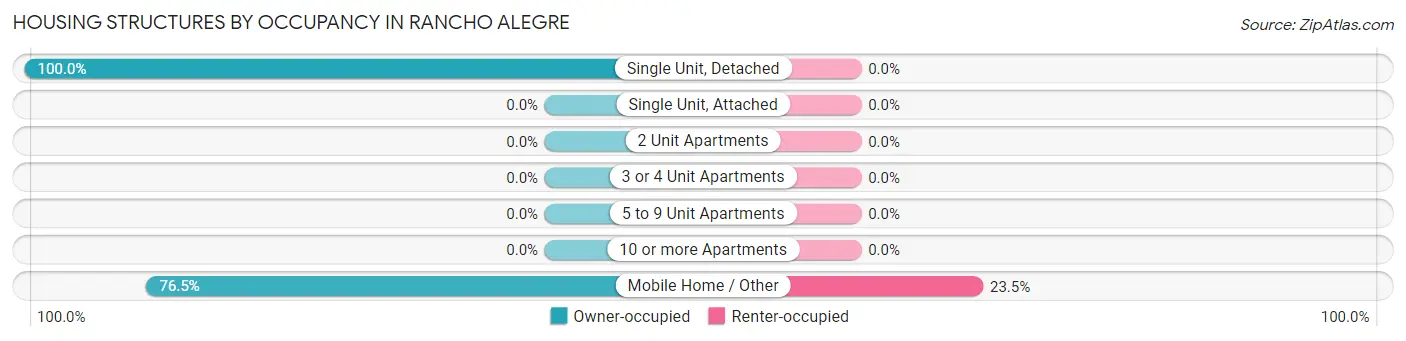
| Structure Type | Owner-occupied | Renter-occupied |
| Single Unit, Detached | 217 (100.0%) | 0 (0.0%) |
| Single Unit, Attached | 0 (0.0%) | 0 (0.0%) |
| 2 Unit Apartments | 0 (0.0%) | 0 (0.0%) |
| 3 or 4 Unit Apartments | 0 (0.0%) | 0 (0.0%) |
| 5 to 9 Unit Apartments | 0 (0.0%) | 0 (0.0%) |
| 10 or more Apartments | 0 (0.0%) | 0 (0.0%) |
| Mobile Home / Other | 62 (76.5%) | 19 (23.5%) |
| Total | 279 (93.6%) | 19 (6.4%) |
Housing Structures by Number of Rooms in Rancho Alegre
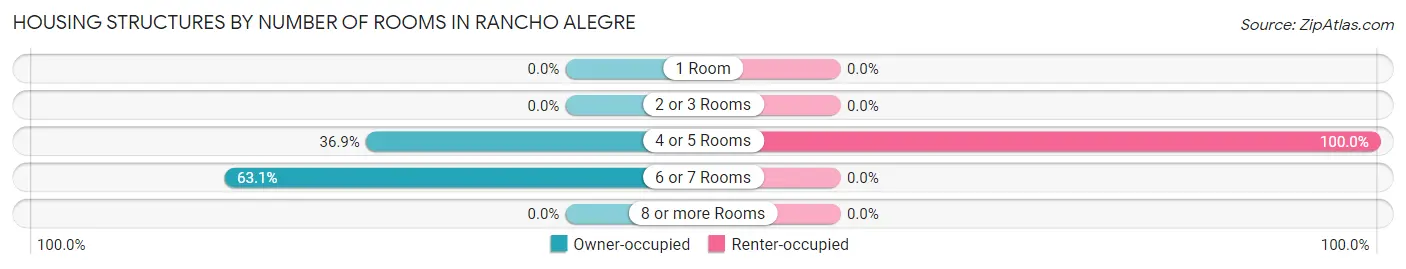
| Number of Rooms | Owner-occupied | Renter-occupied |
| 1 Room | 0 (0.0%) | 0 (0.0%) |
| 2 or 3 Rooms | 0 (0.0%) | 0 (0.0%) |
| 4 or 5 Rooms | 103 (36.9%) | 19 (100.0%) |
| 6 or 7 Rooms | 176 (63.1%) | 0 (0.0%) |
| 8 or more Rooms | 0 (0.0%) | 0 (0.0%) |
| Total | 279 (100.0%) | 19 (100.0%) |
Housing Structure by Heating Type in Rancho Alegre
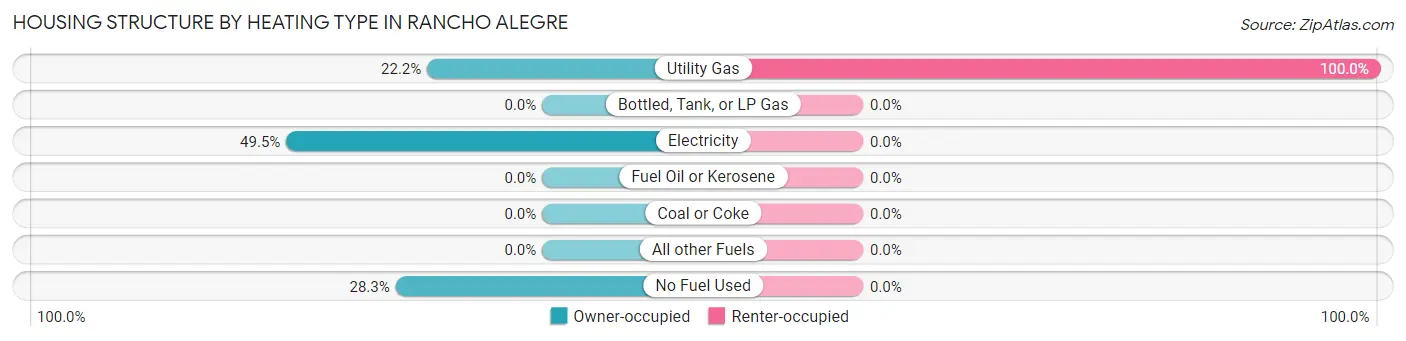
| Heating Type | Owner-occupied | Renter-occupied |
| Utility Gas | 62 (22.2%) | 19 (100.0%) |
| Bottled, Tank, or LP Gas | 0 (0.0%) | 0 (0.0%) |
| Electricity | 138 (49.5%) | 0 (0.0%) |
| Fuel Oil or Kerosene | 0 (0.0%) | 0 (0.0%) |
| Coal or Coke | 0 (0.0%) | 0 (0.0%) |
| All other Fuels | 0 (0.0%) | 0 (0.0%) |
| No Fuel Used | 79 (28.3%) | 0 (0.0%) |
| Total | 279 (100.0%) | 19 (100.0%) |
Household Vehicle Usage in Rancho Alegre
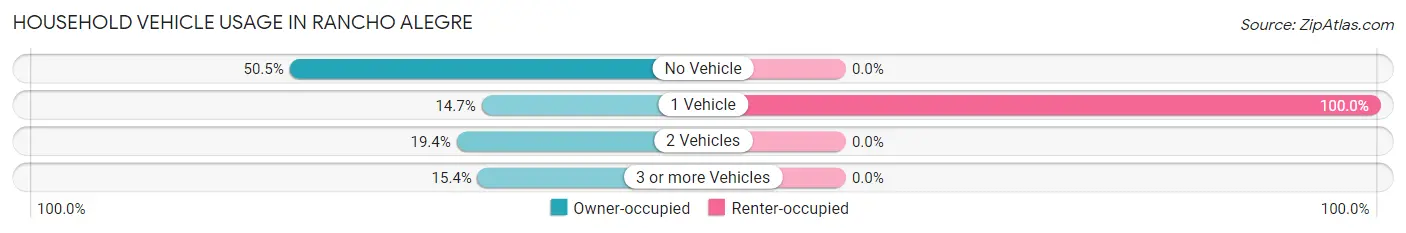
| Vehicles per Household | Owner-occupied | Renter-occupied |
| No Vehicle | 141 (50.5%) | 0 (0.0%) |
| 1 Vehicle | 41 (14.7%) | 19 (100.0%) |
| 2 Vehicles | 54 (19.4%) | 0 (0.0%) |
| 3 or more Vehicles | 43 (15.4%) | 0 (0.0%) |
| Total | 279 (100.0%) | 19 (100.0%) |
Real Estate & Mortgages in Rancho Alegre
Real Estate and Mortgage Overview in Rancho Alegre
| Characteristic | Without Mortgage | With Mortgage |
| Housing Units | 234 | 45 |
| Median Property Value | - | - |
| Median Household Income | - | - |
| Monthly Housing Costs | $473 | $0 |
| Real Estate Taxes | - | - |
Property Value by Mortgage Status in Rancho Alegre
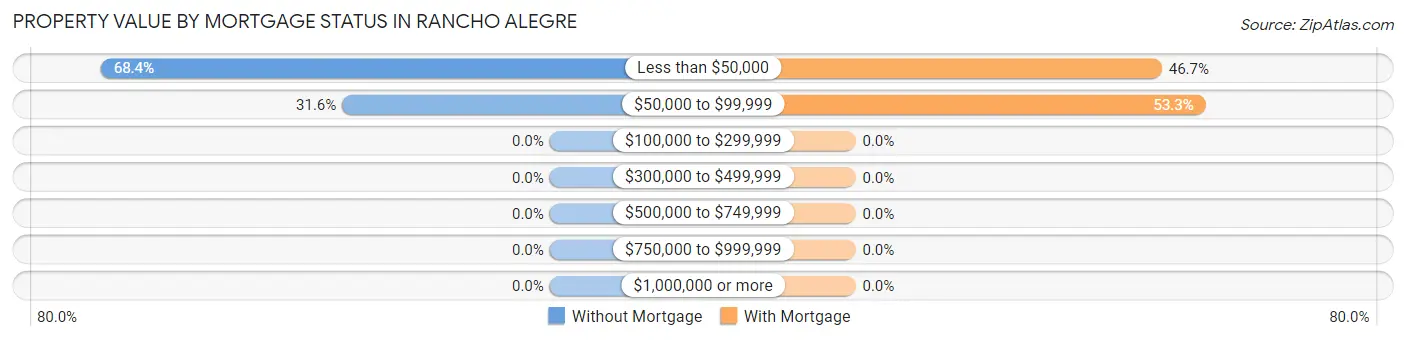
| Property Value | Without Mortgage | With Mortgage |
| Less than $50,000 | 160 (68.4%) | 21 (46.7%) |
| $50,000 to $99,999 | 74 (31.6%) | 24 (53.3%) |
| $100,000 to $299,999 | 0 (0.0%) | 0 (0.0%) |
| $300,000 to $499,999 | 0 (0.0%) | 0 (0.0%) |
| $500,000 to $749,999 | 0 (0.0%) | 0 (0.0%) |
| $750,000 to $999,999 | 0 (0.0%) | 0 (0.0%) |
| $1,000,000 or more | 0 (0.0%) | 0 (0.0%) |
| Total | 234 (100.0%) | 45 (100.0%) |
Household Income by Mortgage Status in Rancho Alegre
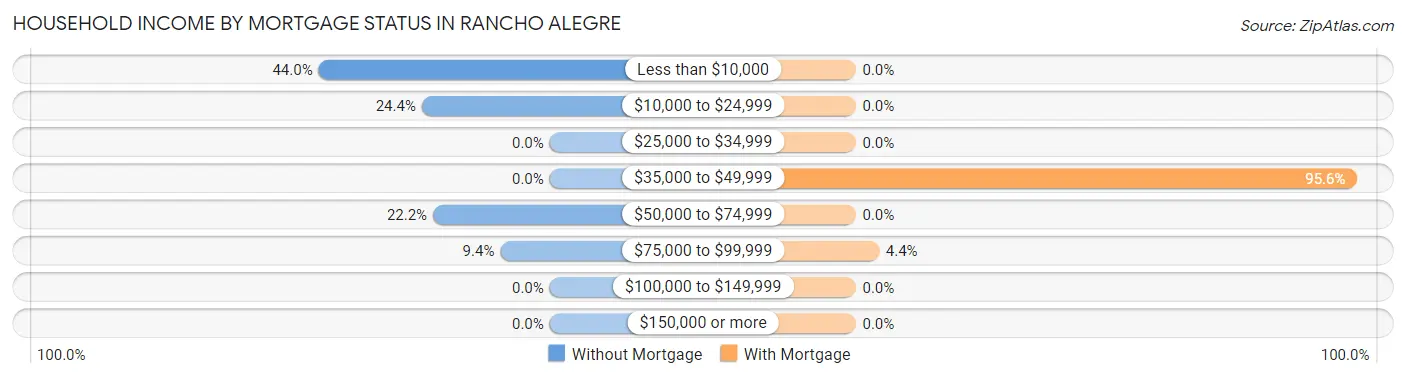
| Household Income | Without Mortgage | With Mortgage |
| Less than $10,000 | 103 (44.0%) | 0 (0.0%) |
| $10,000 to $24,999 | 57 (24.4%) | 0 (0.0%) |
| $25,000 to $34,999 | 0 (0.0%) | 0 (0.0%) |
| $35,000 to $49,999 | 0 (0.0%) | 43 (95.6%) |
| $50,000 to $74,999 | 52 (22.2%) | 0 (0.0%) |
| $75,000 to $99,999 | 22 (9.4%) | 2 (4.4%) |
| $100,000 to $149,999 | 0 (0.0%) | 0 (0.0%) |
| $150,000 or more | 0 (0.0%) | 0 (0.0%) |
| Total | 234 (100.0%) | 45 (100.0%) |
Property Value to Household Income Ratio in Rancho Alegre
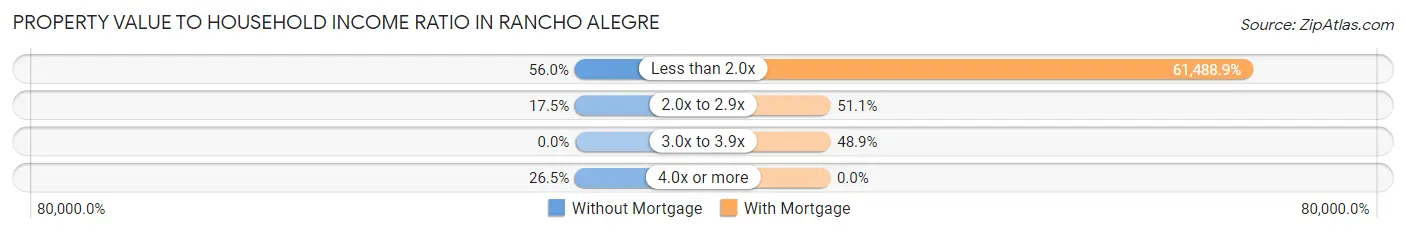
| Value-to-Income Ratio | Without Mortgage | With Mortgage |
| Less than 2.0x | 131 (56.0%) | 27,670 (61,488.9%) |
| 2.0x to 2.9x | 41 (17.5%) | 23 (51.1%) |
| 3.0x to 3.9x | 0 (0.0%) | 22 (48.9%) |
| 4.0x or more | 62 (26.5%) | 0 (0.0%) |
| Total | 234 (100.0%) | 45 (100.0%) |
Real Estate Taxes by Mortgage Status in Rancho Alegre
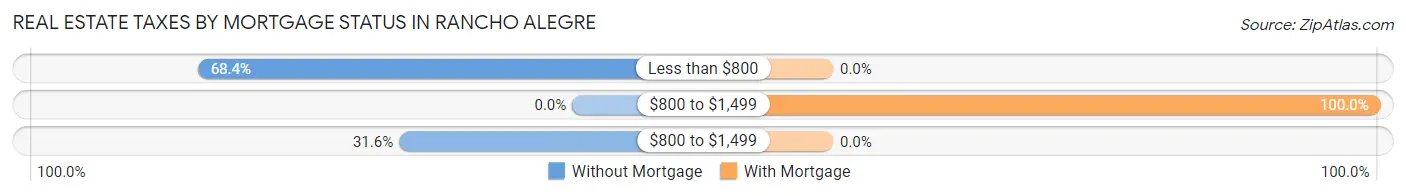
| Property Taxes | Without Mortgage | With Mortgage |
| Less than $800 | 160 (68.4%) | 0 (0.0%) |
| $800 to $1,499 | 0 (0.0%) | 45 (100.0%) |
| $800 to $1,499 | 74 (31.6%) | 0 (0.0%) |
| Total | 234 (100.0%) | 45 (100.0%) |
Health & Disability in Rancho Alegre
Health Insurance Coverage by Age in Rancho Alegre
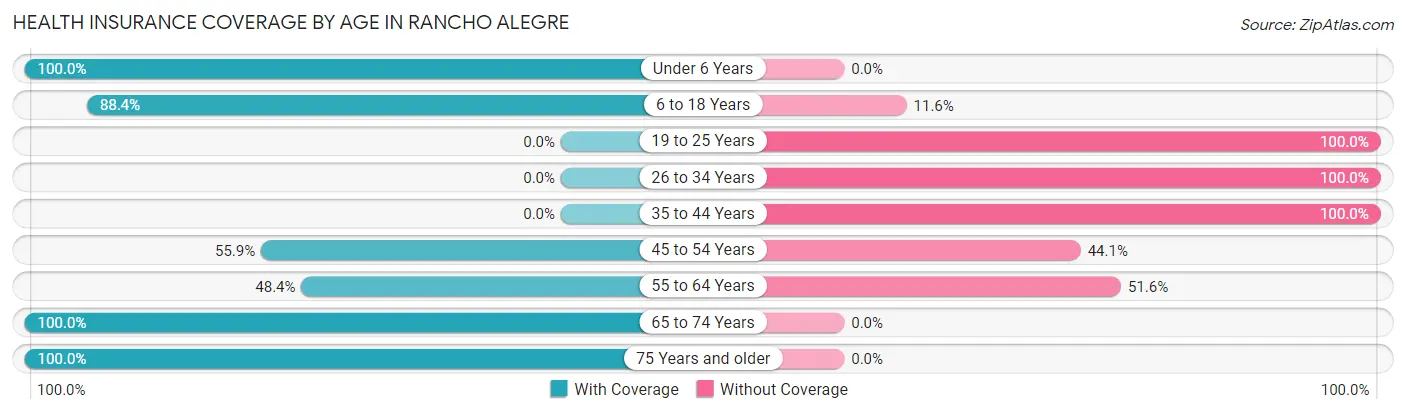
| Age Bracket | With Coverage | Without Coverage |
| Under 6 Years | 129 (100.0%) | 0 (0.0%) |
| 6 to 18 Years | 175 (88.4%) | 23 (11.6%) |
| 19 to 25 Years | 0 (0.0%) | 160 (100.0%) |
| 26 to 34 Years | 0 (0.0%) | 153 (100.0%) |
| 35 to 44 Years | 0 (0.0%) | 21 (100.0%) |
| 45 to 54 Years | 52 (55.9%) | 41 (44.1%) |
| 55 to 64 Years | 105 (48.4%) | 112 (51.6%) |
| 65 to 74 Years | 66 (100.0%) | 0 (0.0%) |
| 75 Years and older | 62 (100.0%) | 0 (0.0%) |
| Total | 589 (53.6%) | 510 (46.4%) |
Health Insurance Coverage by Citizenship Status in Rancho Alegre
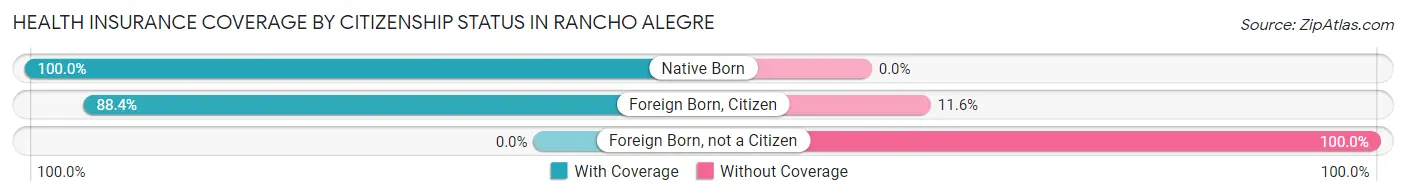
| Citizenship Status | With Coverage | Without Coverage |
| Native Born | 129 (100.0%) | 0 (0.0%) |
| Foreign Born, Citizen | 175 (88.4%) | 23 (11.6%) |
| Foreign Born, not a Citizen | 0 (0.0%) | 160 (100.0%) |
Health Insurance Coverage by Household Income in Rancho Alegre
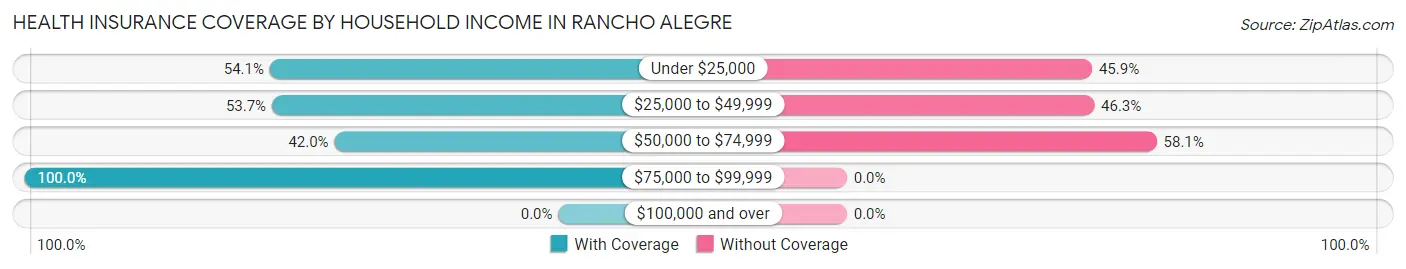
| Household Income | With Coverage | Without Coverage |
| Under $25,000 | 286 (54.1%) | 243 (45.9%) |
| $25,000 to $49,999 | 88 (53.7%) | 76 (46.3%) |
| $50,000 to $74,999 | 138 (41.9%) | 191 (58.1%) |
| $75,000 to $99,999 | 77 (100.0%) | 0 (0.0%) |
| $100,000 and over | 0 (0.0%) | 0 (0.0%) |
Public vs Private Health Insurance Coverage by Age in Rancho Alegre
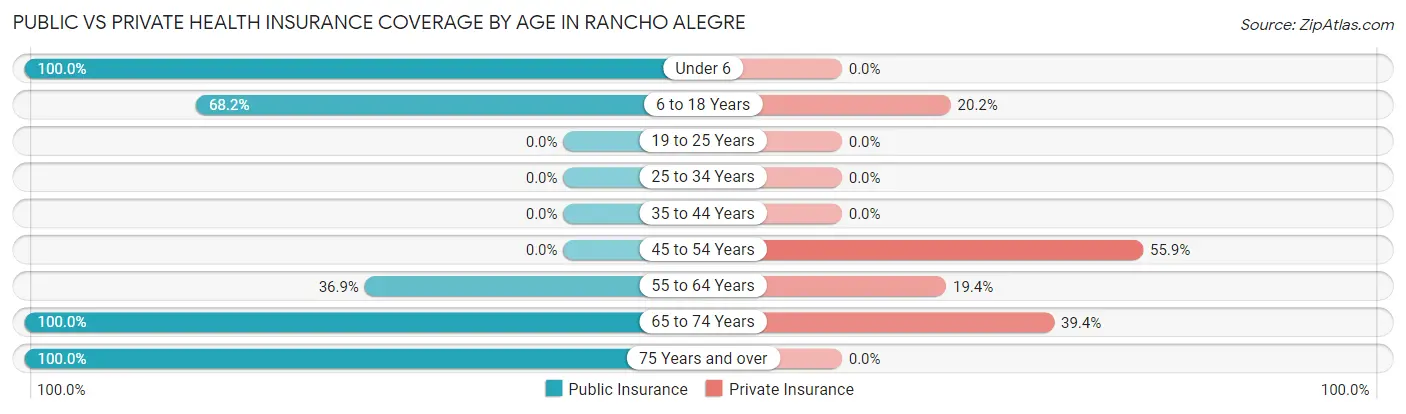
| Age Bracket | Public Insurance | Private Insurance |
| Under 6 | 129 (100.0%) | 0 (0.0%) |
| 6 to 18 Years | 135 (68.2%) | 40 (20.2%) |
| 19 to 25 Years | 0 (0.0%) | 0 (0.0%) |
| 25 to 34 Years | 0 (0.0%) | 0 (0.0%) |
| 35 to 44 Years | 0 (0.0%) | 0 (0.0%) |
| 45 to 54 Years | 0 (0.0%) | 52 (55.9%) |
| 55 to 64 Years | 80 (36.9%) | 42 (19.4%) |
| 65 to 74 Years | 66 (100.0%) | 26 (39.4%) |
| 75 Years and over | 62 (100.0%) | 0 (0.0%) |
| Total | 472 (42.9%) | 160 (14.6%) |
Disability Status by Sex by Age in Rancho Alegre
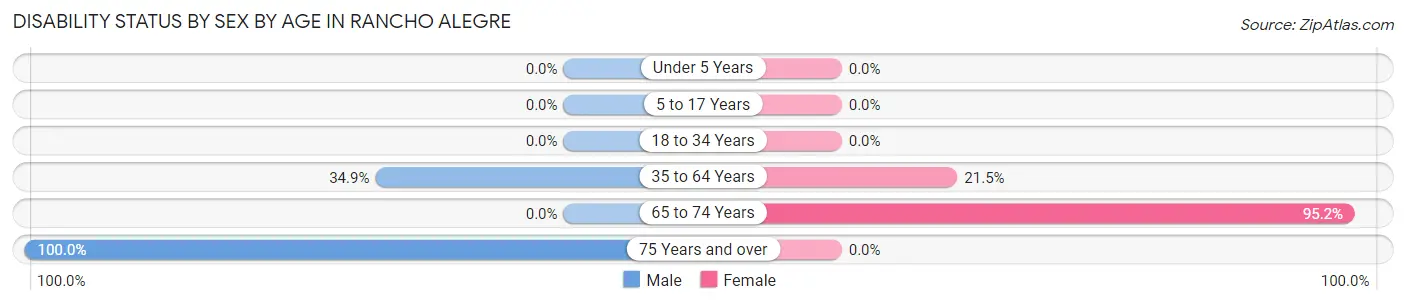
| Age Bracket | Male | Female |
| Under 5 Years | 0 (0.0%) | 0 (0.0%) |
| 5 to 17 Years | 0 (0.0%) | 0 (0.0%) |
| 18 to 34 Years | 0 (0.0%) | 0 (0.0%) |
| 35 to 64 Years | 44 (34.9%) | 44 (21.5%) |
| 65 to 74 Years | 0 (0.0%) | 40 (95.2%) |
| 75 Years and over | 62 (100.0%) | 0 (0.0%) |
Disability Class by Sex by Age in Rancho Alegre
Disability Class: Hearing Difficulty
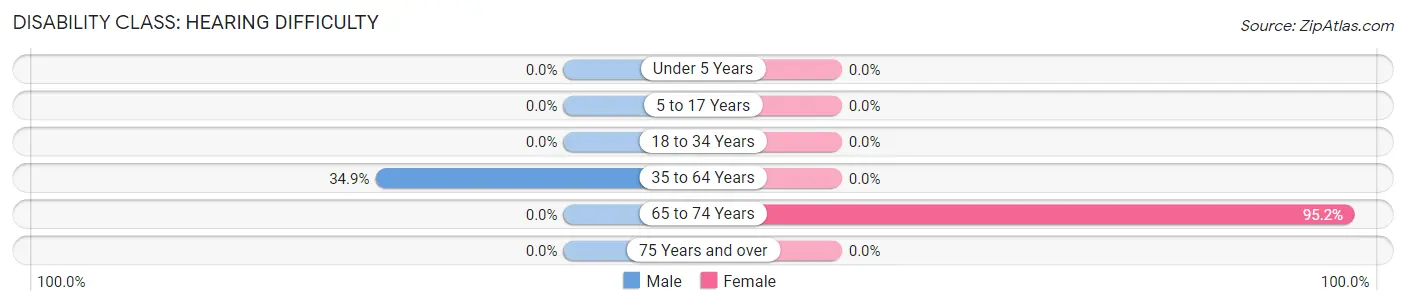
| Age Bracket | Male | Female |
| Under 5 Years | 0 (0.0%) | 0 (0.0%) |
| 5 to 17 Years | 0 (0.0%) | 0 (0.0%) |
| 18 to 34 Years | 0 (0.0%) | 0 (0.0%) |
| 35 to 64 Years | 44 (34.9%) | 0 (0.0%) |
| 65 to 74 Years | 0 (0.0%) | 40 (95.2%) |
| 75 Years and over | 0 (0.0%) | 0 (0.0%) |
Disability Class: Vision Difficulty
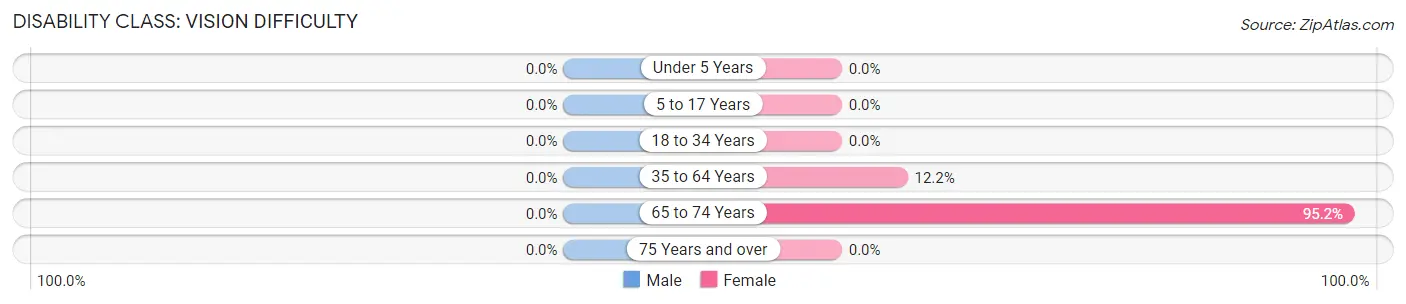
| Age Bracket | Male | Female |
| Under 5 Years | 0 (0.0%) | 0 (0.0%) |
| 5 to 17 Years | 0 (0.0%) | 0 (0.0%) |
| 18 to 34 Years | 0 (0.0%) | 0 (0.0%) |
| 35 to 64 Years | 0 (0.0%) | 25 (12.2%) |
| 65 to 74 Years | 0 (0.0%) | 40 (95.2%) |
| 75 Years and over | 0 (0.0%) | 0 (0.0%) |
Disability Class: Cognitive Difficulty
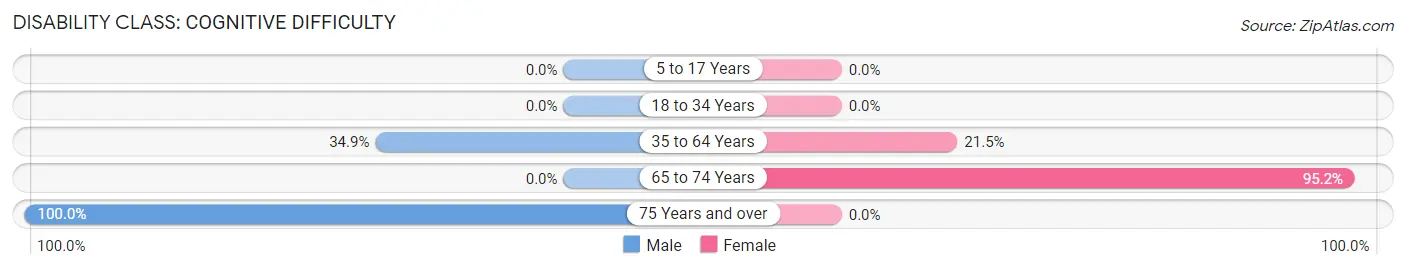
| Age Bracket | Male | Female |
| 5 to 17 Years | 0 (0.0%) | 0 (0.0%) |
| 18 to 34 Years | 0 (0.0%) | 0 (0.0%) |
| 35 to 64 Years | 44 (34.9%) | 44 (21.5%) |
| 65 to 74 Years | 0 (0.0%) | 40 (95.2%) |
| 75 Years and over | 62 (100.0%) | 0 (0.0%) |
Disability Class: Ambulatory Difficulty

| Age Bracket | Male | Female |
| 5 to 17 Years | 0 (0.0%) | 0 (0.0%) |
| 18 to 34 Years | 0 (0.0%) | 0 (0.0%) |
| 35 to 64 Years | 44 (34.9%) | 44 (21.5%) |
| 65 to 74 Years | 0 (0.0%) | 40 (95.2%) |
| 75 Years and over | 62 (100.0%) | 0 (0.0%) |
Disability Class: Self-Care Difficulty
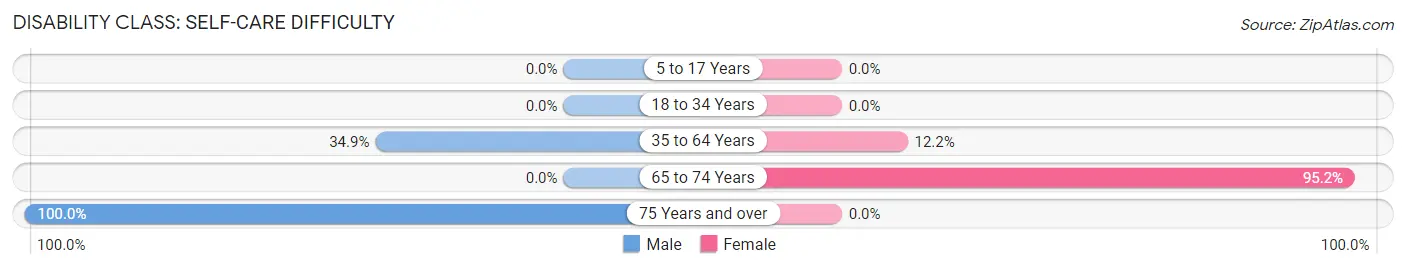
| Age Bracket | Male | Female |
| 5 to 17 Years | 0 (0.0%) | 0 (0.0%) |
| 18 to 34 Years | 0 (0.0%) | 0 (0.0%) |
| 35 to 64 Years | 44 (34.9%) | 25 (12.2%) |
| 65 to 74 Years | 0 (0.0%) | 40 (95.2%) |
| 75 Years and over | 62 (100.0%) | 0 (0.0%) |
Technology Access in Rancho Alegre
Computing Device Access in Rancho Alegre
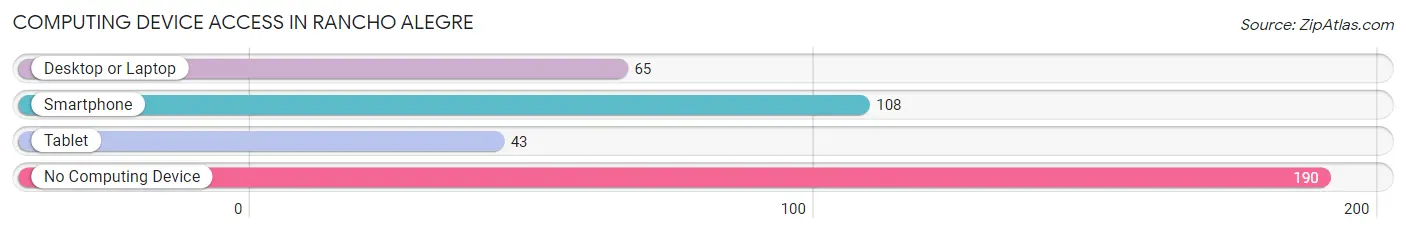
| Device Type | # Households | % Households |
| Desktop or Laptop | 65 | 21.8% |
| Smartphone | 108 | 36.2% |
| Tablet | 43 | 14.4% |
| No Computing Device | 190 | 63.8% |
| Total | 298 | 100.0% |
Internet Access in Rancho Alegre
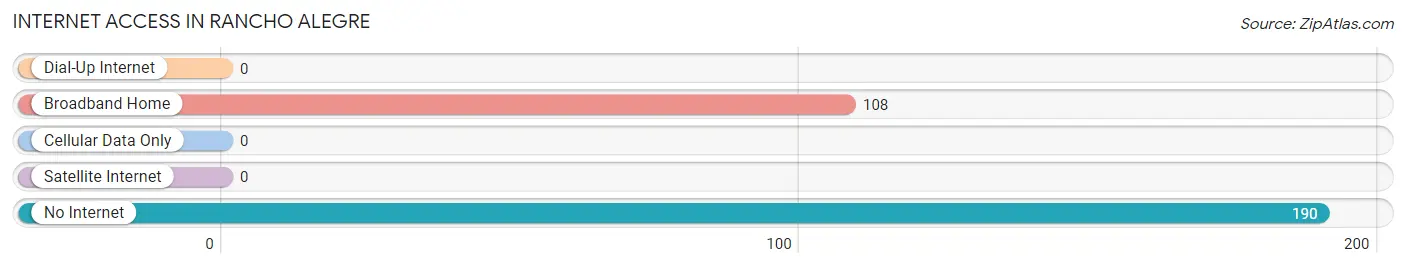
| Internet Type | # Households | % Households |
| Dial-Up Internet | 0 | 0.0% |
| Broadband Home | 108 | 36.2% |
| Cellular Data Only | 0 | 0.0% |
| Satellite Internet | 0 | 0.0% |
| No Internet | 190 | 63.8% |
| Total | 298 | 100.0% |
Rancho Alegre Summary
Rancho Alegre, Texas is a small unincorporated community located in Hidalgo County, Texas. It is situated about 10 miles south of the city of McAllen, and is part of the McAllen–Edinburg–Mission metropolitan area. The population of Rancho Alegre was estimated to be 1,845 in 2019.
History
Rancho Alegre was founded in the late 19th century by a group of Mexican settlers who were looking for a place to settle and farm. The name of the town is derived from the Spanish phrase “Rancho Alegre” which translates to “Happy Ranch”. The settlers chose this name because they were happy to have found a place to call home.
The town was originally a small farming community, but it has since grown to include a variety of businesses and services. The town is home to a number of small businesses, including a grocery store, a gas station, a post office, and a few restaurants.
Geography
Rancho Alegre is located in Hidalgo County, Texas. It is situated about 10 miles south of the city of McAllen, and is part of the McAllen–Edinburg–Mission metropolitan area. The town is located in the Rio Grande Valley, which is a region of Texas that is known for its fertile soil and warm climate.
The town is situated on the banks of the Rio Grande River, which forms the border between the United States and Mexico. The town is surrounded by agricultural land, and is home to a variety of crops, including cotton, corn, and sorghum.
Economy
Rancho Alegre is a small, rural community that is largely dependent on agriculture for its economic activity. The town is home to a number of small businesses, including a grocery store, a gas station, a post office, and a few restaurants.
The town is also home to a number of agricultural businesses, including a cotton gin, a grain elevator, and a feed mill. The town is also home to a number of small manufacturing businesses, including a furniture factory and a metal fabrication shop.
Demographics
Rancho Alegre is a predominantly Hispanic community. According to the 2019 census, the population of Rancho Alegre was estimated to be 1,845. Of this population, 97.3% identified as Hispanic or Latino, 1.2% identified as White, 0.7% identified as Black or African American, and 0.8% identified as Asian.
The median household income in Rancho Alegre was estimated to be $30,938 in 2019. The median home value was estimated to be $77,400 in 2019. The poverty rate in Rancho Alegre was estimated to be 28.3% in 2019.
Conclusion
Rancho Alegre, Texas is a small unincorporated community located in Hidalgo County, Texas. It is situated about 10 miles south of the city of McAllen, and is part of the McAllen–Edinburg–Mission metropolitan area. The population of Rancho Alegre was estimated to be 1,845 in 2019. The town is a predominantly Hispanic community, and is largely dependent on agriculture for its economic activity. The median household income in Rancho Alegre was estimated to be $30,938 in 2019, and the poverty rate was estimated to be 28.3%. Rancho Alegre is a small, rural community that is home to a variety of businesses and services, and is a great place to call home.
Common Questions
What is Per Capita Income in Rancho Alegre?
Per Capita income in Rancho Alegre is $7,635.
What is the Median Household income in Rancho Alegre?
Median Household Income in Rancho Alegre is $18,289.
What is Income or Wage Gap in Rancho Alegre?
Income or Wage Gap in Rancho Alegre is 46.9%.
Women in Rancho Alegre earn 53.1 cents for every dollar earned by a man.
What is Inequality or Gini Index in Rancho Alegre?
Inequality or Gini Index in Rancho Alegre is 0.46.
What is the Total Population of Rancho Alegre?
Total Population of Rancho Alegre is 1,099.
What is the Total Male Population of Rancho Alegre?
Total Male Population of Rancho Alegre is 577.
What is the Total Female Population of Rancho Alegre?
Total Female Population of Rancho Alegre is 522.
What is the Ratio of Males per 100 Females in Rancho Alegre?
There are 110.54 Males per 100 Females in Rancho Alegre.
What is the Ratio of Females per 100 Males in Rancho Alegre?
There are 90.47 Females per 100 Males in Rancho Alegre.
What is the Median Population Age in Rancho Alegre?
Median Population Age in Rancho Alegre is 29.4 Years.
What is the Average Family Size in Rancho Alegre
Average Family Size in Rancho Alegre is 4.9 People.
What is the Average Household Size in Rancho Alegre
Average Household Size in Rancho Alegre is 3.7 People.
How Large is the Labor Force in Rancho Alegre?
There are 264 People in the Labor Forcein in Rancho Alegre.
What is the Percentage of People in the Labor Force in Rancho Alegre?
31.6% of People are in the Labor Force in Rancho Alegre.