Doffing, TX Map & Demographics
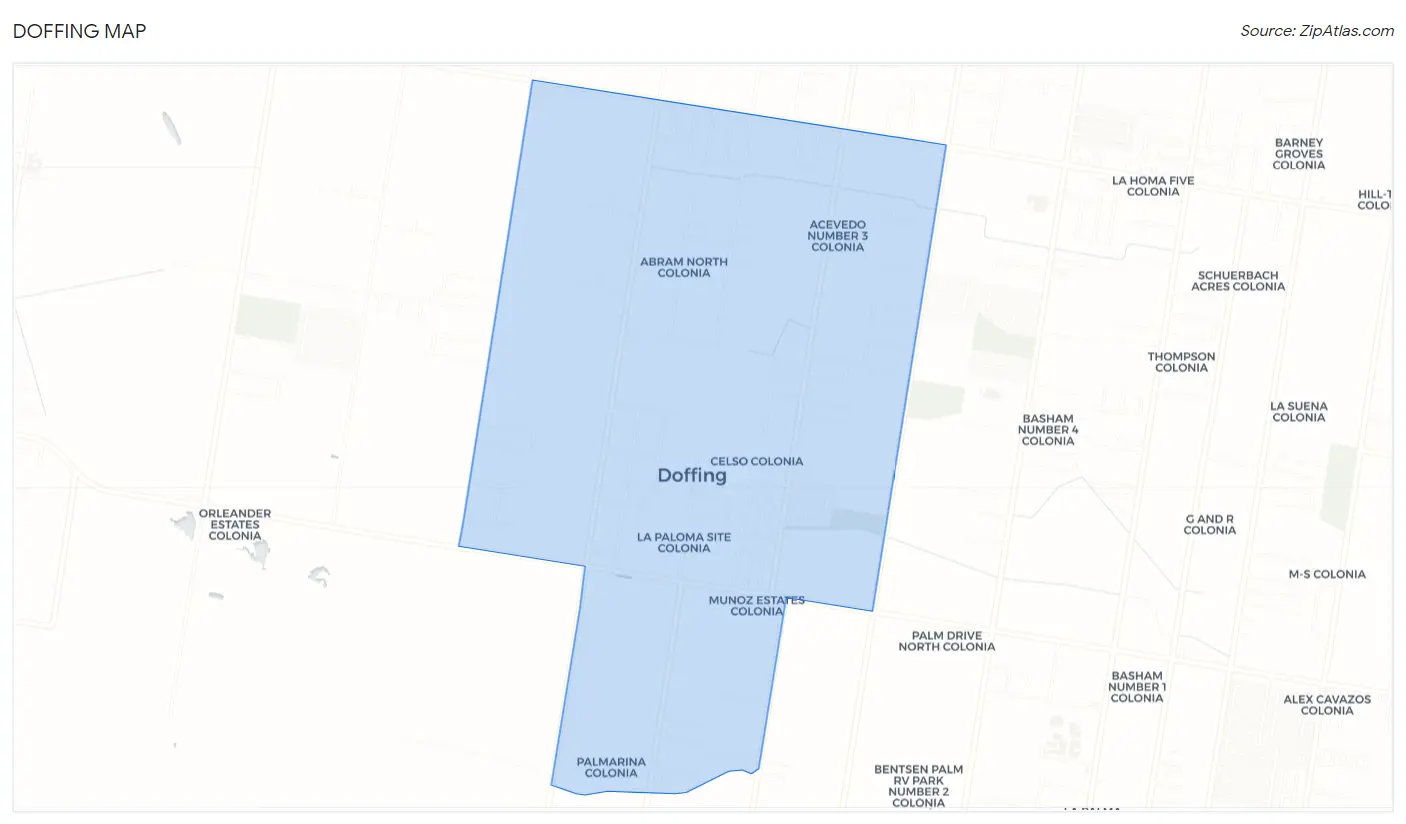
Doffing Map
Doffing Overview
$13,176
PER CAPITA INCOME
$24,346
AVG FAMILY INCOME
$24,404
AVG HOUSEHOLD INCOME
29.2%
WAGE / INCOME GAP [ % ]
70.8¢/ $1
WAGE / INCOME GAP [ $ ]
0.53
INEQUALITY / GINI INDEX
5,209
TOTAL POPULATION
2,632
MALE POPULATION
2,577
FEMALE POPULATION
102.13
MALES / 100 FEMALES
97.91
FEMALES / 100 MALES
26.1
MEDIAN AGE
4.4
AVG FAMILY SIZE
4.0
AVG HOUSEHOLD SIZE
1,848
LABOR FORCE [ PEOPLE ]
52.2%
PERCENT IN LABOR FORCE
5.4%
UNEMPLOYMENT RATE
Income in Doffing
Income Overview in Doffing
Per Capita Income in Doffing is $13,176, while median incomes of families and households are $24,346 and $24,404 respectively.
| Characteristic | Number | Measure |
| Per Capita Income | 5,209 | $13,176 |
| Median Family Income | 1,106 | $24,346 |
| Mean Family Income | 1,106 | $50,676 |
| Median Household Income | 1,289 | $24,404 |
| Mean Household Income | 1,289 | $49,486 |
| Income Deficit | 1,106 | $0 |
| Wage / Income Gap (%) | 5,209 | 29.22% |
| Wage / Income Gap ($) | 5,209 | 70.78¢ per $1 |
| Gini / Inequality Index | 5,209 | 0.53 |
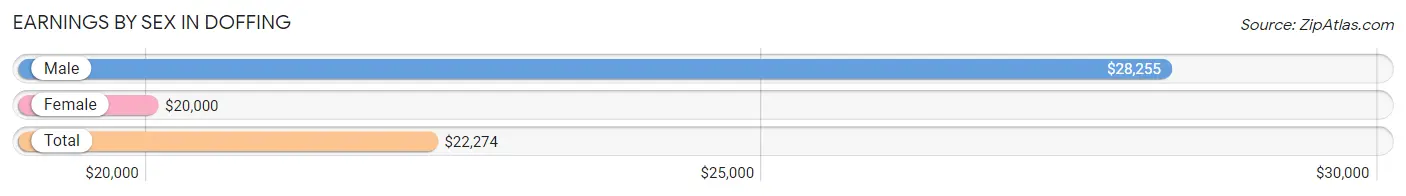
Earnings by Sex in Doffing
Average Earnings in Doffing are $22,274, $28,255 for men and $20,000 for women, a difference of 29.2%.
| Sex | Number | Average Earnings |
| Male | 1,042 (56.6%) | $28,255 |
| Female | 800 (43.4%) | $20,000 |
| Total | 1,842 (100.0%) | $22,274 |
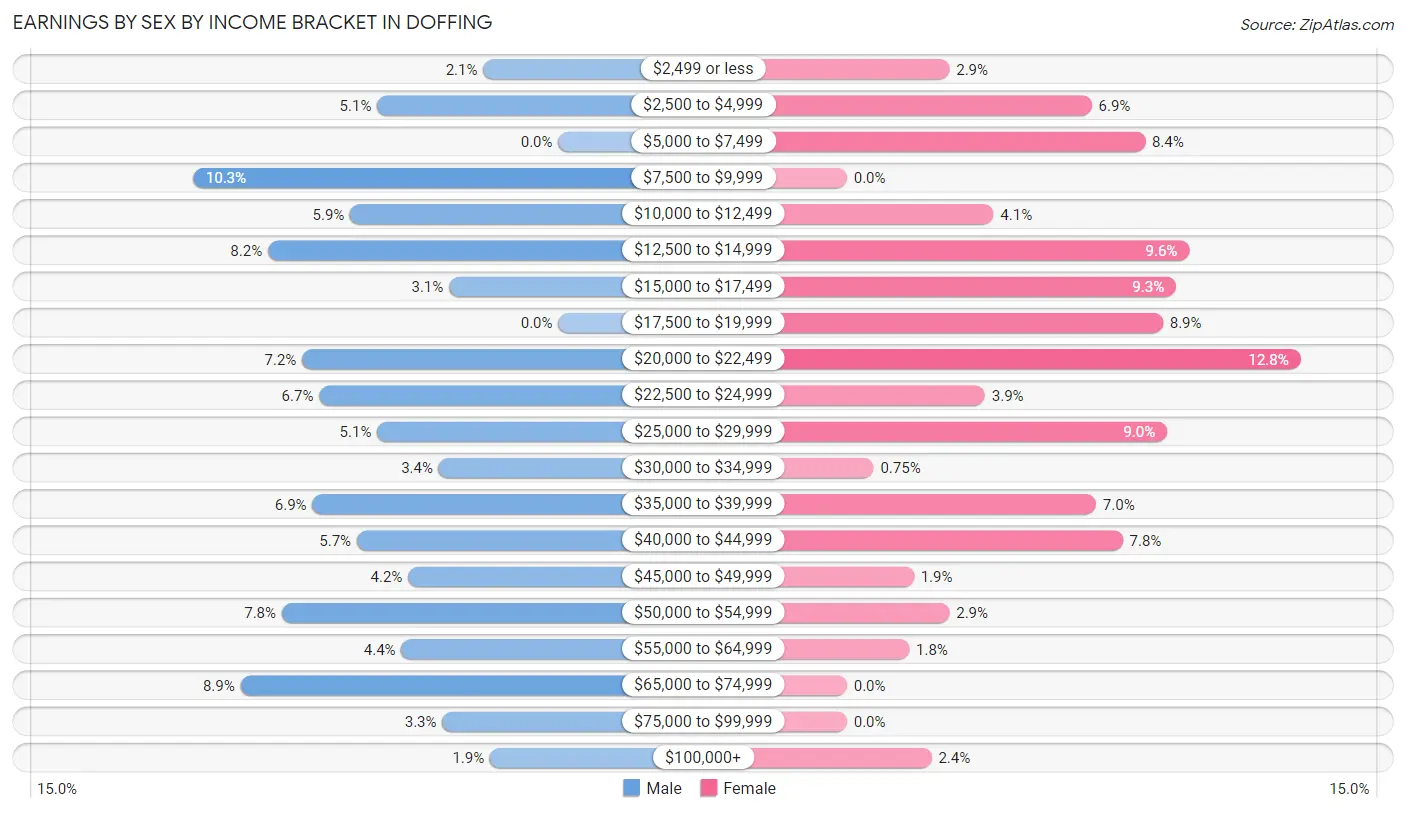
Earnings by Sex by Income Bracket in Doffing
The most common earnings brackets in Doffing are $7,500 to $9,999 for men (107 | 10.3%) and $20,000 to $22,499 for women (102 | 12.8%).
| Income | Male | Female |
| $2,499 or less | 22 (2.1%) | 23 (2.9%) |
| $2,500 to $4,999 | 53 (5.1%) | 55 (6.9%) |
| $5,000 to $7,499 | 0 (0.0%) | 67 (8.4%) |
| $7,500 to $9,999 | 107 (10.3%) | 0 (0.0%) |
| $10,000 to $12,499 | 61 (5.9%) | 33 (4.1%) |
| $12,500 to $14,999 | 85 (8.2%) | 77 (9.6%) |
| $15,000 to $17,499 | 32 (3.1%) | 74 (9.2%) |
| $17,500 to $19,999 | 0 (0.0%) | 71 (8.9%) |
| $20,000 to $22,499 | 75 (7.2%) | 102 (12.8%) |
| $22,500 to $24,999 | 70 (6.7%) | 31 (3.9%) |
| $25,000 to $29,999 | 53 (5.1%) | 72 (9.0%) |
| $30,000 to $34,999 | 35 (3.4%) | 6 (0.7%) |
| $35,000 to $39,999 | 72 (6.9%) | 56 (7.0%) |
| $40,000 to $44,999 | 59 (5.7%) | 62 (7.7%) |
| $45,000 to $49,999 | 44 (4.2%) | 15 (1.9%) |
| $50,000 to $54,999 | 81 (7.8%) | 23 (2.9%) |
| $55,000 to $64,999 | 46 (4.4%) | 14 (1.8%) |
| $65,000 to $74,999 | 93 (8.9%) | 0 (0.0%) |
| $75,000 to $99,999 | 34 (3.3%) | 0 (0.0%) |
| $100,000+ | 20 (1.9%) | 19 (2.4%) |
| Total | 1,042 (100.0%) | 800 (100.0%) |
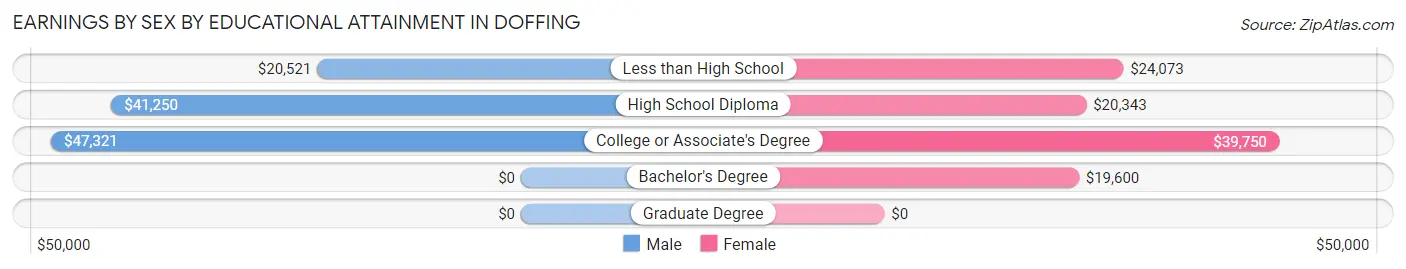
Earnings by Sex by Educational Attainment in Doffing
Average earnings in Doffing are $29,764 for men and $21,483 for women, a difference of 27.8%. Men with an educational attainment of college or associate's degree enjoy the highest average annual earnings of $47,321, while those with less than high school education earn the least with $20,521. Women with an educational attainment of college or associate's degree earn the most with the average annual earnings of $39,750, while those with bachelor's degree education have the smallest earnings of $19,600.
| Educational Attainment | Male Income | Female Income |
| Less than High School | $20,521 | $24,073 |
| High School Diploma | $41,250 | $20,343 |
| College or Associate's Degree | $47,321 | $39,750 |
| Bachelor's Degree | - | - |
| Graduate Degree | - | - |
| Total | $29,764 | $21,483 |
Family Income in Doffing
Family Income Brackets in Doffing
According to the Doffing family income data, there are 371 families falling into the $15,000 to $24,999 income range, which is the most common income bracket and makes up 33.5% of all families. Conversely, the $25,000 to $34,999 income bracket is the least frequent group with only 21 families (1.9%) belonging to this category.
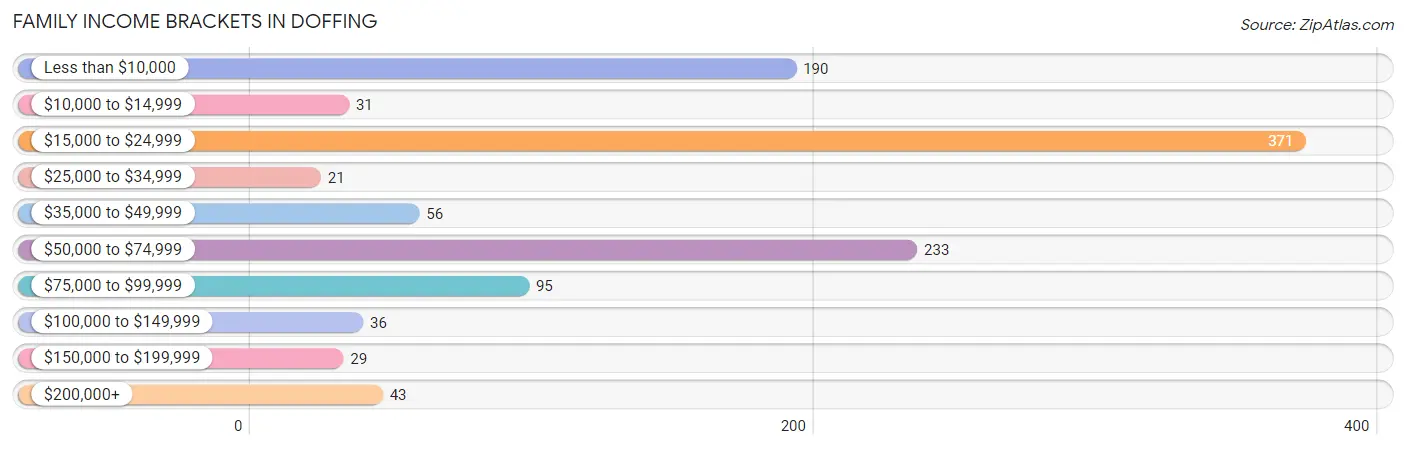
| Income Bracket | # Families | % Families |
| Less than $10,000 | 190 | 17.2% |
| $10,000 to $14,999 | 31 | 2.8% |
| $15,000 to $24,999 | 371 | 33.5% |
| $25,000 to $34,999 | 21 | 1.9% |
| $35,000 to $49,999 | 56 | 5.1% |
| $50,000 to $74,999 | 233 | 21.1% |
| $75,000 to $99,999 | 95 | 8.6% |
| $100,000 to $149,999 | 36 | 3.3% |
| $150,000 to $199,999 | 29 | 2.6% |
| $200,000+ | 43 | 3.9% |
Family Income by Famaliy Size in Doffing
4-person families (145 | 13.1%) account for the highest median family income in Doffing with $73,403 per family, while 4-person families (145 | 13.1%) have the highest median income of $18,351 per family member.
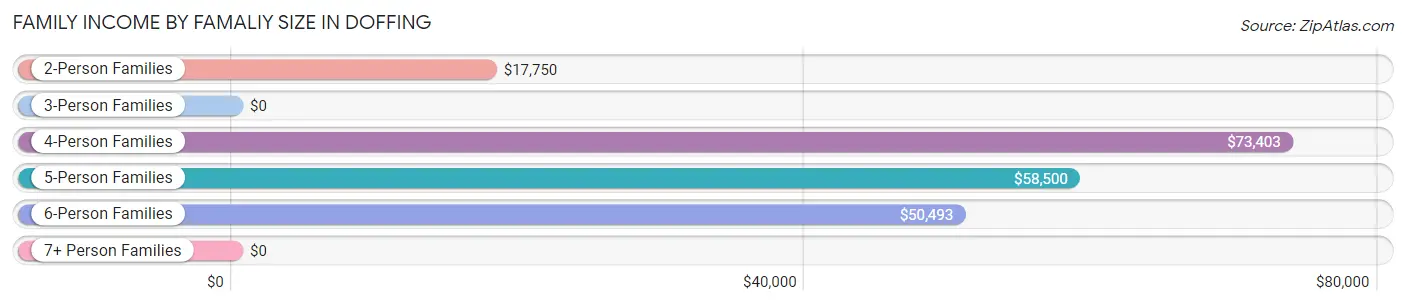
| Income Bracket | # Families | Median Income |
| 2-Person Families | 388 (35.1%) | $17,750 |
| 3-Person Families | 153 (13.8%) | $0 |
| 4-Person Families | 145 (13.1%) | $73,403 |
| 5-Person Families | 196 (17.7%) | $58,500 |
| 6-Person Families | 85 (7.7%) | $50,493 |
| 7+ Person Families | 139 (12.6%) | $0 |
| Total | 1,106 (100.0%) | $24,346 |
Family Income by Number of Earners in Doffing
The median family income in Doffing is $24,346, with families comprising 3+ earners (235) having the highest median family income of $91,005, while families with no earners (300) have the lowest median family income of $15,858, accounting for 21.2% and 27.1% of families, respectively.
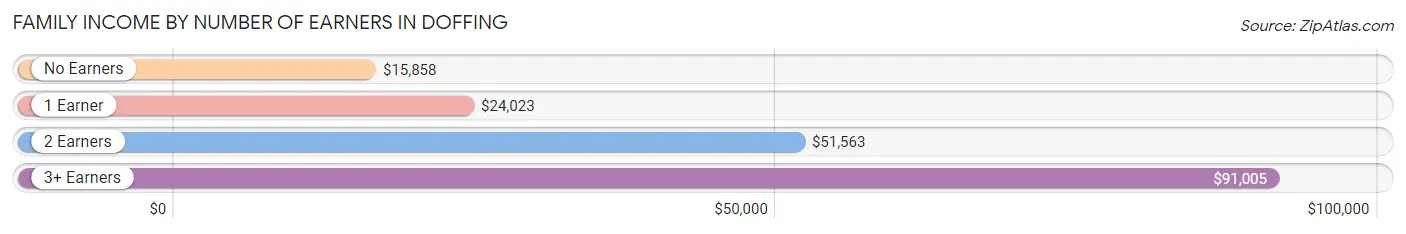
| Number of Earners | # Families | Median Income |
| No Earners | 300 (27.1%) | $15,858 |
| 1 Earner | 393 (35.5%) | $24,023 |
| 2 Earners | 178 (16.1%) | $51,563 |
| 3+ Earners | 235 (21.2%) | $91,005 |
| Total | 1,106 (100.0%) | $24,346 |
Household Income in Doffing
Household Income Brackets in Doffing
With 403 households falling in the category, the $15,000 to $24,999 income range is the most frequent in Doffing, accounting for 31.3% of all households. In contrast, only 28 households (2.2%) fall into the $150,000 to $199,999 income bracket, making it the least populous group.
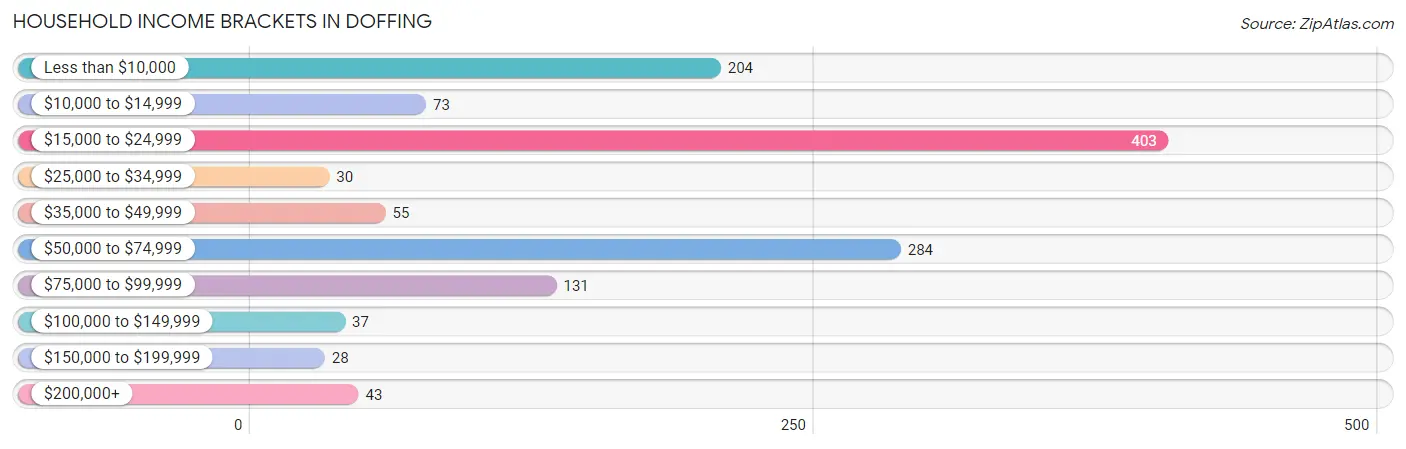
| Income Bracket | # Households | % Households |
| Less than $10,000 | 204 | 15.8% |
| $10,000 to $14,999 | 73 | 5.7% |
| $15,000 to $24,999 | 403 | 31.3% |
| $25,000 to $34,999 | 30 | 2.3% |
| $35,000 to $49,999 | 55 | 4.3% |
| $50,000 to $74,999 | 284 | 22.0% |
| $75,000 to $99,999 | 131 | 10.2% |
| $100,000 to $149,999 | 37 | 2.9% |
| $150,000 to $199,999 | 28 | 2.2% |
| $200,000+ | 43 | 3.3% |
Household Income by Householder Age in Doffing
The median household income in Doffing is $24,404, with the highest median household income of $52,340 found in the 25 to 44 years age bracket for the primary householder. A total of 384 households (29.8%) fall into this category. Meanwhile, the 15 to 24 years age bracket for the primary householder has the lowest median household income of $0, with 18 households (1.4%) in this group.
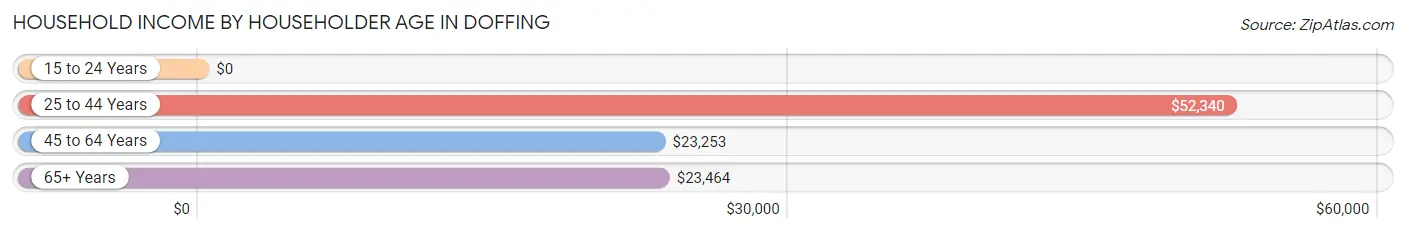
| Income Bracket | # Households | Median Income |
| 15 to 24 Years | 18 (1.4%) | $0 |
| 25 to 44 Years | 384 (29.8%) | $52,340 |
| 45 to 64 Years | 728 (56.5%) | $23,253 |
| 65+ Years | 159 (12.3%) | $23,464 |
| Total | 1,289 (100.0%) | $24,404 |
Poverty in Doffing
Income Below Poverty by Sex and Age in Doffing
With 33.0% poverty level for males and 48.9% for females among the residents of Doffing, 16 and 17 year old males and 6 to 11 year old females are the most vulnerable to poverty, with 50 males (71.4%) and 140 females (77.8%) in their respective age groups living below the poverty level.
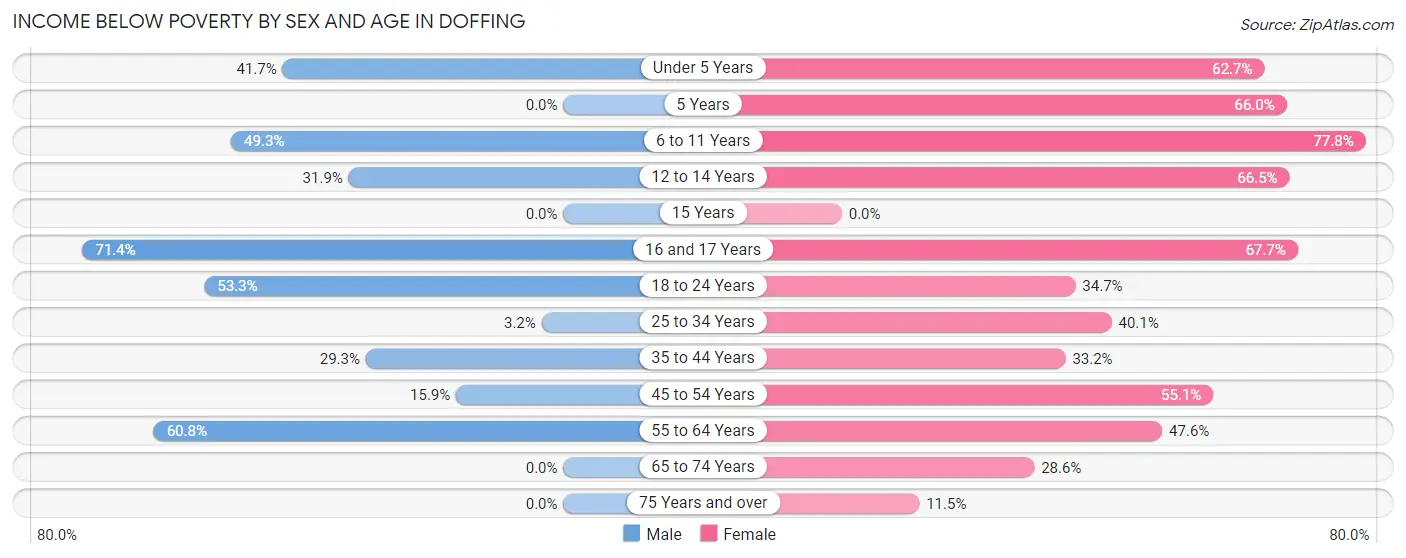
| Age Bracket | Male | Female |
| Under 5 Years | 98 (41.7%) | 202 (62.7%) |
| 5 Years | 0 (0.0%) | 35 (66.0%) |
| 6 to 11 Years | 216 (49.3%) | 140 (77.8%) |
| 12 to 14 Years | 51 (31.9%) | 113 (66.5%) |
| 15 Years | 0 (0.0%) | 0 (0.0%) |
| 16 and 17 Years | 50 (71.4%) | 44 (67.7%) |
| 18 to 24 Years | 153 (53.3%) | 85 (34.7%) |
| 25 to 34 Years | 14 (3.2%) | 157 (40.1%) |
| 35 to 44 Years | 76 (29.3%) | 90 (33.2%) |
| 45 to 54 Years | 50 (15.9%) | 263 (55.1%) |
| 55 to 64 Years | 149 (60.8%) | 88 (47.6%) |
| 65 to 74 Years | 0 (0.0%) | 14 (28.6%) |
| 75 Years and over | 0 (0.0%) | 13 (11.5%) |
| Total | 857 (33.0%) | 1,244 (48.9%) |
Income Above Poverty by Sex and Age in Doffing
According to the poverty statistics in Doffing, males aged 15 years and females aged 15 years are the age groups that are most secure financially, with 100.0% of males and 100.0% of females in these age groups living above the poverty line.
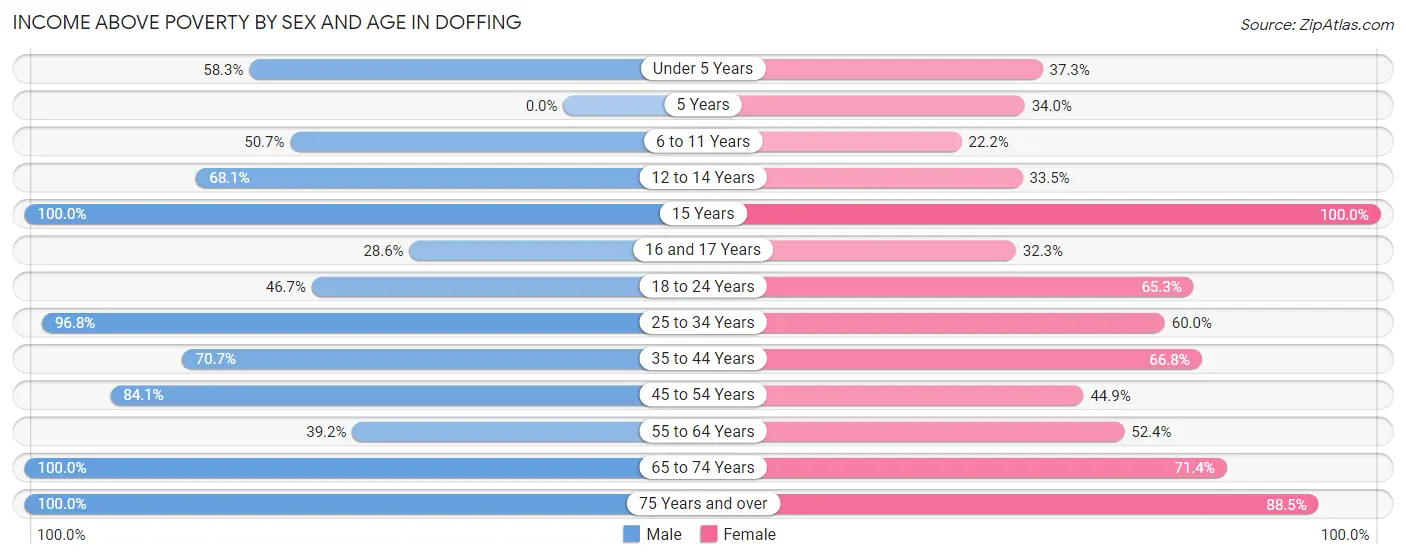
| Age Bracket | Male | Female |
| Under 5 Years | 137 (58.3%) | 120 (37.3%) |
| 5 Years | 0 (0.0%) | 18 (34.0%) |
| 6 to 11 Years | 222 (50.7%) | 40 (22.2%) |
| 12 to 14 Years | 109 (68.1%) | 57 (33.5%) |
| 15 Years | 22 (100.0%) | 24 (100.0%) |
| 16 and 17 Years | 20 (28.6%) | 21 (32.3%) |
| 18 to 24 Years | 134 (46.7%) | 160 (65.3%) |
| 25 to 34 Years | 420 (96.8%) | 235 (60.0%) |
| 35 to 44 Years | 183 (70.7%) | 181 (66.8%) |
| 45 to 54 Years | 264 (84.1%) | 214 (44.9%) |
| 55 to 64 Years | 96 (39.2%) | 97 (52.4%) |
| 65 to 74 Years | 54 (100.0%) | 35 (71.4%) |
| 75 Years and over | 81 (100.0%) | 100 (88.5%) |
| Total | 1,742 (67.0%) | 1,302 (51.1%) |
Income Below Poverty Among Married-Couple Families in Doffing
The poverty statistics for married-couple families in Doffing show that 27.4% or 174 of the total 636 families live below the poverty line. Families with 3 or 4 children have the highest poverty rate of 31.8%, comprising of 57 families. On the other hand, families with 5 or more children have the lowest poverty rate of 0.0%, which includes 0 families.
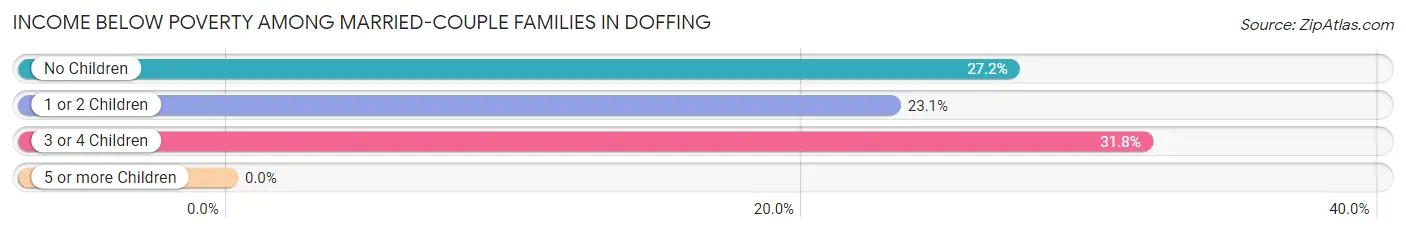
| Children | Above Poverty | Below Poverty |
| No Children | 273 (72.8%) | 102 (27.2%) |
| 1 or 2 Children | 50 (76.9%) | 15 (23.1%) |
| 3 or 4 Children | 122 (68.2%) | 57 (31.8%) |
| 5 or more Children | 17 (100.0%) | 0 (0.0%) |
| Total | 462 (72.6%) | 174 (27.4%) |
Income Below Poverty Among Single-Parent Households in Doffing
According to the poverty data in Doffing, 58.5% or 24 single-father households and 59.0% or 253 single-mother households are living below the poverty line. Among single-father households, those with 1 or 2 children have the highest poverty rate, with 24 households (58.5%) experiencing poverty. Likewise, among single-mother households, those with 3 or 4 children have the highest poverty rate, with 10 households (100.0%) falling below the poverty line.
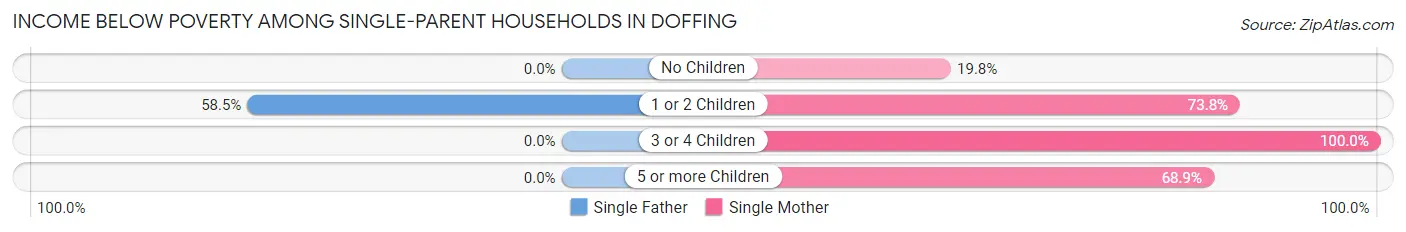
| Children | Single Father | Single Mother |
| No Children | 0 (0.0%) | 23 (19.8%) |
| 1 or 2 Children | 24 (58.5%) | 169 (73.8%) |
| 3 or 4 Children | 0 (0.0%) | 10 (100.0%) |
| 5 or more Children | 0 (0.0%) | 51 (68.9%) |
| Total | 24 (58.5%) | 253 (59.0%) |
Income Below Poverty Among Married-Couple vs Single-Parent Households in Doffing
The poverty data for Doffing shows that 174 of the married-couple family households (27.4%) and 277 of the single-parent households (58.9%) are living below the poverty level. Within the married-couple family households, those with 3 or 4 children have the highest poverty rate, with 57 households (31.8%) falling below the poverty line. Among the single-parent households, those with 3 or 4 children have the highest poverty rate, with 10 household (100.0%) living below poverty.
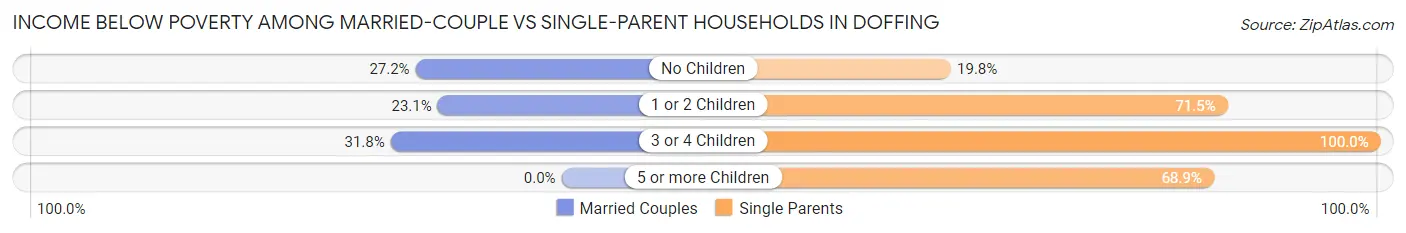
| Children | Married-Couple Families | Single-Parent Households |
| No Children | 102 (27.2%) | 23 (19.8%) |
| 1 or 2 Children | 15 (23.1%) | 193 (71.5%) |
| 3 or 4 Children | 57 (31.8%) | 10 (100.0%) |
| 5 or more Children | 0 (0.0%) | 51 (68.9%) |
| Total | 174 (27.4%) | 277 (58.9%) |
Race in Doffing
The most populous races in Doffing are Hispanic or Latino (5,189 | 99.6%), White / Caucasian (3,144 | 60.4%), and Two or more Races (1,931 | 37.1%).
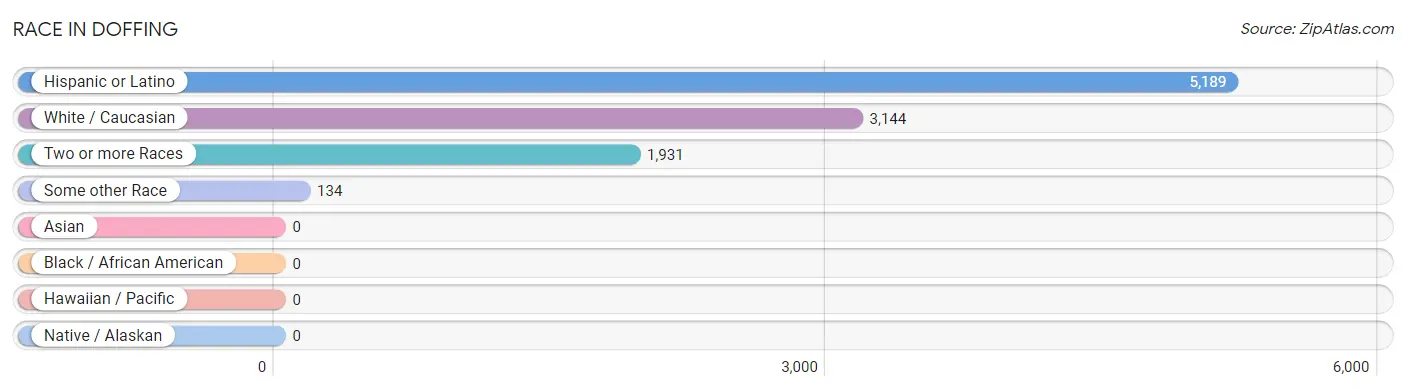
| Race | # Population | % Population |
| Asian | 0 | 0.0% |
| Black / African American | 0 | 0.0% |
| Hawaiian / Pacific | 0 | 0.0% |
| Hispanic or Latino | 5,189 | 99.6% |
| Native / Alaskan | 0 | 0.0% |
| White / Caucasian | 3,144 | 60.4% |
| Two or more Races | 1,931 | 37.1% |
| Some other Race | 134 | 2.6% |
| Total | 5,209 | 100.0% |
Ancestry in Doffing
The most populous ancestries reported in Doffing are Mexican (4,980 | 95.6%), Central American (149 | 2.9%), Salvadoran (91 | 1.8%), German (32 | 0.6%), and Guatemalan (29 | 0.6%), together accounting for 101.4% of all Doffing residents.
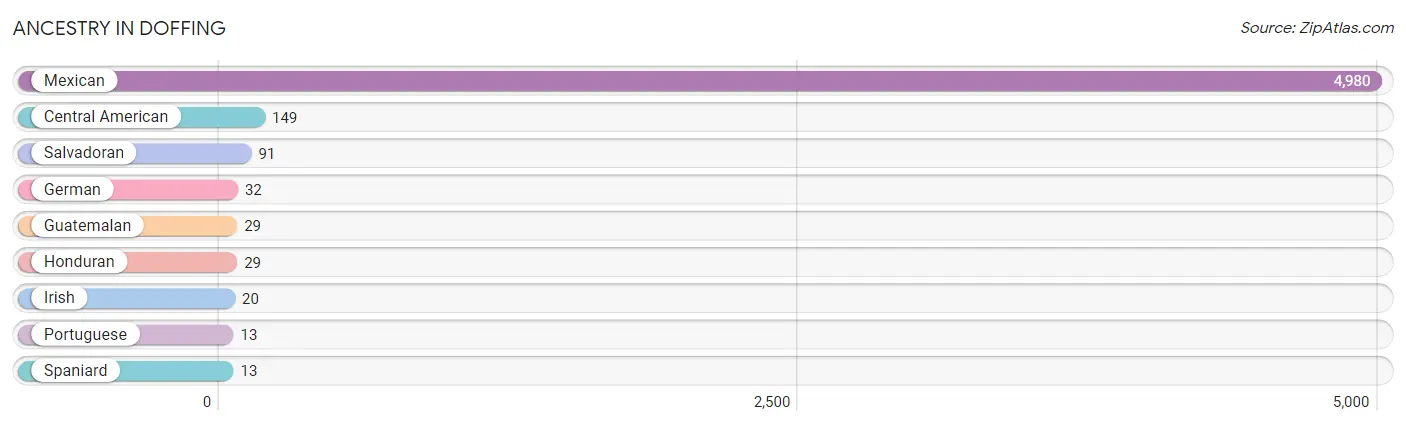
| Ancestry | # Population | % Population |
| Central American | 149 | 2.9% |
| German | 32 | 0.6% |
| Guatemalan | 29 | 0.6% |
| Honduran | 29 | 0.6% |
| Irish | 20 | 0.4% |
| Mexican | 4,980 | 95.6% |
| Portuguese | 13 | 0.3% |
| Salvadoran | 91 | 1.8% |
| Spaniard | 13 | 0.3% | View All 9 Rows |
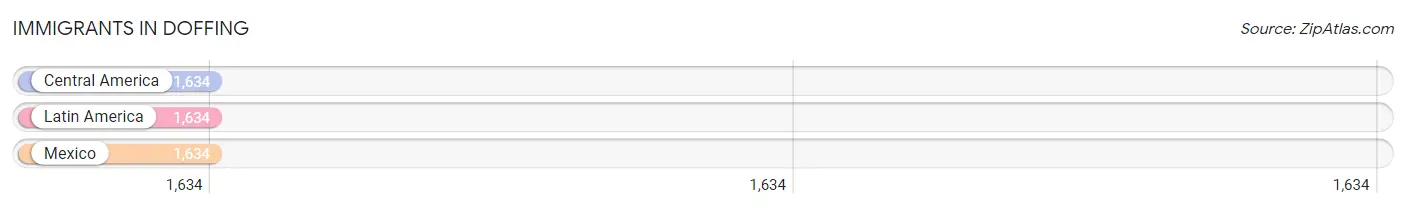
Immigrants in Doffing
The most numerous immigrant groups reported in Doffing came from Central America (1,634 | 31.4%), Latin America (1,634 | 31.4%), and Mexico (1,634 | 31.4%), together accounting for 94.1% of all Doffing residents.
| Immigration Origin | # Population | % Population |
| Central America | 1,634 | 31.4% |
| Latin America | 1,634 | 31.4% |
| Mexico | 1,634 | 31.4% | View All 3 Rows |
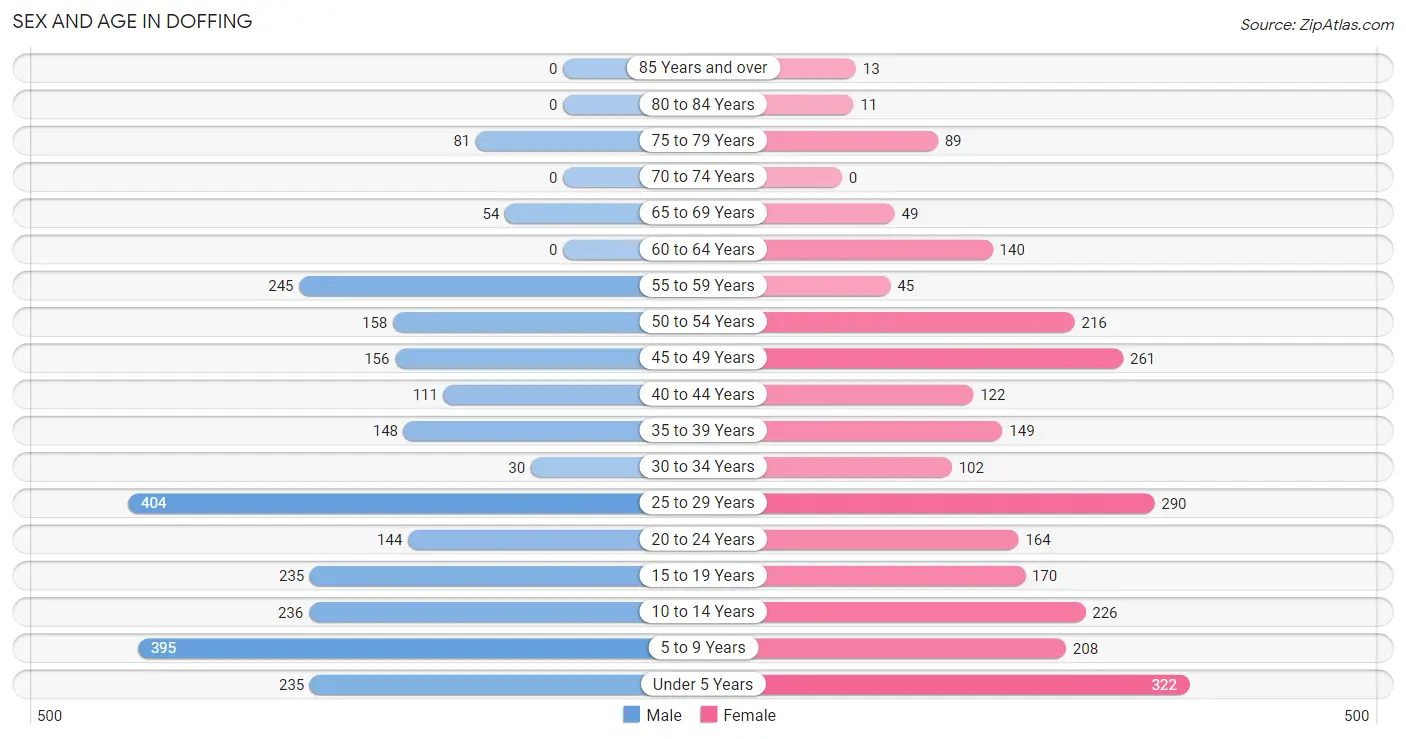
Sex and Age in Doffing
Sex and Age in Doffing
The most populous age groups in Doffing are 25 to 29 Years (404 | 15.3%) for men and Under 5 Years (322 | 12.5%) for women.
| Age Bracket | Male | Female |
| Under 5 Years | 235 (8.9%) | 322 (12.5%) |
| 5 to 9 Years | 395 (15.0%) | 208 (8.1%) |
| 10 to 14 Years | 236 (9.0%) | 226 (8.8%) |
| 15 to 19 Years | 235 (8.9%) | 170 (6.6%) |
| 20 to 24 Years | 144 (5.5%) | 164 (6.4%) |
| 25 to 29 Years | 404 (15.3%) | 290 (11.3%) |
| 30 to 34 Years | 30 (1.1%) | 102 (4.0%) |
| 35 to 39 Years | 148 (5.6%) | 149 (5.8%) |
| 40 to 44 Years | 111 (4.2%) | 122 (4.7%) |
| 45 to 49 Years | 156 (5.9%) | 261 (10.1%) |
| 50 to 54 Years | 158 (6.0%) | 216 (8.4%) |
| 55 to 59 Years | 245 (9.3%) | 45 (1.8%) |
| 60 to 64 Years | 0 (0.0%) | 140 (5.4%) |
| 65 to 69 Years | 54 (2.1%) | 49 (1.9%) |
| 70 to 74 Years | 0 (0.0%) | 0 (0.0%) |
| 75 to 79 Years | 81 (3.1%) | 89 (3.5%) |
| 80 to 84 Years | 0 (0.0%) | 11 (0.4%) |
| 85 Years and over | 0 (0.0%) | 13 (0.5%) |
| Total | 2,632 (100.0%) | 2,577 (100.0%) |
Families and Households in Doffing
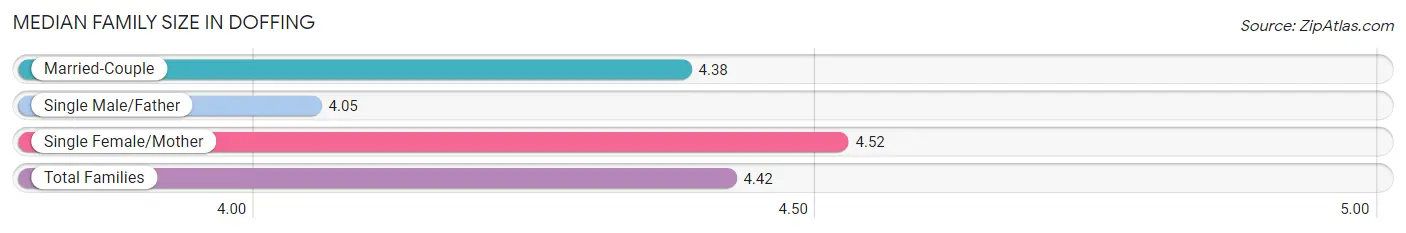
Median Family Size in Doffing
The median family size in Doffing is 4.42 persons per family, with single female/mother families (429 | 38.8%) accounting for the largest median family size of 4.52 persons per family. On the other hand, single male/father families (41 | 3.7%) represent the smallest median family size with 4.05 persons per family.
| Family Type | # Families | Family Size |
| Married-Couple | 636 (57.5%) | 4.38 |
| Single Male/Father | 41 (3.7%) | 4.05 |
| Single Female/Mother | 429 (38.8%) | 4.52 |
| Total Families | 1,106 (100.0%) | 4.42 |
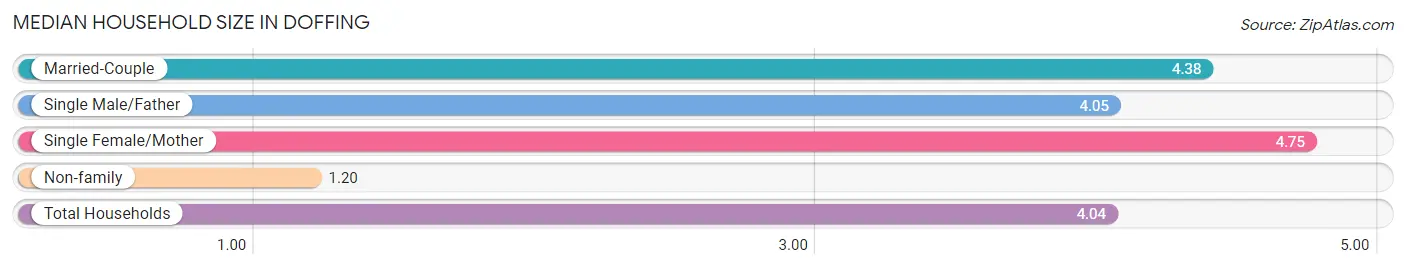
Median Household Size in Doffing
The median household size in Doffing is 4.04 persons per household, with single female/mother households (429 | 33.3%) accounting for the largest median household size of 4.75 persons per household. non-family households (183 | 14.2%) represent the smallest median household size with 1.20 persons per household.
| Household Type | # Households | Household Size |
| Married-Couple | 636 (49.3%) | 4.38 |
| Single Male/Father | 41 (3.2%) | 4.05 |
| Single Female/Mother | 429 (33.3%) | 4.75 |
| Non-family | 183 (14.2%) | 1.20 |
| Total Households | 1,289 (100.0%) | 4.04 |
Household Size by Marriage Status in Doffing
Out of a total of 1,289 households in Doffing, 1,106 (85.8%) are family households, while 183 (14.2%) are nonfamily households. The most numerous type of family households are 2-person households, comprising 388, and the most common type of nonfamily households are 1-person households, comprising 147.
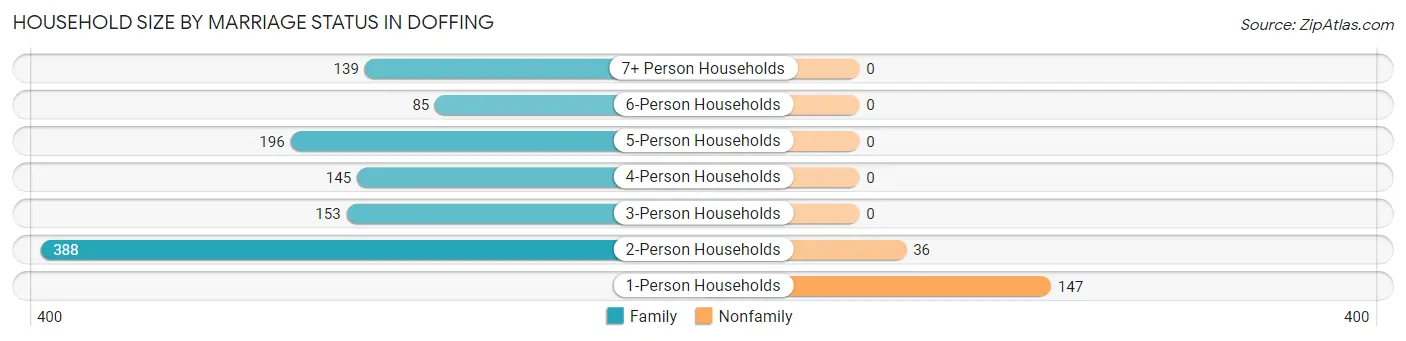
| Household Size | Family Households | Nonfamily Households |
| 1-Person Households | - | 147 (11.4%) |
| 2-Person Households | 388 (30.1%) | 36 (2.8%) |
| 3-Person Households | 153 (11.9%) | 0 (0.0%) |
| 4-Person Households | 145 (11.3%) | 0 (0.0%) |
| 5-Person Households | 196 (15.2%) | 0 (0.0%) |
| 6-Person Households | 85 (6.6%) | 0 (0.0%) |
| 7+ Person Households | 139 (10.8%) | 0 (0.0%) |
| Total | 1,106 (85.8%) | 183 (14.2%) |
Female Fertility in Doffing
Fertility by Age in Doffing
Average fertility rate in Doffing is 92.0 births per 1,000 women. Women in the age bracket of 20 to 34 years have the highest fertility rate with 216.0 births per 1,000 women. Women in the age bracket of 20 to 34 years acount for 100.0% of all women with births.
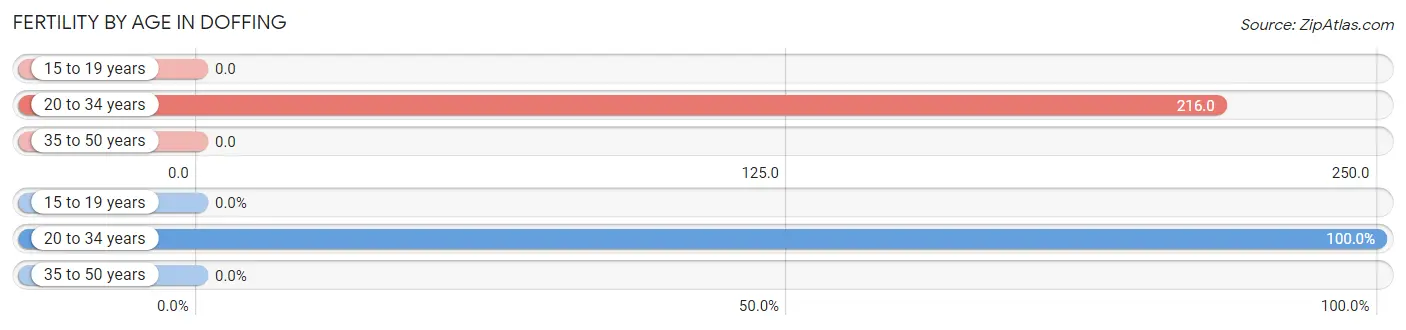
| Age Bracket | Women with Births | Births / 1,000 Women |
| 15 to 19 years | 0 (0.0%) | 0.0 |
| 20 to 34 years | 120 (100.0%) | 216.0 |
| 35 to 50 years | 0 (0.0%) | 0.0 |
| Total | 120 (100.0%) | 92.0 |
Fertility by Age by Marriage Status in Doffing
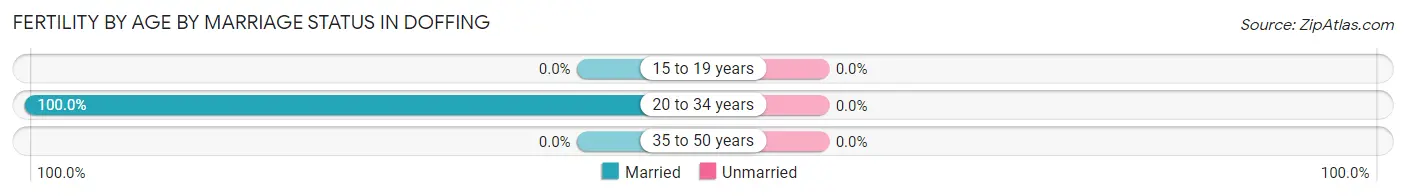
| Age Bracket | Married | Unmarried |
| 15 to 19 years | 0 (0.0%) | 0 (0.0%) |
| 20 to 34 years | 120 (100.0%) | 0 (0.0%) |
| 35 to 50 years | 0 (0.0%) | 0 (0.0%) |
| Total | 120 (100.0%) | 0 (0.0%) |
Fertility by Education in Doffing
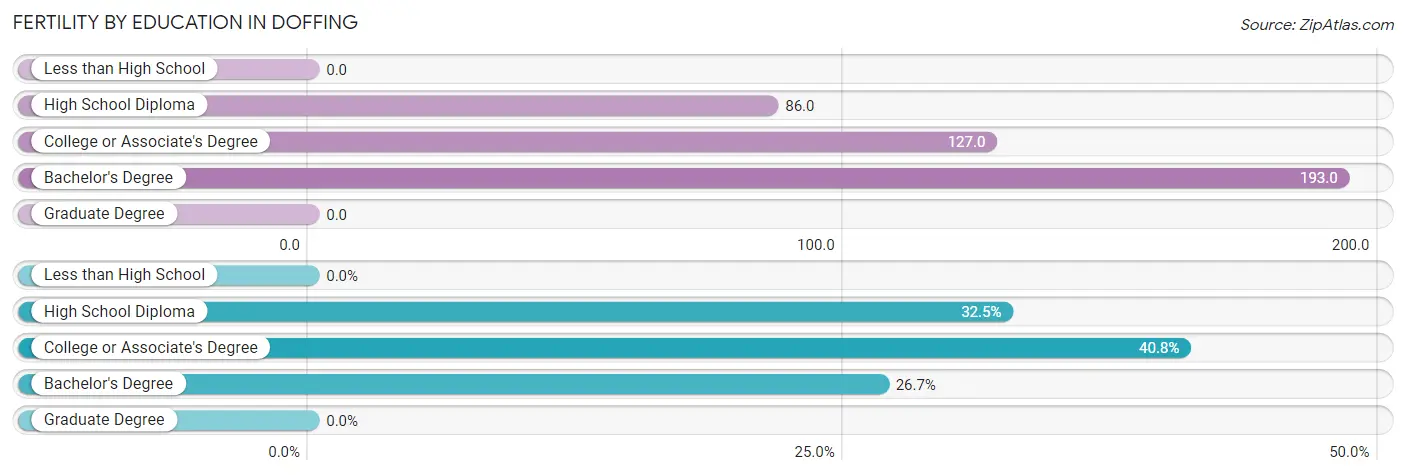
| Educational Attainment | Women with Births | Births / 1,000 Women |
| Less than High School | 0 (0.0%) | 0.0 |
| High School Diploma | 39 (32.5%) | 86.0 |
| College or Associate's Degree | 49 (40.8%) | 127.0 |
| Bachelor's Degree | 32 (26.7%) | 193.0 |
| Graduate Degree | 0 (0.0%) | 0.0 |
| Total | 120 (100.0%) | 92.0 |
Fertility by Education by Marriage Status in Doffing
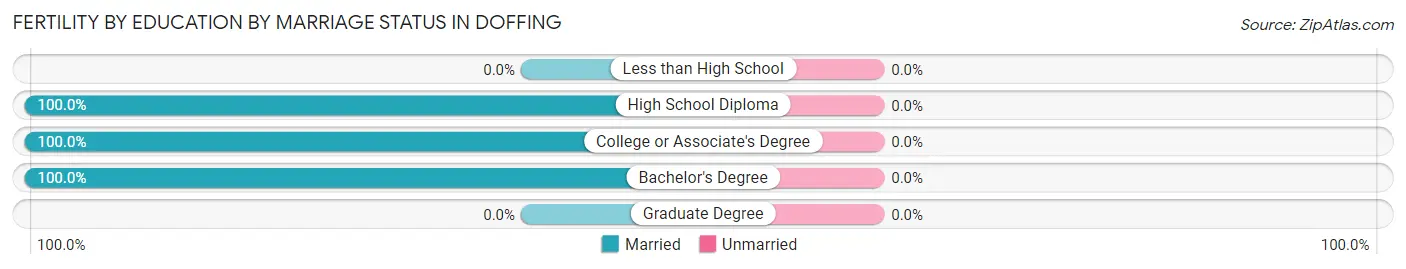
| Educational Attainment | Married | Unmarried |
| Less than High School | 0 (0.0%) | 0 (0.0%) |
| High School Diploma | 39 (100.0%) | 0 (0.0%) |
| College or Associate's Degree | 49 (100.0%) | 0 (0.0%) |
| Bachelor's Degree | 32 (100.0%) | 0 (0.0%) |
| Graduate Degree | 0 (0.0%) | 0 (0.0%) |
| Total | 120 (100.0%) | 0 (0.0%) |
Employment Characteristics in Doffing
Employment by Class of Employer in Doffing
Among the 1,749 employed individuals in Doffing, private company employees (1,278 | 73.1%), self-employed (not incorporated) (249 | 14.2%), and local government employees (100 | 5.7%) make up the most common classes of employment.
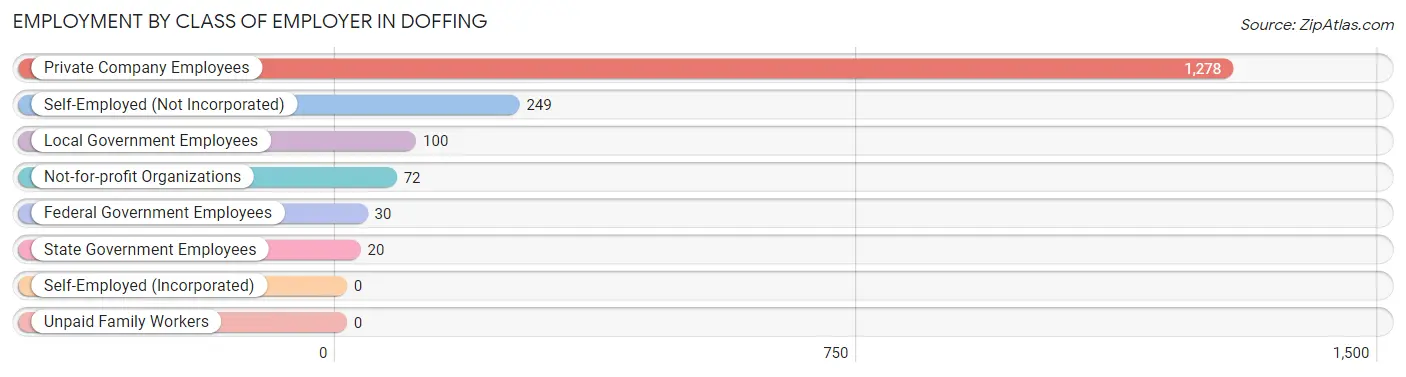
| Employer Class | # Employees | % Employees |
| Private Company Employees | 1,278 | 73.1% |
| Self-Employed (Incorporated) | 0 | 0.0% |
| Self-Employed (Not Incorporated) | 249 | 14.2% |
| Not-for-profit Organizations | 72 | 4.1% |
| Local Government Employees | 100 | 5.7% |
| State Government Employees | 20 | 1.1% |
| Federal Government Employees | 30 | 1.7% |
| Unpaid Family Workers | 0 | 0.0% |
| Total | 1,749 | 100.0% |
Employment Status by Age in Doffing
According to the labor force statistics for Doffing, out of the total population over 16 years of age (3,541), 52.2% or 1,848 individuals are in the labor force, with 5.4% or 100 of them unemployed. The age group with the highest labor force participation rate is 30 to 34 years, with 93.2% or 123 individuals in the labor force. Within the labor force, the 20 to 24 years age range has the highest percentage of unemployed individuals, with 13.6% or 18 of them being unemployed.
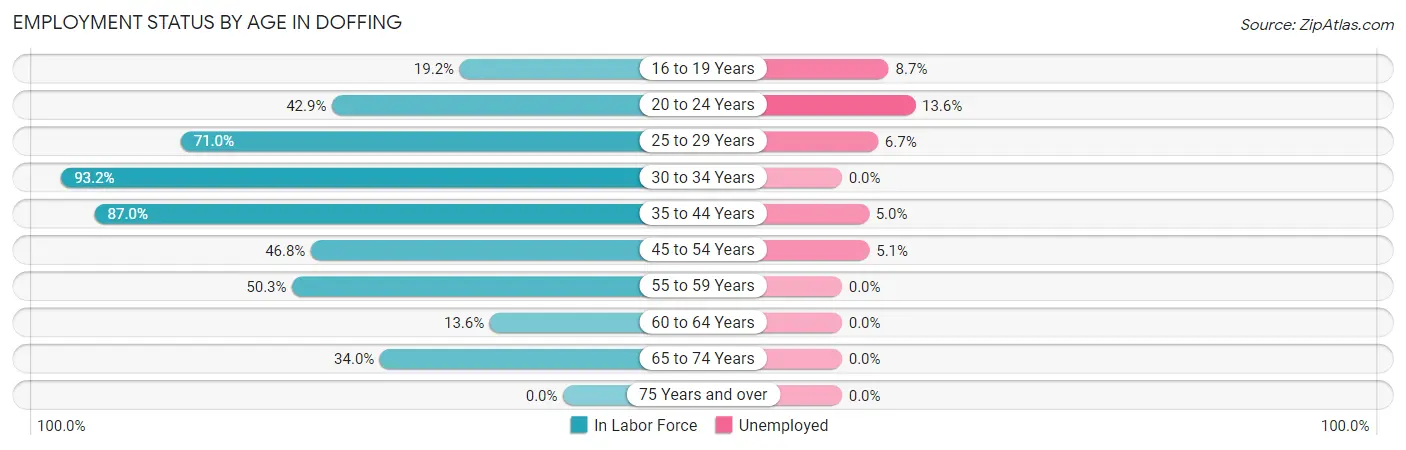
| Age Bracket | In Labor Force | Unemployed |
| 16 to 19 Years | 69 (19.2%) | 6 (8.7%) |
| 20 to 24 Years | 132 (42.9%) | 18 (13.6%) |
| 25 to 29 Years | 493 (71.0%) | 33 (6.7%) |
| 30 to 34 Years | 123 (93.2%) | 0 (0.0%) |
| 35 to 44 Years | 461 (87.0%) | 23 (5.0%) |
| 45 to 54 Years | 370 (46.8%) | 19 (5.1%) |
| 55 to 59 Years | 146 (50.3%) | 0 (0.0%) |
| 60 to 64 Years | 19 (13.6%) | 0 (0.0%) |
| 65 to 74 Years | 35 (34.0%) | 0 (0.0%) |
| 75 Years and over | 0 (0.0%) | 0 (0.0%) |
| Total | 1,848 (52.2%) | 100 (5.4%) |
Employment Status by Educational Attainment in Doffing
According to labor force statistics for Doffing, 62.6% of individuals (1,613) out of the total population between 25 and 64 years of age (2,577) are in the labor force, with 4.7% or 76 of them being unemployed. The group with the highest labor force participation rate are those with the educational attainment of bachelor's degree or higher, with 88.4% or 244 individuals in the labor force. Within the labor force, individuals with college / associate degree education have the highest percentage of unemployment, with 10.2% or 42 of them being unemployed.
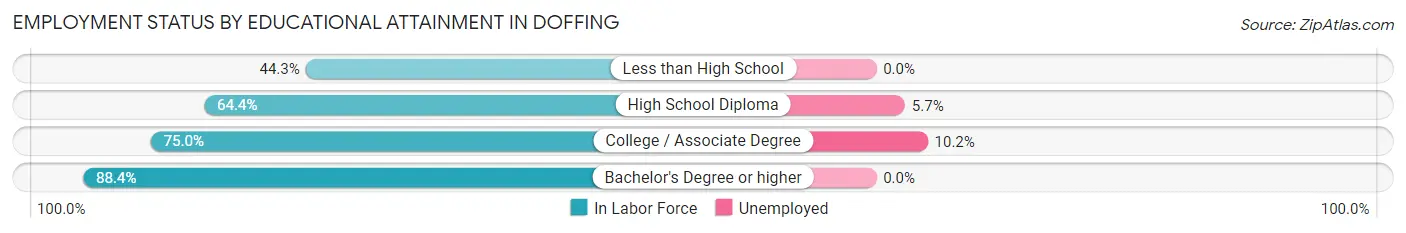
| Educational Attainment | In Labor Force | Unemployed |
| Less than High School | 380 (44.3%) | 0 (0.0%) |
| High School Diploma | 578 (64.4%) | 51 (5.7%) |
| College / Associate Degree | 410 (75.0%) | 56 (10.2%) |
| Bachelor's Degree or higher | 244 (88.4%) | 0 (0.0%) |
| Total | 1,613 (62.6%) | 121 (4.7%) |
Employment Occupations by Sex in Doffing
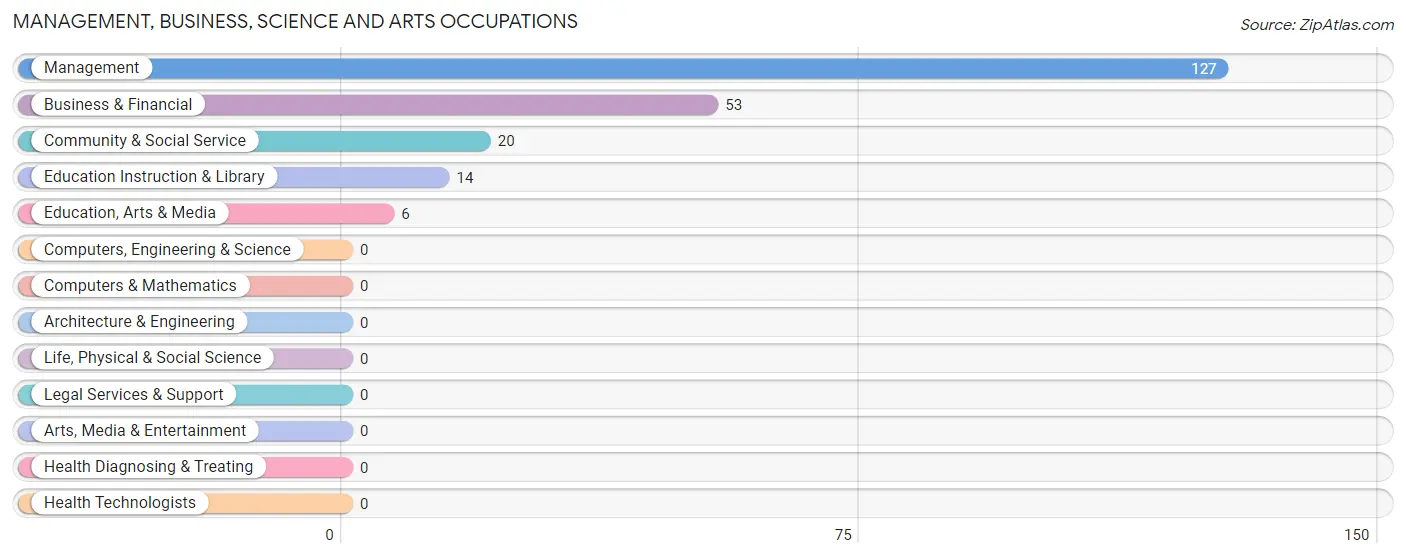
Management, Business, Science and Arts Occupations
The most common Management, Business, Science and Arts occupations in Doffing are Management (127 | 7.3%), Business & Financial (53 | 3.0%), Community & Social Service (20 | 1.1%), Education Instruction & Library (14 | 0.8%), and Education, Arts & Media (6 | 0.3%).
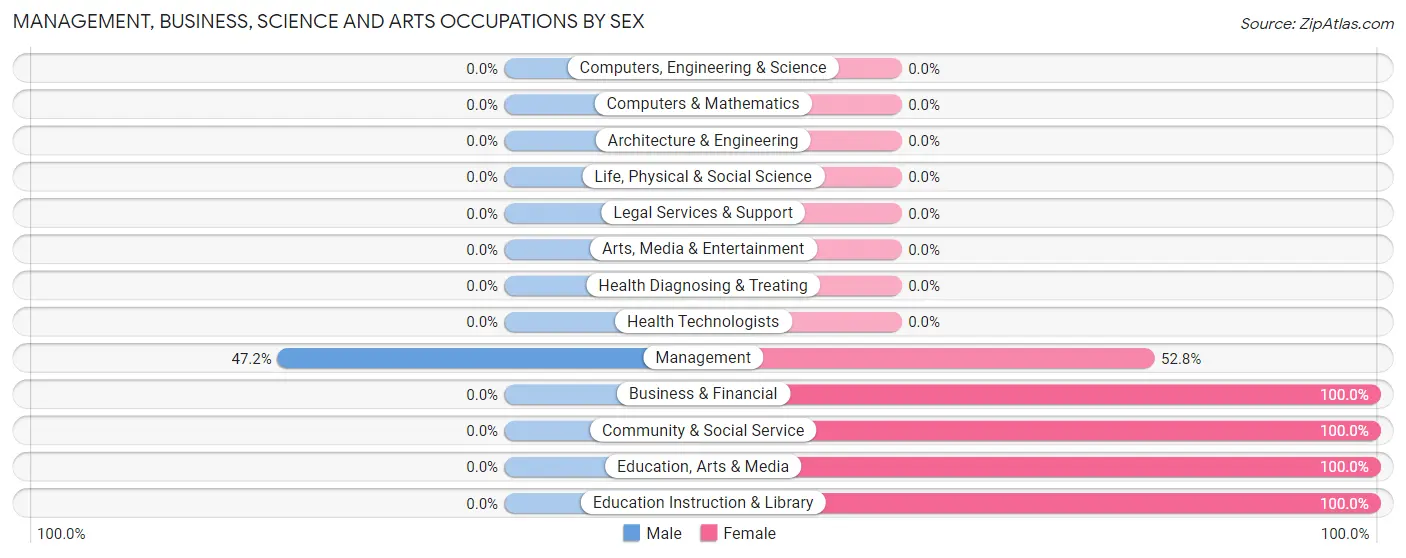
Management, Business, Science and Arts Occupations by Sex
| Occupation | Male | Female |
| Management | 60 (47.2%) | 67 (52.8%) |
| Business & Financial | 0 (0.0%) | 53 (100.0%) |
| Computers, Engineering & Science | 0 (0.0%) | 0 (0.0%) |
| Computers & Mathematics | 0 (0.0%) | 0 (0.0%) |
| Architecture & Engineering | 0 (0.0%) | 0 (0.0%) |
| Life, Physical & Social Science | 0 (0.0%) | 0 (0.0%) |
| Community & Social Service | 0 (0.0%) | 20 (100.0%) |
| Education, Arts & Media | 0 (0.0%) | 6 (100.0%) |
| Legal Services & Support | 0 (0.0%) | 0 (0.0%) |
| Education Instruction & Library | 0 (0.0%) | 14 (100.0%) |
| Arts, Media & Entertainment | 0 (0.0%) | 0 (0.0%) |
| Health Diagnosing & Treating | 0 (0.0%) | 0 (0.0%) |
| Health Technologists | 0 (0.0%) | 0 (0.0%) |
| Total (Category) | 60 (30.0%) | 140 (70.0%) |
| Total (Overall) | 1,024 (58.6%) | 725 (41.4%) |
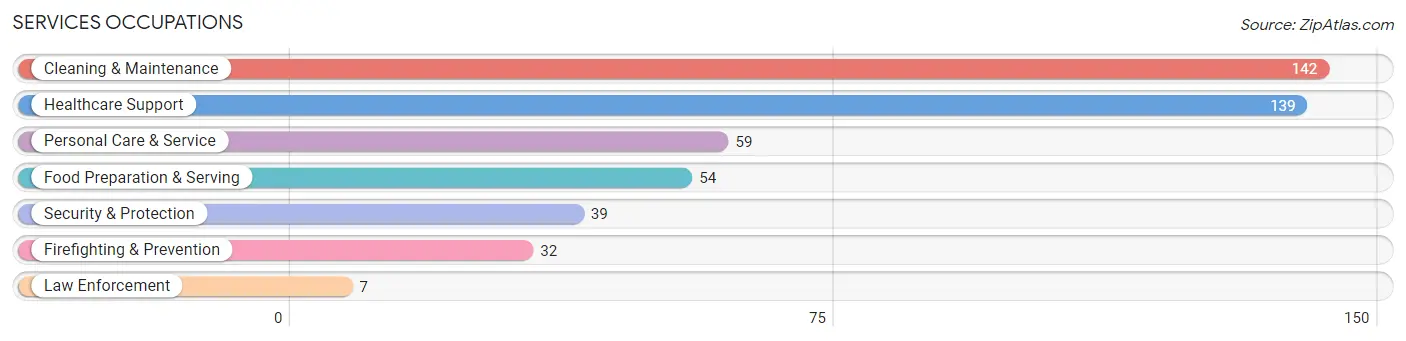
Services Occupations
The most common Services occupations in Doffing are Cleaning & Maintenance (142 | 8.1%), Healthcare Support (139 | 8.0%), Personal Care & Service (59 | 3.4%), Food Preparation & Serving (54 | 3.1%), and Security & Protection (39 | 2.2%).
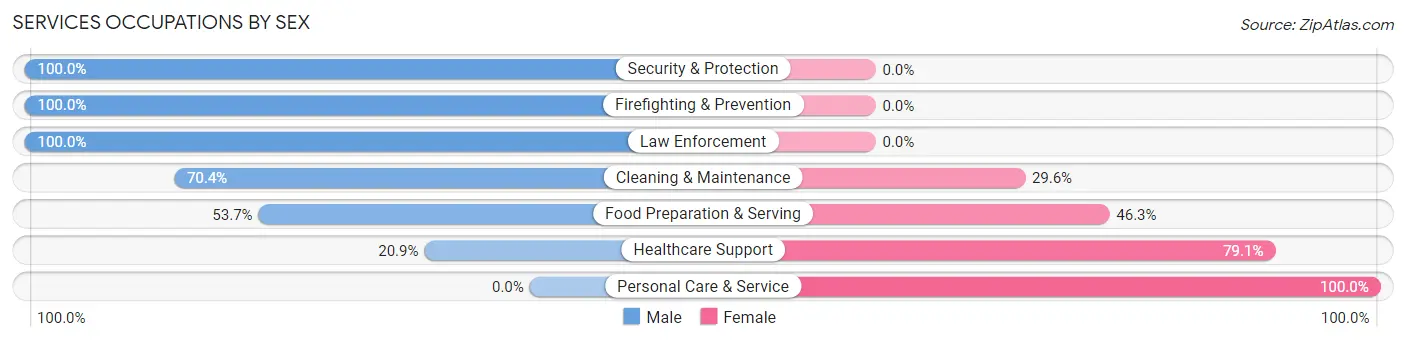
Services Occupations by Sex
Within the Services occupations in Doffing, the most male-oriented occupations are Security & Protection (100.0%), Firefighting & Prevention (100.0%), and Law Enforcement (100.0%), while the most female-oriented occupations are Personal Care & Service (100.0%), Healthcare Support (79.1%), and Food Preparation & Serving (46.3%).
| Occupation | Male | Female |
| Healthcare Support | 29 (20.9%) | 110 (79.1%) |
| Security & Protection | 39 (100.0%) | 0 (0.0%) |
| Firefighting & Prevention | 32 (100.0%) | 0 (0.0%) |
| Law Enforcement | 7 (100.0%) | 0 (0.0%) |
| Food Preparation & Serving | 29 (53.7%) | 25 (46.3%) |
| Cleaning & Maintenance | 100 (70.4%) | 42 (29.6%) |
| Personal Care & Service | 0 (0.0%) | 59 (100.0%) |
| Total (Category) | 197 (45.5%) | 236 (54.5%) |
| Total (Overall) | 1,024 (58.6%) | 725 (41.4%) |
Sales and Office Occupations
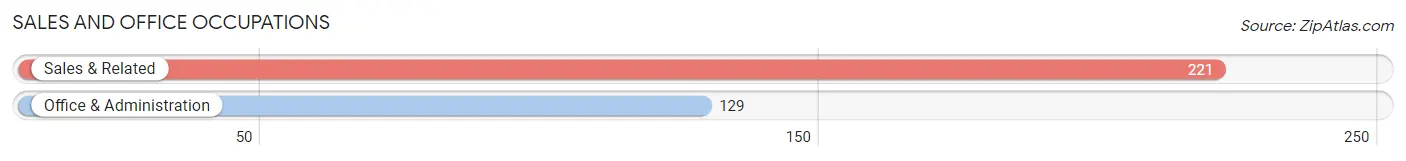
The most common Sales and Office occupations in Doffing are Sales & Related (221 | 12.6%), and Office & Administration (129 | 7.4%).
Sales and Office Occupations by Sex
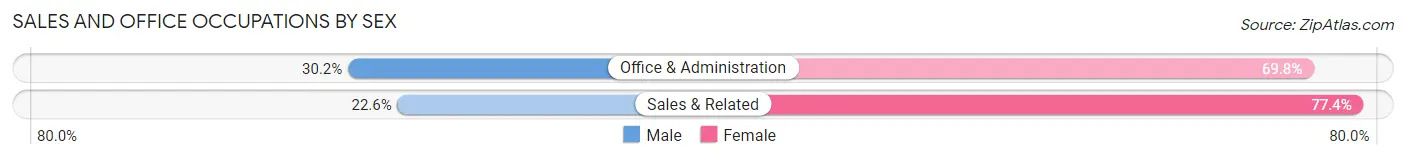
| Occupation | Male | Female |
| Sales & Related | 50 (22.6%) | 171 (77.4%) |
| Office & Administration | 39 (30.2%) | 90 (69.8%) |
| Total (Category) | 89 (25.4%) | 261 (74.6%) |
| Total (Overall) | 1,024 (58.6%) | 725 (41.4%) |
Natural Resources, Construction and Maintenance Occupations
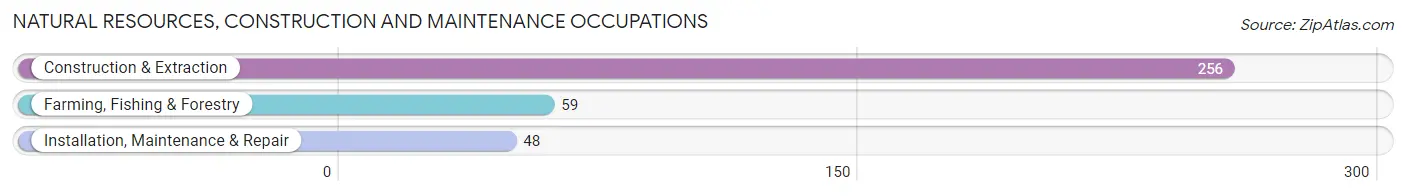
The most common Natural Resources, Construction and Maintenance occupations in Doffing are Construction & Extraction (256 | 14.6%), Farming, Fishing & Forestry (59 | 3.4%), and Installation, Maintenance & Repair (48 | 2.7%).
Natural Resources, Construction and Maintenance Occupations by Sex
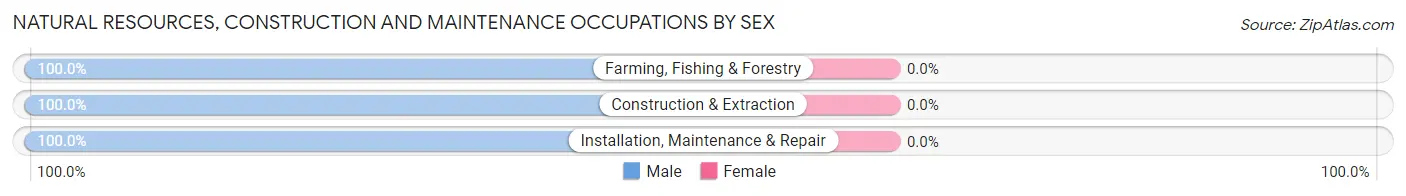
| Occupation | Male | Female |
| Farming, Fishing & Forestry | 59 (100.0%) | 0 (0.0%) |
| Construction & Extraction | 256 (100.0%) | 0 (0.0%) |
| Installation, Maintenance & Repair | 48 (100.0%) | 0 (0.0%) |
| Total (Category) | 363 (100.0%) | 0 (0.0%) |
| Total (Overall) | 1,024 (58.6%) | 725 (41.4%) |
Production, Transportation and Moving Occupations
The most common Production, Transportation and Moving occupations in Doffing are Production (186 | 10.6%), Material Moving (154 | 8.8%), and Transportation (63 | 3.6%).
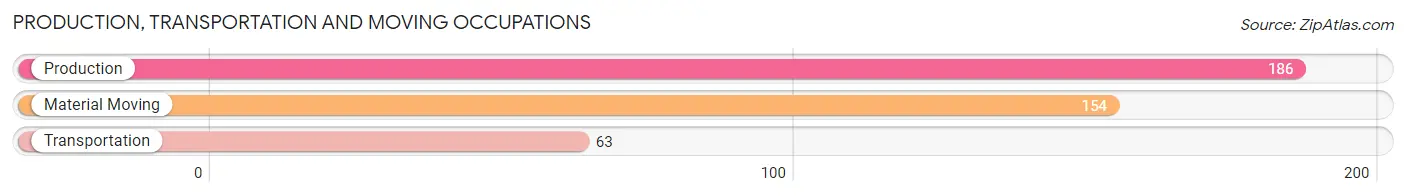
Production, Transportation and Moving Occupations by Sex
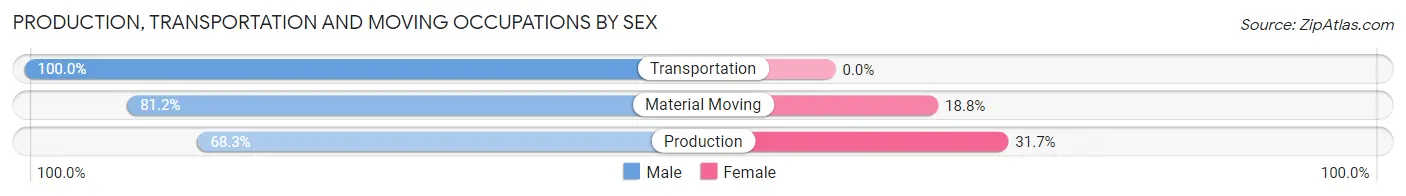
| Occupation | Male | Female |
| Production | 127 (68.3%) | 59 (31.7%) |
| Transportation | 63 (100.0%) | 0 (0.0%) |
| Material Moving | 125 (81.2%) | 29 (18.8%) |
| Total (Category) | 315 (78.2%) | 88 (21.8%) |
| Total (Overall) | 1,024 (58.6%) | 725 (41.4%) |
Employment Industries by Sex in Doffing
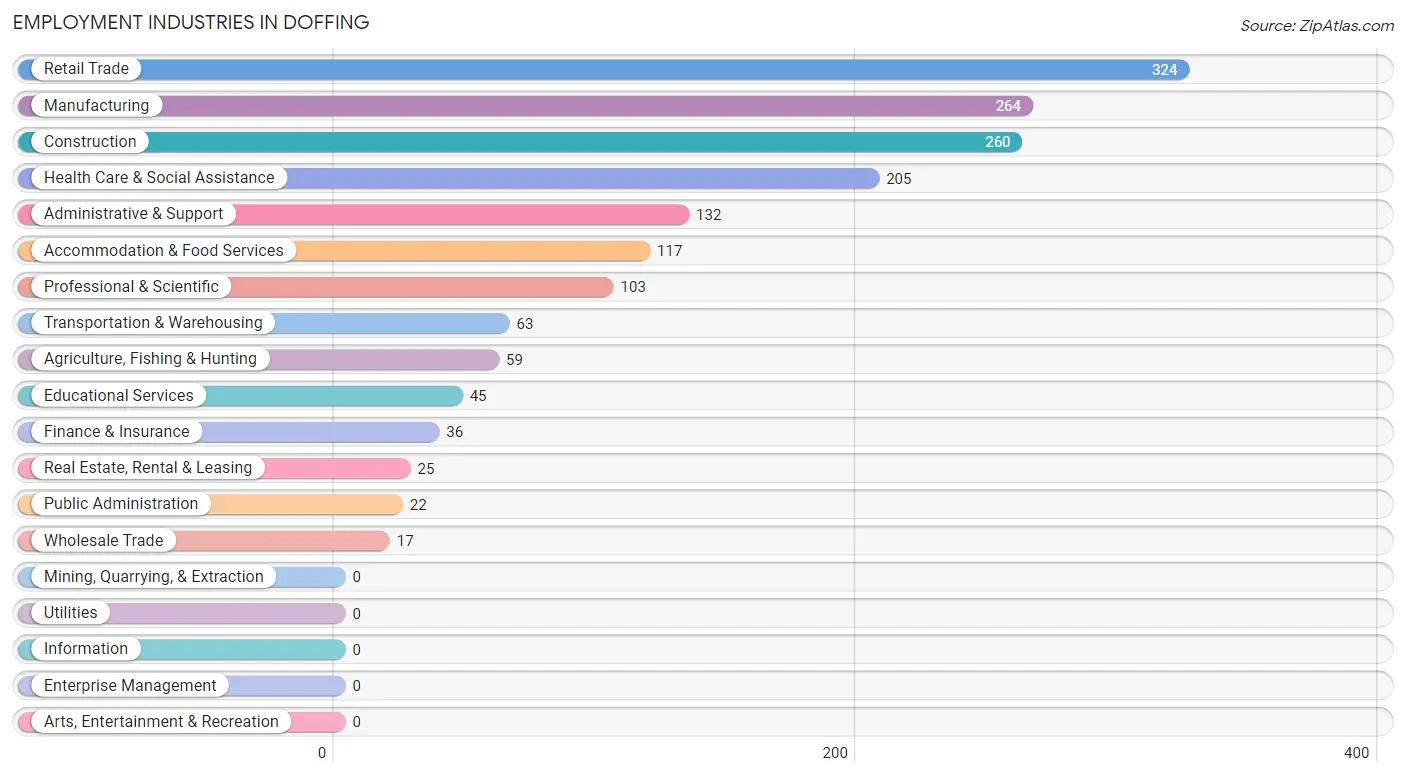
Employment Industries in Doffing
The major employment industries in Doffing include Retail Trade (324 | 18.5%), Manufacturing (264 | 15.1%), Construction (260 | 14.9%), Health Care & Social Assistance (205 | 11.7%), and Administrative & Support (132 | 7.5%).
Employment Industries by Sex in Doffing
The Doffing industries that see more men than women are Agriculture, Fishing & Hunting (100.0%), Wholesale Trade (100.0%), and Transportation & Warehousing (100.0%), whereas the industries that tend to have a higher number of women are Real Estate, Rental & Leasing (100.0%), Educational Services (100.0%), and Health Care & Social Assistance (85.9%).
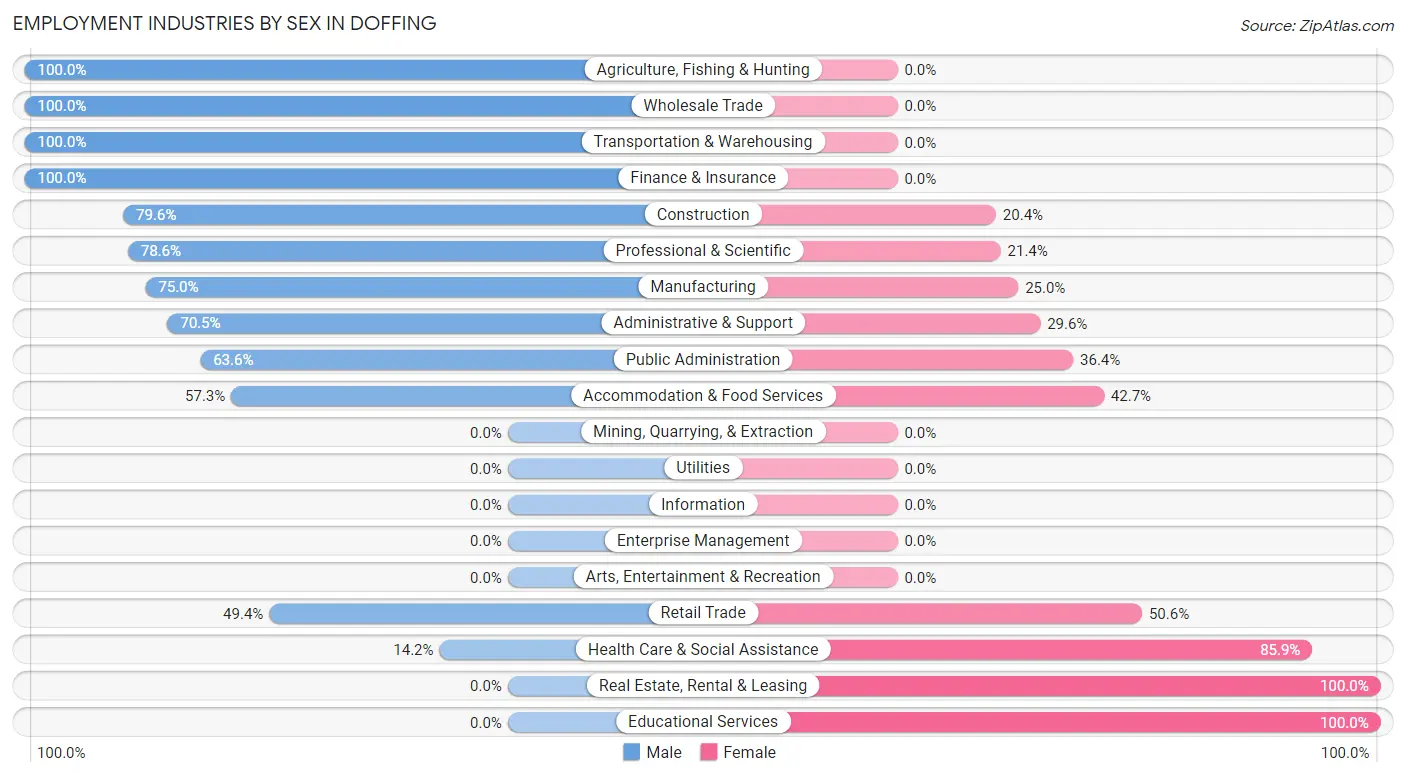
| Industry | Male | Female |
| Agriculture, Fishing & Hunting | 59 (100.0%) | 0 (0.0%) |
| Mining, Quarrying, & Extraction | 0 (0.0%) | 0 (0.0%) |
| Construction | 207 (79.6%) | 53 (20.4%) |
| Manufacturing | 198 (75.0%) | 66 (25.0%) |
| Wholesale Trade | 17 (100.0%) | 0 (0.0%) |
| Retail Trade | 160 (49.4%) | 164 (50.6%) |
| Transportation & Warehousing | 63 (100.0%) | 0 (0.0%) |
| Utilities | 0 (0.0%) | 0 (0.0%) |
| Information | 0 (0.0%) | 0 (0.0%) |
| Finance & Insurance | 36 (100.0%) | 0 (0.0%) |
| Real Estate, Rental & Leasing | 0 (0.0%) | 25 (100.0%) |
| Professional & Scientific | 81 (78.6%) | 22 (21.4%) |
| Enterprise Management | 0 (0.0%) | 0 (0.0%) |
| Administrative & Support | 93 (70.5%) | 39 (29.5%) |
| Educational Services | 0 (0.0%) | 45 (100.0%) |
| Health Care & Social Assistance | 29 (14.1%) | 176 (85.9%) |
| Arts, Entertainment & Recreation | 0 (0.0%) | 0 (0.0%) |
| Accommodation & Food Services | 67 (57.3%) | 50 (42.7%) |
| Public Administration | 14 (63.6%) | 8 (36.4%) |
| Total | 1,024 (58.6%) | 725 (41.4%) |
Education in Doffing
School Enrollment in Doffing
The most common levels of schooling among the 1,577 students in Doffing are elementary school (386 | 24.5%), middle school (363 | 23.0%), and high school (284 | 18.0%).
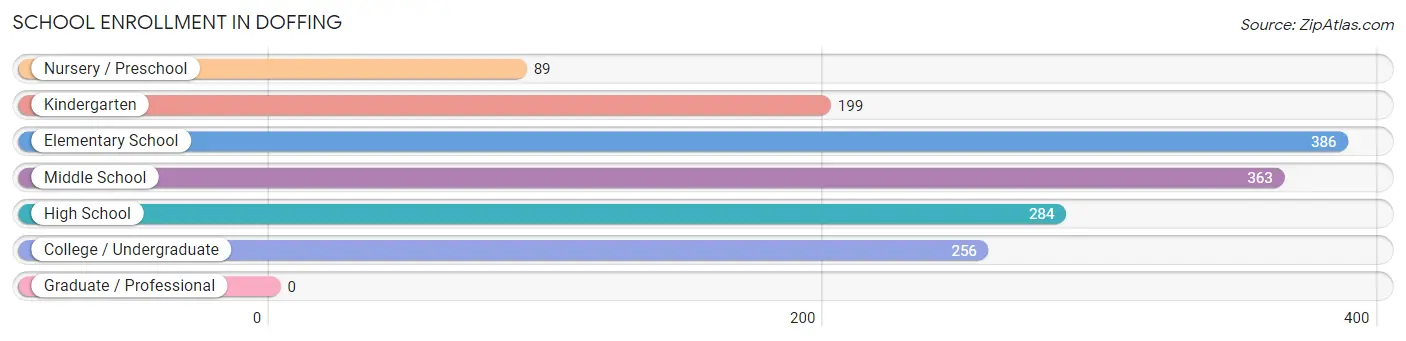
| School Level | # Students | % Students |
| Nursery / Preschool | 89 | 5.6% |
| Kindergarten | 199 | 12.6% |
| Elementary School | 386 | 24.5% |
| Middle School | 363 | 23.0% |
| High School | 284 | 18.0% |
| College / Undergraduate | 256 | 16.2% |
| Graduate / Professional | 0 | 0.0% |
| Total | 1,577 | 100.0% |
School Enrollment by Age by Funding Source in Doffing
Out of a total of 1,577 students who are enrolled in schools in Doffing, 35 (2.2%) attend a private institution, while the remaining 1,542 (97.8%) are enrolled in public schools. The age group of 35 years and over has the highest likelihood of being enrolled in private schools, with 35 (71.4% in the age bracket) enrolled. Conversely, the age group of 3 to 4 year olds has the lowest likelihood of being enrolled in a private school, with 71 (100.0% in the age bracket) attending a public institution.
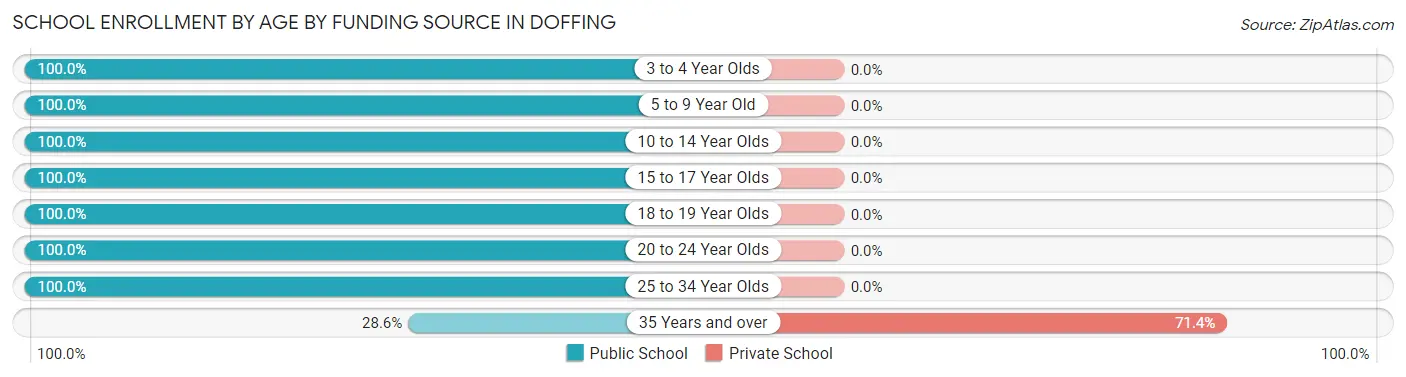
| Age Bracket | Public School | Private School |
| 3 to 4 Year Olds | 71 (100.0%) | 0 (0.0%) |
| 5 to 9 Year Old | 603 (100.0%) | 0 (0.0%) |
| 10 to 14 Year Olds | 380 (100.0%) | 0 (0.0%) |
| 15 to 17 Year Olds | 173 (100.0%) | 0 (0.0%) |
| 18 to 19 Year Olds | 138 (100.0%) | 0 (0.0%) |
| 20 to 24 Year Olds | 145 (100.0%) | 0 (0.0%) |
| 25 to 34 Year Olds | 18 (100.0%) | 0 (0.0%) |
| 35 Years and over | 14 (28.6%) | 35 (71.4%) |
| Total | 1,542 (97.8%) | 35 (2.2%) |
Educational Attainment by Field of Study in Doffing
Visual & performing arts (81 | 28.2%), arts & humanities (61 | 21.2%), education (57 | 19.9%), science & technology (45 | 15.7%), and business (29 | 10.1%) are the most common fields of study among 287 individuals in Doffing who have obtained a bachelor's degree or higher.
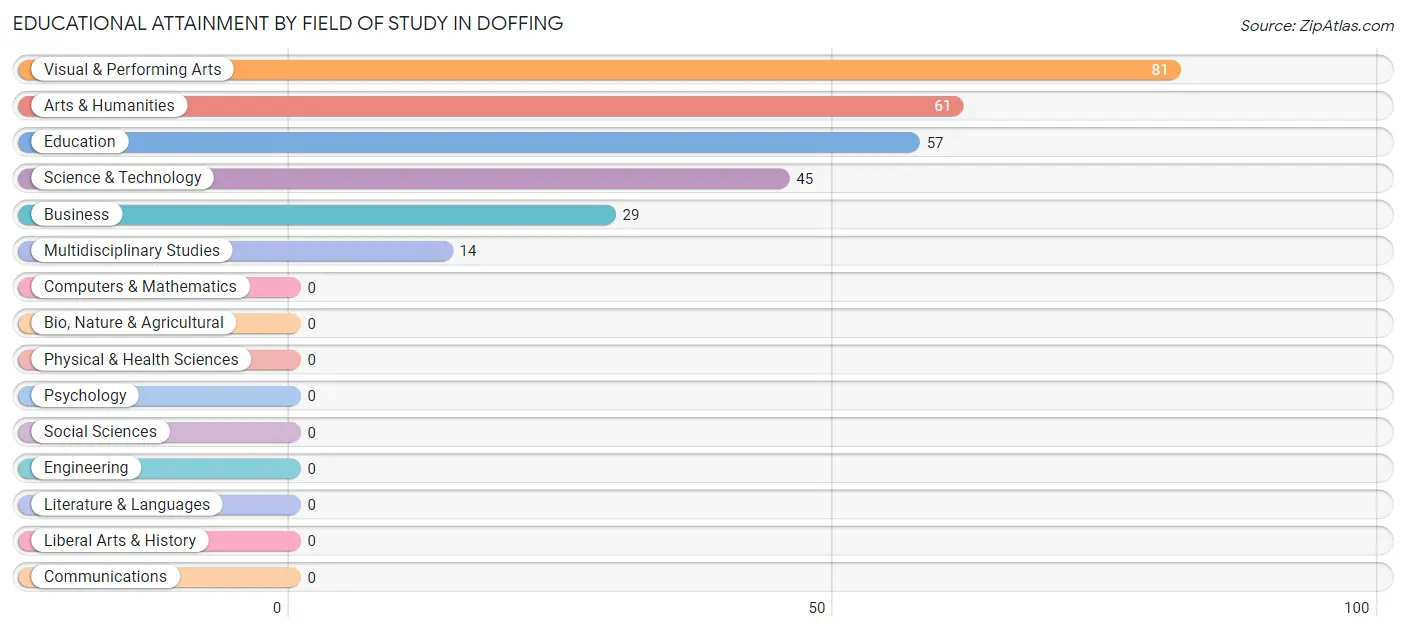
| Field of Study | # Graduates | % Graduates |
| Computers & Mathematics | 0 | 0.0% |
| Bio, Nature & Agricultural | 0 | 0.0% |
| Physical & Health Sciences | 0 | 0.0% |
| Psychology | 0 | 0.0% |
| Social Sciences | 0 | 0.0% |
| Engineering | 0 | 0.0% |
| Multidisciplinary Studies | 14 | 4.9% |
| Science & Technology | 45 | 15.7% |
| Business | 29 | 10.1% |
| Education | 57 | 19.9% |
| Literature & Languages | 0 | 0.0% |
| Liberal Arts & History | 0 | 0.0% |
| Visual & Performing Arts | 81 | 28.2% |
| Communications | 0 | 0.0% |
| Arts & Humanities | 61 | 21.2% |
| Total | 287 | 100.0% |
Transportation & Commute in Doffing
Vehicle Availability by Sex in Doffing
The most prevalent vehicle ownership categories in Doffing are males with 2 vehicles (423, accounting for 41.3%) and females with 2 vehicles (176, making up 58.3%).
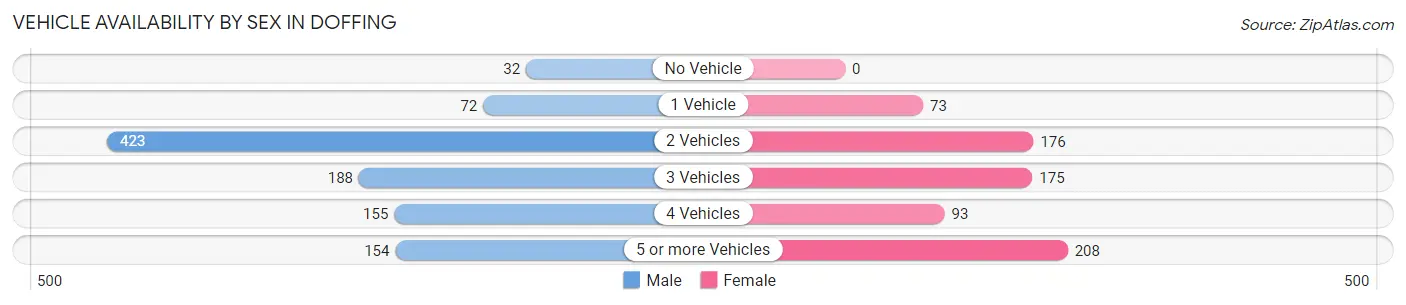
| Vehicles Available | Male | Female |
| No Vehicle | 32 (3.1%) | 0 (0.0%) |
| 1 Vehicle | 72 (7.0%) | 73 (10.1%) |
| 2 Vehicles | 423 (41.3%) | 176 (24.3%) |
| 3 Vehicles | 188 (18.4%) | 175 (24.1%) |
| 4 Vehicles | 155 (15.1%) | 93 (12.8%) |
| 5 or more Vehicles | 154 (15.0%) | 208 (28.7%) |
| Total | 1,024 (100.0%) | 725 (100.0%) |
Commute Time in Doffing
The most frequently occuring commute durations in Doffing are 30 to 34 minutes (312 commuters, 18.8%), 10 to 14 minutes (277 commuters, 16.7%), and 15 to 19 minutes (272 commuters, 16.4%).
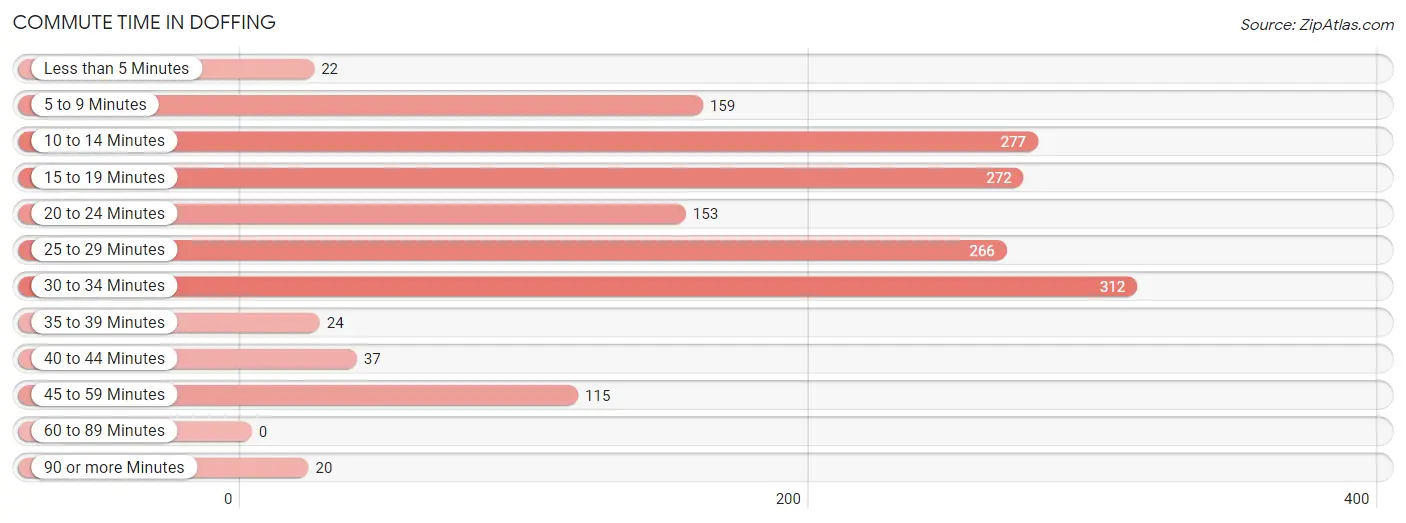
| Commute Time | # Commuters | % Commuters |
| Less than 5 Minutes | 22 | 1.3% |
| 5 to 9 Minutes | 159 | 9.6% |
| 10 to 14 Minutes | 277 | 16.7% |
| 15 to 19 Minutes | 272 | 16.4% |
| 20 to 24 Minutes | 153 | 9.2% |
| 25 to 29 Minutes | 266 | 16.1% |
| 30 to 34 Minutes | 312 | 18.8% |
| 35 to 39 Minutes | 24 | 1.5% |
| 40 to 44 Minutes | 37 | 2.2% |
| 45 to 59 Minutes | 115 | 6.9% |
| 60 to 89 Minutes | 0 | 0.0% |
| 90 or more Minutes | 20 | 1.2% |
Commute Time by Sex in Doffing
The most common commute times in Doffing are 30 to 34 minutes (227 commuters, 24.1%) for males and 10 to 14 minutes (179 commuters, 25.1%) for females.
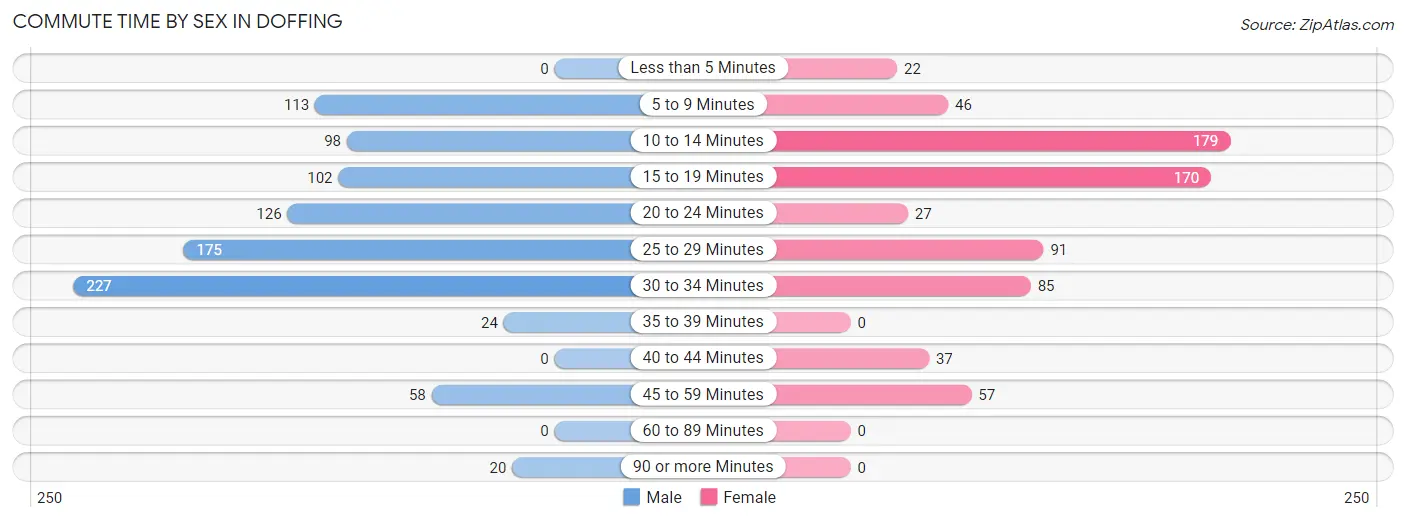
| Commute Time | Male | Female |
| Less than 5 Minutes | 0 (0.0%) | 22 (3.1%) |
| 5 to 9 Minutes | 113 (12.0%) | 46 (6.4%) |
| 10 to 14 Minutes | 98 (10.4%) | 179 (25.1%) |
| 15 to 19 Minutes | 102 (10.8%) | 170 (23.8%) |
| 20 to 24 Minutes | 126 (13.4%) | 27 (3.8%) |
| 25 to 29 Minutes | 175 (18.6%) | 91 (12.8%) |
| 30 to 34 Minutes | 227 (24.1%) | 85 (11.9%) |
| 35 to 39 Minutes | 24 (2.5%) | 0 (0.0%) |
| 40 to 44 Minutes | 0 (0.0%) | 37 (5.2%) |
| 45 to 59 Minutes | 58 (6.1%) | 57 (8.0%) |
| 60 to 89 Minutes | 0 (0.0%) | 0 (0.0%) |
| 90 or more Minutes | 20 (2.1%) | 0 (0.0%) |
Time of Departure to Work by Sex in Doffing
The most frequent times of departure to work in Doffing are 6:30 AM to 6:59 AM (200, 21.2%) for males and 7:30 AM to 7:59 AM (169, 23.7%) for females.
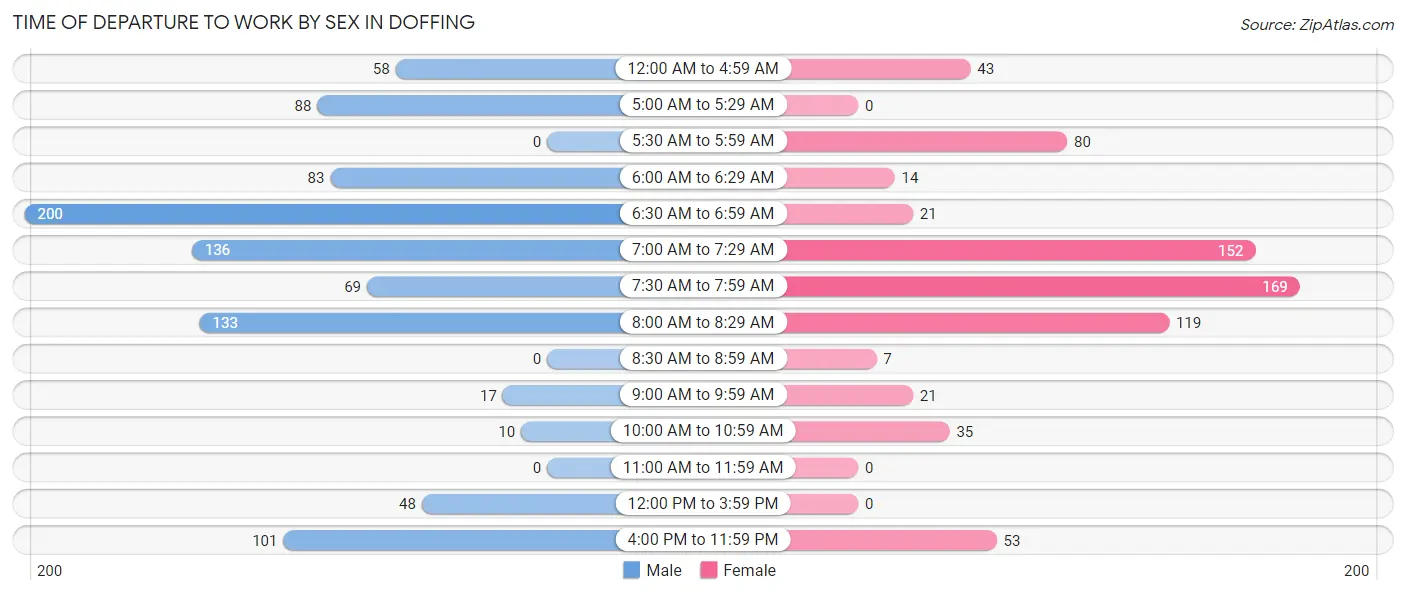
| Time of Departure | Male | Female |
| 12:00 AM to 4:59 AM | 58 (6.1%) | 43 (6.0%) |
| 5:00 AM to 5:29 AM | 88 (9.3%) | 0 (0.0%) |
| 5:30 AM to 5:59 AM | 0 (0.0%) | 80 (11.2%) |
| 6:00 AM to 6:29 AM | 83 (8.8%) | 14 (2.0%) |
| 6:30 AM to 6:59 AM | 200 (21.2%) | 21 (2.9%) |
| 7:00 AM to 7:29 AM | 136 (14.4%) | 152 (21.3%) |
| 7:30 AM to 7:59 AM | 69 (7.3%) | 169 (23.7%) |
| 8:00 AM to 8:29 AM | 133 (14.1%) | 119 (16.7%) |
| 8:30 AM to 8:59 AM | 0 (0.0%) | 7 (1.0%) |
| 9:00 AM to 9:59 AM | 17 (1.8%) | 21 (2.9%) |
| 10:00 AM to 10:59 AM | 10 (1.1%) | 35 (4.9%) |
| 11:00 AM to 11:59 AM | 0 (0.0%) | 0 (0.0%) |
| 12:00 PM to 3:59 PM | 48 (5.1%) | 0 (0.0%) |
| 4:00 PM to 11:59 PM | 101 (10.7%) | 53 (7.4%) |
| Total | 943 (100.0%) | 714 (100.0%) |
Housing Occupancy in Doffing
Occupancy by Ownership in Doffing
Of the total 1,289 dwellings in Doffing, owner-occupied units account for 1,067 (82.8%), while renter-occupied units make up 222 (17.2%).
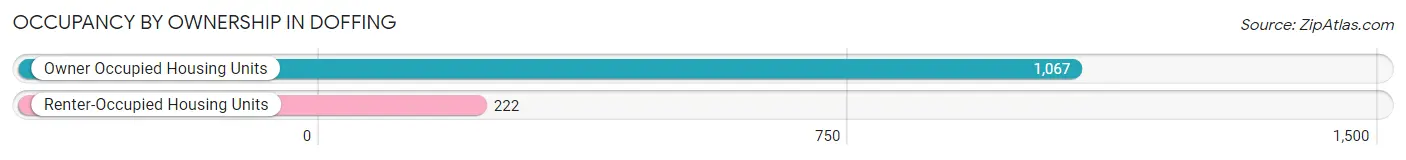
| Occupancy | # Housing Units | % Housing Units |
| Owner Occupied Housing Units | 1,067 | 82.8% |
| Renter-Occupied Housing Units | 222 | 17.2% |
| Total Occupied Housing Units | 1,289 | 100.0% |
Occupancy by Household Size in Doffing
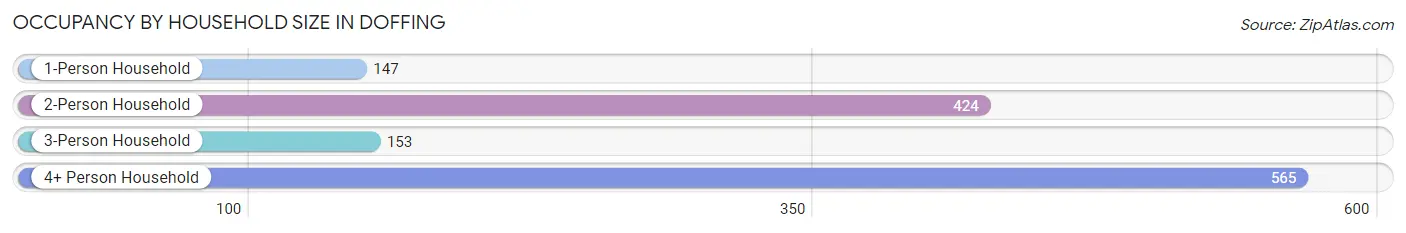
| Household Size | # Housing Units | % Housing Units |
| 1-Person Household | 147 | 11.4% |
| 2-Person Household | 424 | 32.9% |
| 3-Person Household | 153 | 11.9% |
| 4+ Person Household | 565 | 43.8% |
| Total Housing Units | 1,289 | 100.0% |
Occupancy by Ownership by Household Size in Doffing

| Household Size | Owner-occupied | Renter-occupied |
| 1-Person Household | 115 (78.2%) | 32 (21.8%) |
| 2-Person Household | 424 (100.0%) | 0 (0.0%) |
| 3-Person Household | 105 (68.6%) | 48 (31.4%) |
| 4+ Person Household | 423 (74.9%) | 142 (25.1%) |
| Total Housing Units | 1,067 (82.8%) | 222 (17.2%) |
Occupancy by Educational Attainment in Doffing
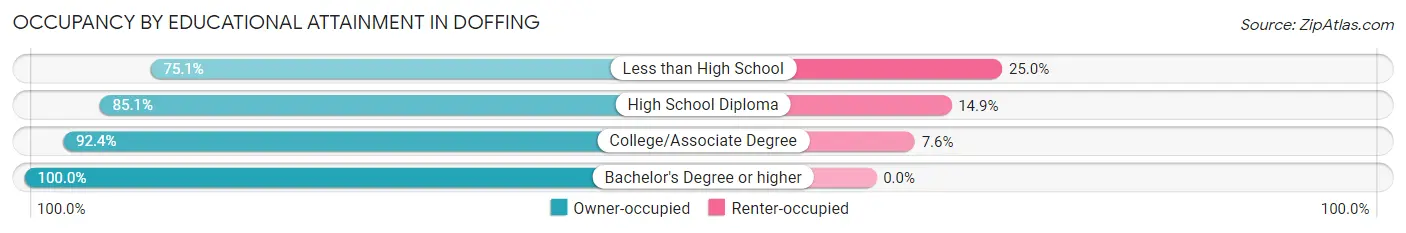
| Household Size | Owner-occupied | Renter-occupied |
| Less than High School | 415 (75.0%) | 138 (24.9%) |
| High School Diploma | 349 (85.1%) | 61 (14.9%) |
| College/Associate Degree | 278 (92.4%) | 23 (7.6%) |
| Bachelor's Degree or higher | 25 (100.0%) | 0 (0.0%) |
Occupancy by Age of Householder in Doffing
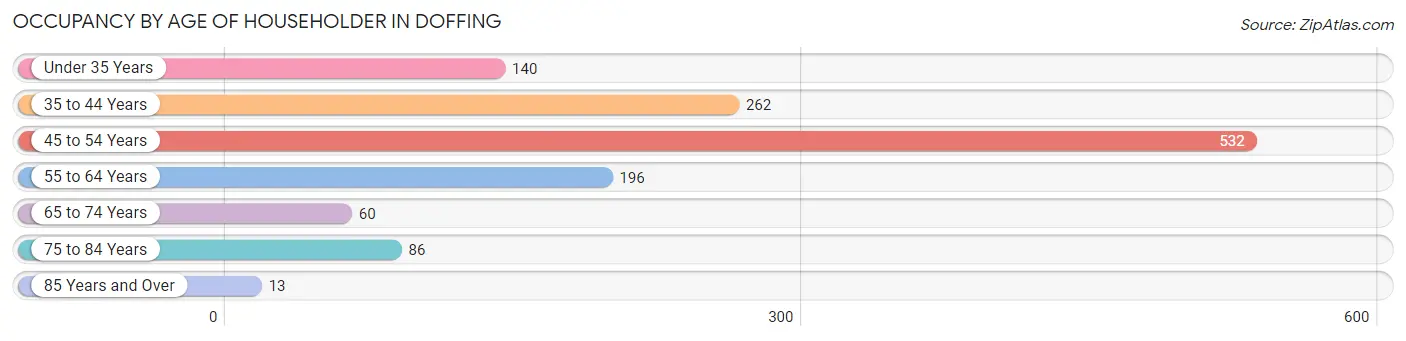
| Age Bracket | # Households | % Households |
| Under 35 Years | 140 | 10.9% |
| 35 to 44 Years | 262 | 20.3% |
| 45 to 54 Years | 532 | 41.3% |
| 55 to 64 Years | 196 | 15.2% |
| 65 to 74 Years | 60 | 4.6% |
| 75 to 84 Years | 86 | 6.7% |
| 85 Years and Over | 13 | 1.0% |
| Total | 1,289 | 100.0% |
Housing Finances in Doffing
Median Income by Occupancy in Doffing
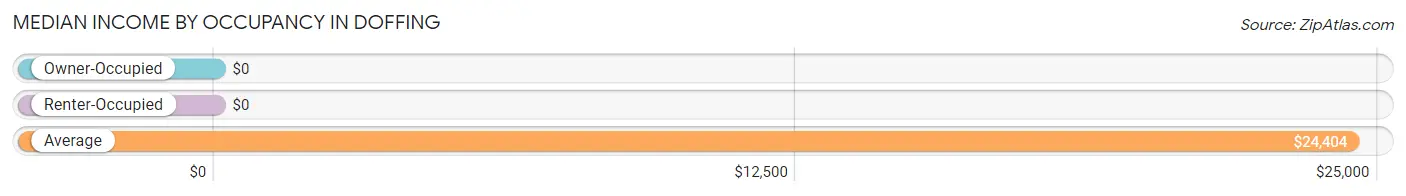
| Occupancy Type | # Households | Median Income |
| Owner-Occupied | 1,067 (82.8%) | $0 |
| Renter-Occupied | 222 (17.2%) | $0 |
| Average | 1,289 (100.0%) | $24,404 |
Occupancy by Householder Income Bracket in Doffing
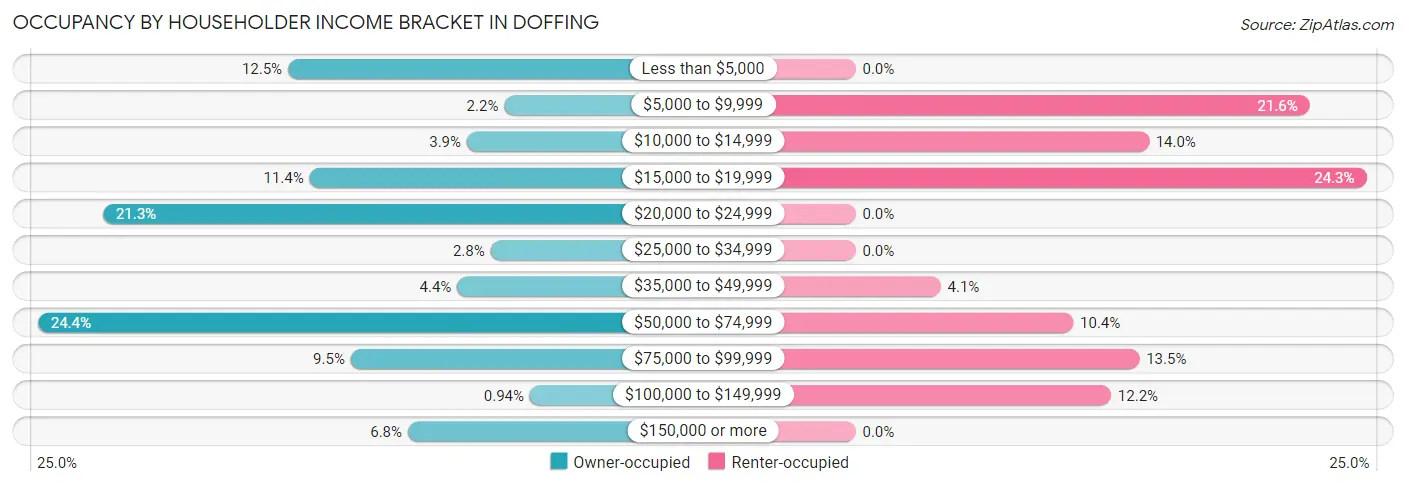
| Income Bracket | Owner-occupied | Renter-occupied |
| Less than $5,000 | 133 (12.5%) | 0 (0.0%) |
| $5,000 to $9,999 | 23 (2.2%) | 48 (21.6%) |
| $10,000 to $14,999 | 42 (3.9%) | 31 (14.0%) |
| $15,000 to $19,999 | 122 (11.4%) | 54 (24.3%) |
| $20,000 to $24,999 | 227 (21.3%) | 0 (0.0%) |
| $25,000 to $34,999 | 30 (2.8%) | 0 (0.0%) |
| $35,000 to $49,999 | 47 (4.4%) | 9 (4.1%) |
| $50,000 to $74,999 | 260 (24.4%) | 23 (10.4%) |
| $75,000 to $99,999 | 101 (9.5%) | 30 (13.5%) |
| $100,000 to $149,999 | 10 (0.9%) | 27 (12.2%) |
| $150,000 or more | 72 (6.8%) | 0 (0.0%) |
| Total | 1,067 (100.0%) | 222 (100.0%) |
Monthly Housing Cost Tiers in Doffing
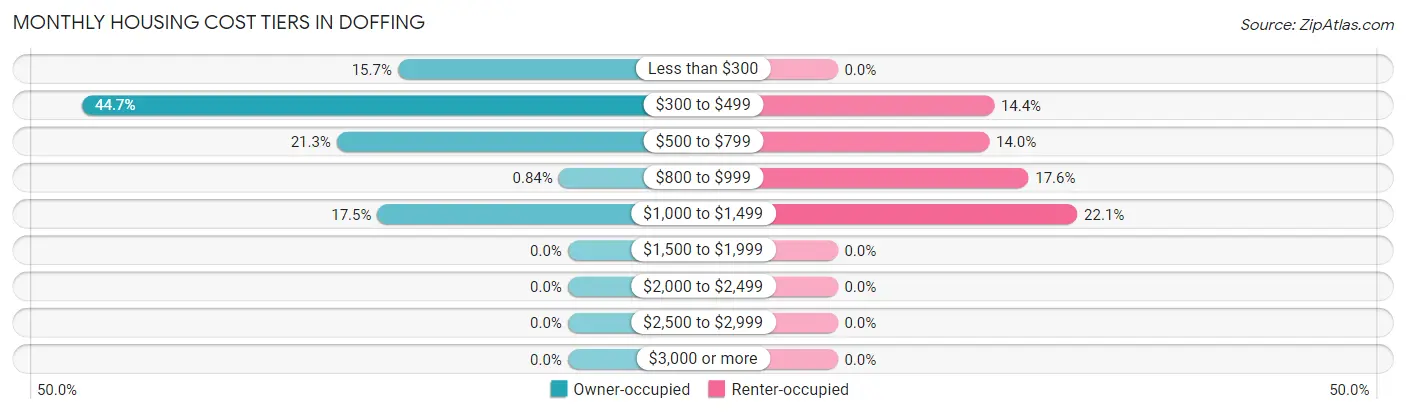
| Monthly Cost | Owner-occupied | Renter-occupied |
| Less than $300 | 167 (15.7%) | 0 (0.0%) |
| $300 to $499 | 477 (44.7%) | 32 (14.4%) |
| $500 to $799 | 227 (21.3%) | 31 (14.0%) |
| $800 to $999 | 9 (0.8%) | 39 (17.6%) |
| $1,000 to $1,499 | 187 (17.5%) | 49 (22.1%) |
| $1,500 to $1,999 | 0 (0.0%) | 0 (0.0%) |
| $2,000 to $2,499 | 0 (0.0%) | 0 (0.0%) |
| $2,500 to $2,999 | 0 (0.0%) | 0 (0.0%) |
| $3,000 or more | 0 (0.0%) | 0 (0.0%) |
| Total | 1,067 (100.0%) | 222 (100.0%) |
Physical Housing Characteristics in Doffing
Housing Structures in Doffing
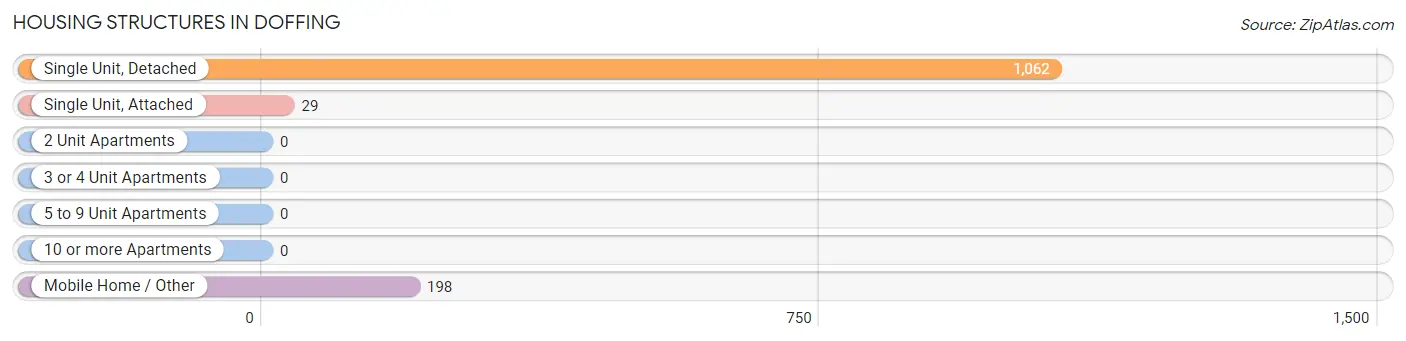
| Structure Type | # Housing Units | % Housing Units |
| Single Unit, Detached | 1,062 | 82.4% |
| Single Unit, Attached | 29 | 2.2% |
| 2 Unit Apartments | 0 | 0.0% |
| 3 or 4 Unit Apartments | 0 | 0.0% |
| 5 to 9 Unit Apartments | 0 | 0.0% |
| 10 or more Apartments | 0 | 0.0% |
| Mobile Home / Other | 198 | 15.4% |
| Total | 1,289 | 100.0% |
Housing Structures by Occupancy in Doffing
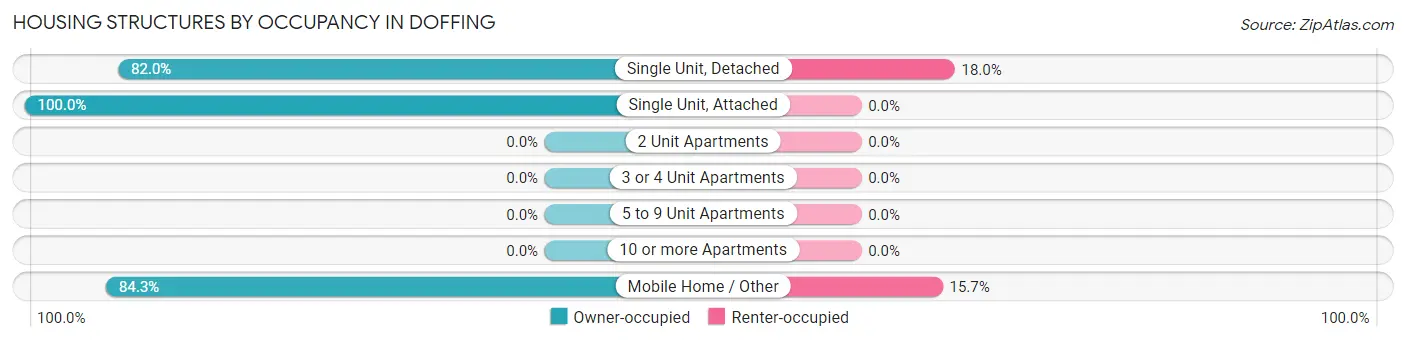
| Structure Type | Owner-occupied | Renter-occupied |
| Single Unit, Detached | 871 (82.0%) | 191 (18.0%) |
| Single Unit, Attached | 29 (100.0%) | 0 (0.0%) |
| 2 Unit Apartments | 0 (0.0%) | 0 (0.0%) |
| 3 or 4 Unit Apartments | 0 (0.0%) | 0 (0.0%) |
| 5 to 9 Unit Apartments | 0 (0.0%) | 0 (0.0%) |
| 10 or more Apartments | 0 (0.0%) | 0 (0.0%) |
| Mobile Home / Other | 167 (84.3%) | 31 (15.7%) |
| Total | 1,067 (82.8%) | 222 (17.2%) |
Housing Structures by Number of Rooms in Doffing
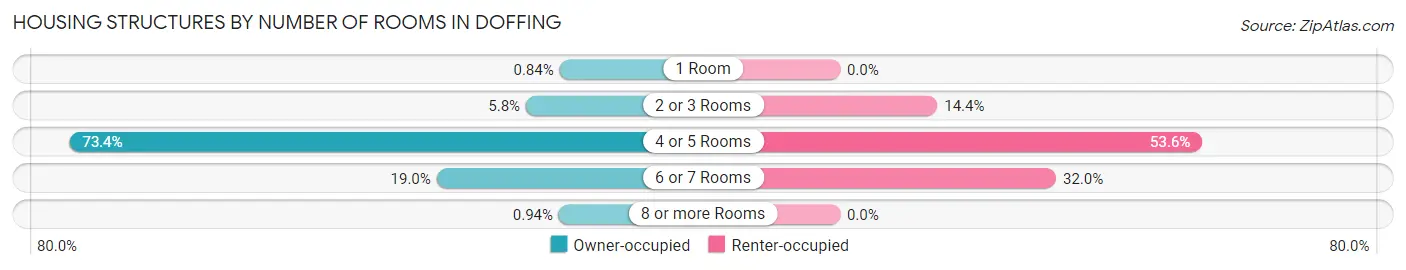
| Number of Rooms | Owner-occupied | Renter-occupied |
| 1 Room | 9 (0.8%) | 0 (0.0%) |
| 2 or 3 Rooms | 62 (5.8%) | 32 (14.4%) |
| 4 or 5 Rooms | 783 (73.4%) | 119 (53.6%) |
| 6 or 7 Rooms | 203 (19.0%) | 71 (32.0%) |
| 8 or more Rooms | 10 (0.9%) | 0 (0.0%) |
| Total | 1,067 (100.0%) | 222 (100.0%) |
Housing Structure by Heating Type in Doffing
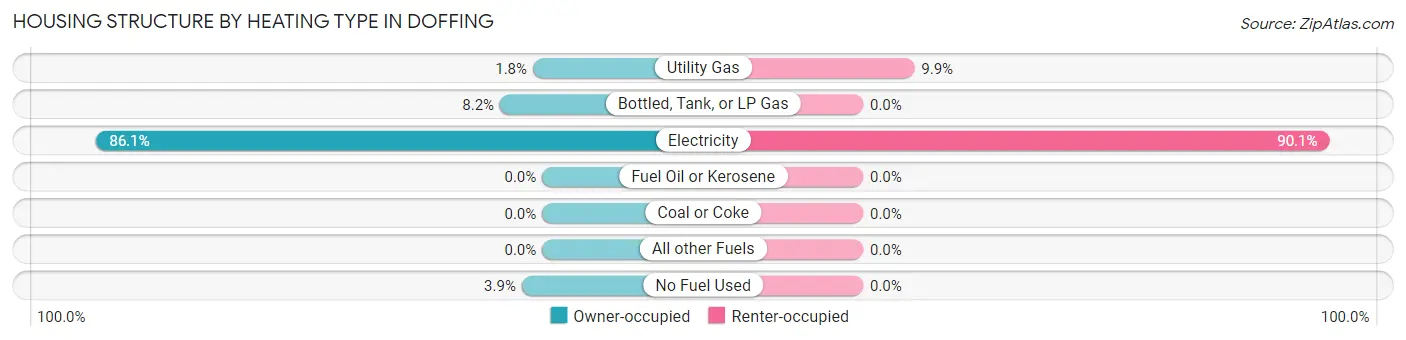
| Heating Type | Owner-occupied | Renter-occupied |
| Utility Gas | 19 (1.8%) | 22 (9.9%) |
| Bottled, Tank, or LP Gas | 87 (8.2%) | 0 (0.0%) |
| Electricity | 919 (86.1%) | 200 (90.1%) |
| Fuel Oil or Kerosene | 0 (0.0%) | 0 (0.0%) |
| Coal or Coke | 0 (0.0%) | 0 (0.0%) |
| All other Fuels | 0 (0.0%) | 0 (0.0%) |
| No Fuel Used | 42 (3.9%) | 0 (0.0%) |
| Total | 1,067 (100.0%) | 222 (100.0%) |
Household Vehicle Usage in Doffing
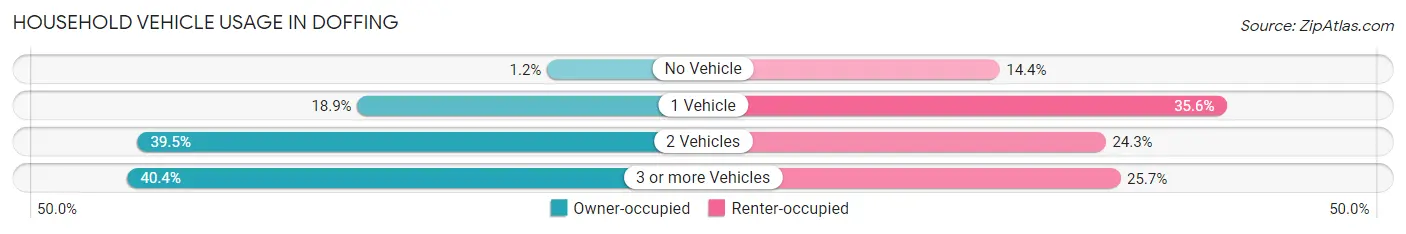
| Vehicles per Household | Owner-occupied | Renter-occupied |
| No Vehicle | 13 (1.2%) | 32 (14.4%) |
| 1 Vehicle | 202 (18.9%) | 79 (35.6%) |
| 2 Vehicles | 421 (39.5%) | 54 (24.3%) |
| 3 or more Vehicles | 431 (40.4%) | 57 (25.7%) |
| Total | 1,067 (100.0%) | 222 (100.0%) |
Real Estate & Mortgages in Doffing
Real Estate and Mortgage Overview in Doffing
| Characteristic | Without Mortgage | With Mortgage |
| Housing Units | 836 | 231 |
| Median Property Value | $79,800 | $92,900 |
| Median Household Income | $23,406 | $29 |
| Monthly Housing Costs | $403 | $0 |
| Real Estate Taxes | $1,262 | $0 |
Property Value by Mortgage Status in Doffing
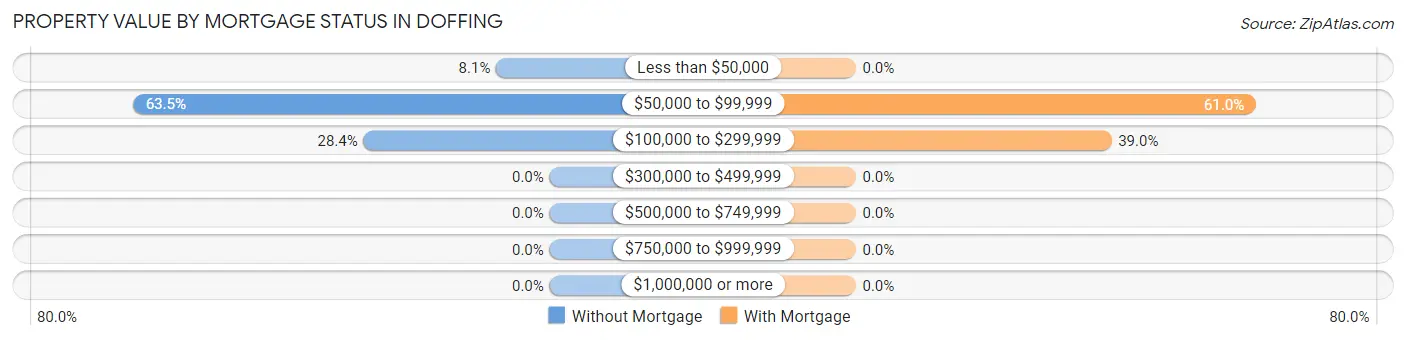
| Property Value | Without Mortgage | With Mortgage |
| Less than $50,000 | 68 (8.1%) | 0 (0.0%) |
| $50,000 to $99,999 | 531 (63.5%) | 141 (61.0%) |
| $100,000 to $299,999 | 237 (28.3%) | 90 (39.0%) |
| $300,000 to $499,999 | 0 (0.0%) | 0 (0.0%) |
| $500,000 to $749,999 | 0 (0.0%) | 0 (0.0%) |
| $750,000 to $999,999 | 0 (0.0%) | 0 (0.0%) |
| $1,000,000 or more | 0 (0.0%) | 0 (0.0%) |
| Total | 836 (100.0%) | 231 (100.0%) |
Household Income by Mortgage Status in Doffing
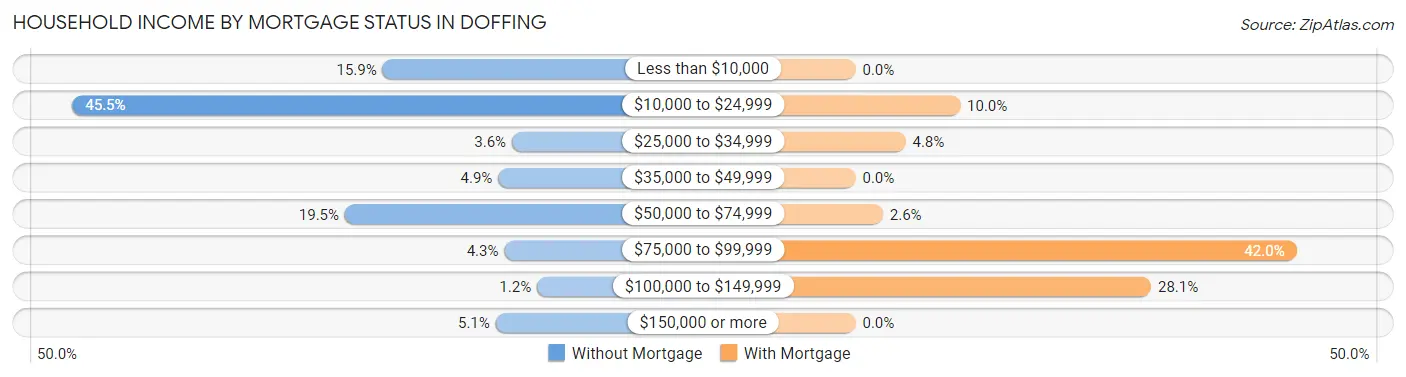
| Household Income | Without Mortgage | With Mortgage |
| Less than $10,000 | 133 (15.9%) | 0 (0.0%) |
| $10,000 to $24,999 | 380 (45.5%) | 23 (10.0%) |
| $25,000 to $34,999 | 30 (3.6%) | 11 (4.8%) |
| $35,000 to $49,999 | 41 (4.9%) | 0 (0.0%) |
| $50,000 to $74,999 | 163 (19.5%) | 6 (2.6%) |
| $75,000 to $99,999 | 36 (4.3%) | 97 (42.0%) |
| $100,000 to $149,999 | 10 (1.2%) | 65 (28.1%) |
| $150,000 or more | 43 (5.1%) | 0 (0.0%) |
| Total | 836 (100.0%) | 231 (100.0%) |
Property Value to Household Income Ratio in Doffing
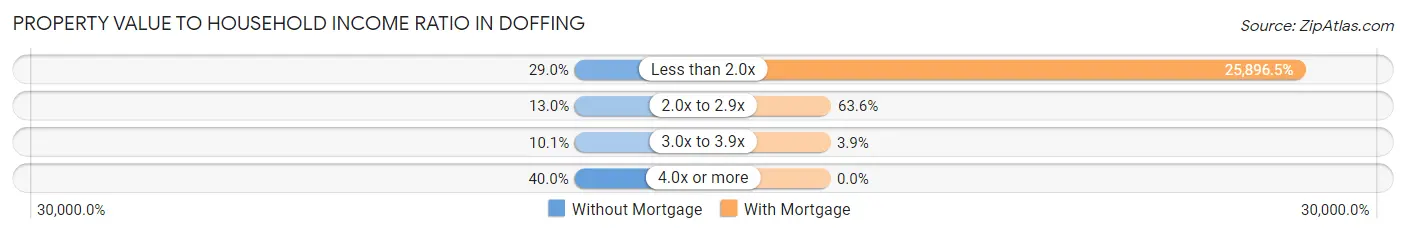
| Value-to-Income Ratio | Without Mortgage | With Mortgage |
| Less than 2.0x | 242 (28.9%) | 59,821 (25,896.5%) |
| 2.0x to 2.9x | 109 (13.0%) | 147 (63.6%) |
| 3.0x to 3.9x | 84 (10.1%) | 9 (3.9%) |
| 4.0x or more | 334 (40.0%) | 0 (0.0%) |
| Total | 836 (100.0%) | 231 (100.0%) |
Real Estate Taxes by Mortgage Status in Doffing
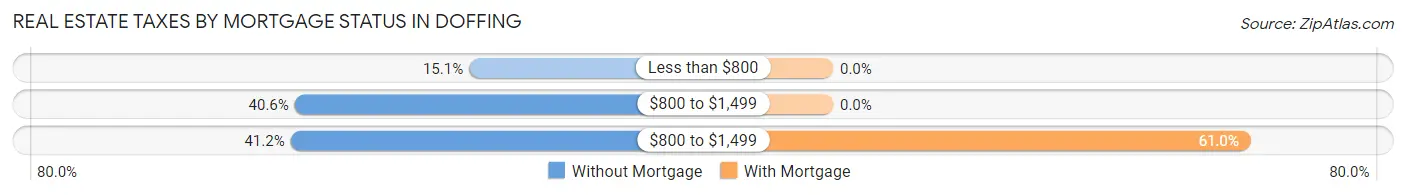
| Property Taxes | Without Mortgage | With Mortgage |
| Less than $800 | 126 (15.1%) | 0 (0.0%) |
| $800 to $1,499 | 339 (40.6%) | 0 (0.0%) |
| $800 to $1,499 | 344 (41.1%) | 141 (61.0%) |
| Total | 836 (100.0%) | 231 (100.0%) |
Health & Disability in Doffing
Health Insurance Coverage by Age in Doffing
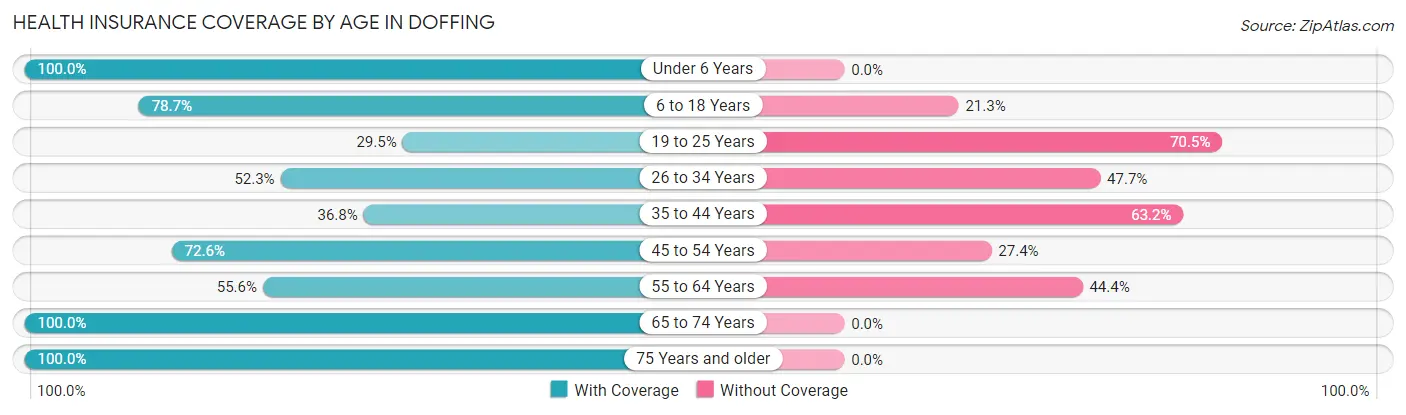
| Age Bracket | With Coverage | Without Coverage |
| Under 6 Years | 641 (100.0%) | 0 (0.0%) |
| 6 to 18 Years | 1,046 (78.7%) | 283 (21.3%) |
| 19 to 25 Years | 184 (29.5%) | 439 (70.5%) |
| 26 to 34 Years | 297 (52.3%) | 271 (47.7%) |
| 35 to 44 Years | 195 (36.8%) | 335 (63.2%) |
| 45 to 54 Years | 574 (72.6%) | 217 (27.4%) |
| 55 to 64 Years | 239 (55.6%) | 191 (44.4%) |
| 65 to 74 Years | 103 (100.0%) | 0 (0.0%) |
| 75 Years and older | 194 (100.0%) | 0 (0.0%) |
| Total | 3,473 (66.7%) | 1,736 (33.3%) |
Health Insurance Coverage by Citizenship Status in Doffing
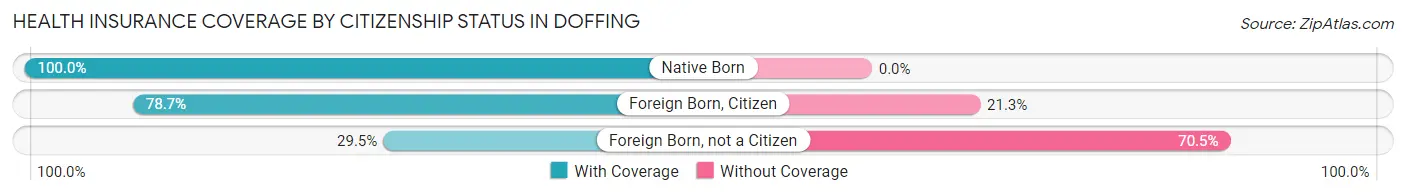
| Citizenship Status | With Coverage | Without Coverage |
| Native Born | 641 (100.0%) | 0 (0.0%) |
| Foreign Born, Citizen | 1,046 (78.7%) | 283 (21.3%) |
| Foreign Born, not a Citizen | 184 (29.5%) | 439 (70.5%) |
Health Insurance Coverage by Household Income in Doffing
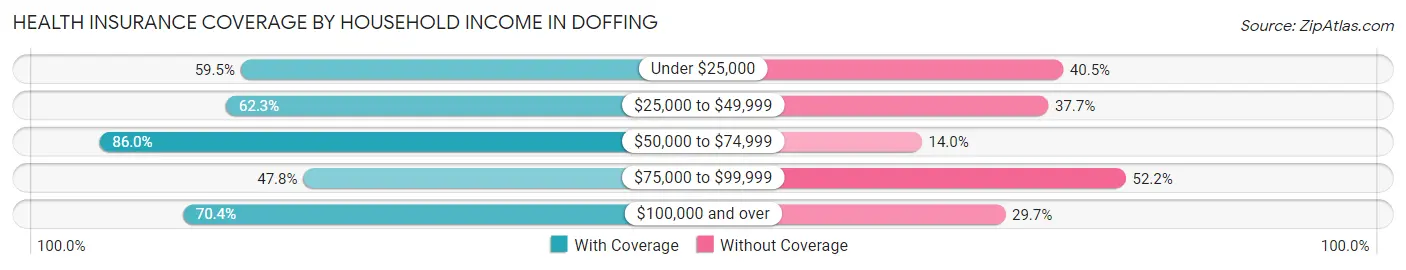
| Household Income | With Coverage | Without Coverage |
| Under $25,000 | 1,311 (59.5%) | 892 (40.5%) |
| $25,000 to $49,999 | 218 (62.3%) | 132 (37.7%) |
| $50,000 to $74,999 | 1,142 (86.0%) | 186 (14.0%) |
| $75,000 to $99,999 | 280 (47.8%) | 306 (52.2%) |
| $100,000 and over | 522 (70.4%) | 220 (29.6%) |
Public vs Private Health Insurance Coverage by Age in Doffing
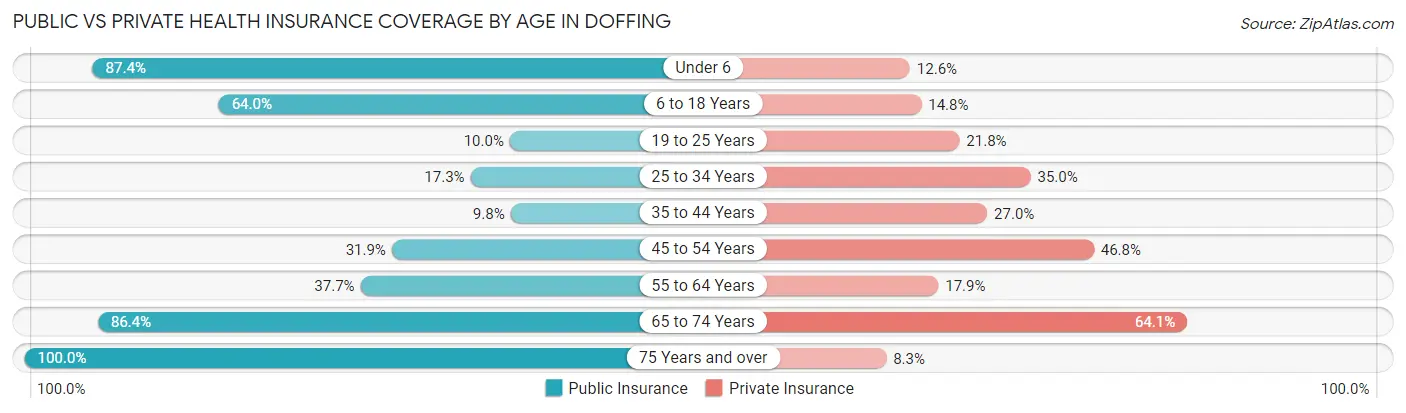
| Age Bracket | Public Insurance | Private Insurance |
| Under 6 | 560 (87.4%) | 81 (12.6%) |
| 6 to 18 Years | 850 (64.0%) | 196 (14.7%) |
| 19 to 25 Years | 62 (10.0%) | 136 (21.8%) |
| 25 to 34 Years | 98 (17.2%) | 199 (35.0%) |
| 35 to 44 Years | 52 (9.8%) | 143 (27.0%) |
| 45 to 54 Years | 252 (31.9%) | 370 (46.8%) |
| 55 to 64 Years | 162 (37.7%) | 77 (17.9%) |
| 65 to 74 Years | 89 (86.4%) | 66 (64.1%) |
| 75 Years and over | 194 (100.0%) | 16 (8.3%) |
| Total | 2,319 (44.5%) | 1,284 (24.6%) |
Disability Status by Sex by Age in Doffing
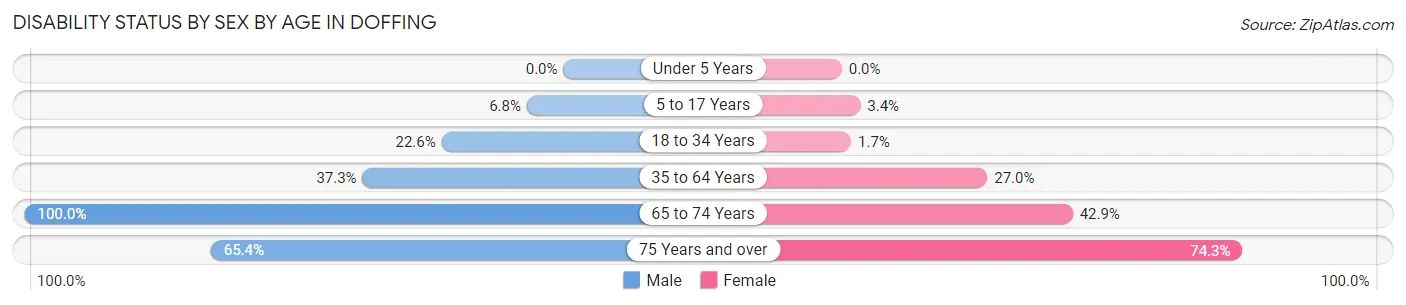
| Age Bracket | Male | Female |
| Under 5 Years | 0 (0.0%) | 0 (0.0%) |
| 5 to 17 Years | 49 (6.8%) | 18 (3.4%) |
| 18 to 34 Years | 163 (22.6%) | 11 (1.7%) |
| 35 to 64 Years | 305 (37.3%) | 252 (27.0%) |
| 65 to 74 Years | 54 (100.0%) | 21 (42.9%) |
| 75 Years and over | 53 (65.4%) | 84 (74.3%) |
Disability Class by Sex by Age in Doffing
Disability Class: Hearing Difficulty
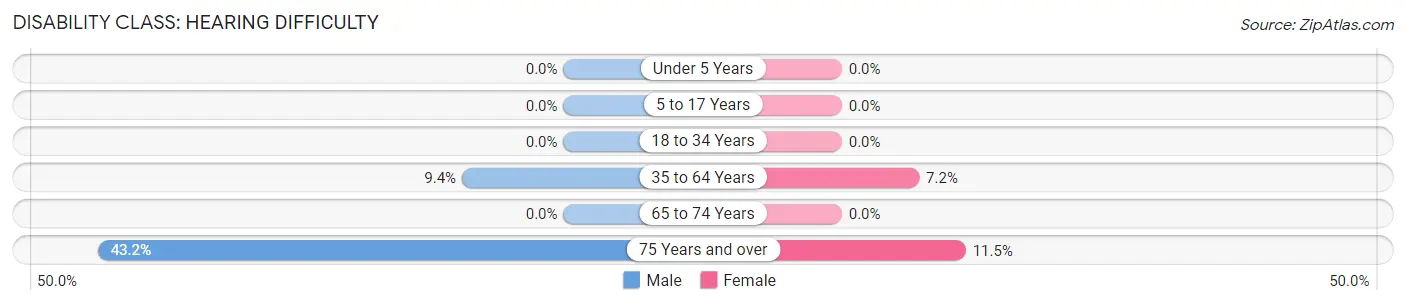
| Age Bracket | Male | Female |
| Under 5 Years | 0 (0.0%) | 0 (0.0%) |
| 5 to 17 Years | 0 (0.0%) | 0 (0.0%) |
| 18 to 34 Years | 0 (0.0%) | 0 (0.0%) |
| 35 to 64 Years | 77 (9.4%) | 67 (7.2%) |
| 65 to 74 Years | 0 (0.0%) | 0 (0.0%) |
| 75 Years and over | 35 (43.2%) | 13 (11.5%) |
Disability Class: Vision Difficulty
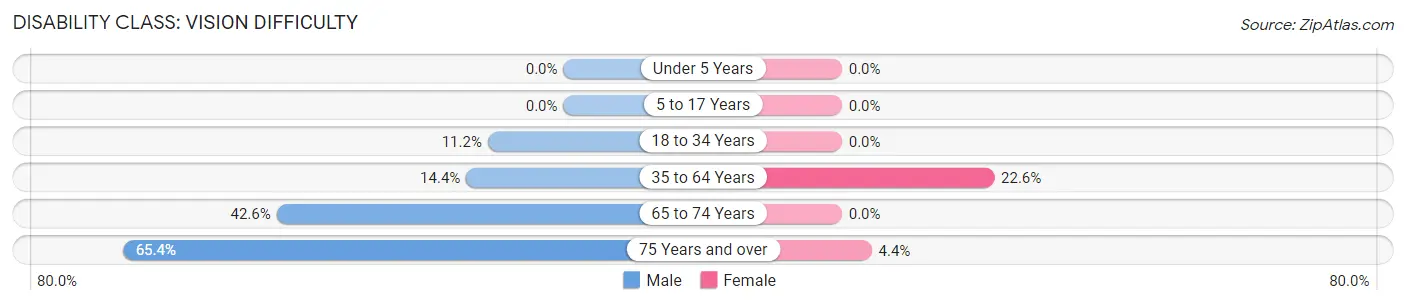
| Age Bracket | Male | Female |
| Under 5 Years | 0 (0.0%) | 0 (0.0%) |
| 5 to 17 Years | 0 (0.0%) | 0 (0.0%) |
| 18 to 34 Years | 81 (11.2%) | 0 (0.0%) |
| 35 to 64 Years | 118 (14.4%) | 211 (22.6%) |
| 65 to 74 Years | 23 (42.6%) | 0 (0.0%) |
| 75 Years and over | 53 (65.4%) | 5 (4.4%) |
Disability Class: Cognitive Difficulty
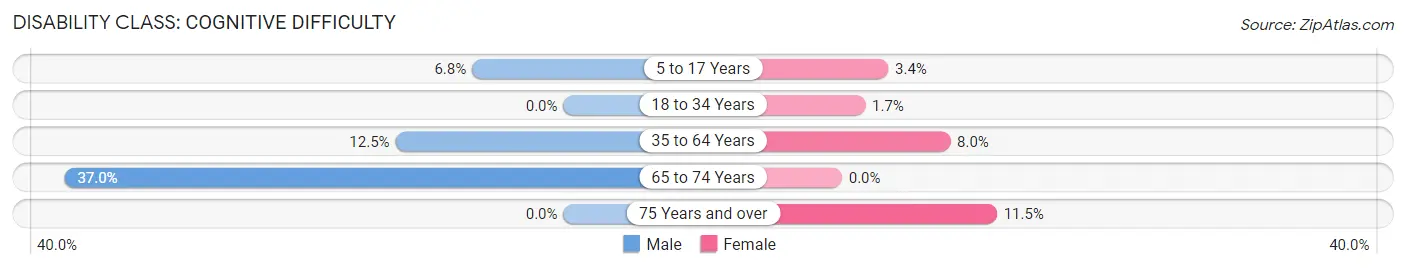
| Age Bracket | Male | Female |
| 5 to 17 Years | 49 (6.8%) | 18 (3.4%) |
| 18 to 34 Years | 0 (0.0%) | 11 (1.7%) |
| 35 to 64 Years | 102 (12.5%) | 75 (8.0%) |
| 65 to 74 Years | 20 (37.0%) | 0 (0.0%) |
| 75 Years and over | 0 (0.0%) | 13 (11.5%) |
Disability Class: Ambulatory Difficulty
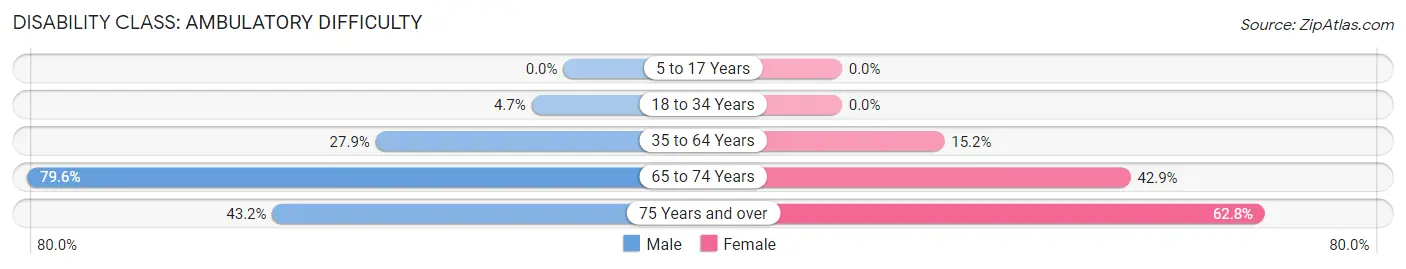
| Age Bracket | Male | Female |
| 5 to 17 Years | 0 (0.0%) | 0 (0.0%) |
| 18 to 34 Years | 34 (4.7%) | 0 (0.0%) |
| 35 to 64 Years | 228 (27.9%) | 142 (15.2%) |
| 65 to 74 Years | 43 (79.6%) | 21 (42.9%) |
| 75 Years and over | 35 (43.2%) | 71 (62.8%) |
Disability Class: Self-Care Difficulty
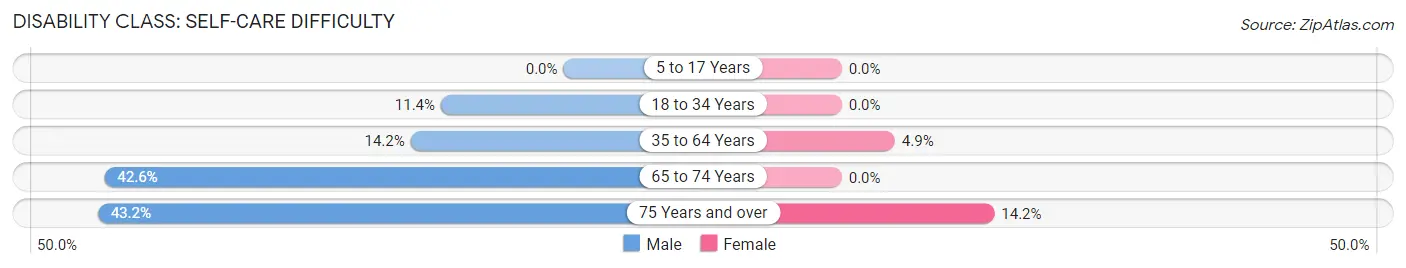
| Age Bracket | Male | Female |
| 5 to 17 Years | 0 (0.0%) | 0 (0.0%) |
| 18 to 34 Years | 82 (11.4%) | 0 (0.0%) |
| 35 to 64 Years | 116 (14.2%) | 46 (4.9%) |
| 65 to 74 Years | 23 (42.6%) | 0 (0.0%) |
| 75 Years and over | 35 (43.2%) | 16 (14.2%) |
Technology Access in Doffing
Computing Device Access in Doffing
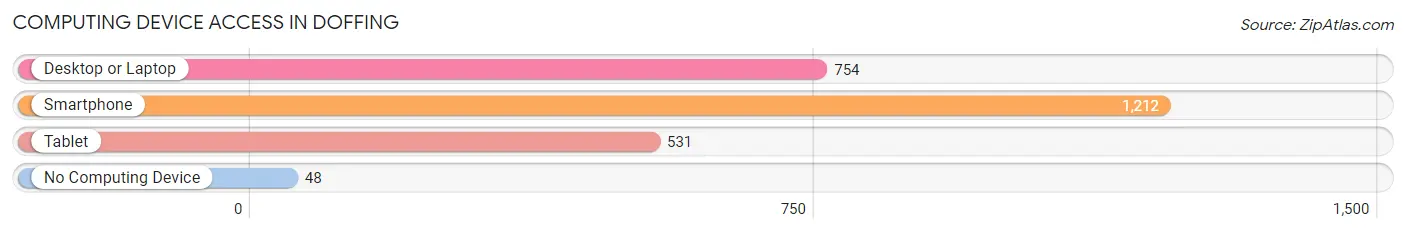
| Device Type | # Households | % Households |
| Desktop or Laptop | 754 | 58.5% |
| Smartphone | 1,212 | 94.0% |
| Tablet | 531 | 41.2% |
| No Computing Device | 48 | 3.7% |
| Total | 1,289 | 100.0% |
Internet Access in Doffing
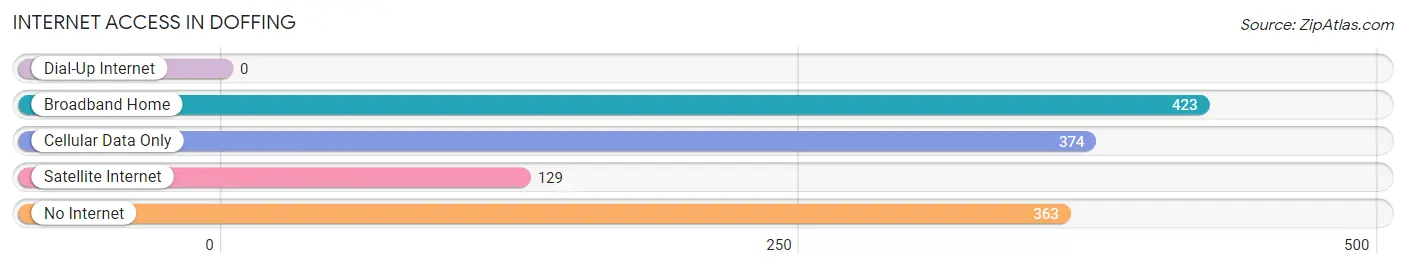
| Internet Type | # Households | % Households |
| Dial-Up Internet | 0 | 0.0% |
| Broadband Home | 423 | 32.8% |
| Cellular Data Only | 374 | 29.0% |
| Satellite Internet | 129 | 10.0% |
| No Internet | 363 | 28.2% |
| Total | 1,289 | 100.0% |
Doffing Summary
Doffing is a small unincorporated community located in the southeastern corner of Texas, in the county of San Patricio. It is situated about 20 miles south of Corpus Christi and about 10 miles east of Mathis. The population of Doffing was estimated to be around 200 people in 2000.
History
The area that is now Doffing was first settled in the late 1800s by a group of German immigrants. The settlement was originally called “Doffing” after the German word for “dove”, which was the symbol of peace and hope for the settlers. The settlers built a small church and a few homes, and the community slowly grew.
In the early 1900s, the town was officially established and the post office was opened. The town was named after the German settlers, and the post office was named “Doffing”. The town grew slowly, but steadily, and by the mid-1900s, it had a population of around 200 people.
Geography
Doffing is located in the southeastern corner of Texas, in the county of San Patricio. It is situated about 20 miles south of Corpus Christi and about 10 miles east of Mathis. The town is located in a flat, coastal plain, and is surrounded by farmland and ranches. The climate is generally warm and humid, with temperatures ranging from the mid-70s in the summer to the mid-50s in the winter.
Economy
The economy of Doffing is largely based on agriculture and ranching. The town is surrounded by farmland and ranches, and many of the residents are employed in these industries. The town also has a few small businesses, such as a grocery store, a gas station, and a few restaurants.
Demographics
The population of Doffing was estimated to be around 200 people in 2000. The majority of the population is of Hispanic or Latino origin, and the town is predominantly Catholic. The median household income is around $30,000, and the median home value is around $60,000. The town is served by the Mathis Independent School District.
Common Questions
What is Per Capita Income in Doffing?
Per Capita income in Doffing is $13,176.
What is the Median Family Income in Doffing?
Median Family Income in Doffing is $24,346.
What is the Median Household income in Doffing?
Median Household Income in Doffing is $24,404.
What is Income or Wage Gap in Doffing?
Income or Wage Gap in Doffing is 29.2%.
Women in Doffing earn 70.8 cents for every dollar earned by a man.
What is Inequality or Gini Index in Doffing?
Inequality or Gini Index in Doffing is 0.53.
What is the Total Population of Doffing?
Total Population of Doffing is 5,209.
What is the Total Male Population of Doffing?
Total Male Population of Doffing is 2,632.
What is the Total Female Population of Doffing?
Total Female Population of Doffing is 2,577.
What is the Ratio of Males per 100 Females in Doffing?
There are 102.13 Males per 100 Females in Doffing.
What is the Ratio of Females per 100 Males in Doffing?
There are 97.91 Females per 100 Males in Doffing.
What is the Median Population Age in Doffing?
Median Population Age in Doffing is 26.1 Years.
What is the Average Family Size in Doffing
Average Family Size in Doffing is 4.4 People.
What is the Average Household Size in Doffing
Average Household Size in Doffing is 4.0 People.
How Large is the Labor Force in Doffing?
There are 1,848 People in the Labor Forcein in Doffing.
What is the Percentage of People in the Labor Force in Doffing?
52.2% of People are in the Labor Force in Doffing.
What is the Unemployment Rate in Doffing?
Unemployment Rate in Doffing is 5.4%.