Zip Codes with the Highest Percentage of Families with Income Below $10,000 in Henderson, TX
RELATED REPORTS & OPTIONS
Family Income | $0-10k
Henderson
Compare Zip Codes
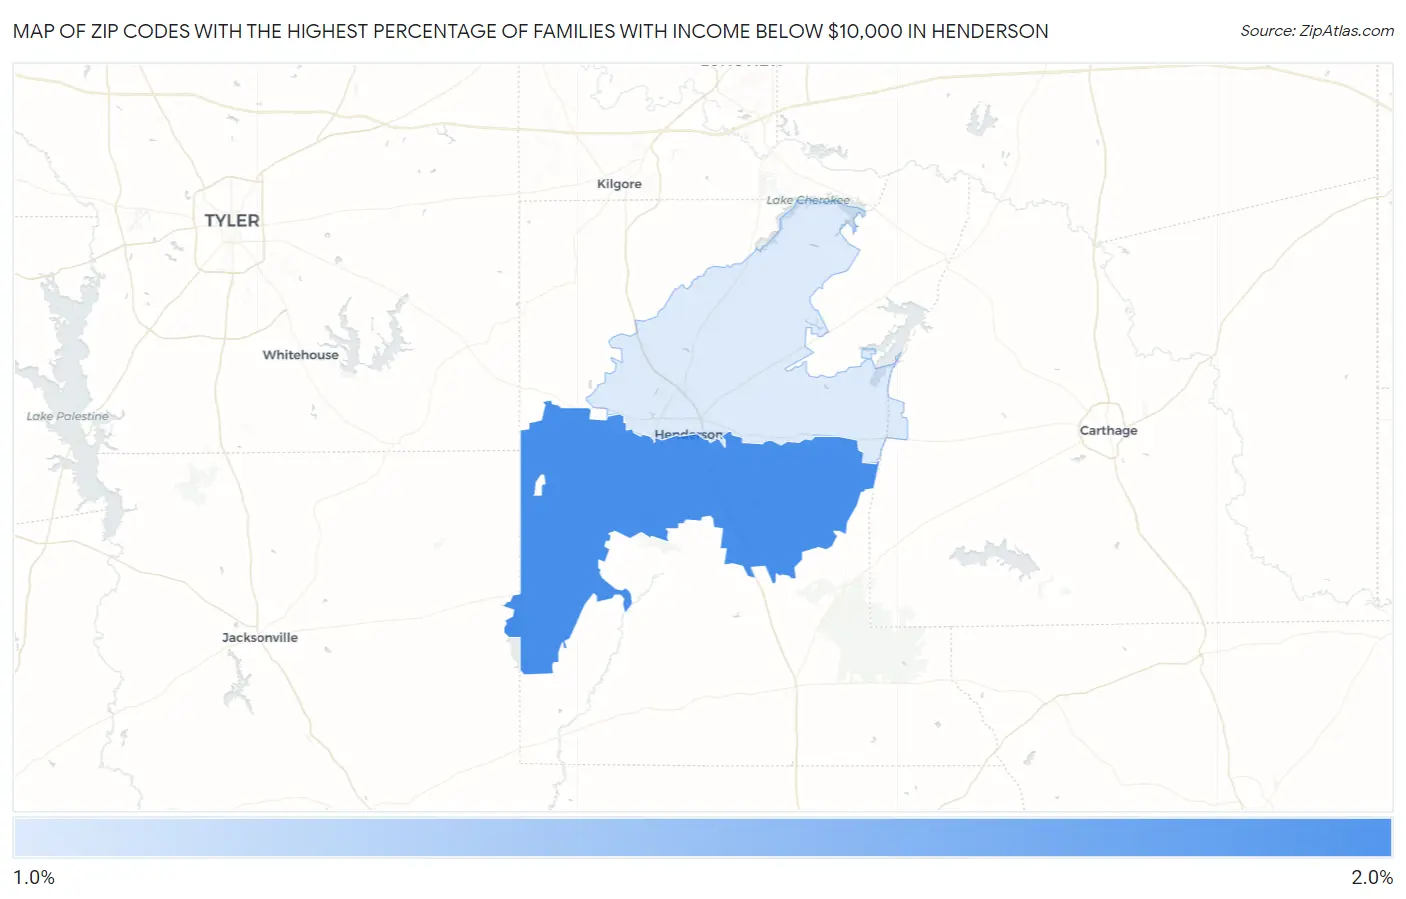
Map of Zip Codes with the Highest Percentage of Families with Income Below $10,000 in Henderson
1.8%
2.0%
Zip Codes with the Highest Percentage of Families with Income Below $10,000 in Henderson, TX
| Zip Code | Families with Income < $10k | vs State | vs National | |
| 1. | 75654 | 2.0% | 3.5%(-1.50)#1,044 | 3.1%(-1.10)#15,429 |
| 2. | 75652 | 1.8% | 3.5%(-1.70)#1,096 | 3.1%(-1.30)#16,400 |
1
Common Questions
What are the Top Zip Codes with the Highest Percentage of Families with Income Below $10,000 in Henderson, TX?
Top Zip Codes with the Highest Percentage of Families with Income Below $10,000 in Henderson, TX are:
What zip code has the Highest Percentage of Families with Income Below $10,000 in Henderson, TX?
75654 has the Highest Percentage of Families with Income Below $10,000 in Henderson, TX with 2.0%.
What is the Percentage of Families with Income Below $10,000 in Henderson, TX?
Percentage of Families with Income Below $10,000 in Henderson is 2.8%.
What is the Percentage of Families with Income Below $10,000 in Texas?
Percentage of Families with Income Below $10,000 in Texas is 3.5%.
What is the Percentage of Families with Income Below $10,000 in the United States?
Percentage of Families with Income Below $10,000 in the United States is 3.1%.