Balmorhea, TX Map & Demographics
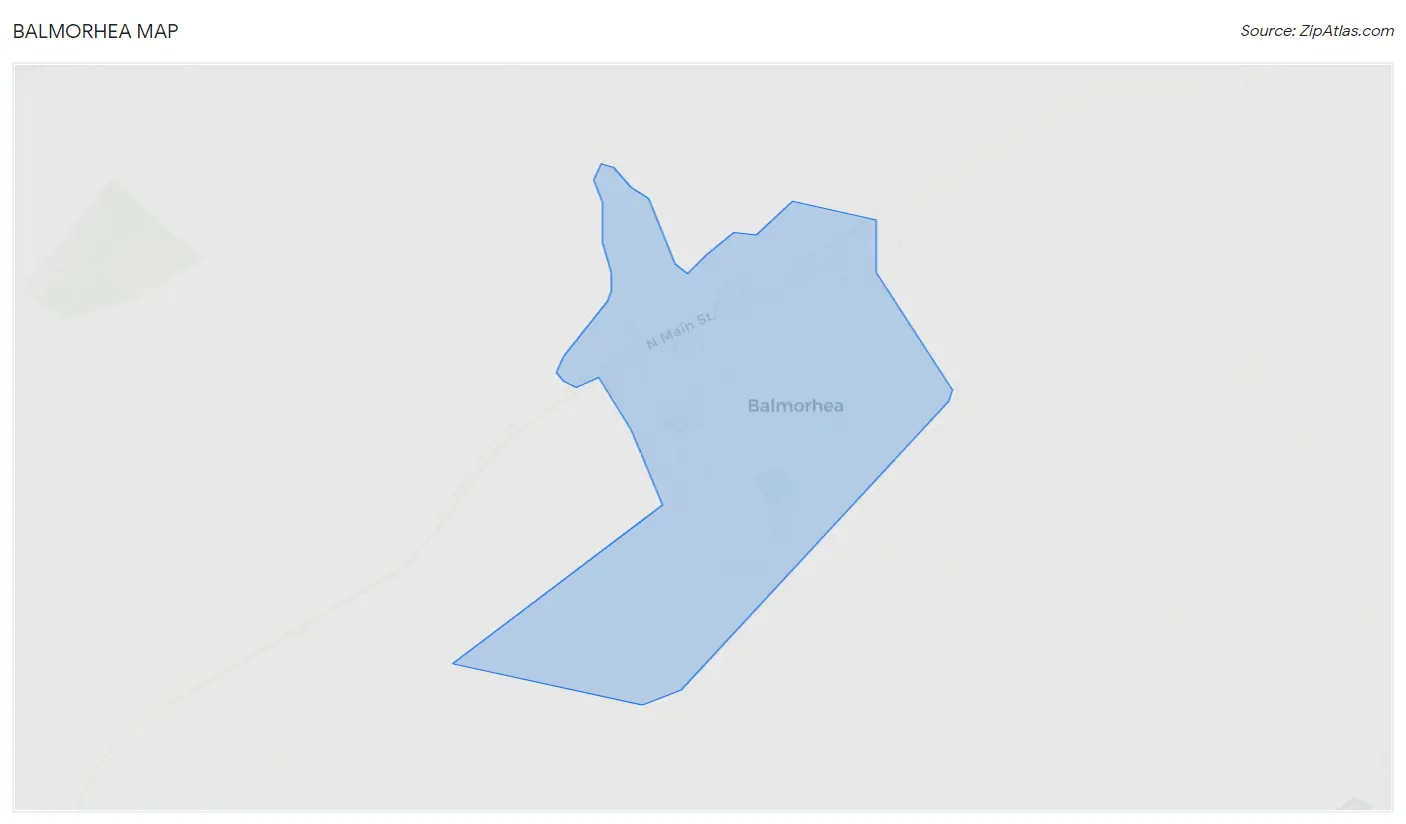
Balmorhea Map
Balmorhea Overview
$31,674
PER CAPITA INCOME
$73,958
AVG FAMILY INCOME
$61,250
AVG HOUSEHOLD INCOME
95.7%
WAGE / INCOME GAP [ % ]
4.3¢/ $1
WAGE / INCOME GAP [ $ ]
0.41
INEQUALITY / GINI INDEX
462
TOTAL POPULATION
341
MALE POPULATION
121
FEMALE POPULATION
281.82
MALES / 100 FEMALES
35.48
FEMALES / 100 MALES
45.4
MEDIAN AGE
3.5
AVG FAMILY SIZE
3.3
AVG HOUSEHOLD SIZE
298
LABOR FORCE [ PEOPLE ]
76.8%
PERCENT IN LABOR FORCE
Balmorhea Zip Codes
Balmorhea Area Codes
Income in Balmorhea
Income Overview in Balmorhea
Per Capita Income in Balmorhea is $31,674, while median incomes of families and households are $73,958 and $61,250 respectively.
| Characteristic | Number | Measure |
| Per Capita Income | 462 | $31,674 |
| Median Family Income | 127 | $73,958 |
| Mean Family Income | 127 | $62,387 |
| Median Household Income | 139 | $61,250 |
| Mean Household Income | 139 | $58,240 |
| Income Deficit | 127 | $0 |
| Wage / Income Gap (%) | 462 | 95.65% |
| Wage / Income Gap ($) | 462 | 4.35¢ per $1 |
| Gini / Inequality Index | 462 | 0.41 |
Earnings by Sex in Balmorhea
Average Earnings in Balmorhea are $55,705, $57,468 for men and $2,499 for women, a difference of 95.7%.
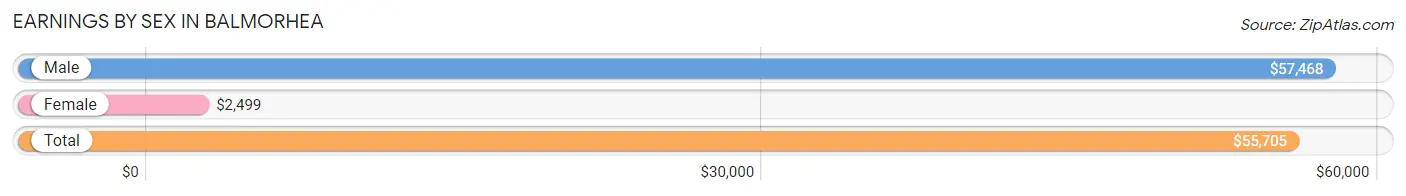
| Sex | Number | Average Earnings |
| Male | 247 (81.8%) | $57,468 |
| Female | 55 (18.2%) | $2,499 |
| Total | 302 (100.0%) | $55,705 |
Earnings by Sex by Income Bracket in Balmorhea
The most common earnings brackets in Balmorhea are $75,000 to $99,999 for men (94 | 38.1%) and $2,499 or less for women (29 | 52.7%).
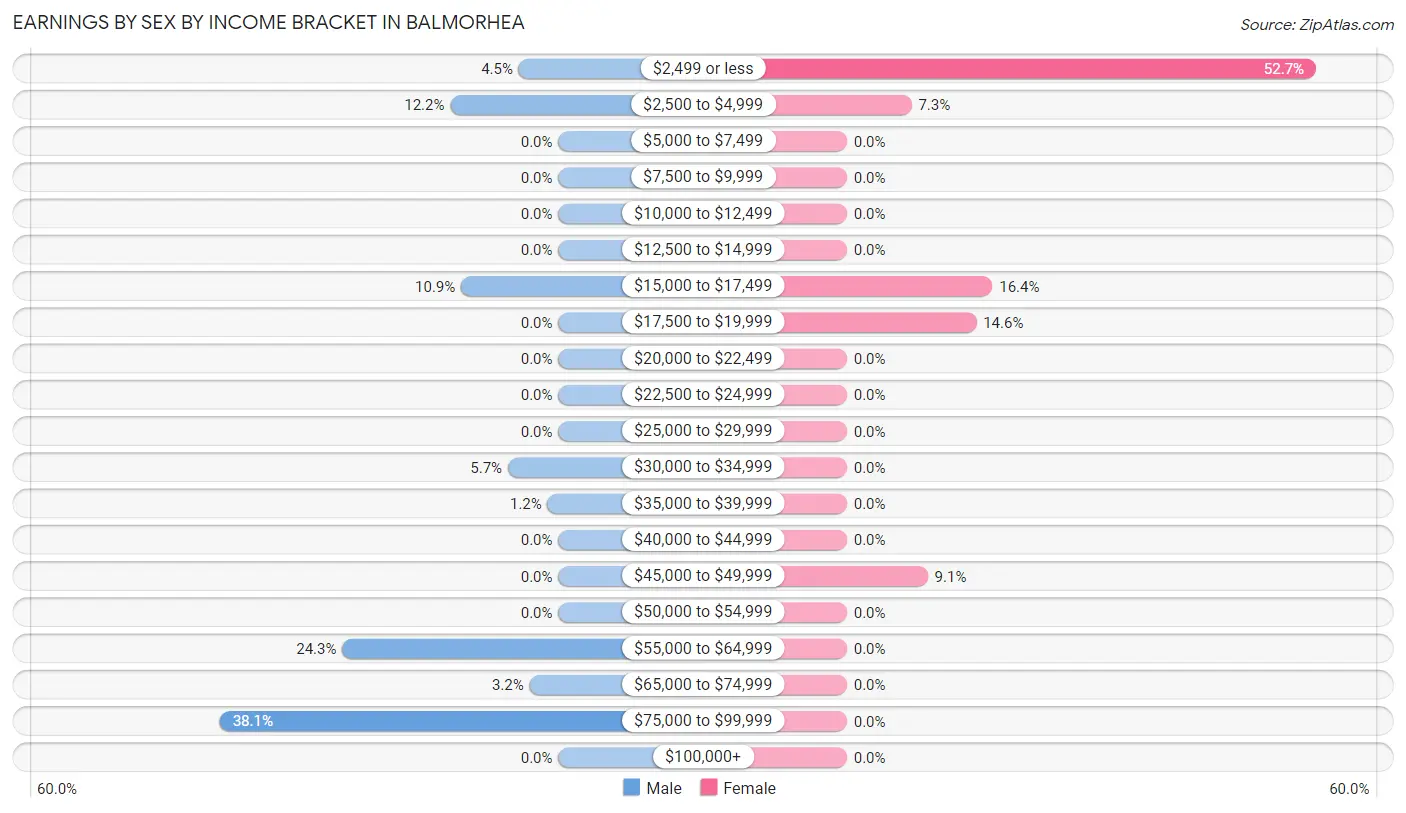
| Income | Male | Female |
| $2,499 or less | 11 (4.4%) | 29 (52.7%) |
| $2,500 to $4,999 | 30 (12.1%) | 4 (7.3%) |
| $5,000 to $7,499 | 0 (0.0%) | 0 (0.0%) |
| $7,500 to $9,999 | 0 (0.0%) | 0 (0.0%) |
| $10,000 to $12,499 | 0 (0.0%) | 0 (0.0%) |
| $12,500 to $14,999 | 0 (0.0%) | 0 (0.0%) |
| $15,000 to $17,499 | 27 (10.9%) | 9 (16.4%) |
| $17,500 to $19,999 | 0 (0.0%) | 8 (14.5%) |
| $20,000 to $22,499 | 0 (0.0%) | 0 (0.0%) |
| $22,500 to $24,999 | 0 (0.0%) | 0 (0.0%) |
| $25,000 to $29,999 | 0 (0.0%) | 0 (0.0%) |
| $30,000 to $34,999 | 14 (5.7%) | 0 (0.0%) |
| $35,000 to $39,999 | 3 (1.2%) | 0 (0.0%) |
| $40,000 to $44,999 | 0 (0.0%) | 0 (0.0%) |
| $45,000 to $49,999 | 0 (0.0%) | 5 (9.1%) |
| $50,000 to $54,999 | 0 (0.0%) | 0 (0.0%) |
| $55,000 to $64,999 | 60 (24.3%) | 0 (0.0%) |
| $65,000 to $74,999 | 8 (3.2%) | 0 (0.0%) |
| $75,000 to $99,999 | 94 (38.1%) | 0 (0.0%) |
| $100,000+ | 0 (0.0%) | 0 (0.0%) |
| Total | 247 (100.0%) | 55 (100.0%) |
Earnings by Sex by Educational Attainment in Balmorhea
Average earnings in Balmorhea are $59,405 for men and $2,499 for women, a difference of 95.8%. Men with an educational attainment of high school diploma enjoy the highest average annual earnings of $83,245, while those with less than high school education earn the least with $57,560. Women with an educational attainment of high school diploma earn the most with the average annual earnings of $2,499, while those with high school diploma education have the smallest earnings of $2,499.
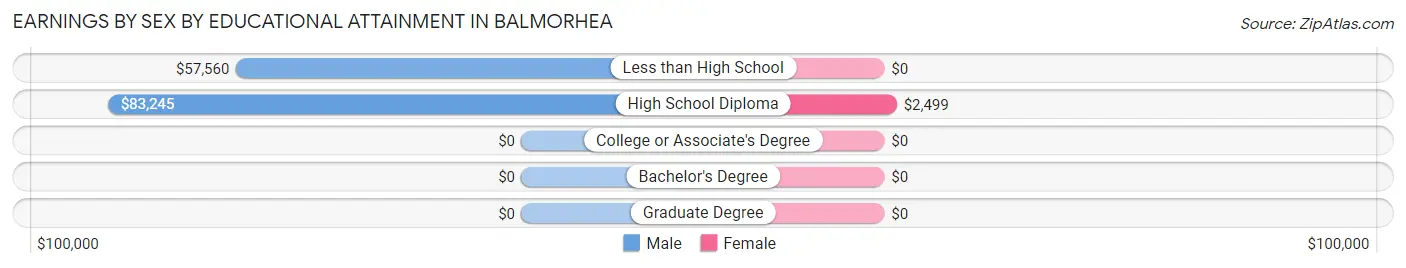
| Educational Attainment | Male Income | Female Income |
| Less than High School | $57,560 | $0 |
| High School Diploma | $83,245 | $2,499 |
| College or Associate's Degree | - | - |
| Bachelor's Degree | - | - |
| Graduate Degree | - | - |
| Total | $59,405 | $2,499 |
Family Income in Balmorhea
Family Income Brackets in Balmorhea
According to the Balmorhea family income data, there are 35 families falling into the $75,000 to $99,999 income range, which is the most common income bracket and makes up 27.6% of all families.
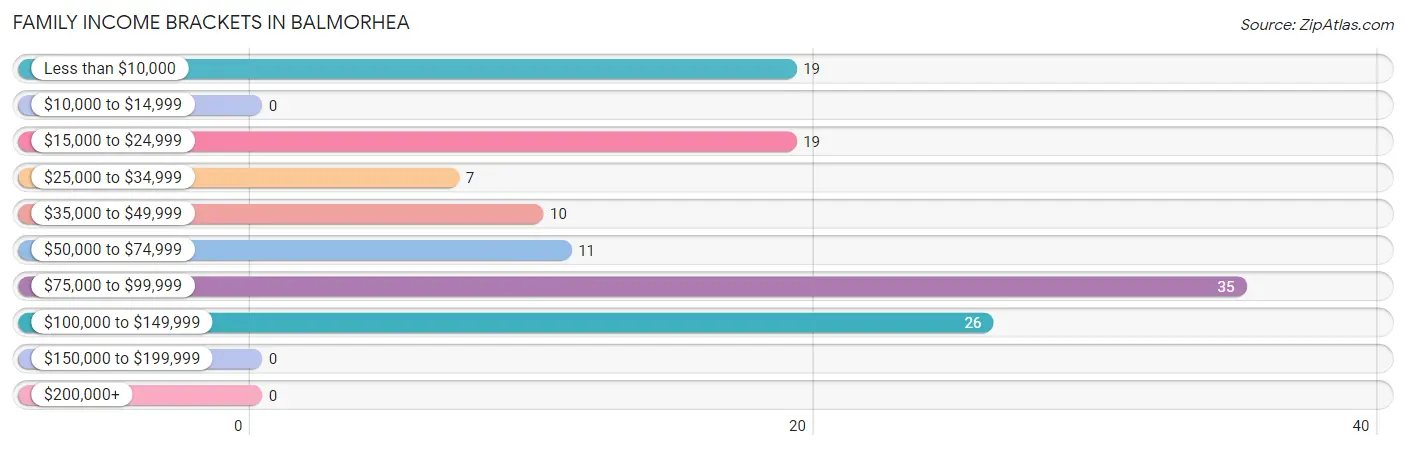
| Income Bracket | # Families | % Families |
| Less than $10,000 | 19 | 15.0% |
| $10,000 to $14,999 | 0 | 0.0% |
| $15,000 to $24,999 | 19 | 15.0% |
| $25,000 to $34,999 | 7 | 5.5% |
| $35,000 to $49,999 | 10 | 7.9% |
| $50,000 to $74,999 | 11 | 8.7% |
| $75,000 to $99,999 | 35 | 27.6% |
| $100,000 to $149,999 | 26 | 20.5% |
| $150,000 to $199,999 | 0 | 0.0% |
| $200,000+ | 0 | 0.0% |
Family Income by Famaliy Size in Balmorhea
| Income Bracket | # Families | Median Income |
| 2-Person Families | 85 (66.9%) | $0 |
| 3-Person Families | 26 (20.5%) | $0 |
| 4-Person Families | 11 (8.7%) | $0 |
| 5-Person Families | 0 (0.0%) | $0 |
| 6-Person Families | 5 (3.9%) | $0 |
| 7+ Person Families | 0 (0.0%) | $0 |
| Total | 127 (100.0%) | $73,958 |
Family Income by Number of Earners in Balmorhea
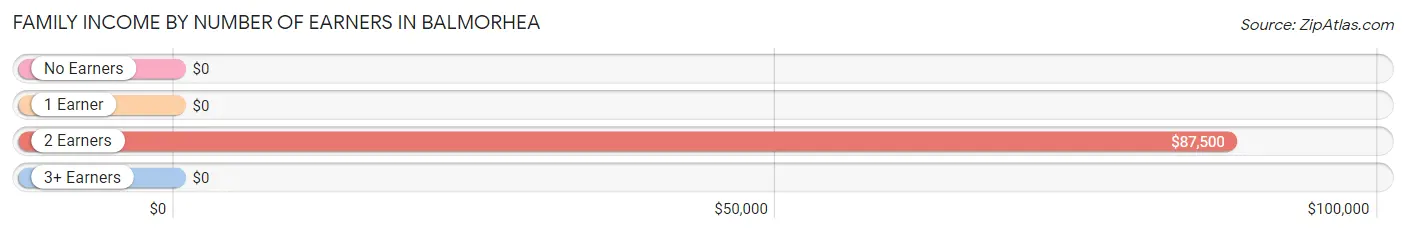
| Number of Earners | # Families | Median Income |
| No Earners | 20 (15.8%) | $0 |
| 1 Earner | 32 (25.2%) | $0 |
| 2 Earners | 54 (42.5%) | $87,500 |
| 3+ Earners | 21 (16.5%) | $0 |
| Total | 127 (100.0%) | $73,958 |
Household Income in Balmorhea
Household Income Brackets in Balmorhea
With 35 households falling in the category, the $75,000 to $99,999 income range is the most frequent in Balmorhea, accounting for 25.2% of all households.
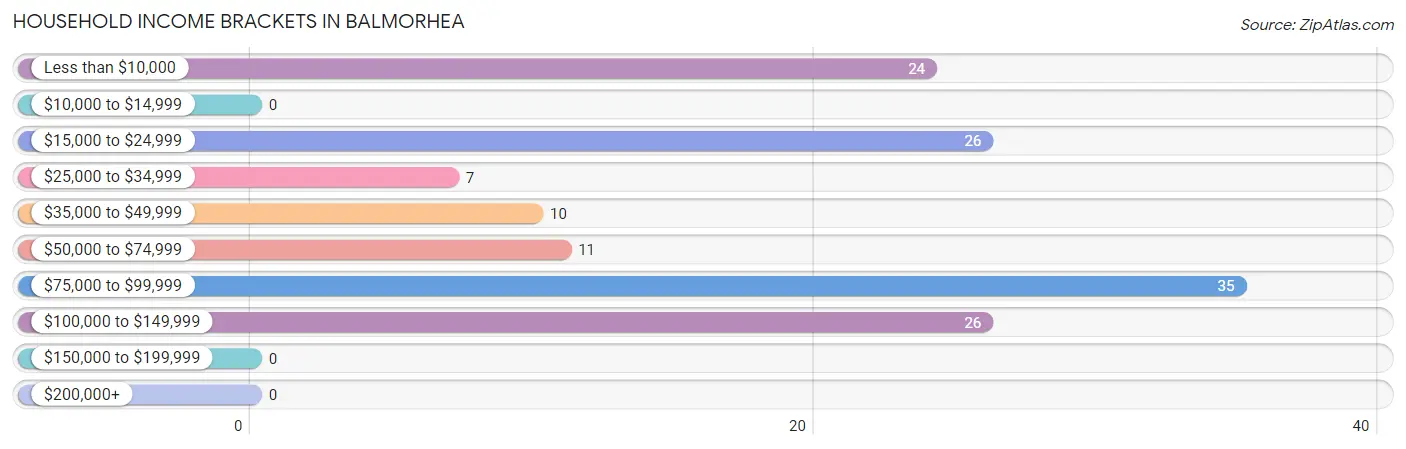
| Income Bracket | # Households | % Households |
| Less than $10,000 | 24 | 17.3% |
| $10,000 to $14,999 | 0 | 0.0% |
| $15,000 to $24,999 | 26 | 18.7% |
| $25,000 to $34,999 | 7 | 5.0% |
| $35,000 to $49,999 | 10 | 7.2% |
| $50,000 to $74,999 | 11 | 7.9% |
| $75,000 to $99,999 | 35 | 25.2% |
| $100,000 to $149,999 | 26 | 18.7% |
| $150,000 to $199,999 | 0 | 0.0% |
| $200,000+ | 0 | 0.0% |
Household Income by Householder Age in Balmorhea
| Income Bracket | # Households | Median Income |
| 15 to 24 Years | 8 (5.8%) | $0 |
| 25 to 44 Years | 35 (25.2%) | $0 |
| 45 to 64 Years | 35 (25.2%) | $0 |
| 65+ Years | 61 (43.9%) | $0 |
| Total | 139 (100.0%) | $61,250 |
Poverty in Balmorhea
Income Below Poverty by Sex and Age in Balmorhea
With 27.3% poverty level for males and 33.9% for females among the residents of Balmorhea, 6 to 11 year old males and 16 and 17 year old females are the most vulnerable to poverty, with 10 males (100.0%) and 3 females (100.0%) in their respective age groups living below the poverty level.
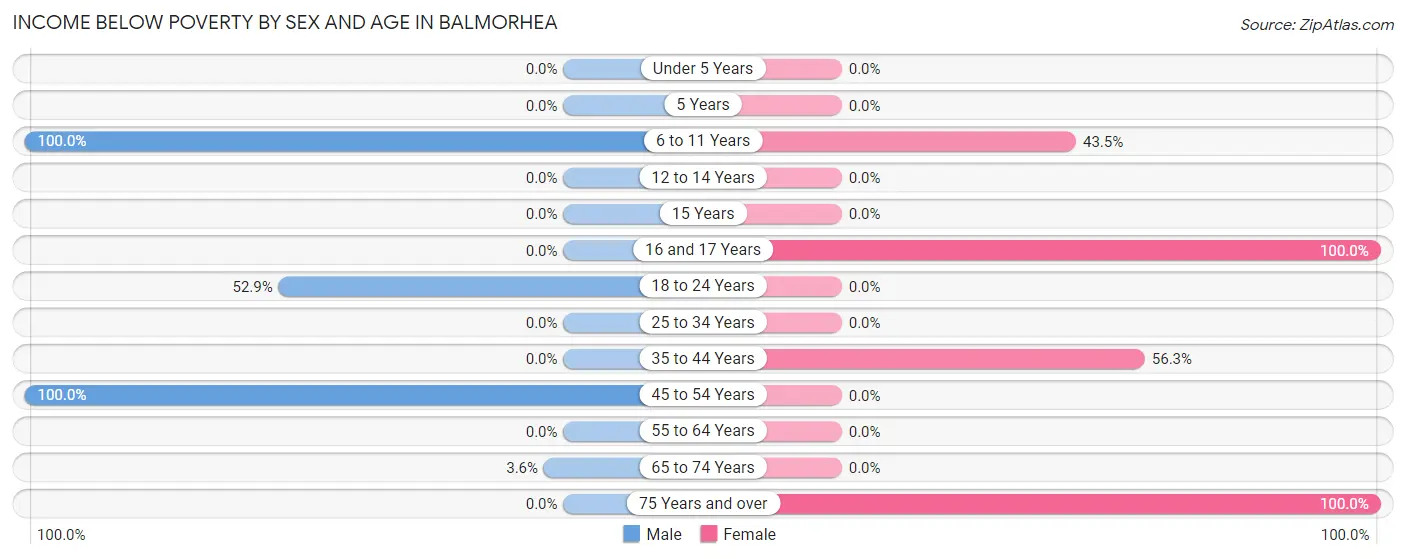
| Age Bracket | Male | Female |
| Under 5 Years | 0 (0.0%) | 0 (0.0%) |
| 5 Years | 0 (0.0%) | 0 (0.0%) |
| 6 to 11 Years | 10 (100.0%) | 10 (43.5%) |
| 12 to 14 Years | 0 (0.0%) | 0 (0.0%) |
| 15 Years | 0 (0.0%) | 0 (0.0%) |
| 16 and 17 Years | 0 (0.0%) | 3 (100.0%) |
| 18 to 24 Years | 37 (52.9%) | 0 (0.0%) |
| 25 to 34 Years | 0 (0.0%) | 0 (0.0%) |
| 35 to 44 Years | 0 (0.0%) | 18 (56.2%) |
| 45 to 54 Years | 41 (100.0%) | 0 (0.0%) |
| 55 to 64 Years | 0 (0.0%) | 0 (0.0%) |
| 65 to 74 Years | 5 (3.6%) | 0 (0.0%) |
| 75 Years and over | 0 (0.0%) | 10 (100.0%) |
| Total | 93 (27.3%) | 41 (33.9%) |
Income Above Poverty by Sex and Age in Balmorhea
According to the poverty statistics in Balmorhea, males aged under 5 years and females aged under 5 years are the age groups that are most secure financially, with 100.0% of males and 100.0% of females in these age groups living above the poverty line.
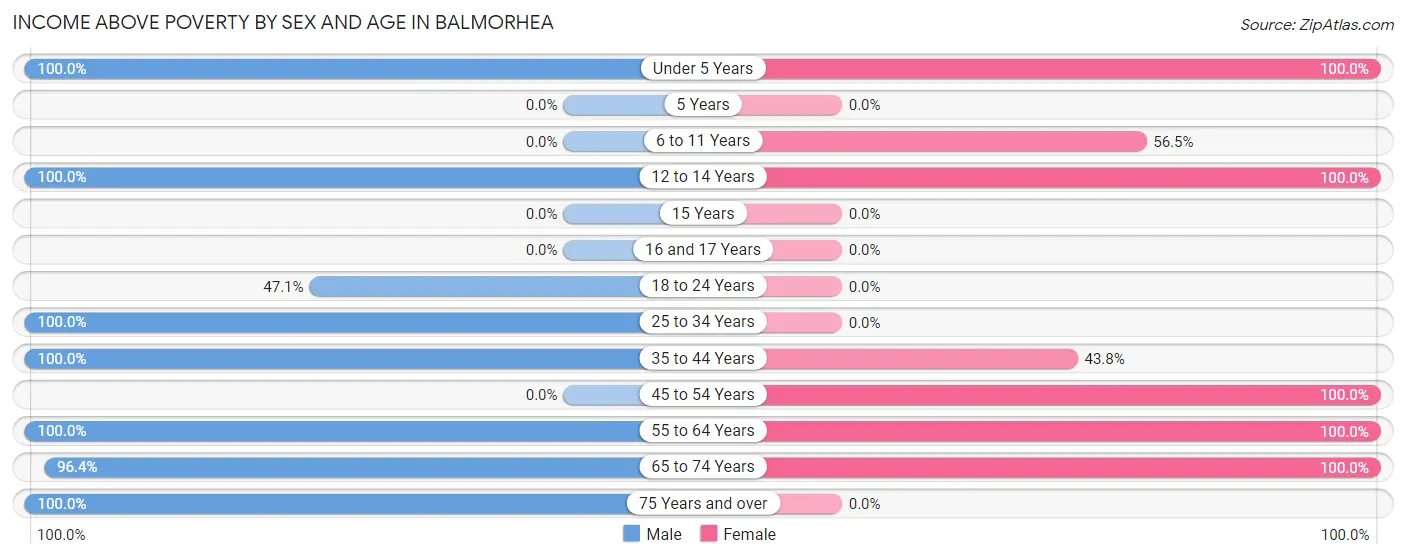
| Age Bracket | Male | Female |
| Under 5 Years | 7 (100.0%) | 15 (100.0%) |
| 5 Years | 0 (0.0%) | 0 (0.0%) |
| 6 to 11 Years | 0 (0.0%) | 13 (56.5%) |
| 12 to 14 Years | 14 (100.0%) | 5 (100.0%) |
| 15 Years | 0 (0.0%) | 0 (0.0%) |
| 16 and 17 Years | 0 (0.0%) | 0 (0.0%) |
| 18 to 24 Years | 33 (47.1%) | 0 (0.0%) |
| 25 to 34 Years | 14 (100.0%) | 0 (0.0%) |
| 35 to 44 Years | 21 (100.0%) | 14 (43.8%) |
| 45 to 54 Years | 0 (0.0%) | 11 (100.0%) |
| 55 to 64 Years | 19 (100.0%) | 16 (100.0%) |
| 65 to 74 Years | 133 (96.4%) | 6 (100.0%) |
| 75 Years and over | 7 (100.0%) | 0 (0.0%) |
| Total | 248 (72.7%) | 80 (66.1%) |
Income Below Poverty Among Married-Couple Families in Balmorhea
The poverty statistics for married-couple families in Balmorhea show that 26.8% or 19 of the total 71 families live below the poverty line. Families with 1 or 2 children have the highest poverty rate of 100.0%, comprising of 11 families. On the other hand, families with no children have the lowest poverty rate of 13.3%, which includes 8 families.
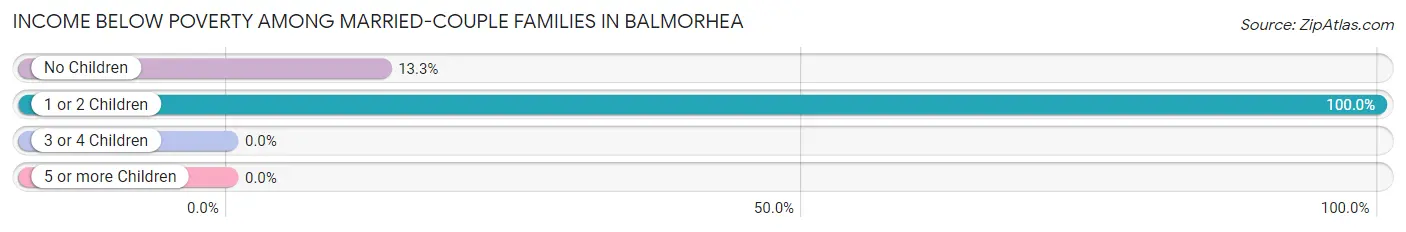
| Children | Above Poverty | Below Poverty |
| No Children | 52 (86.7%) | 8 (13.3%) |
| 1 or 2 Children | 0 (0.0%) | 11 (100.0%) |
| 3 or 4 Children | 0 (0.0%) | 0 (0.0%) |
| 5 or more Children | 0 (0.0%) | 0 (0.0%) |
| Total | 52 (73.2%) | 19 (26.8%) |
Income Below Poverty Among Single-Parent Households in Balmorhea
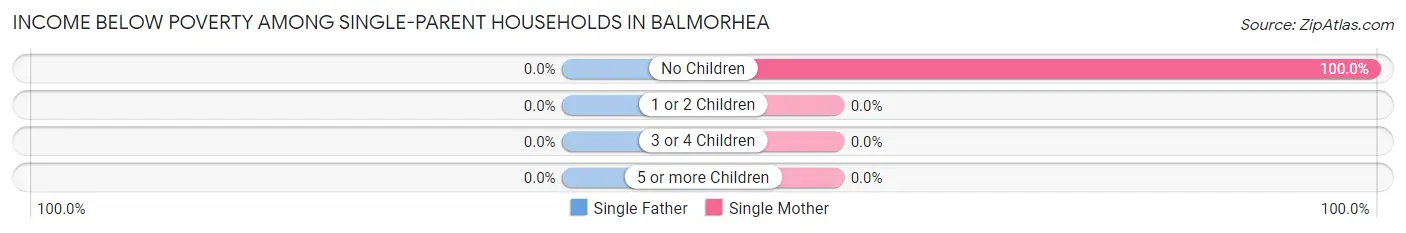
| Children | Single Father | Single Mother |
| No Children | 0 (0.0%) | 19 (100.0%) |
| 1 or 2 Children | 0 (0.0%) | 0 (0.0%) |
| 3 or 4 Children | 0 (0.0%) | 0 (0.0%) |
| 5 or more Children | 0 (0.0%) | 0 (0.0%) |
| Total | 0 (0.0%) | 19 (65.5%) |
Income Below Poverty Among Married-Couple vs Single-Parent Households in Balmorhea
The poverty data for Balmorhea shows that 19 of the married-couple family households (26.8%) and 19 of the single-parent households (33.9%) are living below the poverty level. Within the married-couple family households, those with 1 or 2 children have the highest poverty rate, with 11 households (100.0%) falling below the poverty line. Among the single-parent households, those with no children have the highest poverty rate, with 19 household (41.3%) living below poverty.
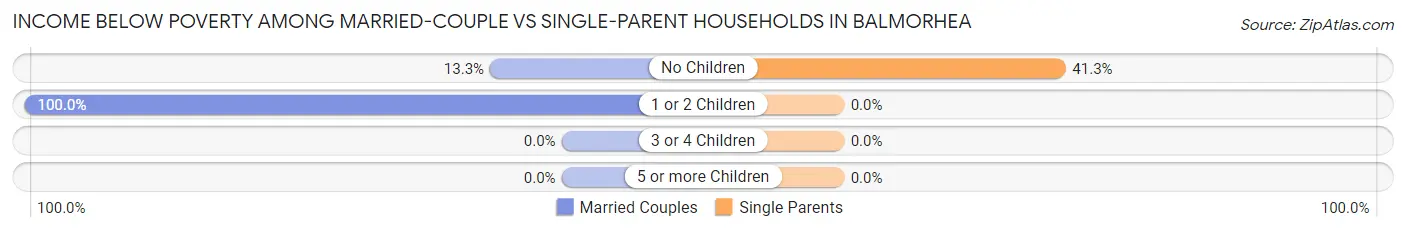
| Children | Married-Couple Families | Single-Parent Households |
| No Children | 8 (13.3%) | 19 (41.3%) |
| 1 or 2 Children | 11 (100.0%) | 0 (0.0%) |
| 3 or 4 Children | 0 (0.0%) | 0 (0.0%) |
| 5 or more Children | 0 (0.0%) | 0 (0.0%) |
| Total | 19 (26.8%) | 19 (33.9%) |
Race in Balmorhea
The most populous races in Balmorhea are White / Caucasian (355 | 76.8%), Hispanic or Latino (314 | 68.0%), and Two or more Races (87 | 18.8%).
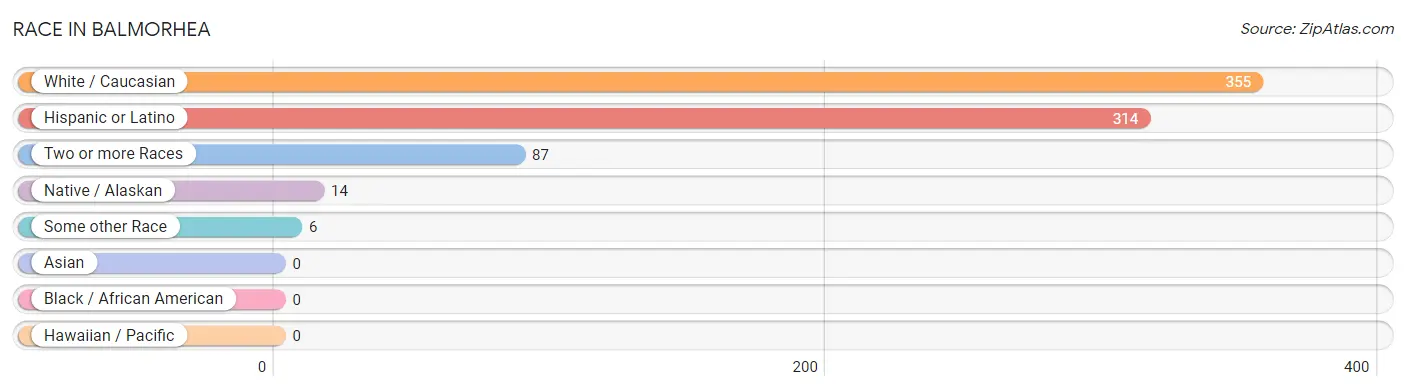
| Race | # Population | % Population |
| Asian | 0 | 0.0% |
| Black / African American | 0 | 0.0% |
| Hawaiian / Pacific | 0 | 0.0% |
| Hispanic or Latino | 314 | 68.0% |
| Native / Alaskan | 14 | 3.0% |
| White / Caucasian | 355 | 76.8% |
| Two or more Races | 87 | 18.8% |
| Some other Race | 6 | 1.3% |
| Total | 462 | 100.0% |
Ancestry in Balmorhea
The most populous ancestries reported in Balmorhea are Mexican (300 | 64.9%), American (27 | 5.8%), and Comanche (14 | 3.0%), together accounting for 73.8% of all Balmorhea residents.
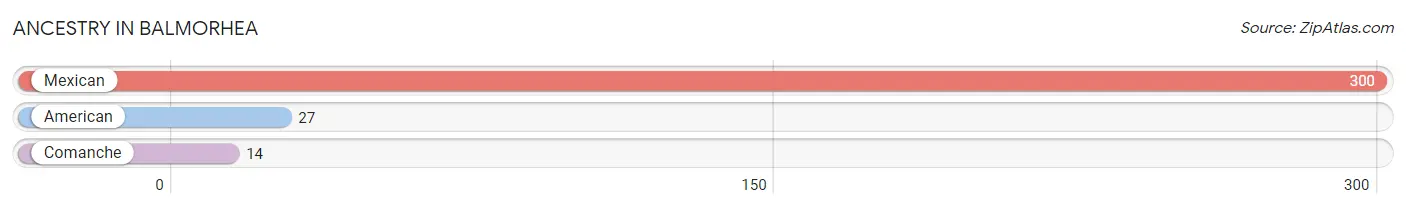
| Ancestry | # Population | % Population |
| American | 27 | 5.8% |
| Comanche | 14 | 3.0% |
| Mexican | 300 | 64.9% | View All 3 Rows |
Immigrants in Balmorhea
The most numerous immigrant groups reported in Balmorhea came from Central America (29 | 6.3%), Latin America (29 | 6.3%), and Mexico (29 | 6.3%), together accounting for 18.8% of all Balmorhea residents.
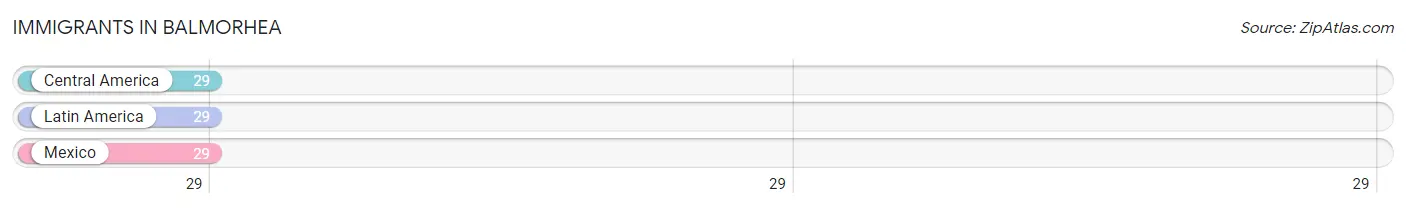
| Immigration Origin | # Population | % Population |
| Central America | 29 | 6.3% |
| Latin America | 29 | 6.3% |
| Mexico | 29 | 6.3% | View All 3 Rows |
Sex and Age in Balmorhea
Sex and Age in Balmorhea
The most populous age groups in Balmorhea are 70 to 74 Years (106 | 31.1%) for men and 10 to 14 Years (18 | 14.9%) for women.
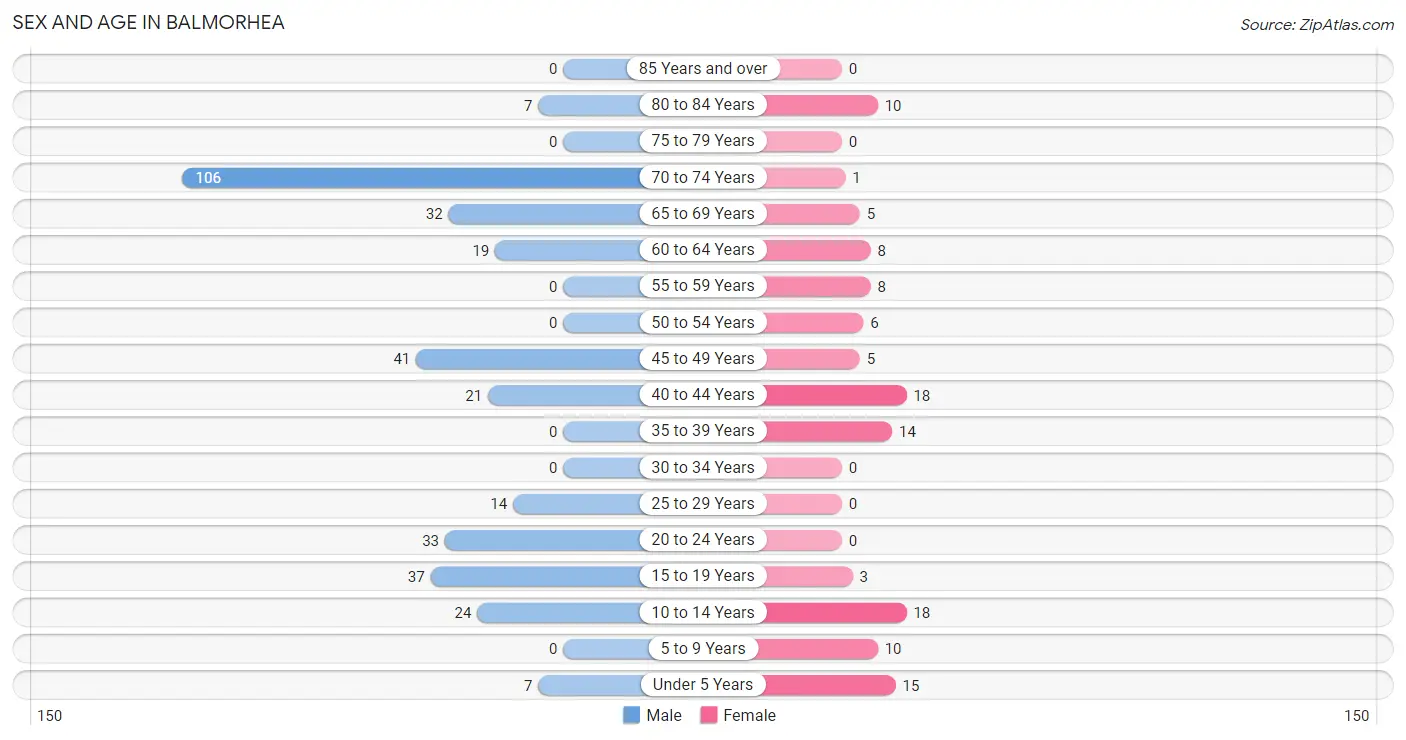
| Age Bracket | Male | Female |
| Under 5 Years | 7 (2.1%) | 15 (12.4%) |
| 5 to 9 Years | 0 (0.0%) | 10 (8.3%) |
| 10 to 14 Years | 24 (7.0%) | 18 (14.9%) |
| 15 to 19 Years | 37 (10.8%) | 3 (2.5%) |
| 20 to 24 Years | 33 (9.7%) | 0 (0.0%) |
| 25 to 29 Years | 14 (4.1%) | 0 (0.0%) |
| 30 to 34 Years | 0 (0.0%) | 0 (0.0%) |
| 35 to 39 Years | 0 (0.0%) | 14 (11.6%) |
| 40 to 44 Years | 21 (6.2%) | 18 (14.9%) |
| 45 to 49 Years | 41 (12.0%) | 5 (4.1%) |
| 50 to 54 Years | 0 (0.0%) | 6 (5.0%) |
| 55 to 59 Years | 0 (0.0%) | 8 (6.6%) |
| 60 to 64 Years | 19 (5.6%) | 8 (6.6%) |
| 65 to 69 Years | 32 (9.4%) | 5 (4.1%) |
| 70 to 74 Years | 106 (31.1%) | 1 (0.8%) |
| 75 to 79 Years | 0 (0.0%) | 0 (0.0%) |
| 80 to 84 Years | 7 (2.1%) | 10 (8.3%) |
| 85 Years and over | 0 (0.0%) | 0 (0.0%) |
| Total | 341 (100.0%) | 121 (100.0%) |
Families and Households in Balmorhea
Median Family Size in Balmorhea
The median family size in Balmorhea is 3.54 persons per family, with single female/mother families (29 | 22.8%) accounting for the largest median family size of 5.38 persons per family. On the other hand, married-couple families (71 | 55.9%) represent the smallest median family size with 2.44 persons per family.
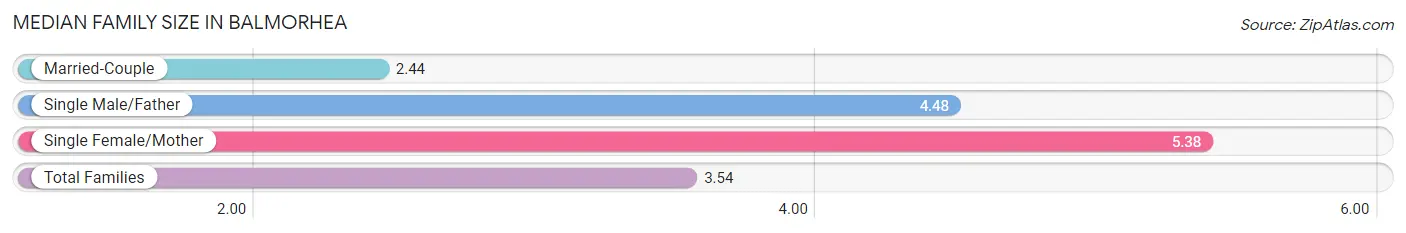
| Family Type | # Families | Family Size |
| Married-Couple | 71 (55.9%) | 2.44 |
| Single Male/Father | 27 (21.3%) | 4.48 |
| Single Female/Mother | 29 (22.8%) | 5.38 |
| Total Families | 127 (100.0%) | 3.54 |
Median Household Size in Balmorhea
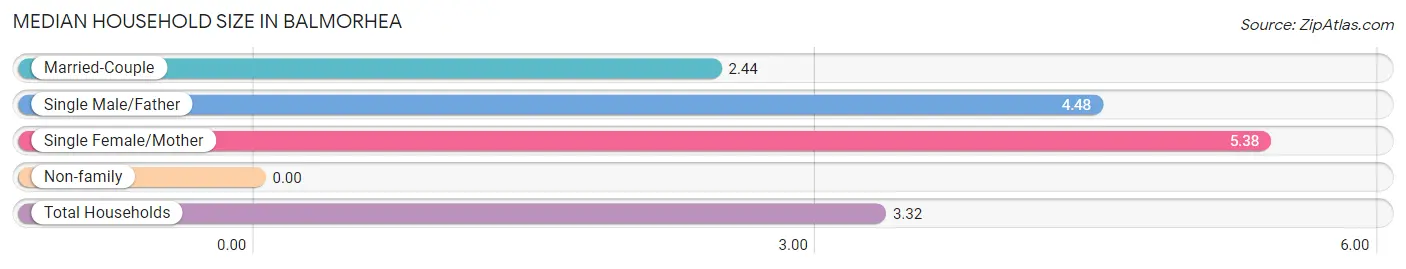
| Household Type | # Households | Household Size |
| Married-Couple | 71 (51.1%) | 2.44 |
| Single Male/Father | 27 (19.4%) | 4.48 |
| Single Female/Mother | 29 (20.9%) | 5.38 |
| Non-family | 12 (8.6%) | - |
| Total Households | 139 (100.0%) | 3.32 |
Household Size by Marriage Status in Balmorhea
Out of a total of 139 households in Balmorhea, 127 (91.4%) are family households, while 12 (8.6%) are nonfamily households. The most numerous type of family households are 2-person households, comprising 85, and the most common type of nonfamily households are 1-person households, comprising 12.
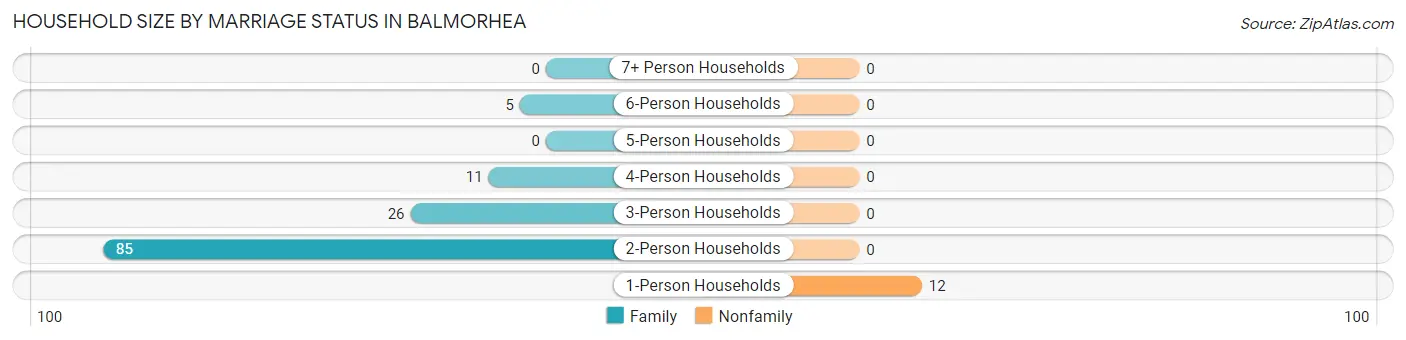
| Household Size | Family Households | Nonfamily Households |
| 1-Person Households | - | 12 (8.6%) |
| 2-Person Households | 85 (61.2%) | 0 (0.0%) |
| 3-Person Households | 26 (18.7%) | 0 (0.0%) |
| 4-Person Households | 11 (7.9%) | 0 (0.0%) |
| 5-Person Households | 0 (0.0%) | 0 (0.0%) |
| 6-Person Households | 5 (3.6%) | 0 (0.0%) |
| 7+ Person Households | 0 (0.0%) | 0 (0.0%) |
| Total | 127 (91.4%) | 12 (8.6%) |
Female Fertility in Balmorhea
Fertility by Age in Balmorhea
Average fertility rate in Balmorhea is 125.0 births per 1,000 women. Women in the age bracket of 35 to 50 years have the highest fertility rate with 135.0 births per 1,000 women. Women in the age bracket of 35 to 50 years acount for 100.0% of all women with births.
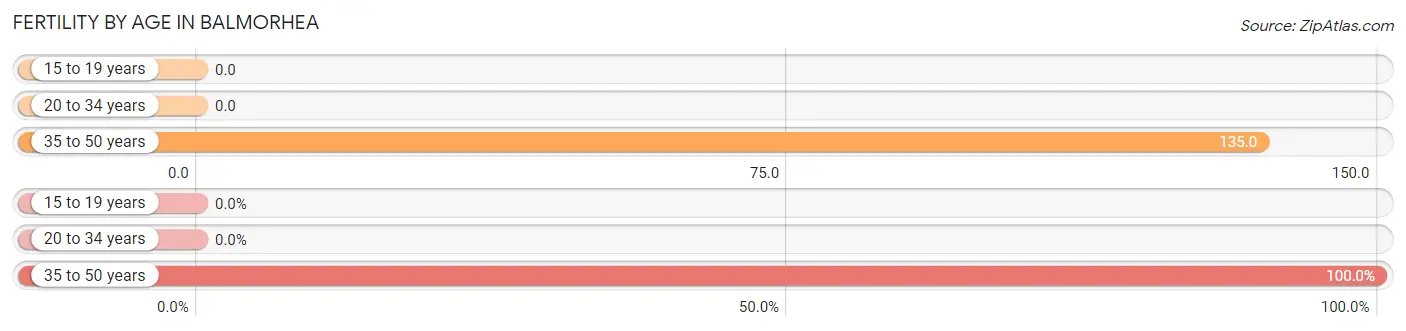
| Age Bracket | Women with Births | Births / 1,000 Women |
| 15 to 19 years | 0 (0.0%) | 0.0 |
| 20 to 34 years | 0 (0.0%) | 0.0 |
| 35 to 50 years | 5 (100.0%) | 135.0 |
| Total | 5 (100.0%) | 125.0 |
Fertility by Age by Marriage Status in Balmorhea
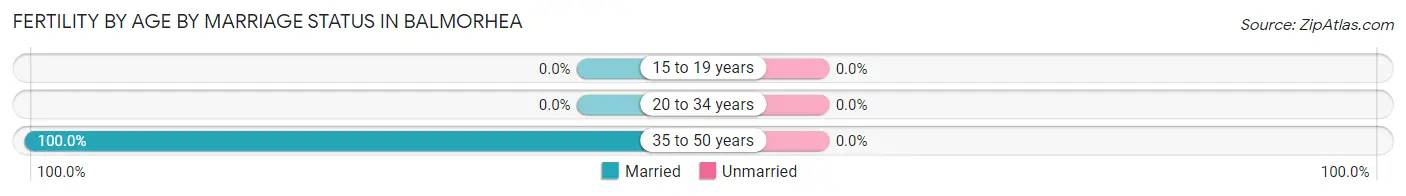
| Age Bracket | Married | Unmarried |
| 15 to 19 years | 0 (0.0%) | 0 (0.0%) |
| 20 to 34 years | 0 (0.0%) | 0 (0.0%) |
| 35 to 50 years | 5 (100.0%) | 0 (0.0%) |
| Total | 5 (100.0%) | 0 (0.0%) |
Fertility by Education in Balmorhea
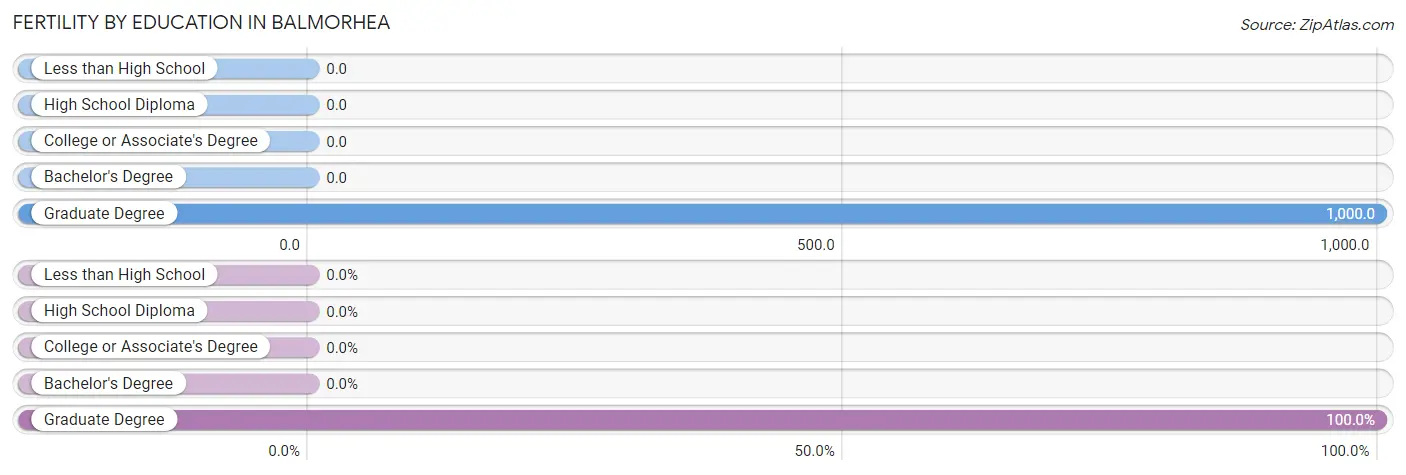
| Educational Attainment | Women with Births | Births / 1,000 Women |
| Less than High School | 0 (0.0%) | 0.0 |
| High School Diploma | 0 (0.0%) | 0.0 |
| College or Associate's Degree | 0 (0.0%) | 0.0 |
| Bachelor's Degree | 0 (0.0%) | 0.0 |
| Graduate Degree | 5 (100.0%) | 1,000.0 |
| Total | 5 (100.0%) | 125.0 |
Fertility by Education by Marriage Status in Balmorhea
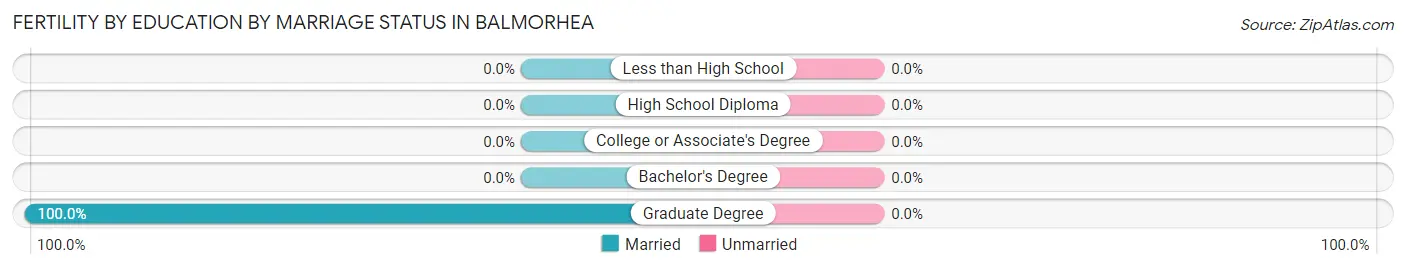
| Educational Attainment | Married | Unmarried |
| Less than High School | 0 (0.0%) | 0 (0.0%) |
| High School Diploma | 0 (0.0%) | 0 (0.0%) |
| College or Associate's Degree | 0 (0.0%) | 0 (0.0%) |
| Bachelor's Degree | 0 (0.0%) | 0 (0.0%) |
| Graduate Degree | 5 (100.0%) | 0 (0.0%) |
| Total | 5 (100.0%) | 0 (0.0%) |
Employment Characteristics in Balmorhea
Employment by Class of Employer in Balmorhea
Among the 294 employed individuals in Balmorhea, private company employees (203 | 69.1%), state government employees (47 | 16.0%), and self-employed (not incorporated) (21 | 7.1%) make up the most common classes of employment.
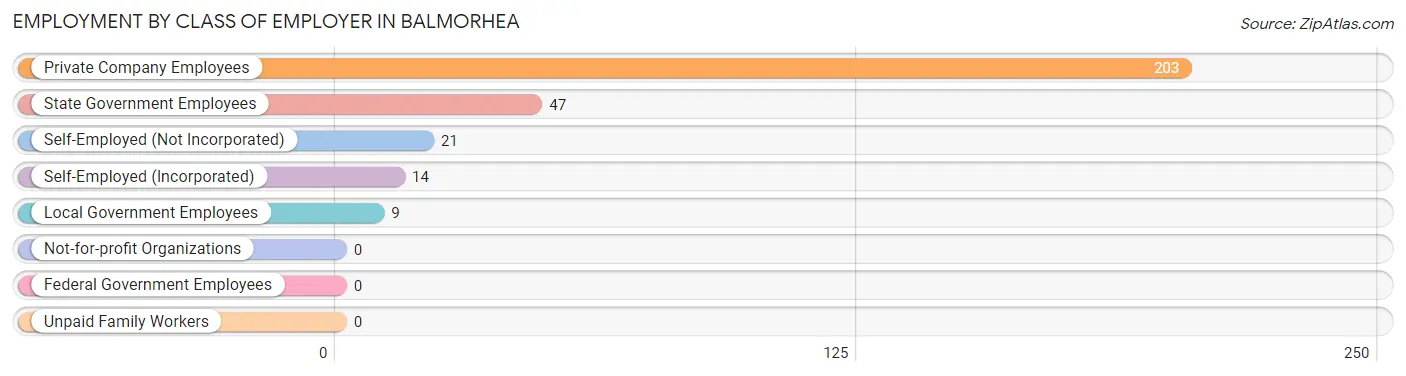
| Employer Class | # Employees | % Employees |
| Private Company Employees | 203 | 69.1% |
| Self-Employed (Incorporated) | 14 | 4.8% |
| Self-Employed (Not Incorporated) | 21 | 7.1% |
| Not-for-profit Organizations | 0 | 0.0% |
| Local Government Employees | 9 | 3.1% |
| State Government Employees | 47 | 16.0% |
| Federal Government Employees | 0 | 0.0% |
| Unpaid Family Workers | 0 | 0.0% |
| Total | 294 | 100.0% |
Employment Status by Age in Balmorhea
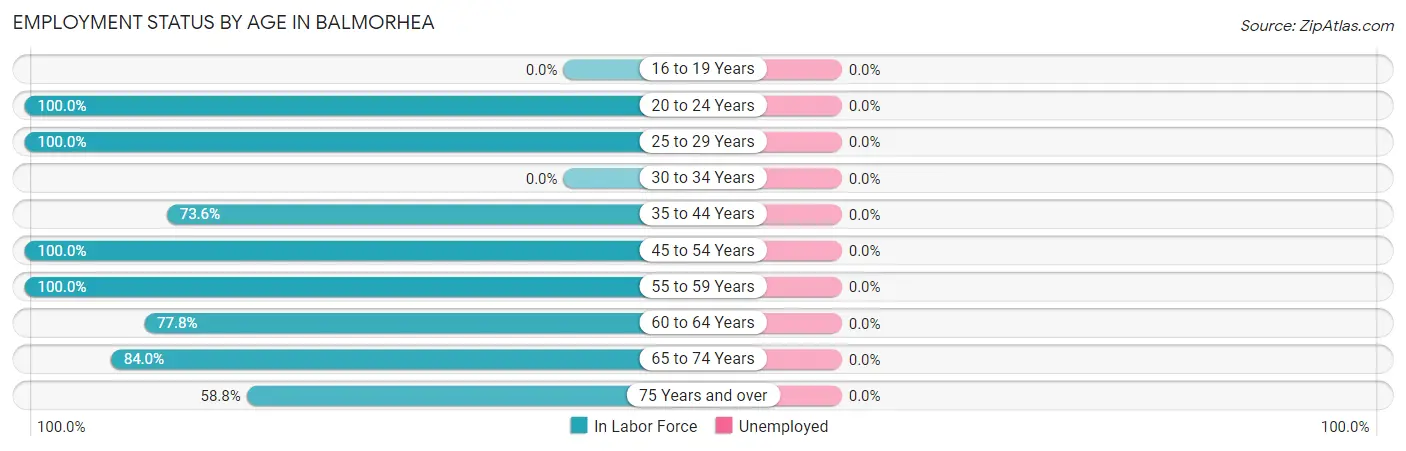
| Age Bracket | In Labor Force | Unemployed |
| 16 to 19 Years | 0 (0.0%) | 0 (0.0%) |
| 20 to 24 Years | 33 (100.0%) | 0 (0.0%) |
| 25 to 29 Years | 14 (100.0%) | 0 (0.0%) |
| 30 to 34 Years | 0 (0.0%) | 0 (0.0%) |
| 35 to 44 Years | 39 (73.6%) | 0 (0.0%) |
| 45 to 54 Years | 52 (100.0%) | 0 (0.0%) |
| 55 to 59 Years | 8 (100.0%) | 0 (0.0%) |
| 60 to 64 Years | 21 (77.8%) | 0 (0.0%) |
| 65 to 74 Years | 121 (84.0%) | 0 (0.0%) |
| 75 Years and over | 10 (58.8%) | 0 (0.0%) |
| Total | 298 (76.8%) | 0 (0.0%) |
Employment Status by Educational Attainment in Balmorhea
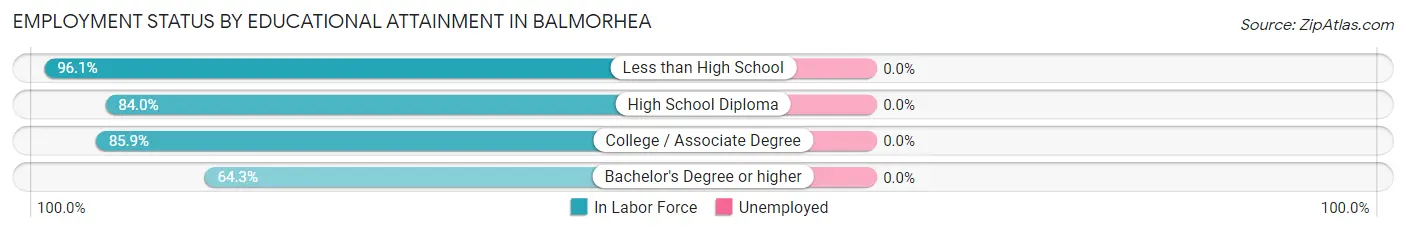
| Educational Attainment | In Labor Force | Unemployed |
| Less than High School | 49 (96.1%) | 0 (0.0%) |
| High School Diploma | 21 (84.0%) | 0 (0.0%) |
| College / Associate Degree | 55 (85.9%) | 0 (0.0%) |
| Bachelor's Degree or higher | 9 (64.3%) | 0 (0.0%) |
| Total | 134 (87.0%) | 0 (0.0%) |
Employment Occupations by Sex in Balmorhea
Management, Business, Science and Arts Occupations
The most common Management, Business, Science and Arts occupations in Balmorhea are Management (35 | 11.7%), Community & Social Service (9 | 3.0%), and Education Instruction & Library (9 | 3.0%).
Management, Business, Science and Arts Occupations by Sex
| Occupation | Male | Female |
| Management | 35 (100.0%) | 0 (0.0%) |
| Business & Financial | 0 (0.0%) | 0 (0.0%) |
| Computers, Engineering & Science | 0 (0.0%) | 0 (0.0%) |
| Computers & Mathematics | 0 (0.0%) | 0 (0.0%) |
| Architecture & Engineering | 0 (0.0%) | 0 (0.0%) |
| Life, Physical & Social Science | 0 (0.0%) | 0 (0.0%) |
| Community & Social Service | 0 (0.0%) | 9 (100.0%) |
| Education, Arts & Media | 0 (0.0%) | 0 (0.0%) |
| Legal Services & Support | 0 (0.0%) | 0 (0.0%) |
| Education Instruction & Library | 0 (0.0%) | 9 (100.0%) |
| Arts, Media & Entertainment | 0 (0.0%) | 0 (0.0%) |
| Health Diagnosing & Treating | 0 (0.0%) | 0 (0.0%) |
| Health Technologists | 0 (0.0%) | 0 (0.0%) |
| Total (Category) | 35 (79.5%) | 9 (20.4%) |
| Total (Overall) | 247 (82.9%) | 51 (17.1%) |
Services Occupations
The most common Services occupations in Balmorhea are Healthcare Support (44 | 14.8%), Security & Protection (33 | 11.1%), Law Enforcement (33 | 11.1%), Cleaning & Maintenance (8 | 2.7%), and Food Preparation & Serving (6 | 2.0%).
Services Occupations by Sex
Within the Services occupations in Balmorhea, the most male-oriented occupations are Security & Protection (100.0%), Law Enforcement (100.0%), and Healthcare Support (68.2%), while the most female-oriented occupations are Food Preparation & Serving (100.0%), Cleaning & Maintenance (100.0%), and Healthcare Support (31.8%).
| Occupation | Male | Female |
| Healthcare Support | 30 (68.2%) | 14 (31.8%) |
| Security & Protection | 33 (100.0%) | 0 (0.0%) |
| Firefighting & Prevention | 0 (0.0%) | 0 (0.0%) |
| Law Enforcement | 33 (100.0%) | 0 (0.0%) |
| Food Preparation & Serving | 0 (0.0%) | 6 (100.0%) |
| Cleaning & Maintenance | 0 (0.0%) | 8 (100.0%) |
| Personal Care & Service | 0 (0.0%) | 0 (0.0%) |
| Total (Category) | 63 (69.2%) | 28 (30.8%) |
| Total (Overall) | 247 (82.9%) | 51 (17.1%) |
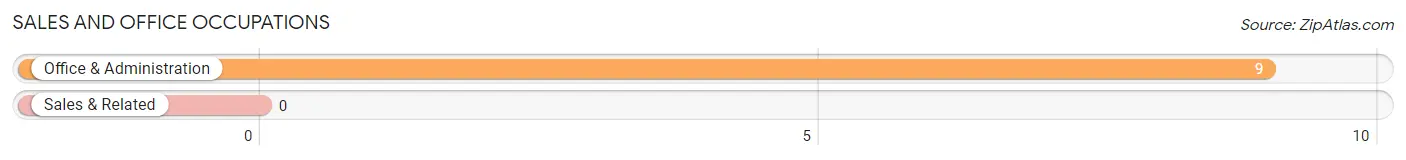
Sales and Office Occupations
The most common Sales and Office occupations in Balmorhea are , and Office & Administration (9 | 3.0%).
Sales and Office Occupations by Sex
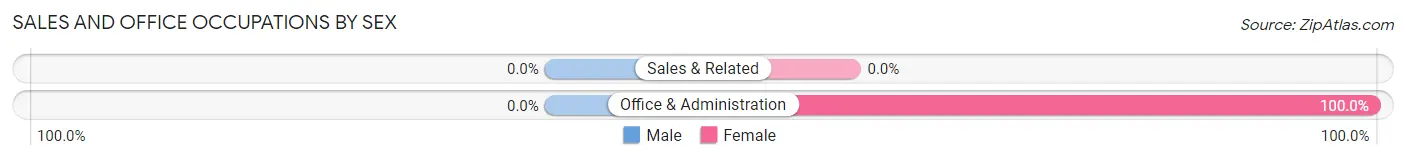
| Occupation | Male | Female |
| Sales & Related | 0 (0.0%) | 0 (0.0%) |
| Office & Administration | 0 (0.0%) | 9 (100.0%) |
| Total (Category) | 0 (0.0%) | 9 (100.0%) |
| Total (Overall) | 247 (82.9%) | 51 (17.1%) |
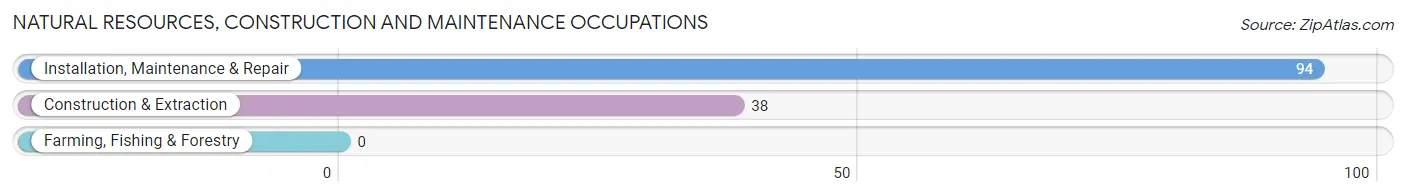
Natural Resources, Construction and Maintenance Occupations
The most common Natural Resources, Construction and Maintenance occupations in Balmorhea are Installation, Maintenance & Repair (94 | 31.5%), and Construction & Extraction (38 | 12.8%).
Natural Resources, Construction and Maintenance Occupations by Sex
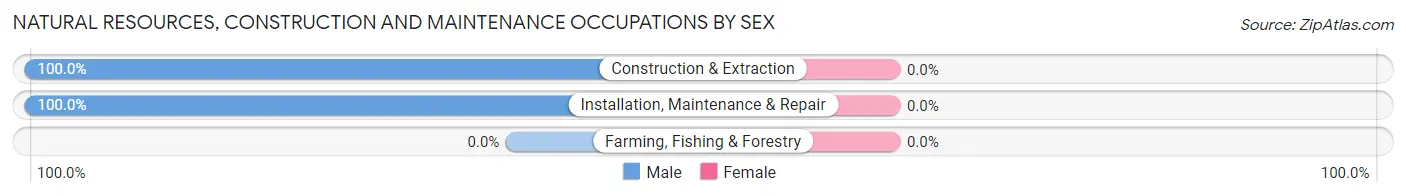
| Occupation | Male | Female |
| Farming, Fishing & Forestry | 0 (0.0%) | 0 (0.0%) |
| Construction & Extraction | 38 (100.0%) | 0 (0.0%) |
| Installation, Maintenance & Repair | 94 (100.0%) | 0 (0.0%) |
| Total (Category) | 132 (100.0%) | 0 (0.0%) |
| Total (Overall) | 247 (82.9%) | 51 (17.1%) |
Production, Transportation and Moving Occupations
The most common Production, Transportation and Moving occupations in Balmorhea are Material Moving (17 | 5.7%), and Production (5 | 1.7%).
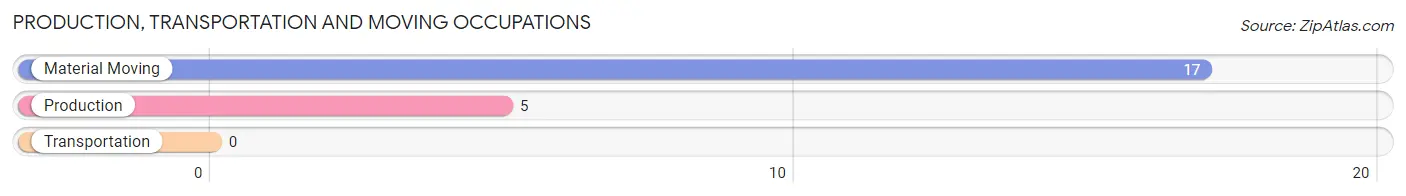
Production, Transportation and Moving Occupations by Sex
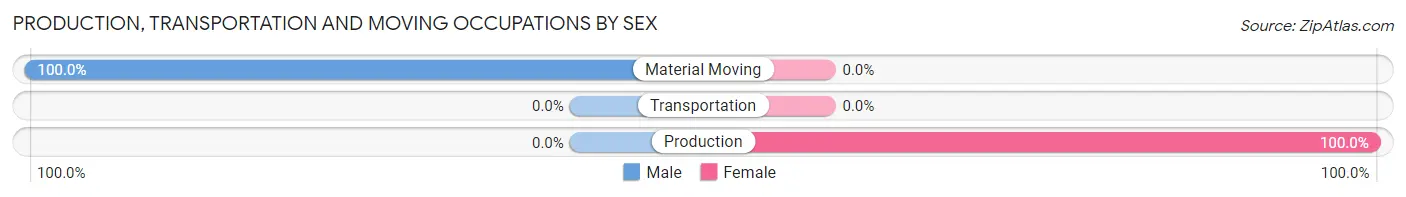
| Occupation | Male | Female |
| Production | 0 (0.0%) | 5 (100.0%) |
| Transportation | 0 (0.0%) | 0 (0.0%) |
| Material Moving | 17 (100.0%) | 0 (0.0%) |
| Total (Category) | 17 (77.3%) | 5 (22.7%) |
| Total (Overall) | 247 (82.9%) | 51 (17.1%) |
Employment Industries by Sex in Balmorhea
Employment Industries in Balmorhea
The major employment industries in Balmorhea include Educational Services (103 | 34.6%), Construction (70 | 23.5%), Health Care & Social Assistance (50 | 16.8%), Public Administration (33 | 11.1%), and Utilities (15 | 5.0%).
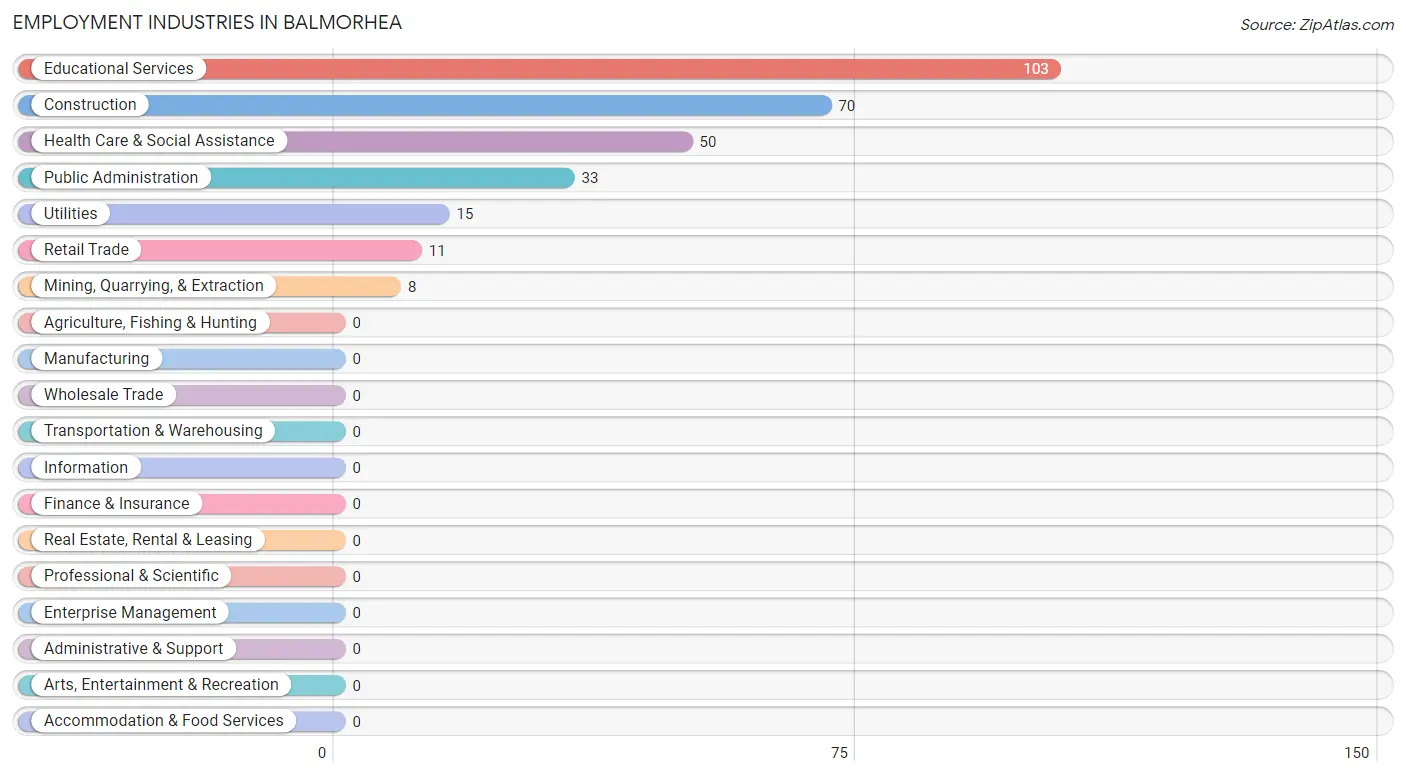
Employment Industries by Sex in Balmorhea
The Balmorhea industries that see more men than women are Construction (100.0%), Retail Trade (100.0%), and Public Administration (100.0%), whereas the industries that tend to have a higher number of women are Mining, Quarrying, & Extraction (62.5%), Utilities (60.0%), and Health Care & Social Assistance (40.0%).
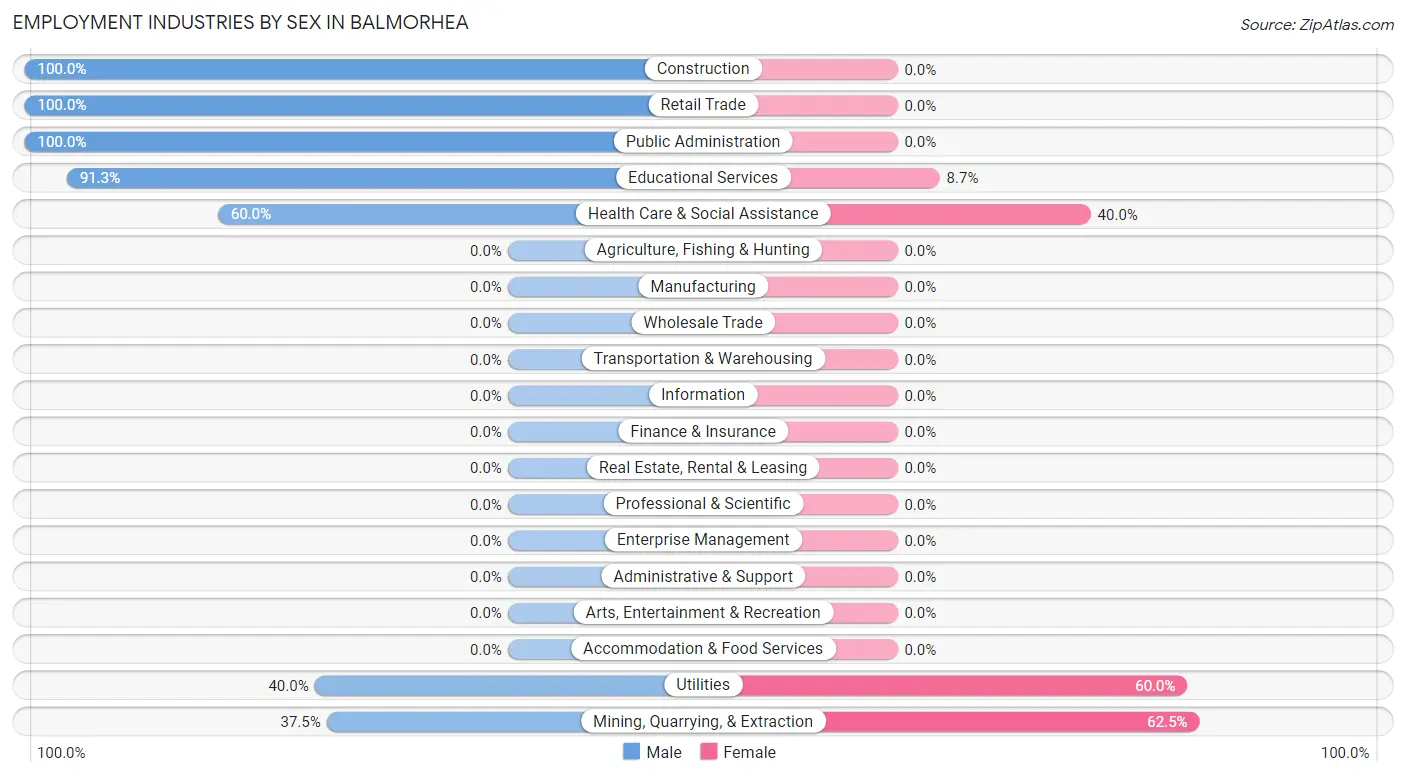
| Industry | Male | Female |
| Agriculture, Fishing & Hunting | 0 (0.0%) | 0 (0.0%) |
| Mining, Quarrying, & Extraction | 3 (37.5%) | 5 (62.5%) |
| Construction | 70 (100.0%) | 0 (0.0%) |
| Manufacturing | 0 (0.0%) | 0 (0.0%) |
| Wholesale Trade | 0 (0.0%) | 0 (0.0%) |
| Retail Trade | 11 (100.0%) | 0 (0.0%) |
| Transportation & Warehousing | 0 (0.0%) | 0 (0.0%) |
| Utilities | 6 (40.0%) | 9 (60.0%) |
| Information | 0 (0.0%) | 0 (0.0%) |
| Finance & Insurance | 0 (0.0%) | 0 (0.0%) |
| Real Estate, Rental & Leasing | 0 (0.0%) | 0 (0.0%) |
| Professional & Scientific | 0 (0.0%) | 0 (0.0%) |
| Enterprise Management | 0 (0.0%) | 0 (0.0%) |
| Administrative & Support | 0 (0.0%) | 0 (0.0%) |
| Educational Services | 94 (91.3%) | 9 (8.7%) |
| Health Care & Social Assistance | 30 (60.0%) | 20 (40.0%) |
| Arts, Entertainment & Recreation | 0 (0.0%) | 0 (0.0%) |
| Accommodation & Food Services | 0 (0.0%) | 0 (0.0%) |
| Public Administration | 33 (100.0%) | 0 (0.0%) |
| Total | 247 (82.9%) | 51 (17.1%) |
Education in Balmorhea
School Enrollment in Balmorhea
The most common levels of schooling among the 117 students in Balmorhea are college / undergraduate (33 | 28.2%), middle school (32 | 27.4%), and high school (32 | 27.4%).
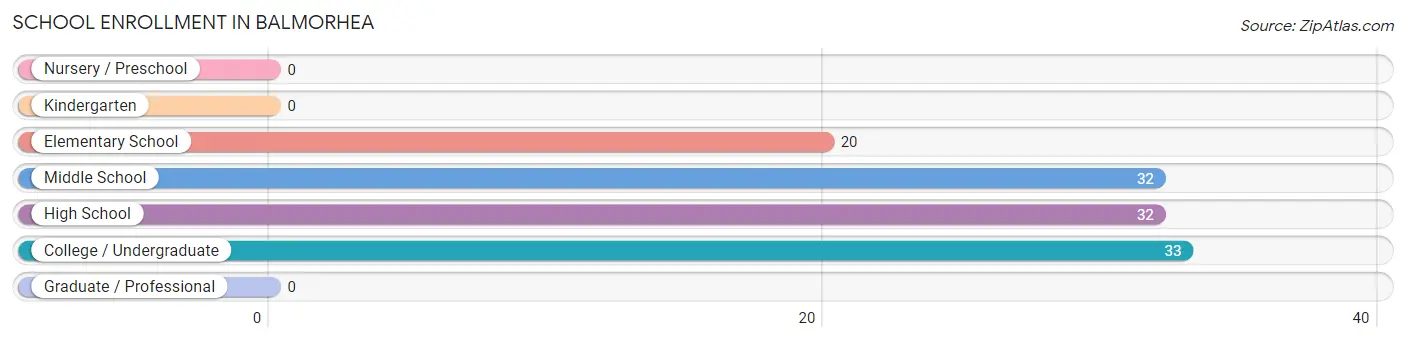
| School Level | # Students | % Students |
| Nursery / Preschool | 0 | 0.0% |
| Kindergarten | 0 | 0.0% |
| Elementary School | 20 | 17.1% |
| Middle School | 32 | 27.4% |
| High School | 32 | 27.4% |
| College / Undergraduate | 33 | 28.2% |
| Graduate / Professional | 0 | 0.0% |
| Total | 117 | 100.0% |
School Enrollment by Age by Funding Source in Balmorhea
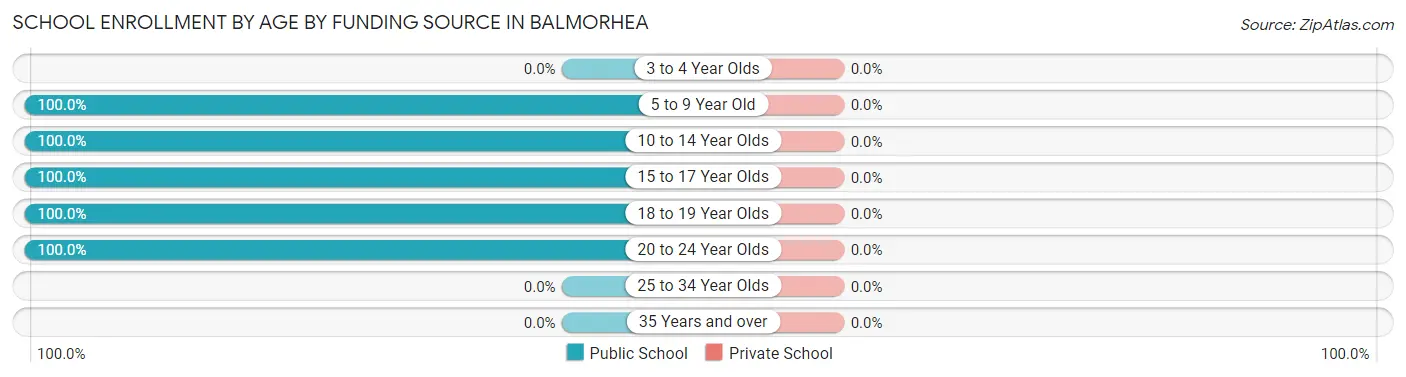
| Age Bracket | Public School | Private School |
| 3 to 4 Year Olds | 0 (0.0%) | 0 (0.0%) |
| 5 to 9 Year Old | 10 (100.0%) | 0 (0.0%) |
| 10 to 14 Year Olds | 42 (100.0%) | 0 (0.0%) |
| 15 to 17 Year Olds | 3 (100.0%) | 0 (0.0%) |
| 18 to 19 Year Olds | 29 (100.0%) | 0 (0.0%) |
| 20 to 24 Year Olds | 33 (100.0%) | 0 (0.0%) |
| 25 to 34 Year Olds | 0 (0.0%) | 0 (0.0%) |
| 35 Years and over | 0 (0.0%) | 0 (0.0%) |
| Total | 117 (100.0%) | 0 (0.0%) |
Educational Attainment by Field of Study in Balmorhea
Education (9 | 64.3%), and liberal arts & history (5 | 35.7%) are the most common fields of study among 14 individuals in Balmorhea who have obtained a bachelor's degree or higher.
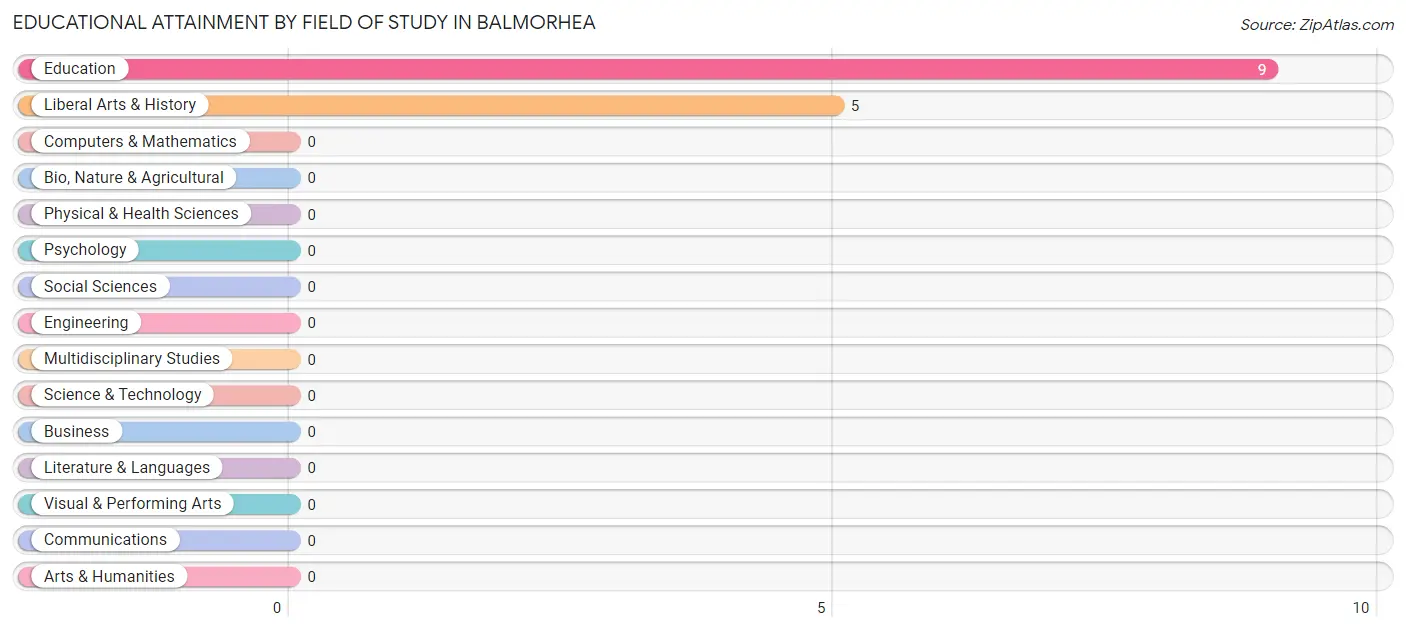
| Field of Study | # Graduates | % Graduates |
| Computers & Mathematics | 0 | 0.0% |
| Bio, Nature & Agricultural | 0 | 0.0% |
| Physical & Health Sciences | 0 | 0.0% |
| Psychology | 0 | 0.0% |
| Social Sciences | 0 | 0.0% |
| Engineering | 0 | 0.0% |
| Multidisciplinary Studies | 0 | 0.0% |
| Science & Technology | 0 | 0.0% |
| Business | 0 | 0.0% |
| Education | 9 | 64.3% |
| Literature & Languages | 0 | 0.0% |
| Liberal Arts & History | 5 | 35.7% |
| Visual & Performing Arts | 0 | 0.0% |
| Communications | 0 | 0.0% |
| Arts & Humanities | 0 | 0.0% |
| Total | 14 | 100.0% |
Transportation & Commute in Balmorhea
Vehicle Availability by Sex in Balmorhea
The most prevalent vehicle ownership categories in Balmorhea are males with 2 vehicles (162, accounting for 65.6%) and females with 2 vehicles (21, making up 344.7%).
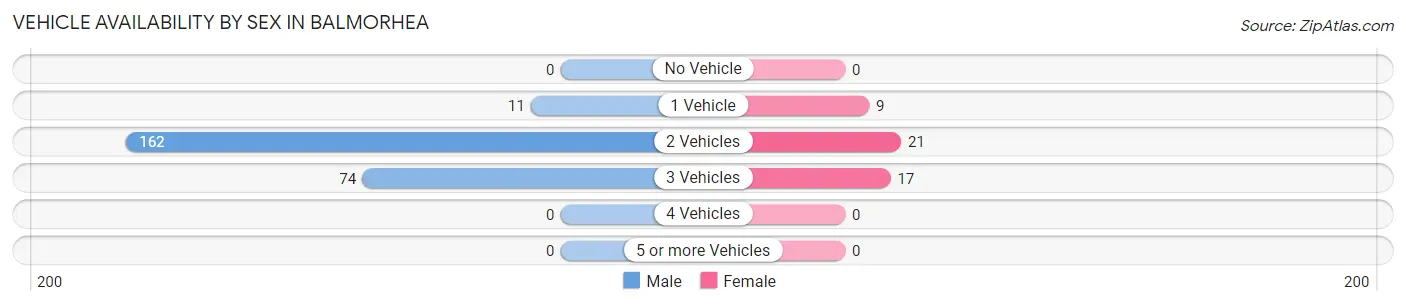
| Vehicles Available | Male | Female |
| No Vehicle | 0 (0.0%) | 0 (0.0%) |
| 1 Vehicle | 11 (4.4%) | 9 (19.2%) |
| 2 Vehicles | 162 (65.6%) | 21 (44.7%) |
| 3 Vehicles | 74 (30.0%) | 17 (36.2%) |
| 4 Vehicles | 0 (0.0%) | 0 (0.0%) |
| 5 or more Vehicles | 0 (0.0%) | 0 (0.0%) |
| Total | 247 (100.0%) | 47 (100.0%) |
Commute Time in Balmorhea
The most frequently occuring commute durations in Balmorhea are 10 to 14 minutes (121 commuters, 41.2%), 5 to 9 minutes (96 commuters, 32.7%), and 30 to 34 minutes (38 commuters, 12.9%).
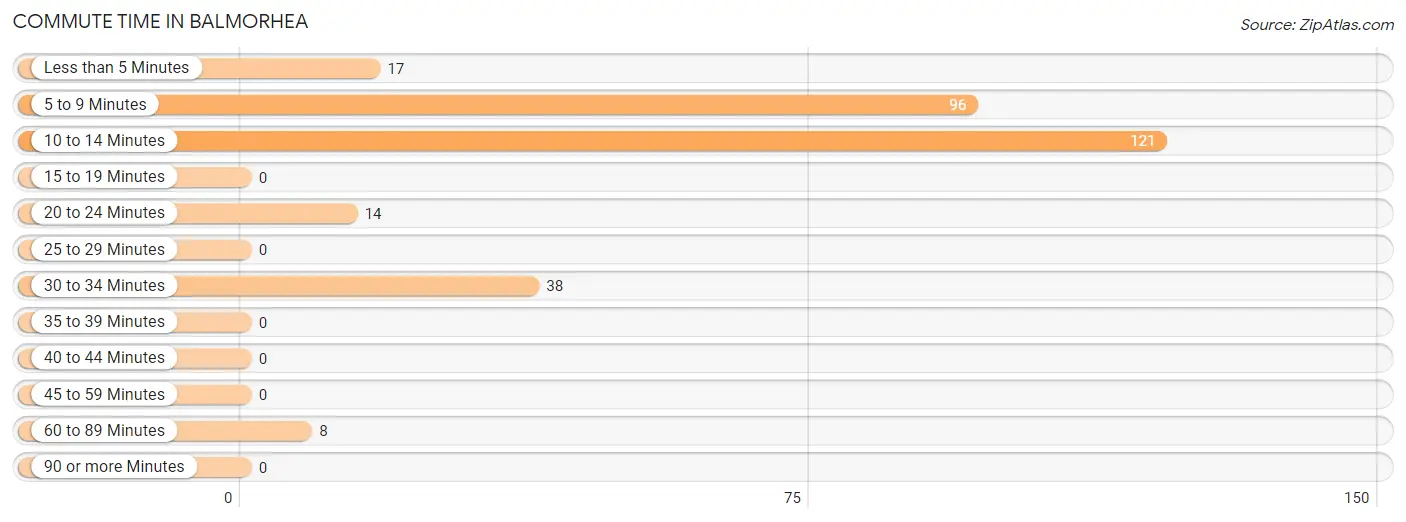
| Commute Time | # Commuters | % Commuters |
| Less than 5 Minutes | 17 | 5.8% |
| 5 to 9 Minutes | 96 | 32.7% |
| 10 to 14 Minutes | 121 | 41.2% |
| 15 to 19 Minutes | 0 | 0.0% |
| 20 to 24 Minutes | 14 | 4.8% |
| 25 to 29 Minutes | 0 | 0.0% |
| 30 to 34 Minutes | 38 | 12.9% |
| 35 to 39 Minutes | 0 | 0.0% |
| 40 to 44 Minutes | 0 | 0.0% |
| 45 to 59 Minutes | 0 | 0.0% |
| 60 to 89 Minutes | 8 | 2.7% |
| 90 or more Minutes | 0 | 0.0% |
Commute Time by Sex in Balmorhea
The most common commute times in Balmorhea are 10 to 14 minutes (115 commuters, 46.6%) for males and 5 to 9 minutes (19 commuters, 40.4%) for females.
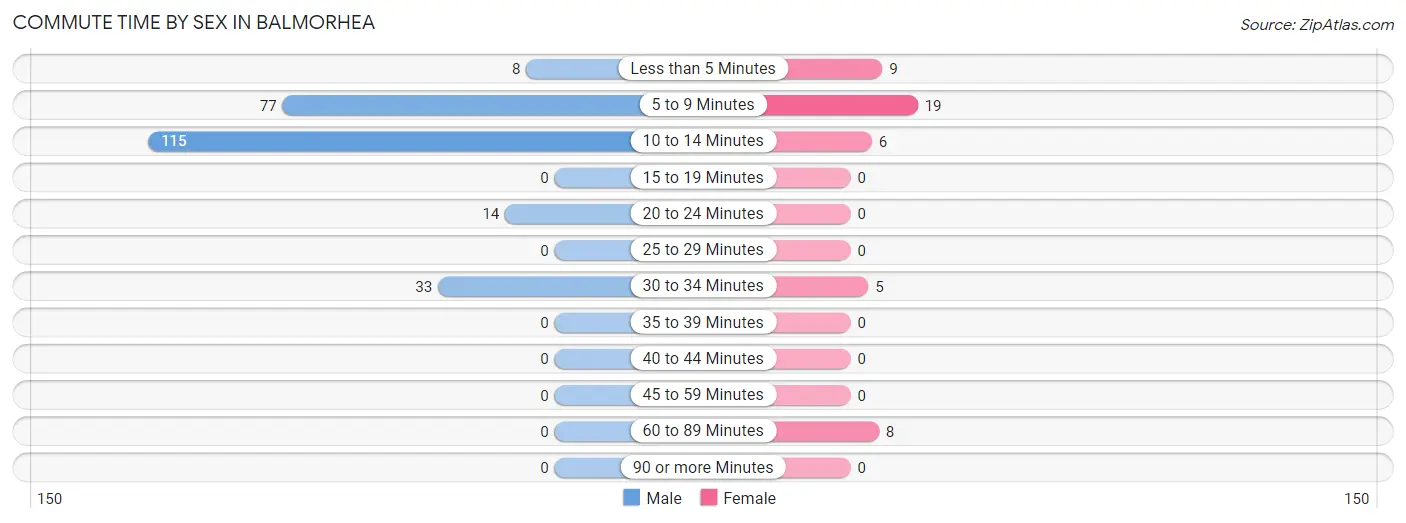
| Commute Time | Male | Female |
| Less than 5 Minutes | 8 (3.2%) | 9 (19.2%) |
| 5 to 9 Minutes | 77 (31.2%) | 19 (40.4%) |
| 10 to 14 Minutes | 115 (46.6%) | 6 (12.8%) |
| 15 to 19 Minutes | 0 (0.0%) | 0 (0.0%) |
| 20 to 24 Minutes | 14 (5.7%) | 0 (0.0%) |
| 25 to 29 Minutes | 0 (0.0%) | 0 (0.0%) |
| 30 to 34 Minutes | 33 (13.4%) | 5 (10.6%) |
| 35 to 39 Minutes | 0 (0.0%) | 0 (0.0%) |
| 40 to 44 Minutes | 0 (0.0%) | 0 (0.0%) |
| 45 to 59 Minutes | 0 (0.0%) | 0 (0.0%) |
| 60 to 89 Minutes | 0 (0.0%) | 8 (17.0%) |
| 90 or more Minutes | 0 (0.0%) | 0 (0.0%) |
Time of Departure to Work by Sex in Balmorhea
The most frequent times of departure to work in Balmorhea are 8:30 AM to 8:59 AM (94, 38.1%) for males and 7:00 AM to 7:29 AM (33, 70.2%) for females.
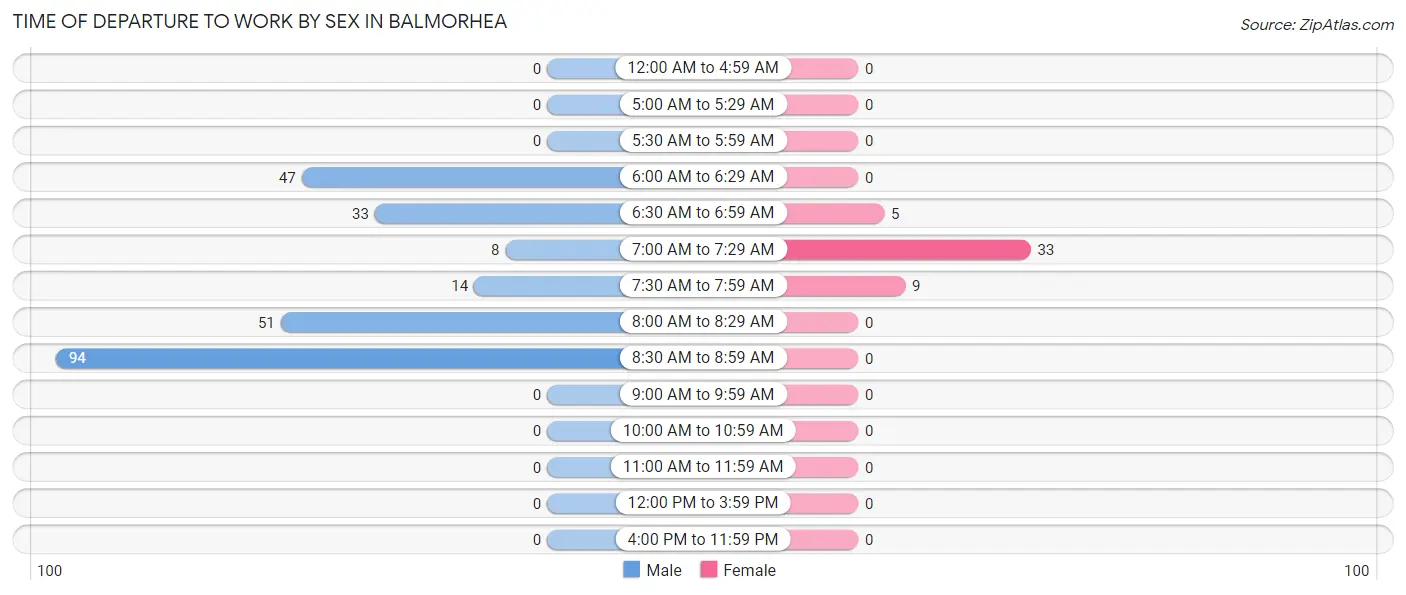
| Time of Departure | Male | Female |
| 12:00 AM to 4:59 AM | 0 (0.0%) | 0 (0.0%) |
| 5:00 AM to 5:29 AM | 0 (0.0%) | 0 (0.0%) |
| 5:30 AM to 5:59 AM | 0 (0.0%) | 0 (0.0%) |
| 6:00 AM to 6:29 AM | 47 (19.0%) | 0 (0.0%) |
| 6:30 AM to 6:59 AM | 33 (13.4%) | 5 (10.6%) |
| 7:00 AM to 7:29 AM | 8 (3.2%) | 33 (70.2%) |
| 7:30 AM to 7:59 AM | 14 (5.7%) | 9 (19.2%) |
| 8:00 AM to 8:29 AM | 51 (20.6%) | 0 (0.0%) |
| 8:30 AM to 8:59 AM | 94 (38.1%) | 0 (0.0%) |
| 9:00 AM to 9:59 AM | 0 (0.0%) | 0 (0.0%) |
| 10:00 AM to 10:59 AM | 0 (0.0%) | 0 (0.0%) |
| 11:00 AM to 11:59 AM | 0 (0.0%) | 0 (0.0%) |
| 12:00 PM to 3:59 PM | 0 (0.0%) | 0 (0.0%) |
| 4:00 PM to 11:59 PM | 0 (0.0%) | 0 (0.0%) |
| Total | 247 (100.0%) | 47 (100.0%) |
Housing Occupancy in Balmorhea
Occupancy by Ownership in Balmorhea
Of the total 139 dwellings in Balmorhea, owner-occupied units account for 112 (80.6%), while renter-occupied units make up 27 (19.4%).
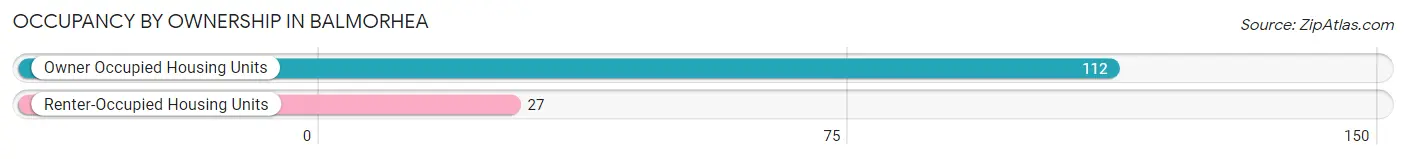
| Occupancy | # Housing Units | % Housing Units |
| Owner Occupied Housing Units | 112 | 80.6% |
| Renter-Occupied Housing Units | 27 | 19.4% |
| Total Occupied Housing Units | 139 | 100.0% |
Occupancy by Household Size in Balmorhea
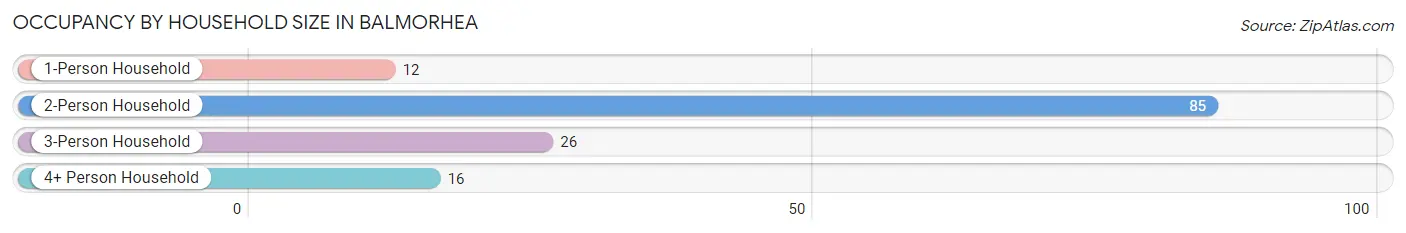
| Household Size | # Housing Units | % Housing Units |
| 1-Person Household | 12 | 8.6% |
| 2-Person Household | 85 | 61.2% |
| 3-Person Household | 26 | 18.7% |
| 4+ Person Household | 16 | 11.5% |
| Total Housing Units | 139 | 100.0% |
Occupancy by Ownership by Household Size in Balmorhea
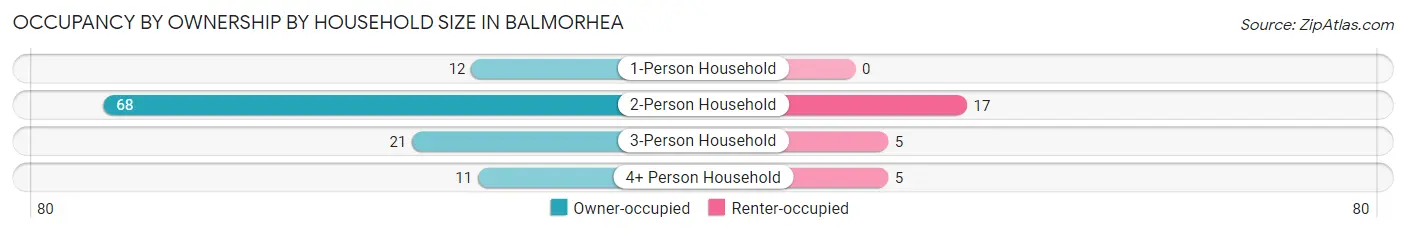
| Household Size | Owner-occupied | Renter-occupied |
| 1-Person Household | 12 (100.0%) | 0 (0.0%) |
| 2-Person Household | 68 (80.0%) | 17 (20.0%) |
| 3-Person Household | 21 (80.8%) | 5 (19.2%) |
| 4+ Person Household | 11 (68.8%) | 5 (31.2%) |
| Total Housing Units | 112 (80.6%) | 27 (19.4%) |
Occupancy by Educational Attainment in Balmorhea
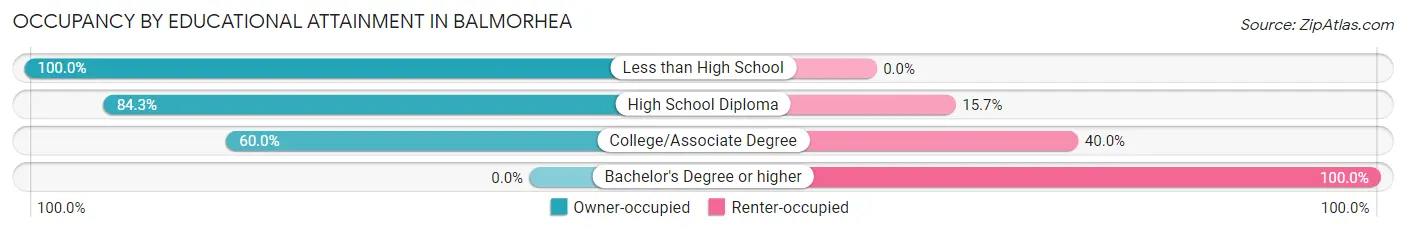
| Household Size | Owner-occupied | Renter-occupied |
| Less than High School | 48 (100.0%) | 0 (0.0%) |
| High School Diploma | 43 (84.3%) | 8 (15.7%) |
| College/Associate Degree | 21 (60.0%) | 14 (40.0%) |
| Bachelor's Degree or higher | 0 (0.0%) | 5 (100.0%) |
Occupancy by Age of Householder in Balmorhea
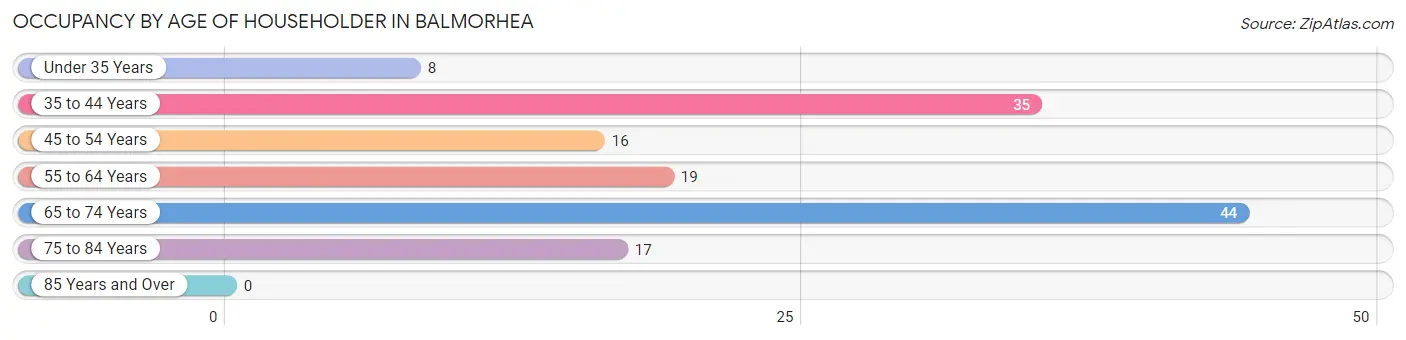
| Age Bracket | # Households | % Households |
| Under 35 Years | 8 | 5.8% |
| 35 to 44 Years | 35 | 25.2% |
| 45 to 54 Years | 16 | 11.5% |
| 55 to 64 Years | 19 | 13.7% |
| 65 to 74 Years | 44 | 31.7% |
| 75 to 84 Years | 17 | 12.2% |
| 85 Years and Over | 0 | 0.0% |
| Total | 139 | 100.0% |
Housing Finances in Balmorhea
Median Income by Occupancy in Balmorhea
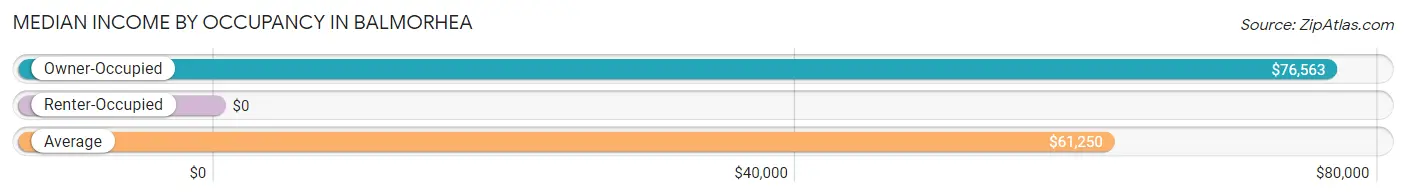
| Occupancy Type | # Households | Median Income |
| Owner-Occupied | 112 (80.6%) | $76,563 |
| Renter-Occupied | 27 (19.4%) | $0 |
| Average | 139 (100.0%) | $61,250 |
Occupancy by Householder Income Bracket in Balmorhea
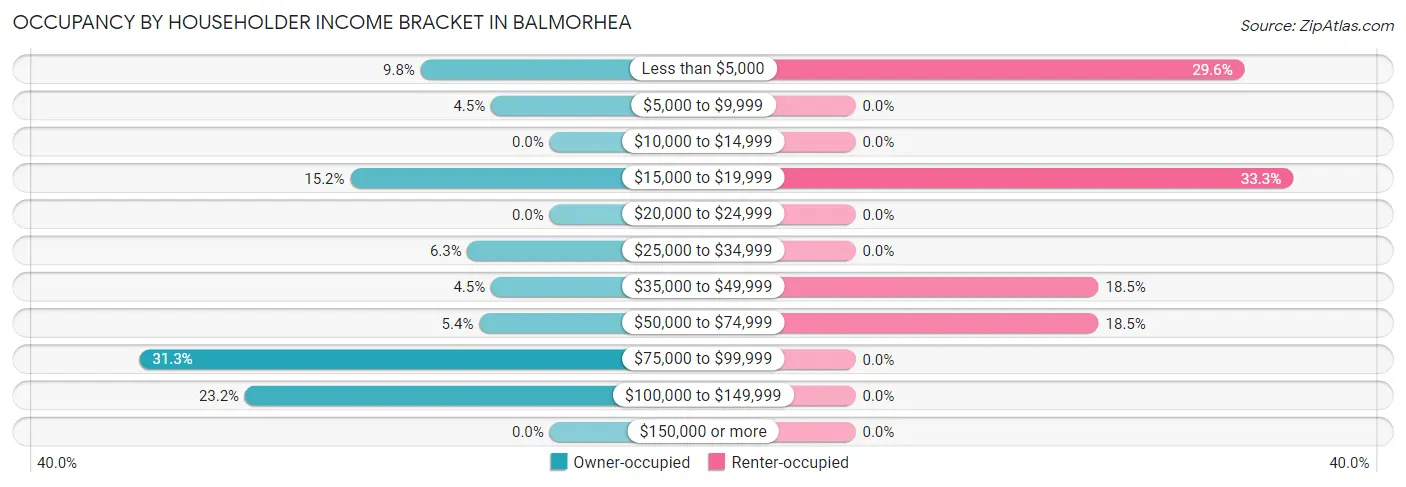
| Income Bracket | Owner-occupied | Renter-occupied |
| Less than $5,000 | 11 (9.8%) | 8 (29.6%) |
| $5,000 to $9,999 | 5 (4.5%) | 0 (0.0%) |
| $10,000 to $14,999 | 0 (0.0%) | 0 (0.0%) |
| $15,000 to $19,999 | 17 (15.2%) | 9 (33.3%) |
| $20,000 to $24,999 | 0 (0.0%) | 0 (0.0%) |
| $25,000 to $34,999 | 7 (6.2%) | 0 (0.0%) |
| $35,000 to $49,999 | 5 (4.5%) | 5 (18.5%) |
| $50,000 to $74,999 | 6 (5.4%) | 5 (18.5%) |
| $75,000 to $99,999 | 35 (31.2%) | 0 (0.0%) |
| $100,000 to $149,999 | 26 (23.2%) | 0 (0.0%) |
| $150,000 or more | 0 (0.0%) | 0 (0.0%) |
| Total | 112 (100.0%) | 27 (100.0%) |
Monthly Housing Cost Tiers in Balmorhea
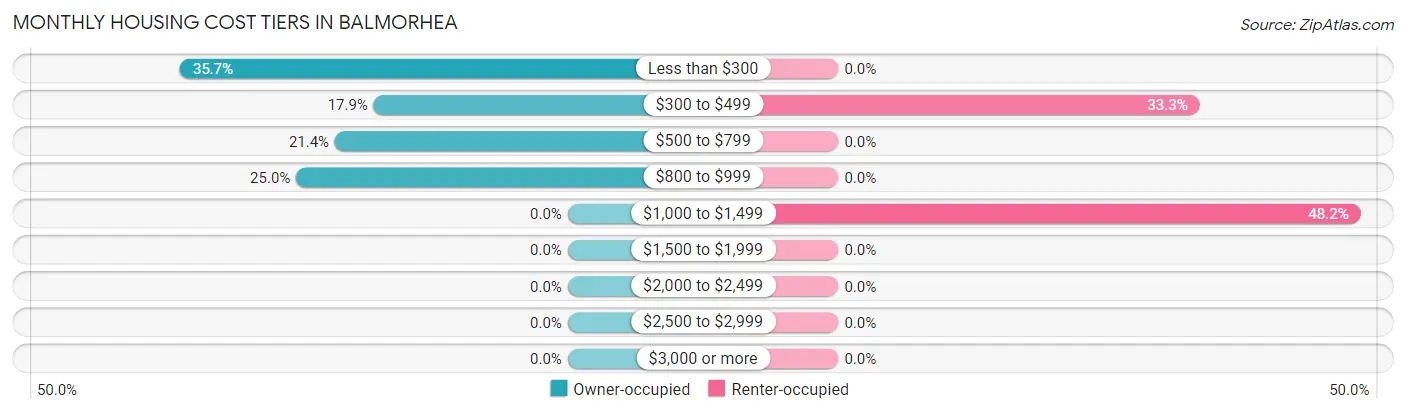
| Monthly Cost | Owner-occupied | Renter-occupied |
| Less than $300 | 40 (35.7%) | 0 (0.0%) |
| $300 to $499 | 20 (17.9%) | 9 (33.3%) |
| $500 to $799 | 24 (21.4%) | 0 (0.0%) |
| $800 to $999 | 28 (25.0%) | 0 (0.0%) |
| $1,000 to $1,499 | 0 (0.0%) | 13 (48.1%) |
| $1,500 to $1,999 | 0 (0.0%) | 0 (0.0%) |
| $2,000 to $2,499 | 0 (0.0%) | 0 (0.0%) |
| $2,500 to $2,999 | 0 (0.0%) | 0 (0.0%) |
| $3,000 or more | 0 (0.0%) | 0 (0.0%) |
| Total | 112 (100.0%) | 27 (100.0%) |
Physical Housing Characteristics in Balmorhea
Housing Structures in Balmorhea
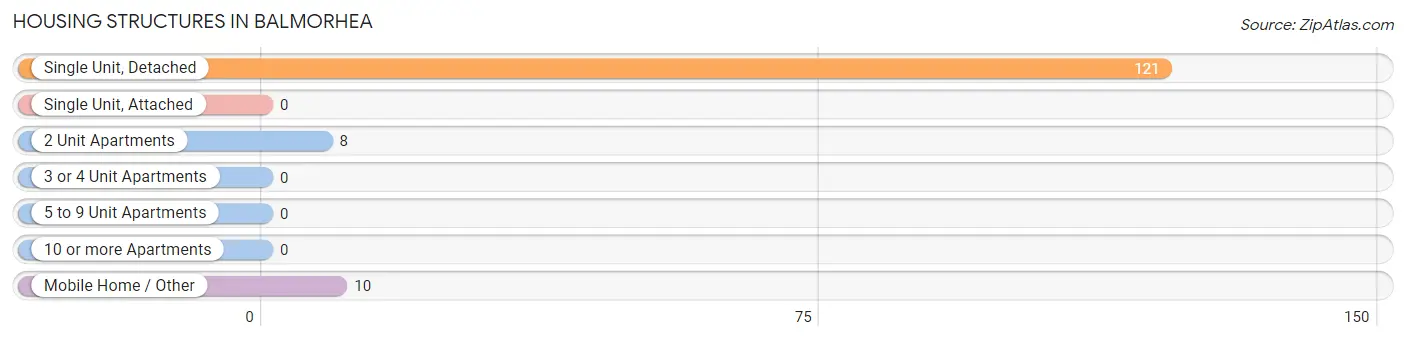
| Structure Type | # Housing Units | % Housing Units |
| Single Unit, Detached | 121 | 87.1% |
| Single Unit, Attached | 0 | 0.0% |
| 2 Unit Apartments | 8 | 5.8% |
| 3 or 4 Unit Apartments | 0 | 0.0% |
| 5 to 9 Unit Apartments | 0 | 0.0% |
| 10 or more Apartments | 0 | 0.0% |
| Mobile Home / Other | 10 | 7.2% |
| Total | 139 | 100.0% |
Housing Structures by Occupancy in Balmorhea
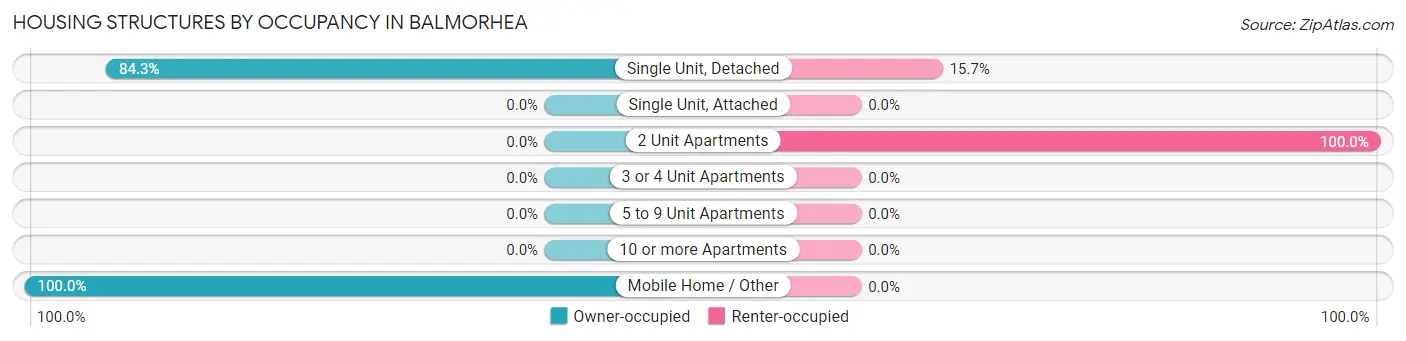
| Structure Type | Owner-occupied | Renter-occupied |
| Single Unit, Detached | 102 (84.3%) | 19 (15.7%) |
| Single Unit, Attached | 0 (0.0%) | 0 (0.0%) |
| 2 Unit Apartments | 0 (0.0%) | 8 (100.0%) |
| 3 or 4 Unit Apartments | 0 (0.0%) | 0 (0.0%) |
| 5 to 9 Unit Apartments | 0 (0.0%) | 0 (0.0%) |
| 10 or more Apartments | 0 (0.0%) | 0 (0.0%) |
| Mobile Home / Other | 10 (100.0%) | 0 (0.0%) |
| Total | 112 (80.6%) | 27 (19.4%) |
Housing Structures by Number of Rooms in Balmorhea
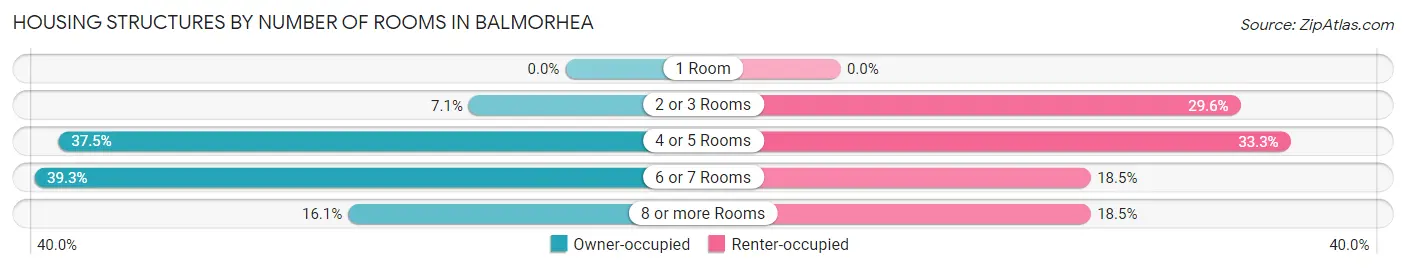
| Number of Rooms | Owner-occupied | Renter-occupied |
| 1 Room | 0 (0.0%) | 0 (0.0%) |
| 2 or 3 Rooms | 8 (7.1%) | 8 (29.6%) |
| 4 or 5 Rooms | 42 (37.5%) | 9 (33.3%) |
| 6 or 7 Rooms | 44 (39.3%) | 5 (18.5%) |
| 8 or more Rooms | 18 (16.1%) | 5 (18.5%) |
| Total | 112 (100.0%) | 27 (100.0%) |
Housing Structure by Heating Type in Balmorhea
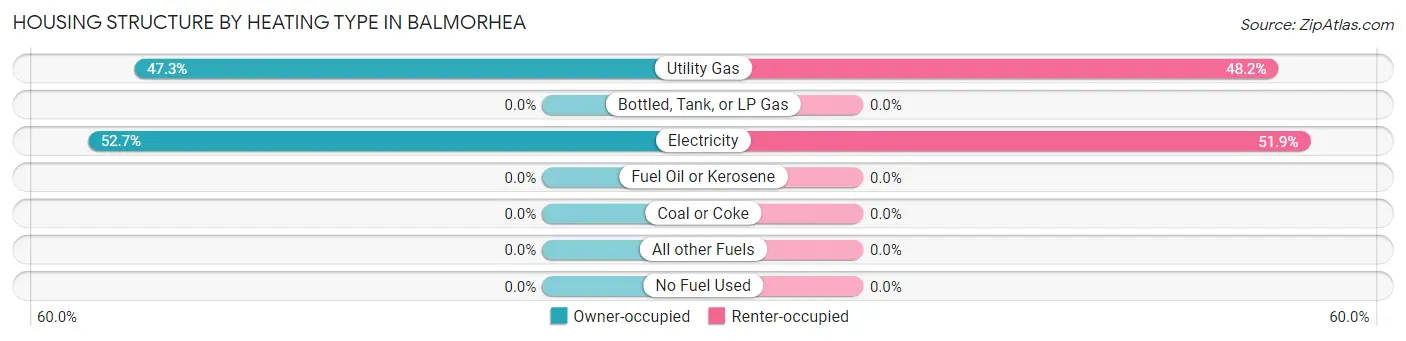
| Heating Type | Owner-occupied | Renter-occupied |
| Utility Gas | 53 (47.3%) | 13 (48.1%) |
| Bottled, Tank, or LP Gas | 0 (0.0%) | 0 (0.0%) |
| Electricity | 59 (52.7%) | 14 (51.8%) |
| Fuel Oil or Kerosene | 0 (0.0%) | 0 (0.0%) |
| Coal or Coke | 0 (0.0%) | 0 (0.0%) |
| All other Fuels | 0 (0.0%) | 0 (0.0%) |
| No Fuel Used | 0 (0.0%) | 0 (0.0%) |
| Total | 112 (100.0%) | 27 (100.0%) |
Household Vehicle Usage in Balmorhea
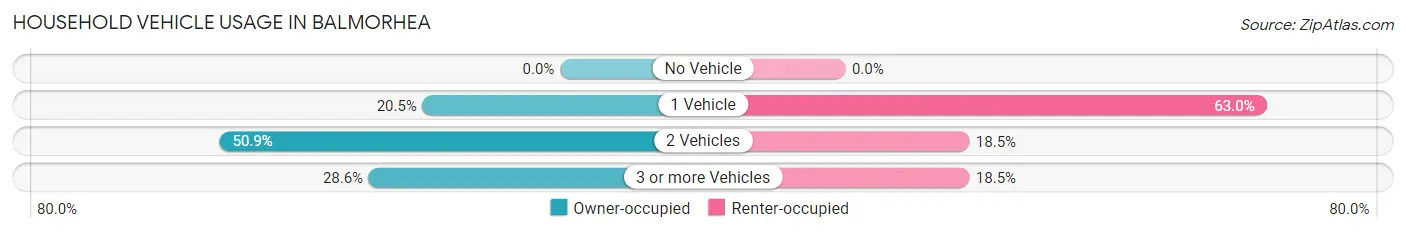
| Vehicles per Household | Owner-occupied | Renter-occupied |
| No Vehicle | 0 (0.0%) | 0 (0.0%) |
| 1 Vehicle | 23 (20.5%) | 17 (63.0%) |
| 2 Vehicles | 57 (50.9%) | 5 (18.5%) |
| 3 or more Vehicles | 32 (28.6%) | 5 (18.5%) |
| Total | 112 (100.0%) | 27 (100.0%) |
Real Estate & Mortgages in Balmorhea
Real Estate and Mortgage Overview in Balmorhea
| Characteristic | Without Mortgage | With Mortgage |
| Housing Units | 105 | 7 |
| Median Property Value | $58,000 | $0 |
| Median Household Income | $97,546 | $0 |
| Monthly Housing Costs | $456 | $0 |
| Real Estate Taxes | $1,102 | $0 |
Property Value by Mortgage Status in Balmorhea
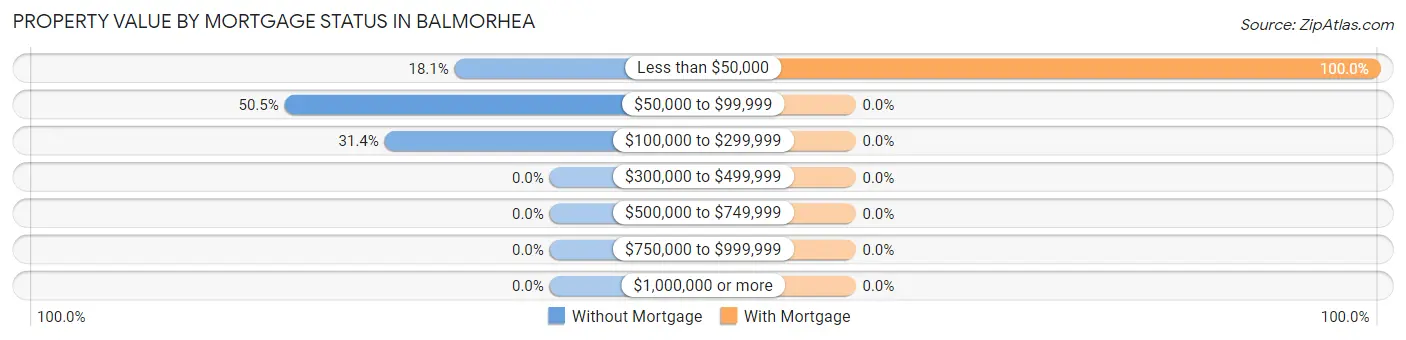
| Property Value | Without Mortgage | With Mortgage |
| Less than $50,000 | 19 (18.1%) | 7 (100.0%) |
| $50,000 to $99,999 | 53 (50.5%) | 0 (0.0%) |
| $100,000 to $299,999 | 33 (31.4%) | 0 (0.0%) |
| $300,000 to $499,999 | 0 (0.0%) | 0 (0.0%) |
| $500,000 to $749,999 | 0 (0.0%) | 0 (0.0%) |
| $750,000 to $999,999 | 0 (0.0%) | 0 (0.0%) |
| $1,000,000 or more | 0 (0.0%) | 0 (0.0%) |
| Total | 105 (100.0%) | 7 (100.0%) |
Household Income by Mortgage Status in Balmorhea
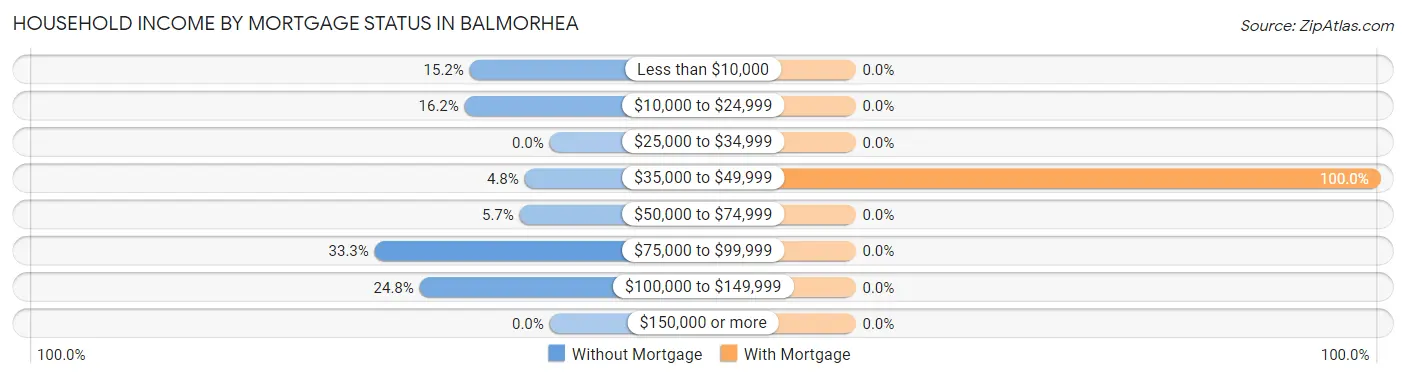
| Household Income | Without Mortgage | With Mortgage |
| Less than $10,000 | 16 (15.2%) | 0 (0.0%) |
| $10,000 to $24,999 | 17 (16.2%) | 0 (0.0%) |
| $25,000 to $34,999 | 0 (0.0%) | 0 (0.0%) |
| $35,000 to $49,999 | 5 (4.8%) | 7 (100.0%) |
| $50,000 to $74,999 | 6 (5.7%) | 0 (0.0%) |
| $75,000 to $99,999 | 35 (33.3%) | 0 (0.0%) |
| $100,000 to $149,999 | 26 (24.8%) | 0 (0.0%) |
| $150,000 or more | 0 (0.0%) | 0 (0.0%) |
| Total | 105 (100.0%) | 7 (100.0%) |
Property Value to Household Income Ratio in Balmorhea
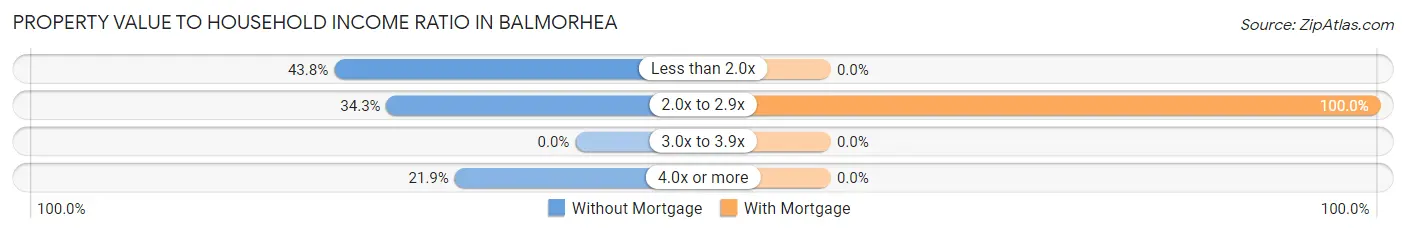
| Value-to-Income Ratio | Without Mortgage | With Mortgage |
| Less than 2.0x | 46 (43.8%) | 0 (0.0%) |
| 2.0x to 2.9x | 36 (34.3%) | 7 (100.0%) |
| 3.0x to 3.9x | 0 (0.0%) | 0 (0.0%) |
| 4.0x or more | 23 (21.9%) | 0 (0.0%) |
| Total | 105 (100.0%) | 7 (100.0%) |
Real Estate Taxes by Mortgage Status in Balmorhea
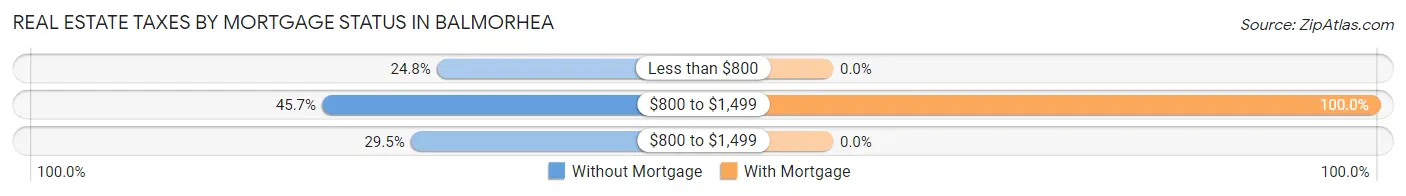
| Property Taxes | Without Mortgage | With Mortgage |
| Less than $800 | 26 (24.8%) | 0 (0.0%) |
| $800 to $1,499 | 48 (45.7%) | 7 (100.0%) |
| $800 to $1,499 | 31 (29.5%) | 0 (0.0%) |
| Total | 105 (100.0%) | 7 (100.0%) |
Health & Disability in Balmorhea
Health Insurance Coverage by Age in Balmorhea
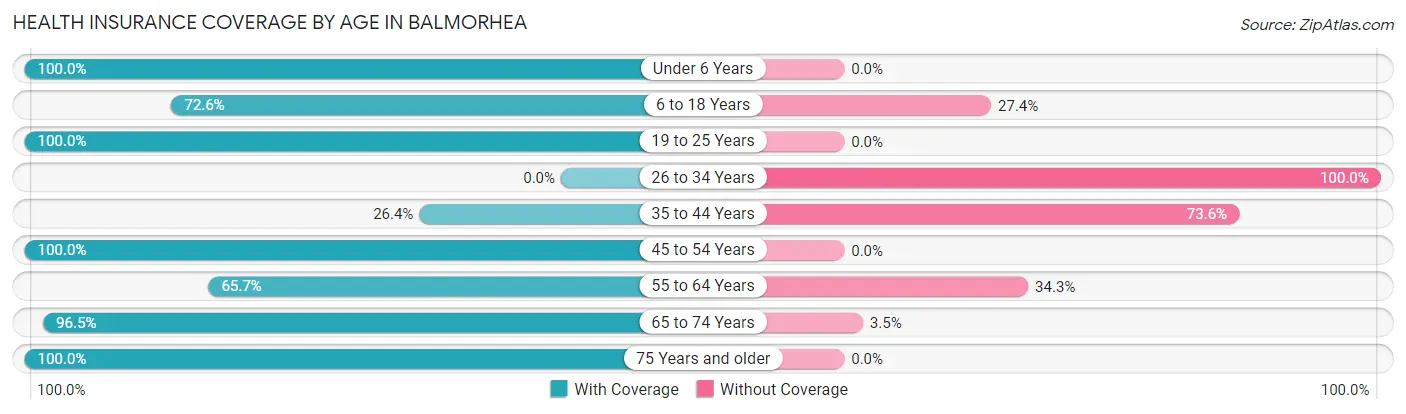
| Age Bracket | With Coverage | Without Coverage |
| Under 6 Years | 22 (100.0%) | 0 (0.0%) |
| 6 to 18 Years | 61 (72.6%) | 23 (27.4%) |
| 19 to 25 Years | 41 (100.0%) | 0 (0.0%) |
| 26 to 34 Years | 0 (0.0%) | 14 (100.0%) |
| 35 to 44 Years | 14 (26.4%) | 39 (73.6%) |
| 45 to 54 Years | 52 (100.0%) | 0 (0.0%) |
| 55 to 64 Years | 23 (65.7%) | 12 (34.3%) |
| 65 to 74 Years | 139 (96.5%) | 5 (3.5%) |
| 75 Years and older | 17 (100.0%) | 0 (0.0%) |
| Total | 369 (79.9%) | 93 (20.1%) |
Health Insurance Coverage by Citizenship Status in Balmorhea
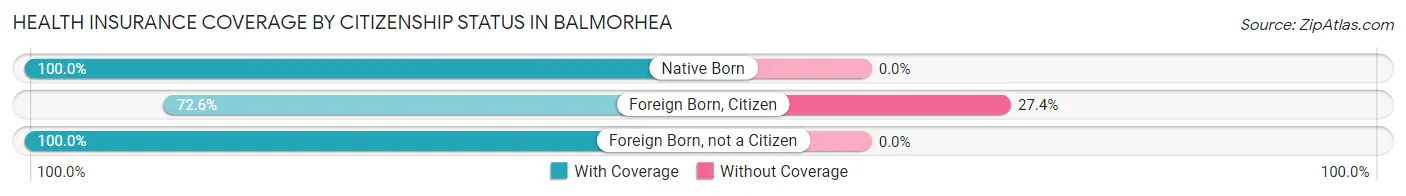
| Citizenship Status | With Coverage | Without Coverage |
| Native Born | 22 (100.0%) | 0 (0.0%) |
| Foreign Born, Citizen | 61 (72.6%) | 23 (27.4%) |
| Foreign Born, not a Citizen | 41 (100.0%) | 0 (0.0%) |
Health Insurance Coverage by Household Income in Balmorhea
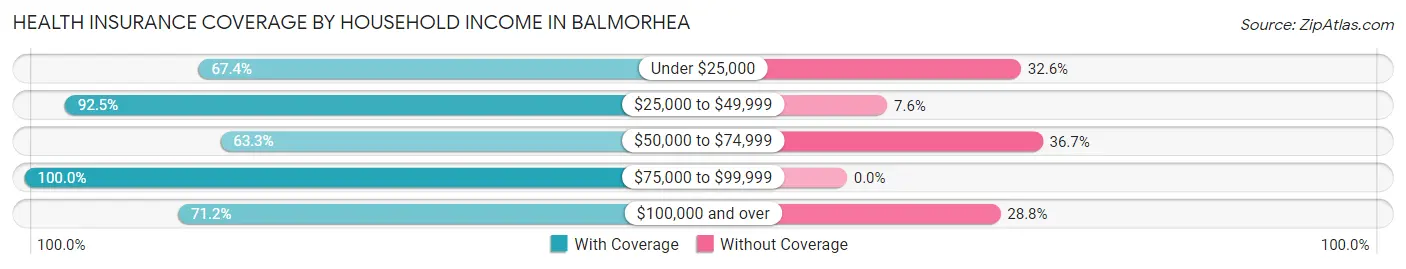
| Household Income | With Coverage | Without Coverage |
| Under $25,000 | 95 (67.4%) | 46 (32.6%) |
| $25,000 to $49,999 | 49 (92.4%) | 4 (7.5%) |
| $50,000 to $74,999 | 38 (63.3%) | 22 (36.7%) |
| $75,000 to $99,999 | 135 (100.0%) | 0 (0.0%) |
| $100,000 and over | 52 (71.2%) | 21 (28.8%) |
Public vs Private Health Insurance Coverage by Age in Balmorhea
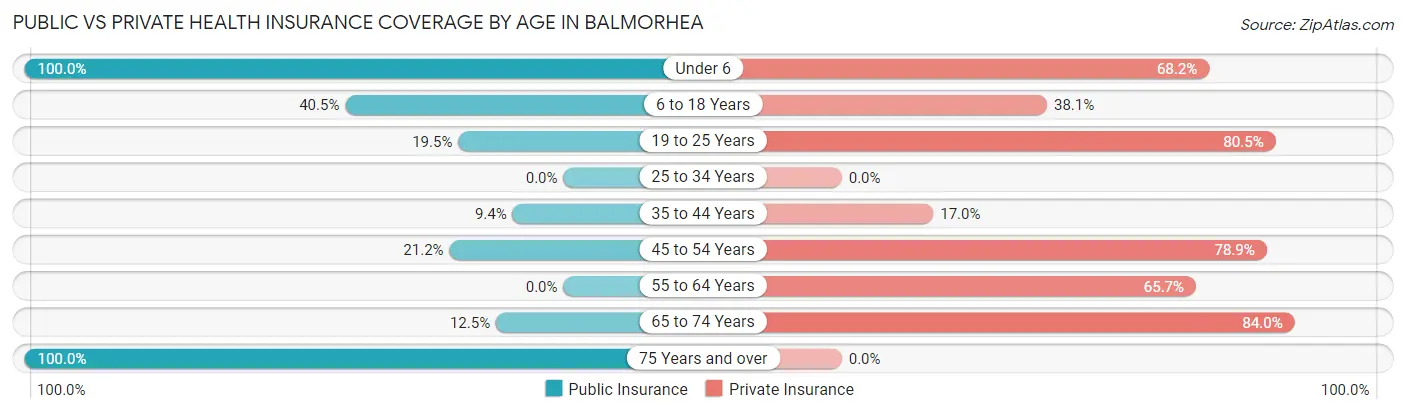
| Age Bracket | Public Insurance | Private Insurance |
| Under 6 | 22 (100.0%) | 15 (68.2%) |
| 6 to 18 Years | 34 (40.5%) | 32 (38.1%) |
| 19 to 25 Years | 8 (19.5%) | 33 (80.5%) |
| 25 to 34 Years | 0 (0.0%) | 0 (0.0%) |
| 35 to 44 Years | 5 (9.4%) | 9 (17.0%) |
| 45 to 54 Years | 11 (21.1%) | 41 (78.8%) |
| 55 to 64 Years | 0 (0.0%) | 23 (65.7%) |
| 65 to 74 Years | 18 (12.5%) | 121 (84.0%) |
| 75 Years and over | 17 (100.0%) | 0 (0.0%) |
| Total | 115 (24.9%) | 274 (59.3%) |
Disability Status by Sex by Age in Balmorhea
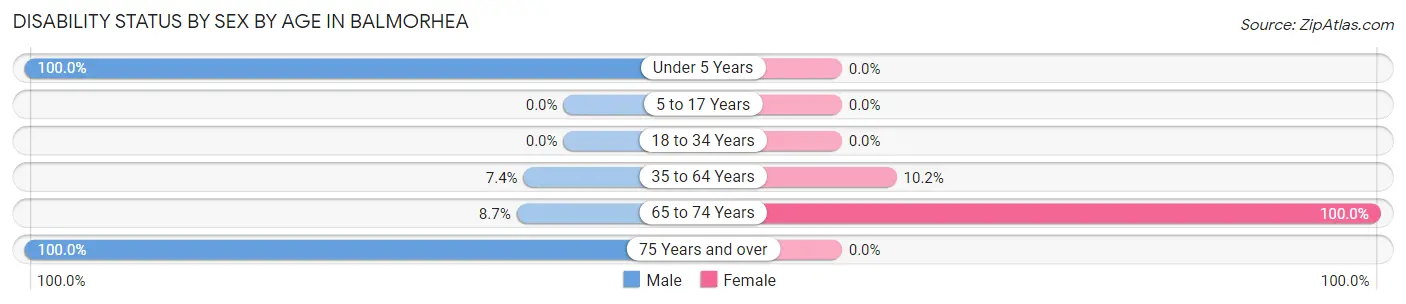
| Age Bracket | Male | Female |
| Under 5 Years | 7 (100.0%) | 0 (0.0%) |
| 5 to 17 Years | 0 (0.0%) | 0 (0.0%) |
| 18 to 34 Years | 0 (0.0%) | 0 (0.0%) |
| 35 to 64 Years | 6 (7.4%) | 6 (10.2%) |
| 65 to 74 Years | 12 (8.7%) | 6 (100.0%) |
| 75 Years and over | 7 (100.0%) | 0 (0.0%) |
Disability Class by Sex by Age in Balmorhea
Disability Class: Hearing Difficulty
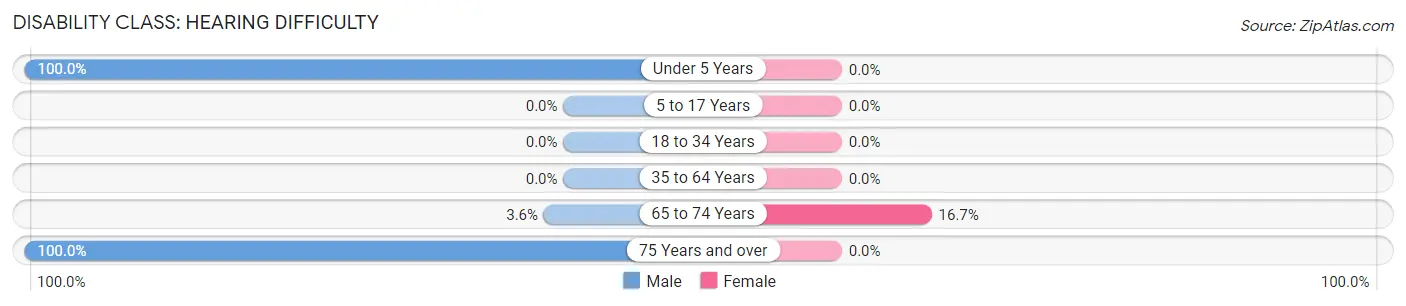
| Age Bracket | Male | Female |
| Under 5 Years | 7 (100.0%) | 0 (0.0%) |
| 5 to 17 Years | 0 (0.0%) | 0 (0.0%) |
| 18 to 34 Years | 0 (0.0%) | 0 (0.0%) |
| 35 to 64 Years | 0 (0.0%) | 0 (0.0%) |
| 65 to 74 Years | 5 (3.6%) | 1 (16.7%) |
| 75 Years and over | 7 (100.0%) | 0 (0.0%) |
Disability Class: Vision Difficulty
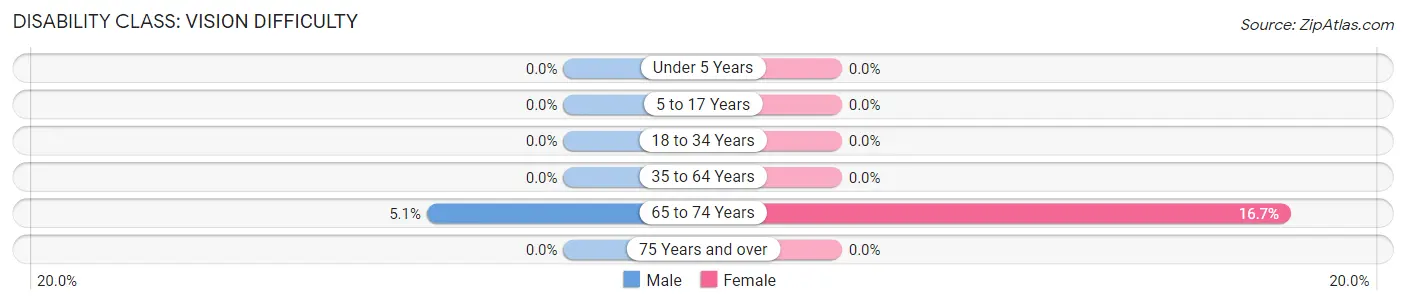
| Age Bracket | Male | Female |
| Under 5 Years | 0 (0.0%) | 0 (0.0%) |
| 5 to 17 Years | 0 (0.0%) | 0 (0.0%) |
| 18 to 34 Years | 0 (0.0%) | 0 (0.0%) |
| 35 to 64 Years | 0 (0.0%) | 0 (0.0%) |
| 65 to 74 Years | 7 (5.1%) | 1 (16.7%) |
| 75 Years and over | 0 (0.0%) | 0 (0.0%) |
Disability Class: Cognitive Difficulty
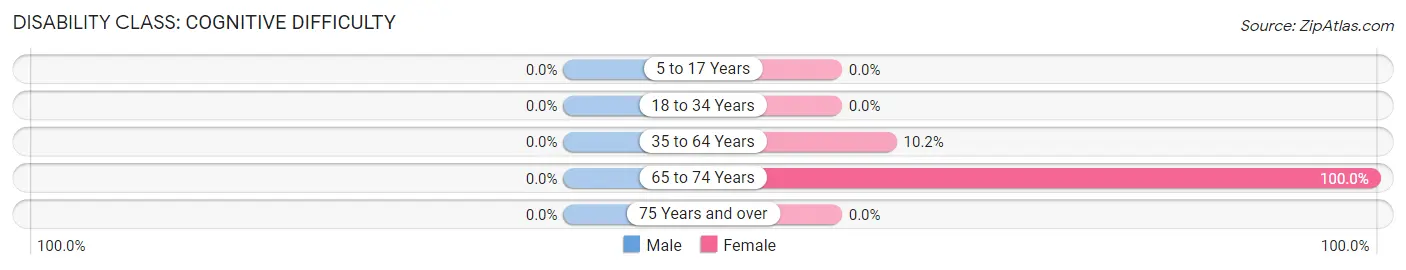
| Age Bracket | Male | Female |
| 5 to 17 Years | 0 (0.0%) | 0 (0.0%) |
| 18 to 34 Years | 0 (0.0%) | 0 (0.0%) |
| 35 to 64 Years | 0 (0.0%) | 6 (10.2%) |
| 65 to 74 Years | 0 (0.0%) | 6 (100.0%) |
| 75 Years and over | 0 (0.0%) | 0 (0.0%) |
Disability Class: Ambulatory Difficulty
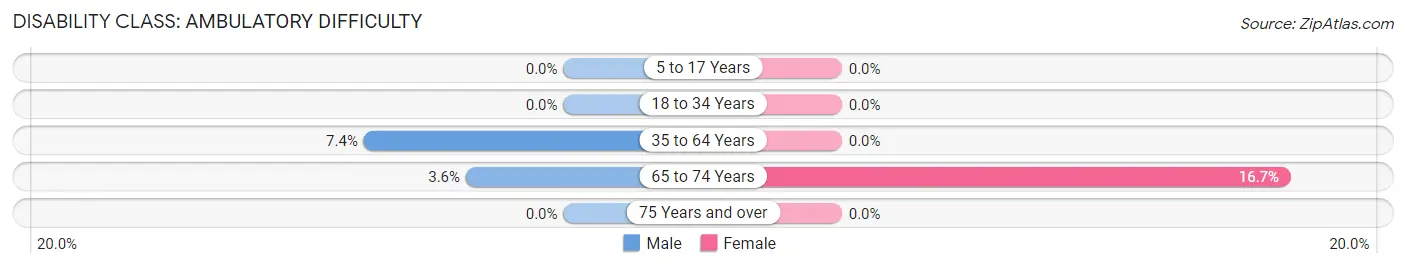
| Age Bracket | Male | Female |
| 5 to 17 Years | 0 (0.0%) | 0 (0.0%) |
| 18 to 34 Years | 0 (0.0%) | 0 (0.0%) |
| 35 to 64 Years | 6 (7.4%) | 0 (0.0%) |
| 65 to 74 Years | 5 (3.6%) | 1 (16.7%) |
| 75 Years and over | 0 (0.0%) | 0 (0.0%) |
Disability Class: Self-Care Difficulty
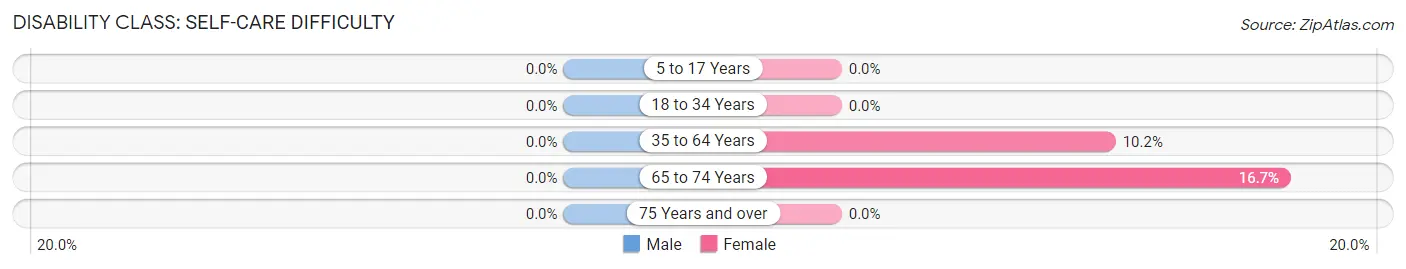
| Age Bracket | Male | Female |
| 5 to 17 Years | 0 (0.0%) | 0 (0.0%) |
| 18 to 34 Years | 0 (0.0%) | 0 (0.0%) |
| 35 to 64 Years | 0 (0.0%) | 6 (10.2%) |
| 65 to 74 Years | 0 (0.0%) | 1 (16.7%) |
| 75 Years and over | 0 (0.0%) | 0 (0.0%) |
Technology Access in Balmorhea
Computing Device Access in Balmorhea
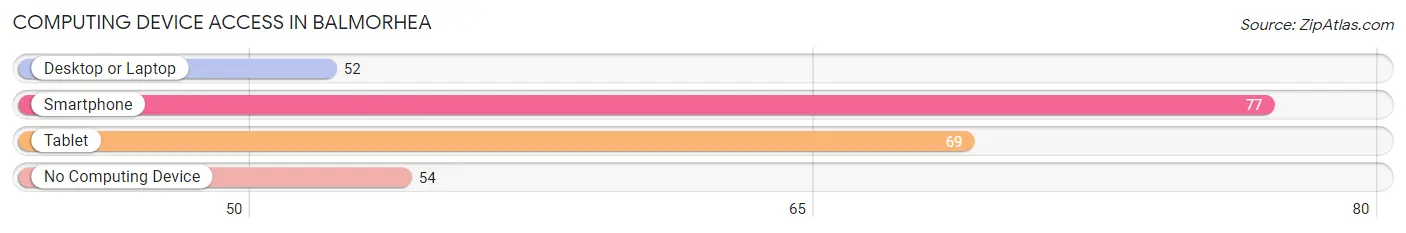
| Device Type | # Households | % Households |
| Desktop or Laptop | 52 | 37.4% |
| Smartphone | 77 | 55.4% |
| Tablet | 69 | 49.6% |
| No Computing Device | 54 | 38.9% |
| Total | 139 | 100.0% |
Internet Access in Balmorhea
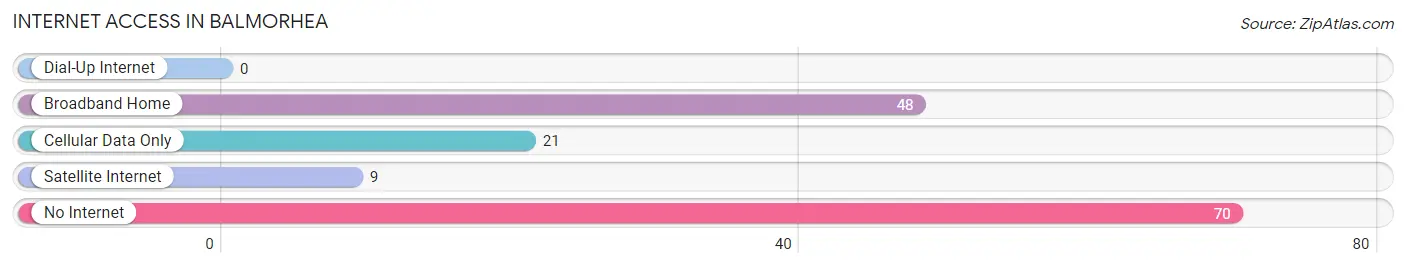
| Internet Type | # Households | % Households |
| Dial-Up Internet | 0 | 0.0% |
| Broadband Home | 48 | 34.5% |
| Cellular Data Only | 21 | 15.1% |
| Satellite Internet | 9 | 6.5% |
| No Internet | 70 | 50.4% |
| Total | 139 | 100.0% |
Balmorhea Summary
History
The small town of Balmorhea, Texas is located in Reeves County in the western part of the state. It was founded in 1881 by a group of settlers from the nearby town of Saragosa. The town was named after a local rancher, John Balmorhea, who owned a large ranch in the area. The town was originally a farming and ranching community, but it soon became a center for oil production.
In the early 1900s, the town was home to several oil companies, including the Texas Oil Company, which was the first to drill in the area. The town also had a number of other businesses, including a hotel, a bank, a general store, and a post office.
In the 1920s, the town experienced a boom in population due to the discovery of oil in the area. This led to the construction of several new businesses, including a movie theater, a bowling alley, and a hospital. The population of Balmorhea peaked in the 1940s, when it had a population of over 1,000 people.
Geography
Balmorhea is located in the western part of Reeves County, Texas. It is situated on the edge of the Chihuahuan Desert, and is surrounded by several mountain ranges, including the Davis Mountains to the west and the Guadalupe Mountains to the east. The town is located at an elevation of 3,000 feet above sea level.
The climate in Balmorhea is semi-arid, with hot summers and mild winters. The average annual temperature is around 70 degrees Fahrenheit, and the average annual precipitation is around 12 inches.
Economy
The economy of Balmorhea is largely based on oil production. The town is home to several oil companies, including the Texas Oil Company, which was the first to drill in the area. The town also has a number of other businesses, including a hotel, a bank, a general store, and a post office.
The town is also home to a number of tourist attractions, including the Balmorhea State Park, which is home to the world’s largest spring-fed swimming pool. The town also has a number of historic sites, including the Balmorhea Historic District, which is listed on the National Register of Historic Places.
Demographics
As of the 2010 census, the population of Balmorhea was 1,082. The racial makeup of the town was 75.3% White, 0.7% African American, 0.3% Native American, 0.2% Asian, 0.1% Pacific Islander, 21.2% from other races, and 2.4% from two or more races. Hispanic or Latino of any race were 44.2% of the population.
The median household income in Balmorhea was $25,938, and the median family income was $30,625. The per capita income for the town was $13,845. About 20.3% of families and 24.2% of the population were below the poverty line, including 33.3% of those under age 18 and 15.2% of those age 65 or over.
Common Questions
What is Per Capita Income in Balmorhea?
Per Capita income in Balmorhea is $31,674.
What is the Median Family Income in Balmorhea?
Median Family Income in Balmorhea is $73,958.
What is the Median Household income in Balmorhea?
Median Household Income in Balmorhea is $61,250.
What is Income or Wage Gap in Balmorhea?
Income or Wage Gap in Balmorhea is 95.7%.
Women in Balmorhea earn 4.3 cents for every dollar earned by a man.
What is Inequality or Gini Index in Balmorhea?
Inequality or Gini Index in Balmorhea is 0.41.
What is the Total Population of Balmorhea?
Total Population of Balmorhea is 462.
What is the Total Male Population of Balmorhea?
Total Male Population of Balmorhea is 341.
What is the Total Female Population of Balmorhea?
Total Female Population of Balmorhea is 121.
What is the Ratio of Males per 100 Females in Balmorhea?
There are 281.82 Males per 100 Females in Balmorhea.
What is the Ratio of Females per 100 Males in Balmorhea?
There are 35.48 Females per 100 Males in Balmorhea.
What is the Median Population Age in Balmorhea?
Median Population Age in Balmorhea is 45.4 Years.
What is the Average Family Size in Balmorhea
Average Family Size in Balmorhea is 3.5 People.
What is the Average Household Size in Balmorhea
Average Household Size in Balmorhea is 3.3 People.
How Large is the Labor Force in Balmorhea?
There are 298 People in the Labor Forcein in Balmorhea.
What is the Percentage of People in the Labor Force in Balmorhea?
76.8% of People are in the Labor Force in Balmorhea.