Olivarez, TX Map & Demographics
Olivarez Map
Olivarez Overview
$12,415
PER CAPITA INCOME
$61,103
AVG FAMILY INCOME
$61,740
AVG HOUSEHOLD INCOME
64.2%
WAGE / INCOME GAP [ % ]
35.8¢/ $1
WAGE / INCOME GAP [ $ ]
0.45
INEQUALITY / GINI INDEX
6,853
TOTAL POPULATION
3,305
MALE POPULATION
3,548
FEMALE POPULATION
93.15
MALES / 100 FEMALES
107.35
FEMALES / 100 MALES
15.2
MEDIAN AGE
6.0
AVG FAMILY SIZE
5.5
AVG HOUSEHOLD SIZE
1,803
LABOR FORCE [ PEOPLE ]
53.3%
PERCENT IN LABOR FORCE
3.7%
UNEMPLOYMENT RATE
Income in Olivarez
Income Overview in Olivarez
Per Capita Income in Olivarez is $12,415, while median incomes of families and households are $61,103 and $61,740 respectively.
| Characteristic | Number | Measure |
| Per Capita Income | 6,853 | $12,415 |
| Median Family Income | 1,093 | $61,103 |
| Mean Family Income | 1,093 | $65,362 |
| Median Household Income | 1,235 | $61,740 |
| Mean Household Income | 1,235 | $64,044 |
| Income Deficit | 1,093 | $0 |
| Wage / Income Gap (%) | 6,853 | 64.16% |
| Wage / Income Gap ($) | 6,853 | 35.84¢ per $1 |
| Gini / Inequality Index | 6,853 | 0.45 |
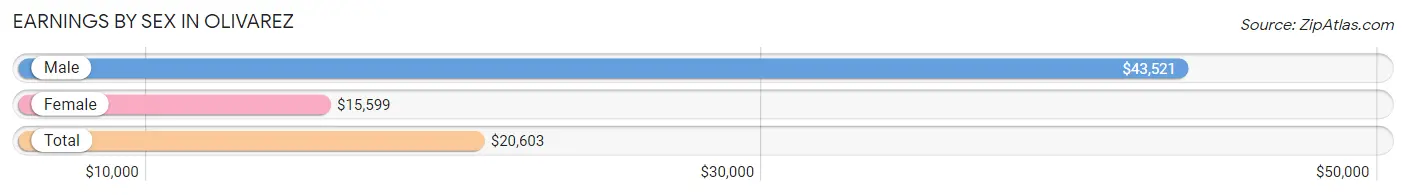
Earnings by Sex in Olivarez
Average Earnings in Olivarez are $20,603, $43,521 for men and $15,599 for women, a difference of 64.2%.
| Sex | Number | Average Earnings |
| Male | 938 (48.1%) | $43,521 |
| Female | 1,012 (51.9%) | $15,599 |
| Total | 1,950 (100.0%) | $20,603 |
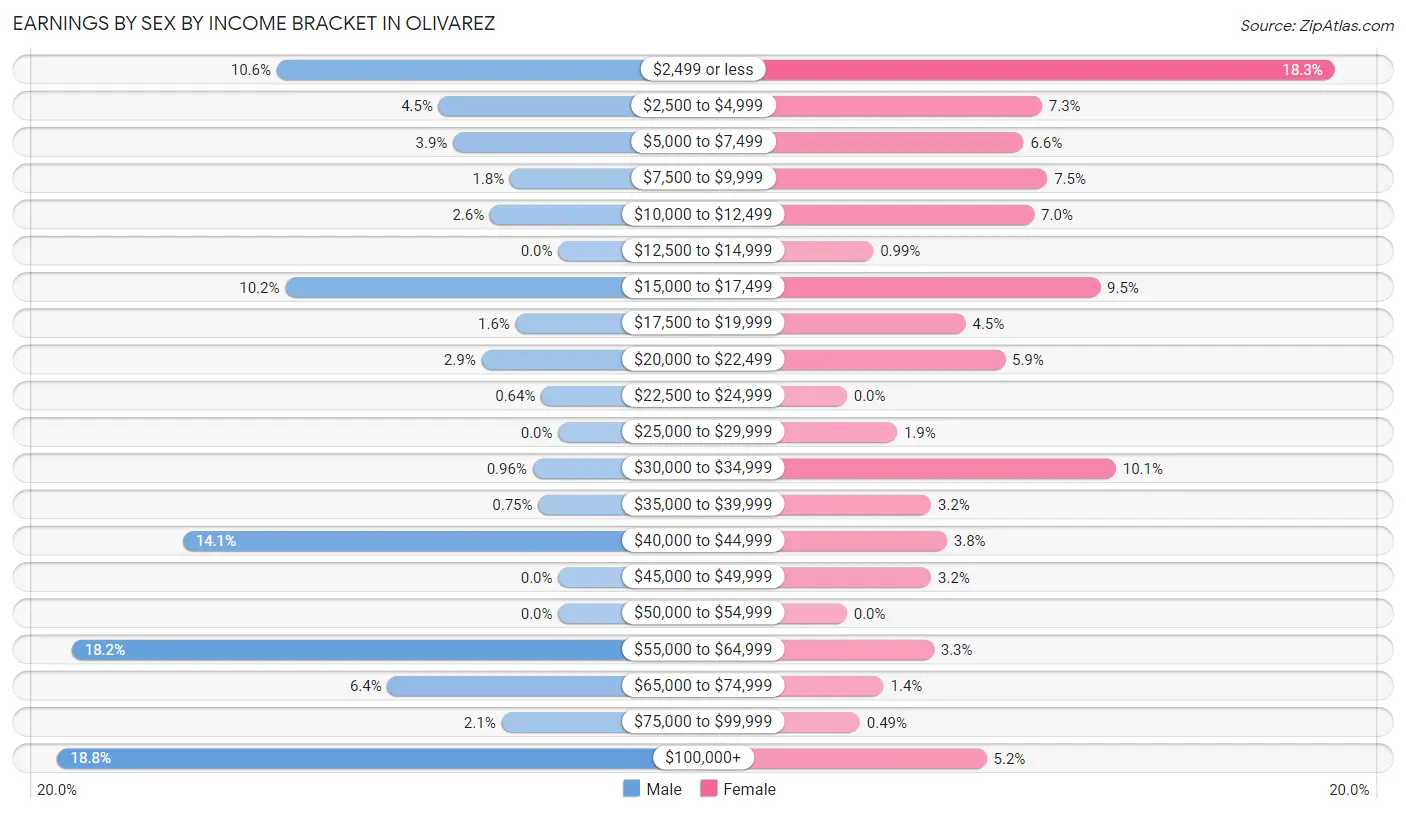
Earnings by Sex by Income Bracket in Olivarez
The most common earnings brackets in Olivarez are $100,000+ for men (176 | 18.8%) and $2,499 or less for women (185 | 18.3%).
| Income | Male | Female |
| $2,499 or less | 99 (10.5%) | 185 (18.3%) |
| $2,500 to $4,999 | 42 (4.5%) | 74 (7.3%) |
| $5,000 to $7,499 | 37 (3.9%) | 67 (6.6%) |
| $7,500 to $9,999 | 17 (1.8%) | 76 (7.5%) |
| $10,000 to $12,499 | 24 (2.6%) | 71 (7.0%) |
| $12,500 to $14,999 | 0 (0.0%) | 10 (1.0%) |
| $15,000 to $17,499 | 96 (10.2%) | 96 (9.5%) |
| $17,500 to $19,999 | 15 (1.6%) | 45 (4.4%) |
| $20,000 to $22,499 | 27 (2.9%) | 60 (5.9%) |
| $22,500 to $24,999 | 6 (0.6%) | 0 (0.0%) |
| $25,000 to $29,999 | 0 (0.0%) | 19 (1.9%) |
| $30,000 to $34,999 | 9 (1.0%) | 102 (10.1%) |
| $35,000 to $39,999 | 7 (0.7%) | 32 (3.2%) |
| $40,000 to $44,999 | 132 (14.1%) | 38 (3.7%) |
| $45,000 to $49,999 | 0 (0.0%) | 32 (3.2%) |
| $50,000 to $54,999 | 0 (0.0%) | 0 (0.0%) |
| $55,000 to $64,999 | 171 (18.2%) | 33 (3.3%) |
| $65,000 to $74,999 | 60 (6.4%) | 14 (1.4%) |
| $75,000 to $99,999 | 20 (2.1%) | 5 (0.5%) |
| $100,000+ | 176 (18.8%) | 53 (5.2%) |
| Total | 938 (100.0%) | 1,012 (100.0%) |
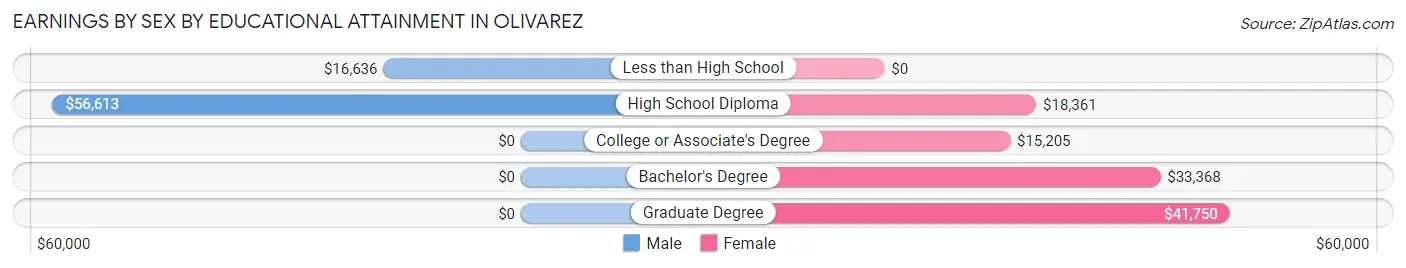
Earnings by Sex by Educational Attainment in Olivarez
Average earnings in Olivarez are $42,357 for men and $15,521 for women, a difference of 63.4%. Men with an educational attainment of high school diploma enjoy the highest average annual earnings of $56,613, while those with less than high school education earn the least with $16,636. Women with an educational attainment of graduate degree earn the most with the average annual earnings of $41,750, while those with college or associate's degree education have the smallest earnings of $15,205.
| Educational Attainment | Male Income | Female Income |
| Less than High School | $16,636 | $0 |
| High School Diploma | $56,613 | $18,361 |
| College or Associate's Degree | - | - |
| Bachelor's Degree | - | - |
| Graduate Degree | - | - |
| Total | $42,357 | $15,521 |
Family Income in Olivarez
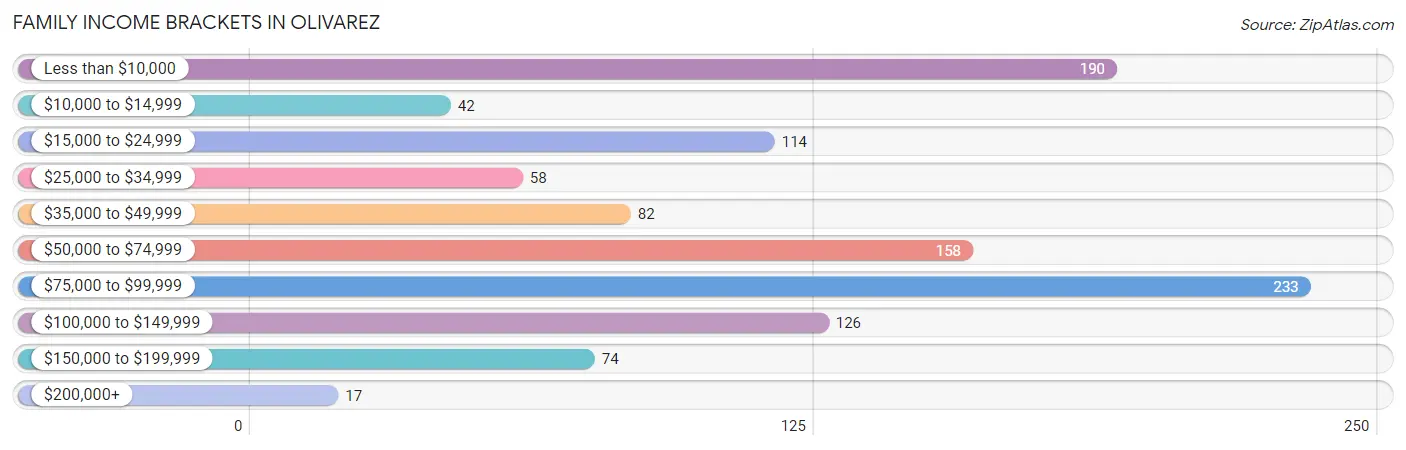
Family Income Brackets in Olivarez
According to the Olivarez family income data, there are 233 families falling into the $75,000 to $99,999 income range, which is the most common income bracket and makes up 21.3% of all families. Conversely, the $200,000+ income bracket is the least frequent group with only 17 families (1.6%) belonging to this category.
| Income Bracket | # Families | % Families |
| Less than $10,000 | 190 | 17.4% |
| $10,000 to $14,999 | 42 | 3.8% |
| $15,000 to $24,999 | 114 | 10.4% |
| $25,000 to $34,999 | 58 | 5.3% |
| $35,000 to $49,999 | 82 | 7.5% |
| $50,000 to $74,999 | 158 | 14.5% |
| $75,000 to $99,999 | 233 | 21.3% |
| $100,000 to $149,999 | 126 | 11.5% |
| $150,000 to $199,999 | 74 | 6.8% |
| $200,000+ | 17 | 1.6% |
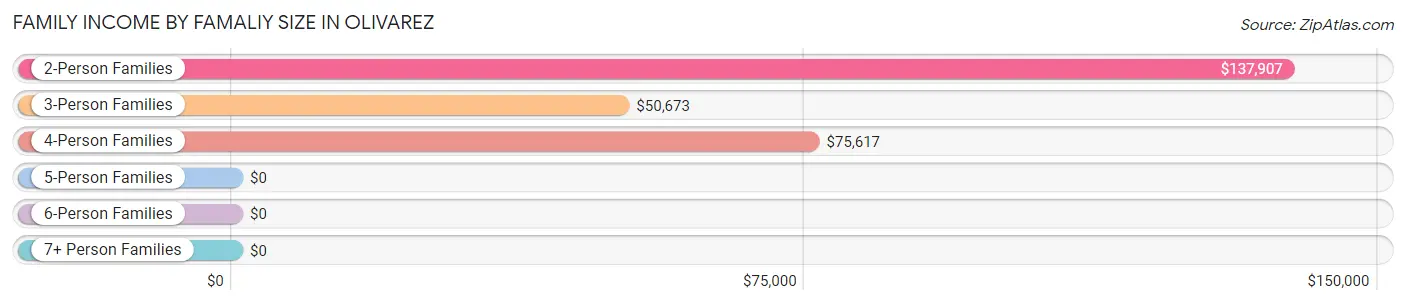
Family Income by Famaliy Size in Olivarez
2-person families (225 | 20.6%) account for the highest median family income in Olivarez with $137,907 per family, while 2-person families (225 | 20.6%) have the highest median income of $68,954 per family member.
| Income Bracket | # Families | Median Income |
| 2-Person Families | 225 (20.6%) | $137,907 |
| 3-Person Families | 191 (17.5%) | $50,673 |
| 4-Person Families | 243 (22.2%) | $75,617 |
| 5-Person Families | 169 (15.5%) | $0 |
| 6-Person Families | 44 (4.0%) | $0 |
| 7+ Person Families | 221 (20.2%) | $0 |
| Total | 1,093 (100.0%) | $61,103 |
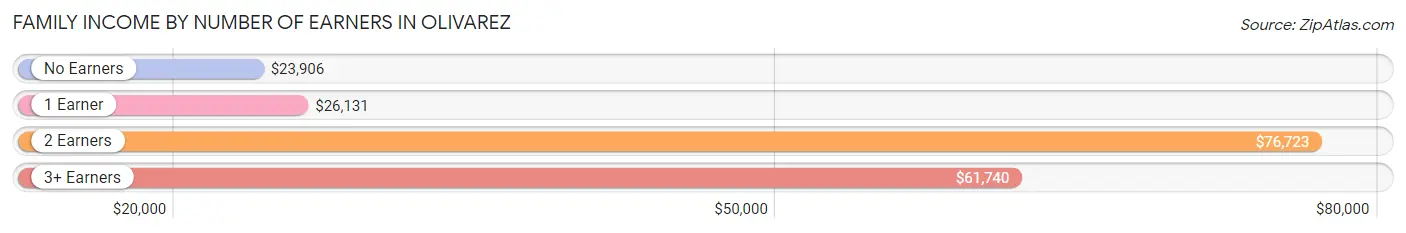
Family Income by Number of Earners in Olivarez
The median family income in Olivarez is $61,103, with families comprising 2 earners (330) having the highest median family income of $76,723, while families with no earners (33) have the lowest median family income of $23,906, accounting for 30.2% and 3.0% of families, respectively.
| Number of Earners | # Families | Median Income |
| No Earners | 33 (3.0%) | $23,906 |
| 1 Earner | 589 (53.9%) | $26,131 |
| 2 Earners | 330 (30.2%) | $76,723 |
| 3+ Earners | 141 (12.9%) | $61,740 |
| Total | 1,093 (100.0%) | $61,103 |
Household Income in Olivarez
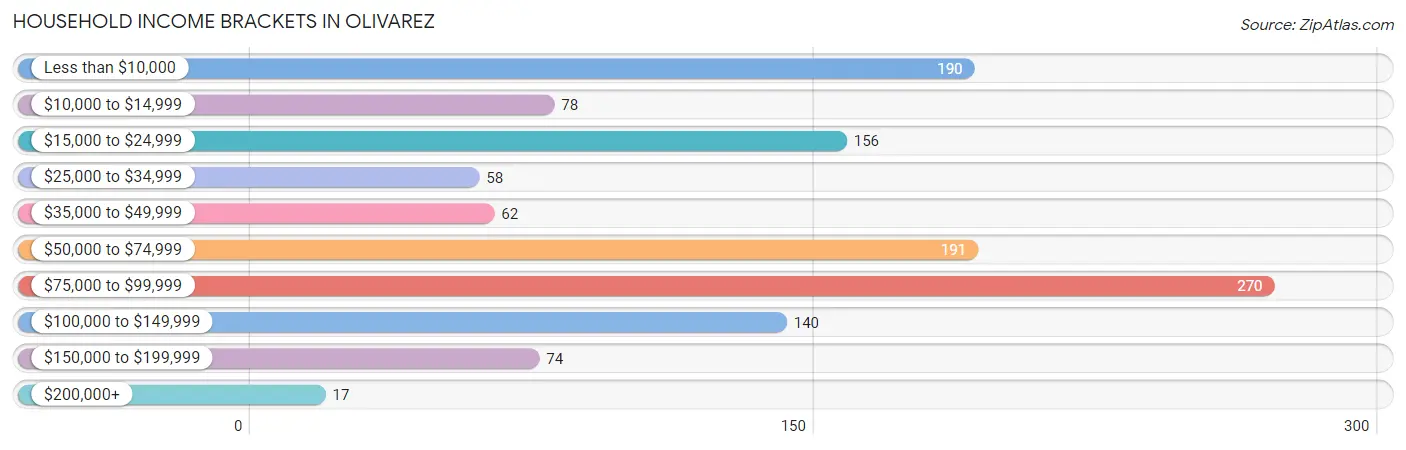
Household Income Brackets in Olivarez
With 270 households falling in the category, the $75,000 to $99,999 income range is the most frequent in Olivarez, accounting for 21.9% of all households. In contrast, only 17 households (1.4%) fall into the $200,000+ income bracket, making it the least populous group.
| Income Bracket | # Households | % Households |
| Less than $10,000 | 190 | 15.4% |
| $10,000 to $14,999 | 78 | 6.3% |
| $15,000 to $24,999 | 156 | 12.6% |
| $25,000 to $34,999 | 58 | 4.7% |
| $35,000 to $49,999 | 62 | 5.0% |
| $50,000 to $74,999 | 191 | 15.5% |
| $75,000 to $99,999 | 270 | 21.9% |
| $100,000 to $149,999 | 140 | 11.3% |
| $150,000 to $199,999 | 74 | 6.0% |
| $200,000+ | 17 | 1.4% |
Household Income by Householder Age in Olivarez
The median household income in Olivarez is $61,740, with the highest median household income of $73,802 found in the 45 to 64 years age bracket for the primary householder. A total of 560 households (45.3%) fall into this category. Meanwhile, the 15 to 24 years age bracket for the primary householder has the lowest median household income of $0, with 14 households (1.1%) in this group.
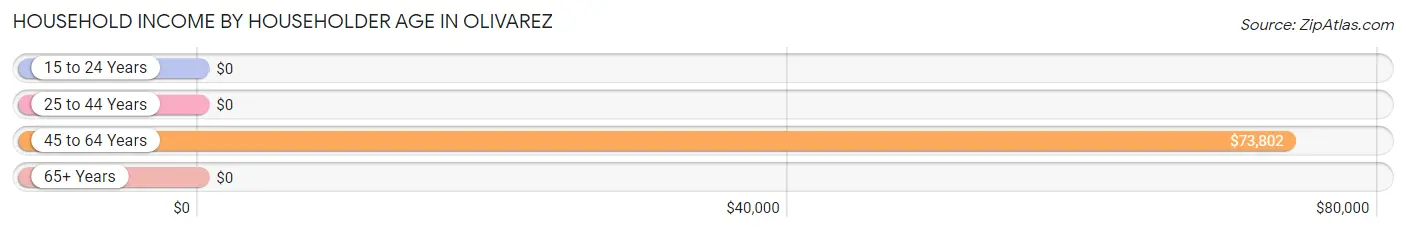
| Income Bracket | # Households | Median Income |
| 15 to 24 Years | 14 (1.1%) | $0 |
| 25 to 44 Years | 353 (28.6%) | $0 |
| 45 to 64 Years | 560 (45.3%) | $73,802 |
| 65+ Years | 308 (24.9%) | $0 |
| Total | 1,235 (100.0%) | $61,740 |
Poverty in Olivarez
Income Below Poverty by Sex and Age in Olivarez
With 36.3% poverty level for males and 27.3% for females among the residents of Olivarez, 5 year old males and 5 year old females are the most vulnerable to poverty, with 65 males (100.0%) and 117 females (88.0%) in their respective age groups living below the poverty level.
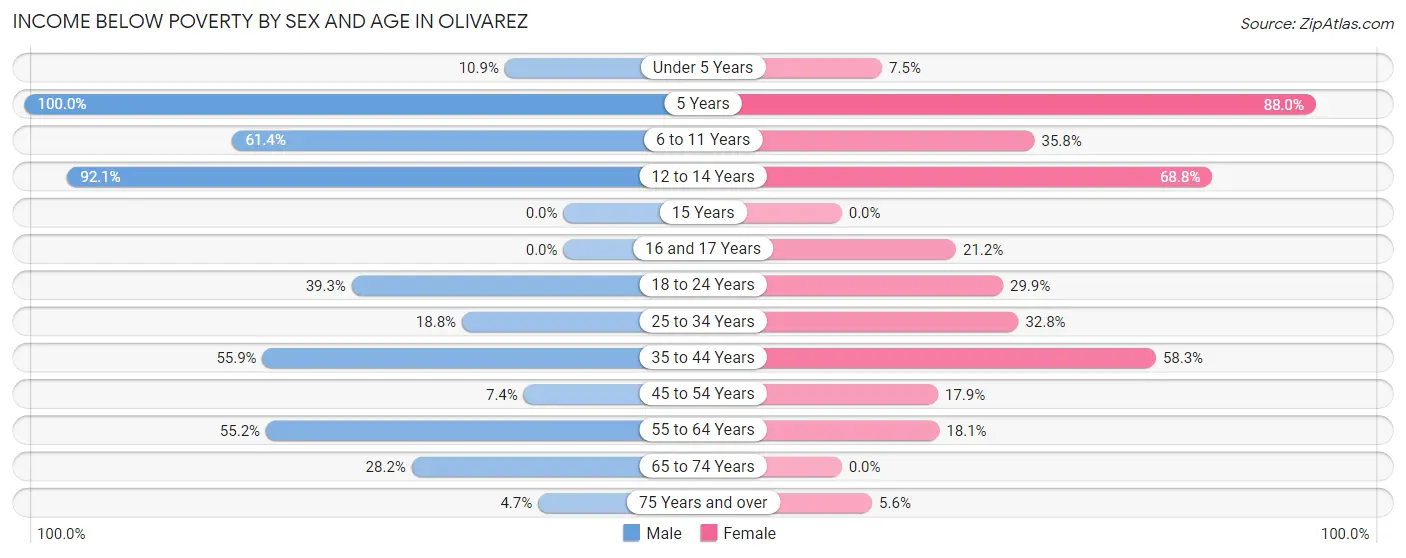
| Age Bracket | Male | Female |
| Under 5 Years | 78 (10.9%) | 73 (7.5%) |
| 5 Years | 65 (100.0%) | 117 (88.0%) |
| 6 to 11 Years | 401 (61.4%) | 156 (35.8%) |
| 12 to 14 Years | 197 (92.1%) | 132 (68.8%) |
| 15 Years | 0 (0.0%) | 0 (0.0%) |
| 16 and 17 Years | 0 (0.0%) | 14 (21.2%) |
| 18 to 24 Years | 132 (39.3%) | 82 (29.9%) |
| 25 to 34 Years | 58 (18.8%) | 100 (32.8%) |
| 35 to 44 Years | 105 (55.8%) | 200 (58.3%) |
| 45 to 54 Years | 24 (7.4%) | 35 (17.9%) |
| 55 to 64 Years | 53 (55.2%) | 50 (18.1%) |
| 65 to 74 Years | 69 (28.2%) | 0 (0.0%) |
| 75 Years and over | 6 (4.7%) | 11 (5.6%) |
| Total | 1,188 (36.3%) | 970 (27.3%) |
Income Above Poverty by Sex and Age in Olivarez
According to the poverty statistics in Olivarez, males aged 75 years and over and females aged 15 years are the age groups that are most secure financially, with 95.3% of males and 100.0% of females in these age groups living above the poverty line.
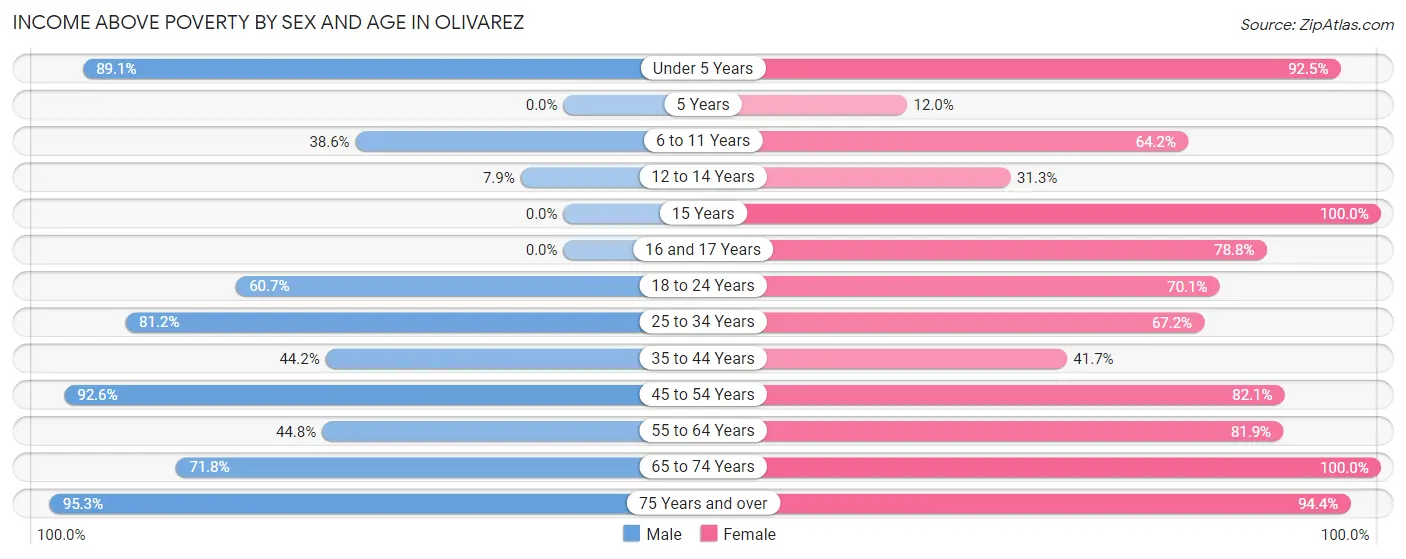
| Age Bracket | Male | Female |
| Under 5 Years | 639 (89.1%) | 902 (92.5%) |
| 5 Years | 0 (0.0%) | 16 (12.0%) |
| 6 to 11 Years | 252 (38.6%) | 280 (64.2%) |
| 12 to 14 Years | 17 (7.9%) | 60 (31.2%) |
| 15 Years | 0 (0.0%) | 56 (100.0%) |
| 16 and 17 Years | 0 (0.0%) | 52 (78.8%) |
| 18 to 24 Years | 204 (60.7%) | 192 (70.1%) |
| 25 to 34 Years | 250 (81.2%) | 205 (67.2%) |
| 35 to 44 Years | 83 (44.2%) | 143 (41.7%) |
| 45 to 54 Years | 301 (92.6%) | 161 (82.1%) |
| 55 to 64 Years | 43 (44.8%) | 226 (81.9%) |
| 65 to 74 Years | 176 (71.8%) | 101 (100.0%) |
| 75 Years and over | 122 (95.3%) | 184 (94.4%) |
| Total | 2,087 (63.7%) | 2,578 (72.7%) |
Income Below Poverty Among Married-Couple Families in Olivarez
The poverty statistics for married-couple families in Olivarez show that 24.3% or 141 of the total 580 families live below the poverty line. Families with 5 or more children have the highest poverty rate of 40.7%, comprising of 35 families. On the other hand, families with no children have the lowest poverty rate of 6.3%, which includes 12 families.
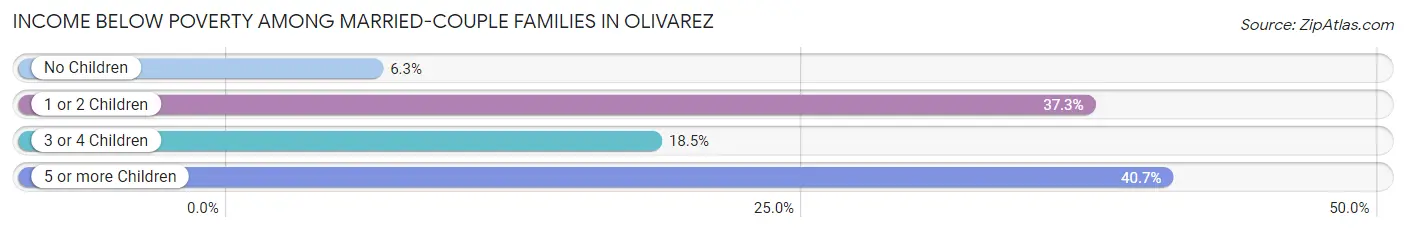
| Children | Above Poverty | Below Poverty |
| No Children | 178 (93.7%) | 12 (6.3%) |
| 1 or 2 Children | 126 (62.7%) | 75 (37.3%) |
| 3 or 4 Children | 84 (81.6%) | 19 (18.4%) |
| 5 or more Children | 51 (59.3%) | 35 (40.7%) |
| Total | 439 (75.7%) | 141 (24.3%) |
Income Below Poverty Among Single-Parent Households in Olivarez
According to the poverty data in Olivarez, 37.1% or 63 single-father households and 40.8% or 140 single-mother households are living below the poverty line. Among single-father households, those with 3 or 4 children have the highest poverty rate, with 63 households (100.0%) experiencing poverty. Likewise, among single-mother households, those with 3 or 4 children have the highest poverty rate, with 13 households (100.0%) falling below the poverty line.
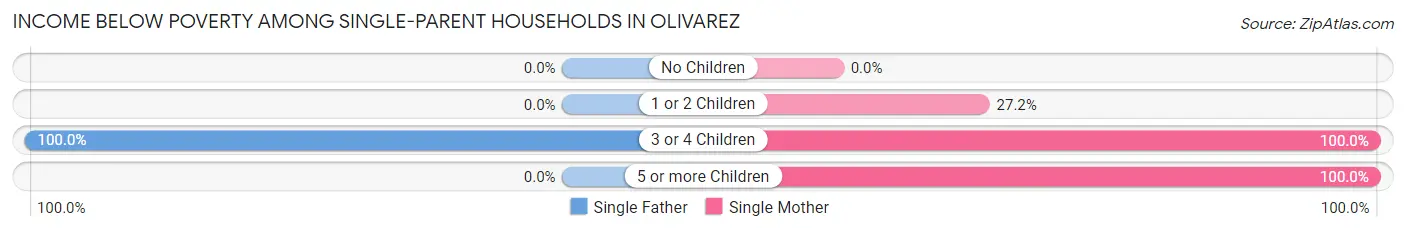
| Children | Single Father | Single Mother |
| No Children | 0 (0.0%) | 0 (0.0%) |
| 1 or 2 Children | 0 (0.0%) | 53 (27.2%) |
| 3 or 4 Children | 63 (100.0%) | 13 (100.0%) |
| 5 or more Children | 0 (0.0%) | 74 (100.0%) |
| Total | 63 (37.1%) | 140 (40.8%) |
Income Below Poverty Among Married-Couple vs Single-Parent Households in Olivarez
The poverty data for Olivarez shows that 141 of the married-couple family households (24.3%) and 203 of the single-parent households (39.6%) are living below the poverty level. Within the married-couple family households, those with 5 or more children have the highest poverty rate, with 35 households (40.7%) falling below the poverty line. Among the single-parent households, those with 3 or 4 children have the highest poverty rate, with 76 household (100.0%) living below poverty.
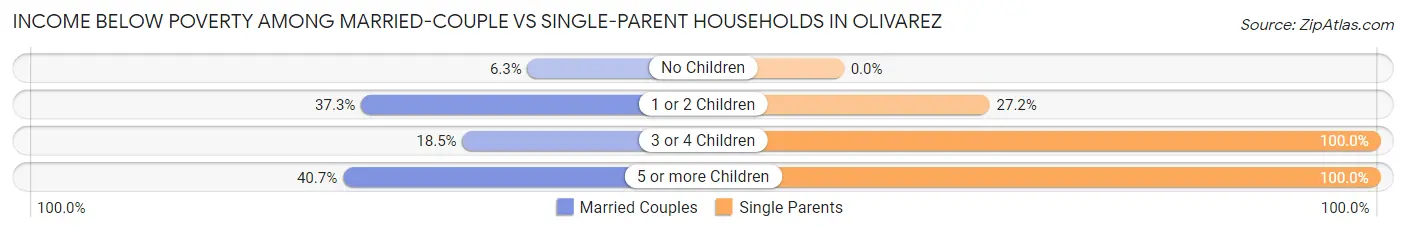
| Children | Married-Couple Families | Single-Parent Households |
| No Children | 12 (6.3%) | 0 (0.0%) |
| 1 or 2 Children | 75 (37.3%) | 53 (27.2%) |
| 3 or 4 Children | 19 (18.4%) | 76 (100.0%) |
| 5 or more Children | 35 (40.7%) | 74 (100.0%) |
| Total | 141 (24.3%) | 203 (39.6%) |
Race in Olivarez
The most populous races in Olivarez are Hispanic or Latino (6,853 | 100.0%), White / Caucasian (4,273 | 62.4%), and Two or more Races (1,674 | 24.4%).
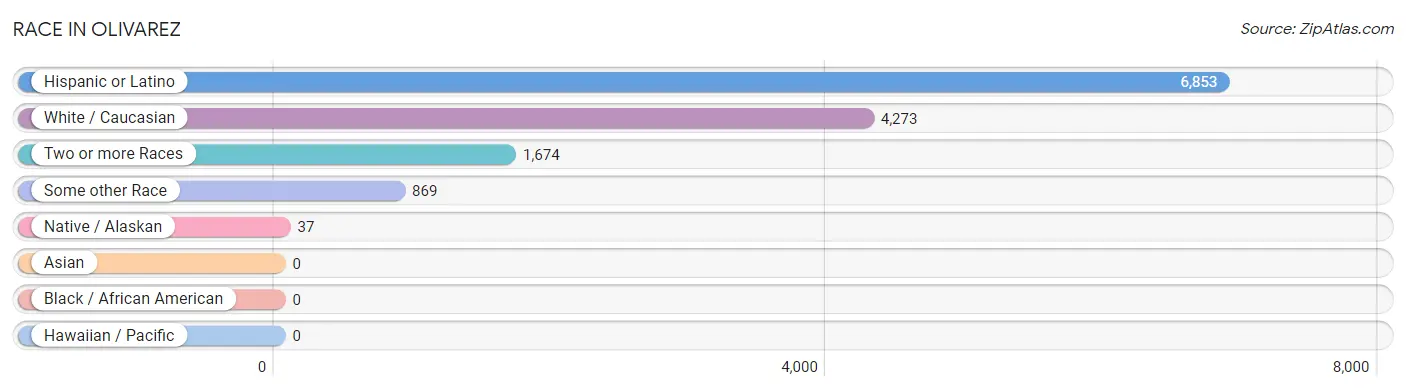
| Race | # Population | % Population |
| Asian | 0 | 0.0% |
| Black / African American | 0 | 0.0% |
| Hawaiian / Pacific | 0 | 0.0% |
| Hispanic or Latino | 6,853 | 100.0% |
| Native / Alaskan | 37 | 0.5% |
| White / Caucasian | 4,273 | 62.4% |
| Two or more Races | 1,674 | 24.4% |
| Some other Race | 869 | 12.7% |
| Total | 6,853 | 100.0% |
Ancestry in Olivarez
The most populous ancestries reported in Olivarez are Mexican (6,693 | 97.7%), Central American (112 | 1.6%), Nicaraguan (112 | 1.6%), Italian (103 | 1.5%), and German (63 | 0.9%), together accounting for 103.4% of all Olivarez residents.
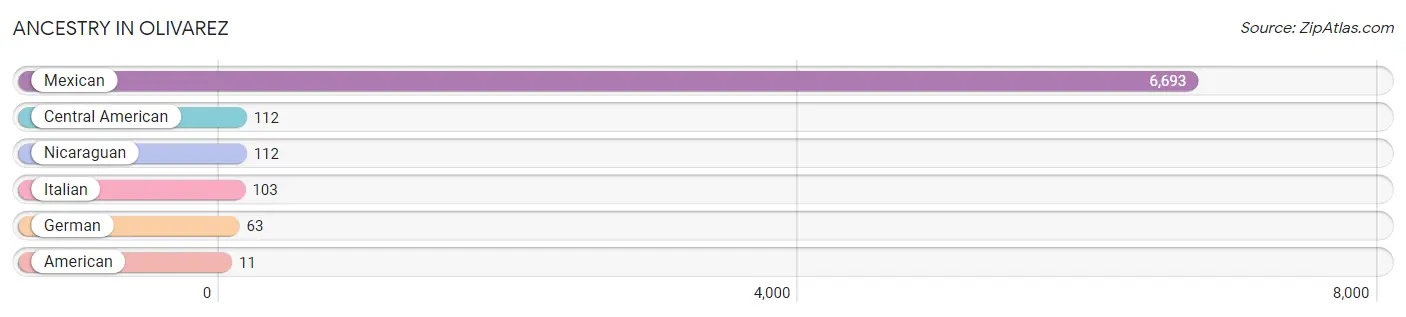
| Ancestry | # Population | % Population |
| American | 11 | 0.2% |
| Central American | 112 | 1.6% |
| German | 63 | 0.9% |
| Italian | 103 | 1.5% |
| Mexican | 6,693 | 97.7% |
| Nicaraguan | 112 | 1.6% | View All 6 Rows |
Immigrants in Olivarez
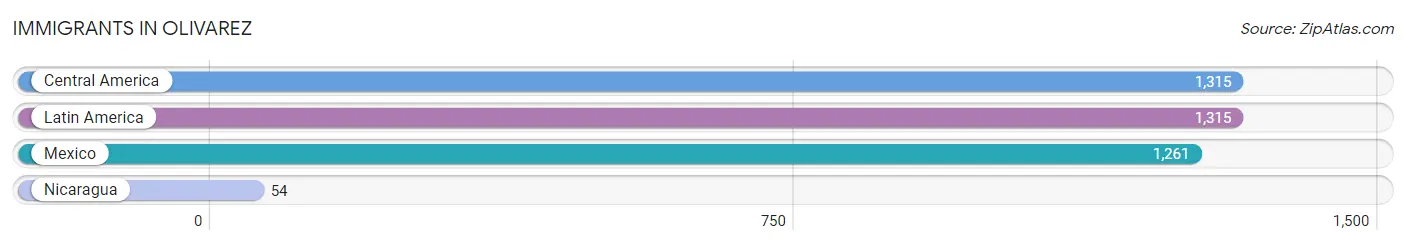
The most numerous immigrant groups reported in Olivarez came from Central America (1,315 | 19.2%), Latin America (1,315 | 19.2%), Mexico (1,261 | 18.4%), and Nicaragua (54 | 0.8%), together accounting for 57.6% of all Olivarez residents.
| Immigration Origin | # Population | % Population |
| Central America | 1,315 | 19.2% |
| Latin America | 1,315 | 19.2% |
| Mexico | 1,261 | 18.4% |
| Nicaragua | 54 | 0.8% | View All 4 Rows |
Sex and Age in Olivarez
Sex and Age in Olivarez
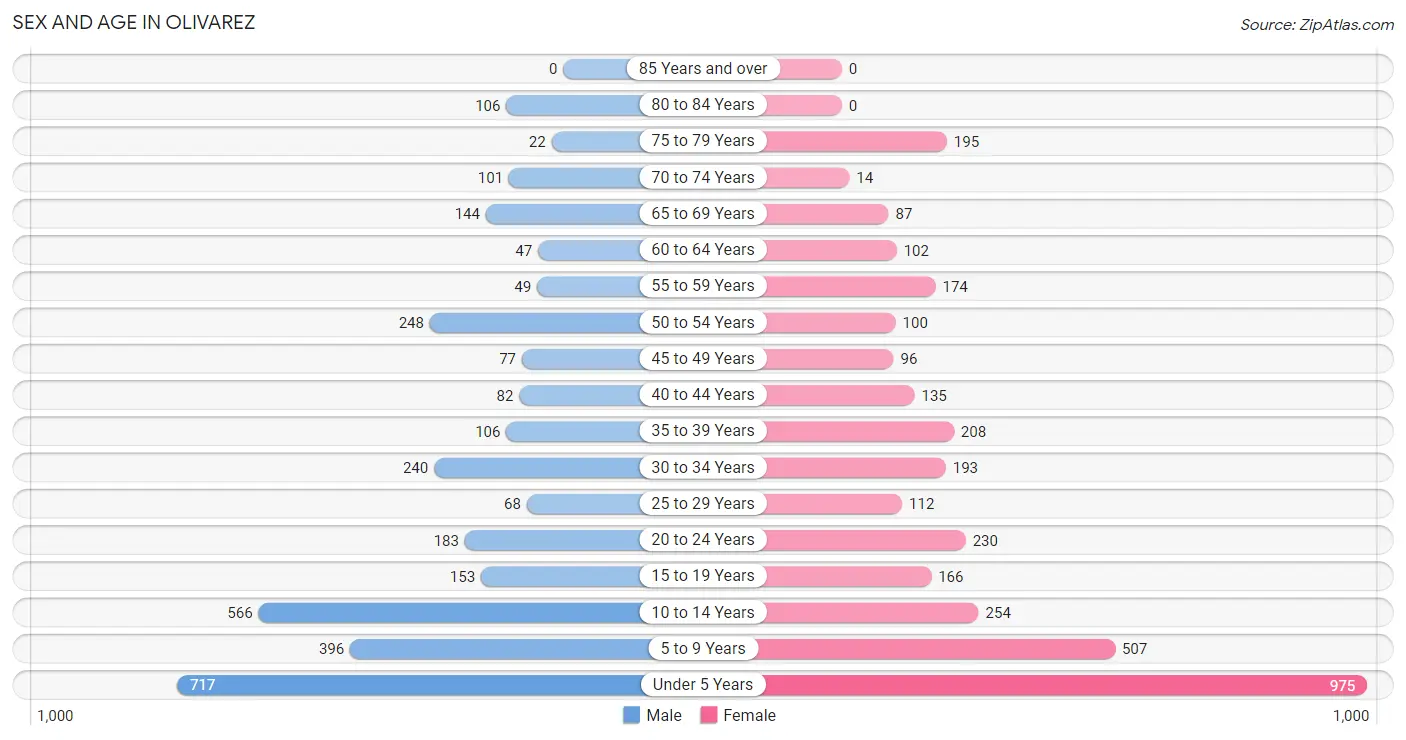
The most populous age groups in Olivarez are Under 5 Years (717 | 21.7%) for men and Under 5 Years (975 | 27.5%) for women.
| Age Bracket | Male | Female |
| Under 5 Years | 717 (21.7%) | 975 (27.5%) |
| 5 to 9 Years | 396 (12.0%) | 507 (14.3%) |
| 10 to 14 Years | 566 (17.1%) | 254 (7.2%) |
| 15 to 19 Years | 153 (4.6%) | 166 (4.7%) |
| 20 to 24 Years | 183 (5.5%) | 230 (6.5%) |
| 25 to 29 Years | 68 (2.1%) | 112 (3.2%) |
| 30 to 34 Years | 240 (7.3%) | 193 (5.4%) |
| 35 to 39 Years | 106 (3.2%) | 208 (5.9%) |
| 40 to 44 Years | 82 (2.5%) | 135 (3.8%) |
| 45 to 49 Years | 77 (2.3%) | 96 (2.7%) |
| 50 to 54 Years | 248 (7.5%) | 100 (2.8%) |
| 55 to 59 Years | 49 (1.5%) | 174 (4.9%) |
| 60 to 64 Years | 47 (1.4%) | 102 (2.9%) |
| 65 to 69 Years | 144 (4.4%) | 87 (2.5%) |
| 70 to 74 Years | 101 (3.1%) | 14 (0.4%) |
| 75 to 79 Years | 22 (0.7%) | 195 (5.5%) |
| 80 to 84 Years | 106 (3.2%) | 0 (0.0%) |
| 85 Years and over | 0 (0.0%) | 0 (0.0%) |
| Total | 3,305 (100.0%) | 3,548 (100.0%) |
Families and Households in Olivarez
Median Family Size in Olivarez
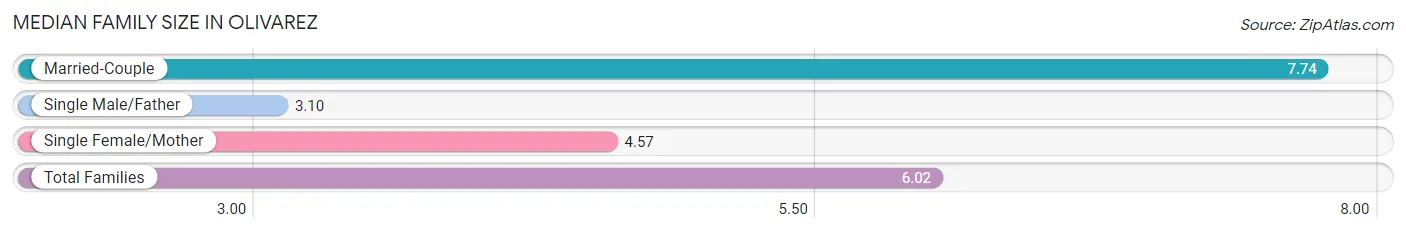
The median family size in Olivarez is 6.02 persons per family, with married-couple families (580 | 53.1%) accounting for the largest median family size of 7.74 persons per family. On the other hand, single male/father families (170 | 15.5%) represent the smallest median family size with 3.10 persons per family.
| Family Type | # Families | Family Size |
| Married-Couple | 580 (53.1%) | 7.74 |
| Single Male/Father | 170 (15.5%) | 3.10 |
| Single Female/Mother | 343 (31.4%) | 4.57 |
| Total Families | 1,093 (100.0%) | 6.02 |
Median Household Size in Olivarez
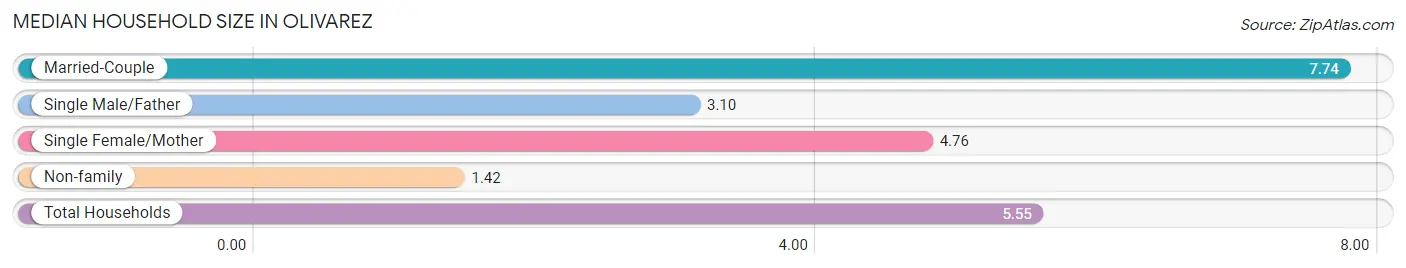
The median household size in Olivarez is 5.55 persons per household, with married-couple households (580 | 47.0%) accounting for the largest median household size of 7.74 persons per household. non-family households (142 | 11.5%) represent the smallest median household size with 1.42 persons per household.
| Household Type | # Households | Household Size |
| Married-Couple | 580 (47.0%) | 7.74 |
| Single Male/Father | 170 (13.8%) | 3.10 |
| Single Female/Mother | 343 (27.8%) | 4.76 |
| Non-family | 142 (11.5%) | 1.42 |
| Total Households | 1,235 (100.0%) | 5.55 |
Household Size by Marriage Status in Olivarez
Out of a total of 1,235 households in Olivarez, 1,093 (88.5%) are family households, while 142 (11.5%) are nonfamily households. The most numerous type of family households are 4-person households, comprising 262, and the most common type of nonfamily households are 1-person households, comprising 128.
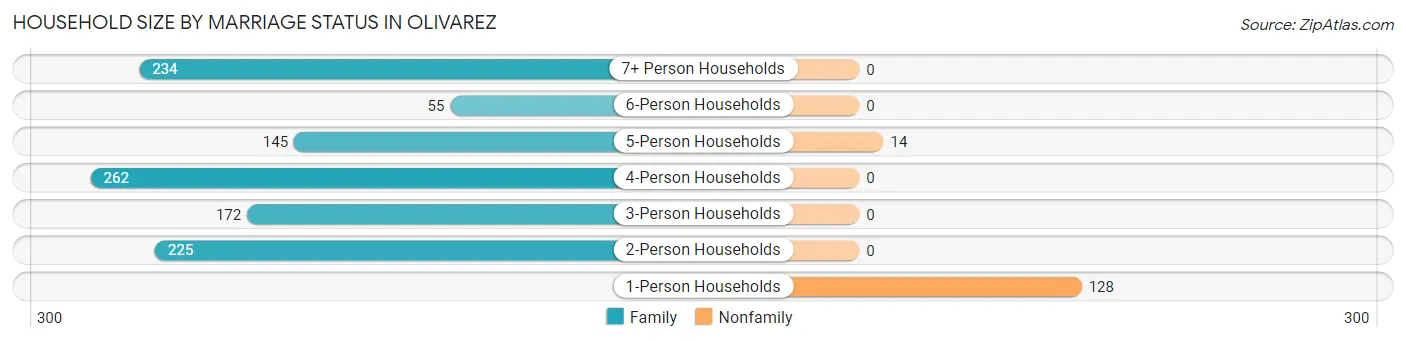
| Household Size | Family Households | Nonfamily Households |
| 1-Person Households | - | 128 (10.4%) |
| 2-Person Households | 225 (18.2%) | 0 (0.0%) |
| 3-Person Households | 172 (13.9%) | 0 (0.0%) |
| 4-Person Households | 262 (21.2%) | 0 (0.0%) |
| 5-Person Households | 145 (11.7%) | 14 (1.1%) |
| 6-Person Households | 55 (4.4%) | 0 (0.0%) |
| 7+ Person Households | 234 (19.0%) | 0 (0.0%) |
| Total | 1,093 (88.5%) | 142 (11.5%) |
Female Fertility in Olivarez
Fertility by Age in Olivarez
Average fertility rate in Olivarez is 74.0 births per 1,000 women. Women in the age bracket of 20 to 34 years have the highest fertility rate with 97.0 births per 1,000 women. Women in the age bracket of 20 to 34 years acount for 59.8% of all women with births.
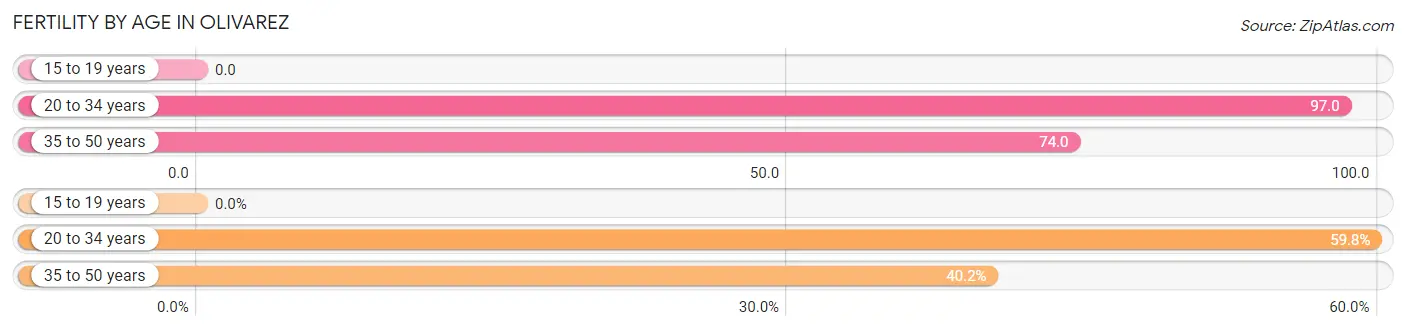
| Age Bracket | Women with Births | Births / 1,000 Women |
| 15 to 19 years | 0 (0.0%) | 0.0 |
| 20 to 34 years | 52 (59.8%) | 97.0 |
| 35 to 50 years | 35 (40.2%) | 74.0 |
| Total | 87 (100.0%) | 74.0 |
Fertility by Age by Marriage Status in Olivarez
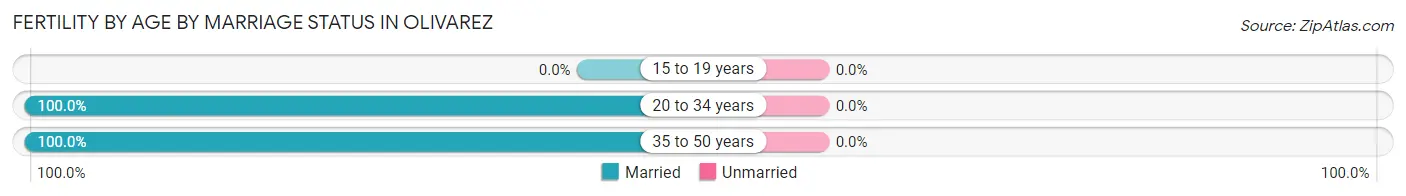
| Age Bracket | Married | Unmarried |
| 15 to 19 years | 0 (0.0%) | 0 (0.0%) |
| 20 to 34 years | 52 (100.0%) | 0 (0.0%) |
| 35 to 50 years | 35 (100.0%) | 0 (0.0%) |
| Total | 87 (100.0%) | 0 (0.0%) |
Fertility by Education in Olivarez
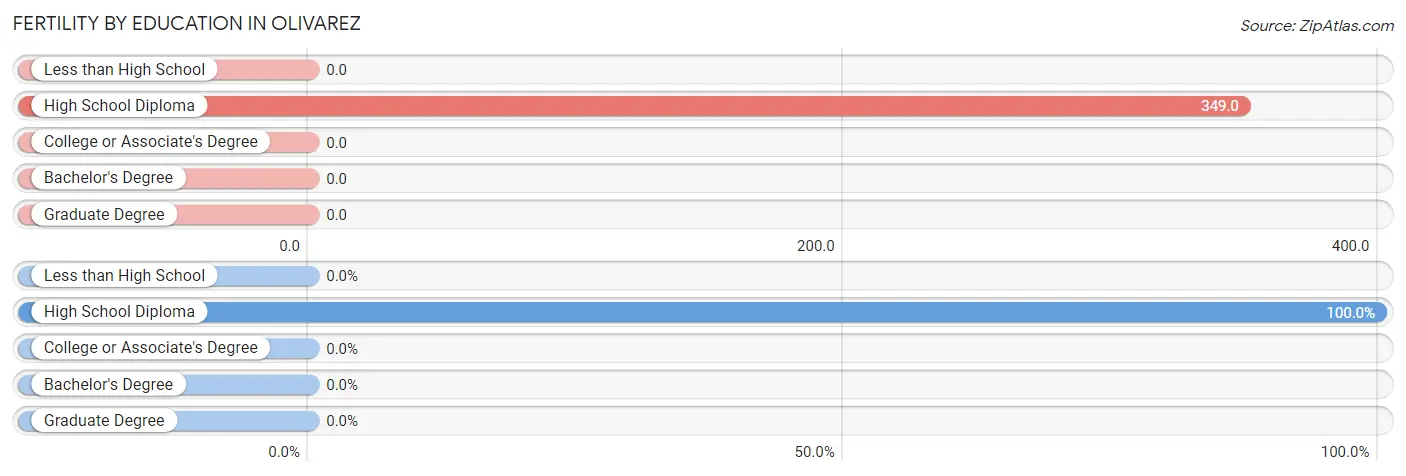
| Educational Attainment | Women with Births | Births / 1,000 Women |
| Less than High School | 0 (0.0%) | 0.0 |
| High School Diploma | 87 (100.0%) | 349.0 |
| College or Associate's Degree | 0 (0.0%) | 0.0 |
| Bachelor's Degree | 0 (0.0%) | 0.0 |
| Graduate Degree | 0 (0.0%) | 0.0 |
| Total | 87 (100.0%) | 74.0 |
Fertility by Education by Marriage Status in Olivarez
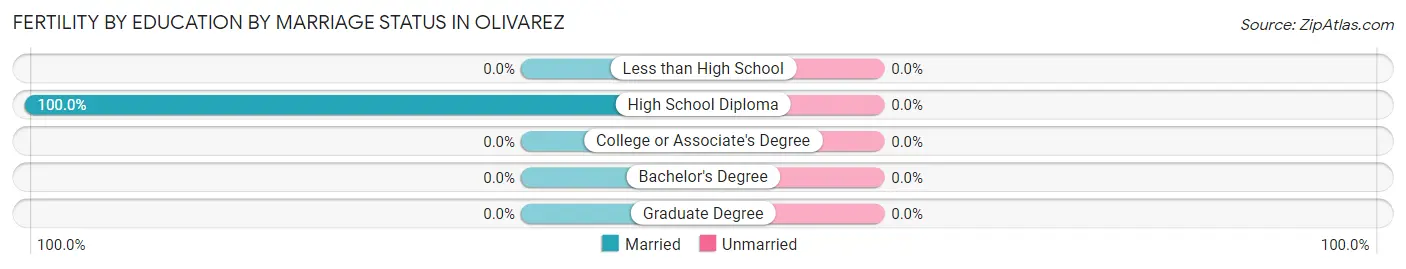
| Educational Attainment | Married | Unmarried |
| Less than High School | 0 (0.0%) | 0 (0.0%) |
| High School Diploma | 87 (100.0%) | 0 (0.0%) |
| College or Associate's Degree | 0 (0.0%) | 0 (0.0%) |
| Bachelor's Degree | 0 (0.0%) | 0 (0.0%) |
| Graduate Degree | 0 (0.0%) | 0 (0.0%) |
| Total | 87 (100.0%) | 0 (0.0%) |
Employment Characteristics in Olivarez
Employment by Class of Employer in Olivarez
Among the 1,716 employed individuals in Olivarez, private company employees (848 | 49.4%), self-employed (not incorporated) (322 | 18.8%), and local government employees (269 | 15.7%) make up the most common classes of employment.
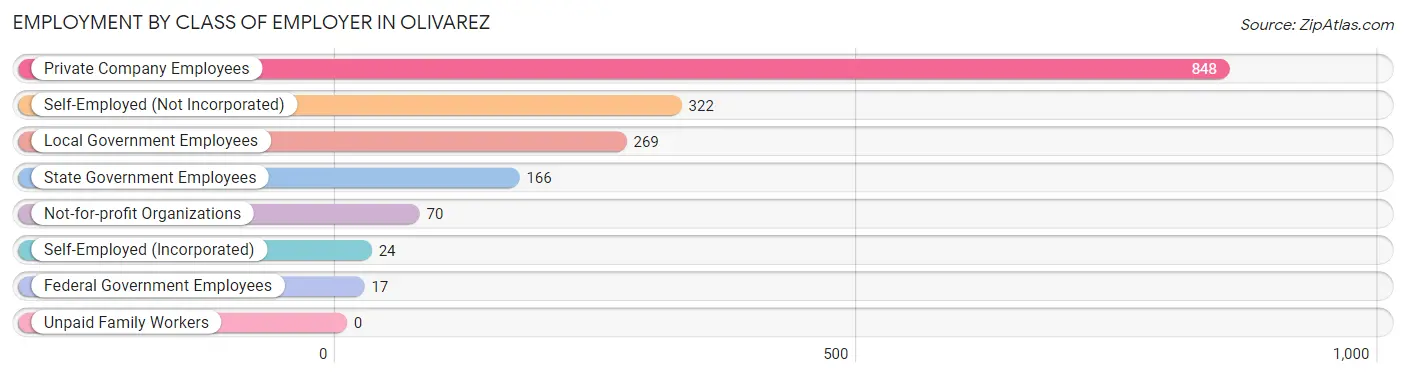
| Employer Class | # Employees | % Employees |
| Private Company Employees | 848 | 49.4% |
| Self-Employed (Incorporated) | 24 | 1.4% |
| Self-Employed (Not Incorporated) | 322 | 18.8% |
| Not-for-profit Organizations | 70 | 4.1% |
| Local Government Employees | 269 | 15.7% |
| State Government Employees | 166 | 9.7% |
| Federal Government Employees | 17 | 1.0% |
| Unpaid Family Workers | 0 | 0.0% |
| Total | 1,716 | 100.0% |
Employment Status by Age in Olivarez
According to the labor force statistics for Olivarez, out of the total population over 16 years of age (3,382), 53.3% or 1,803 individuals are in the labor force, with 3.7% or 67 of them unemployed. The age group with the highest labor force participation rate is 55 to 59 years, with 81.2% or 181 individuals in the labor force. Within the labor force, the 25 to 29 years age range has the highest percentage of unemployed individuals, with 37.8% or 37 of them being unemployed.
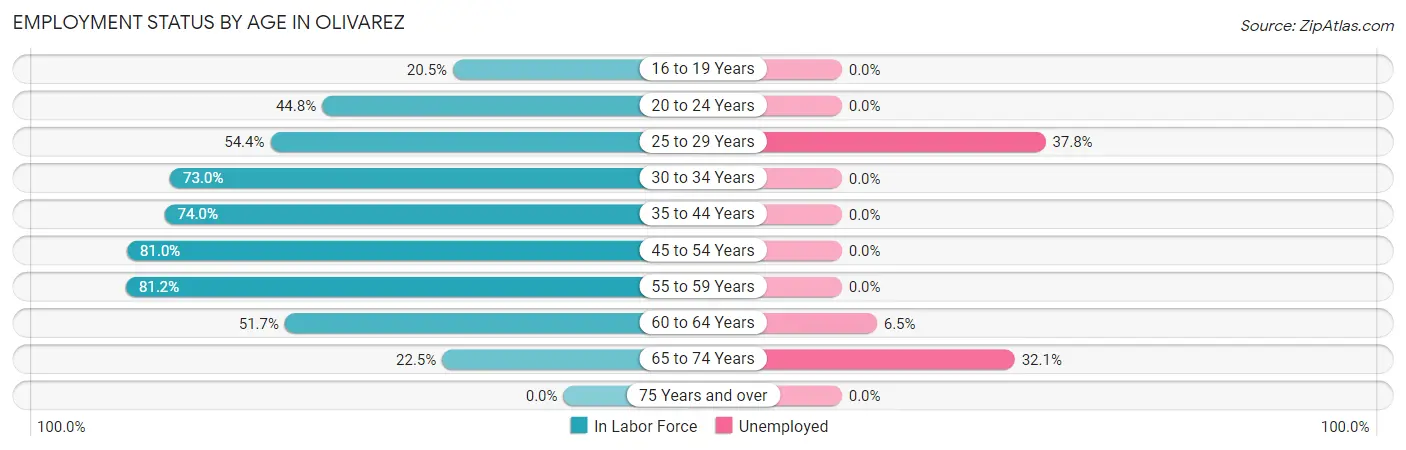
| Age Bracket | In Labor Force | Unemployed |
| 16 to 19 Years | 54 (20.5%) | 0 (0.0%) |
| 20 to 24 Years | 185 (44.8%) | 0 (0.0%) |
| 25 to 29 Years | 98 (54.4%) | 37 (37.8%) |
| 30 to 34 Years | 316 (73.0%) | 0 (0.0%) |
| 35 to 44 Years | 393 (74.0%) | 0 (0.0%) |
| 45 to 54 Years | 422 (81.0%) | 0 (0.0%) |
| 55 to 59 Years | 181 (81.2%) | 0 (0.0%) |
| 60 to 64 Years | 77 (51.7%) | 5 (6.5%) |
| 65 to 74 Years | 78 (22.5%) | 25 (32.1%) |
| 75 Years and over | 0 (0.0%) | 0 (0.0%) |
| Total | 1,803 (53.3%) | 67 (3.7%) |
Employment Status by Educational Attainment in Olivarez
According to labor force statistics for Olivarez, 73.0% of individuals (1,487) out of the total population between 25 and 64 years of age (2,037) are in the labor force, with 2.8% or 42 of them being unemployed. The group with the highest labor force participation rate are those with the educational attainment of bachelor's degree or higher, with 83.3% or 155 individuals in the labor force. Within the labor force, individuals with college / associate degree education have the highest percentage of unemployment, with 10.0% or 42 of them being unemployed.
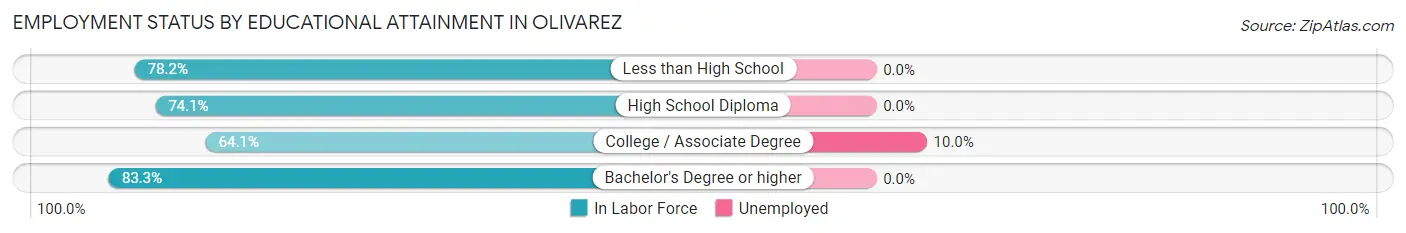
| Educational Attainment | In Labor Force | Unemployed |
| Less than High School | 498 (78.2%) | 0 (0.0%) |
| High School Diploma | 413 (74.1%) | 0 (0.0%) |
| College / Associate Degree | 421 (64.1%) | 66 (10.0%) |
| Bachelor's Degree or higher | 155 (83.3%) | 0 (0.0%) |
| Total | 1,487 (73.0%) | 57 (2.8%) |
Employment Occupations by Sex in Olivarez
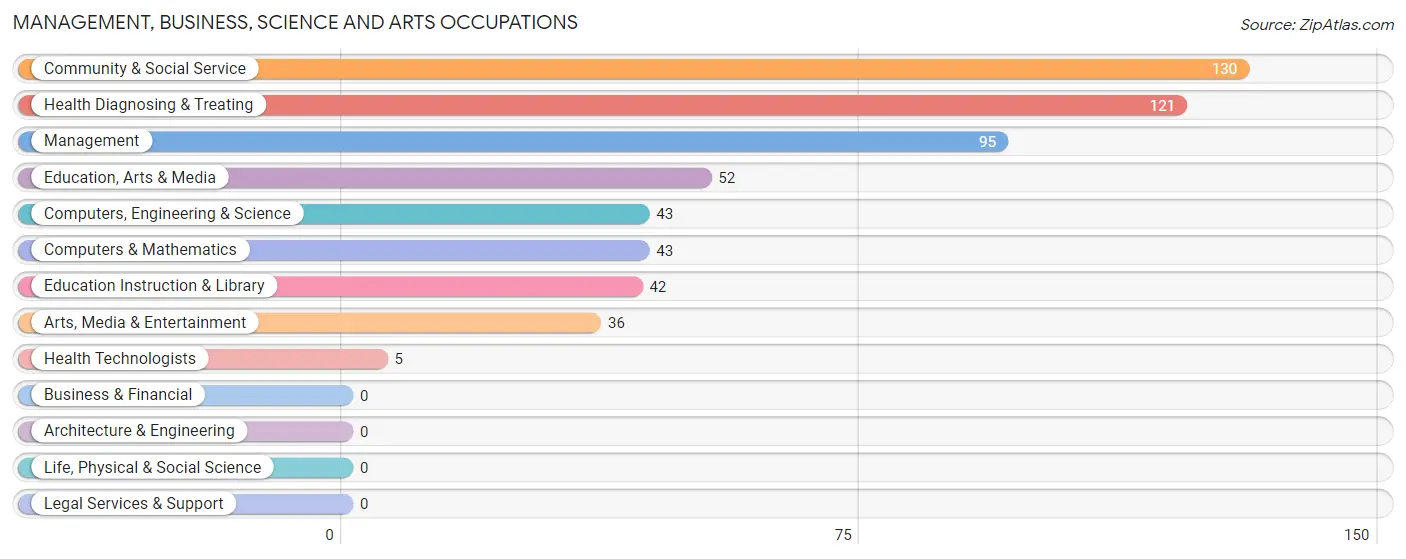
Management, Business, Science and Arts Occupations
The most common Management, Business, Science and Arts occupations in Olivarez are Community & Social Service (130 | 7.5%), Health Diagnosing & Treating (121 | 7.0%), Management (95 | 5.5%), Education, Arts & Media (52 | 3.0%), and Computers, Engineering & Science (43 | 2.5%).
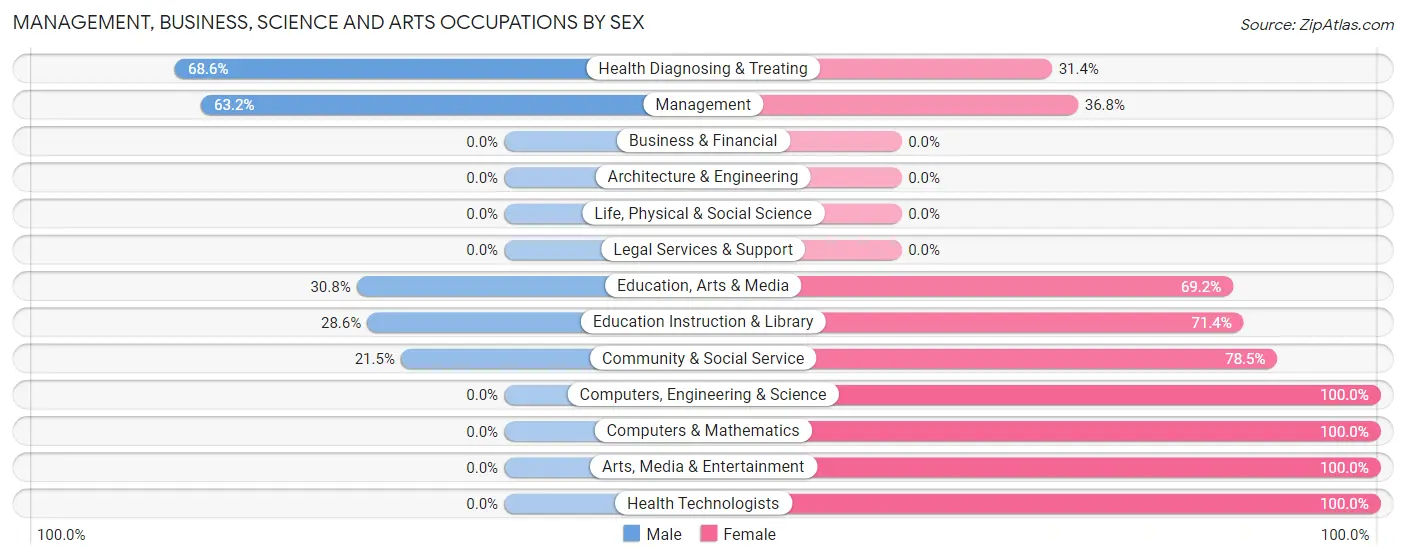
Management, Business, Science and Arts Occupations by Sex
Within the Management, Business, Science and Arts occupations in Olivarez, the most male-oriented occupations are Health Diagnosing & Treating (68.6%), Management (63.2%), and Education, Arts & Media (30.8%), while the most female-oriented occupations are Computers, Engineering & Science (100.0%), Computers & Mathematics (100.0%), and Arts, Media & Entertainment (100.0%).
| Occupation | Male | Female |
| Management | 60 (63.2%) | 35 (36.8%) |
| Business & Financial | 0 (0.0%) | 0 (0.0%) |
| Computers, Engineering & Science | 0 (0.0%) | 43 (100.0%) |
| Computers & Mathematics | 0 (0.0%) | 43 (100.0%) |
| Architecture & Engineering | 0 (0.0%) | 0 (0.0%) |
| Life, Physical & Social Science | 0 (0.0%) | 0 (0.0%) |
| Community & Social Service | 28 (21.5%) | 102 (78.5%) |
| Education, Arts & Media | 16 (30.8%) | 36 (69.2%) |
| Legal Services & Support | 0 (0.0%) | 0 (0.0%) |
| Education Instruction & Library | 12 (28.6%) | 30 (71.4%) |
| Arts, Media & Entertainment | 0 (0.0%) | 36 (100.0%) |
| Health Diagnosing & Treating | 83 (68.6%) | 38 (31.4%) |
| Health Technologists | 0 (0.0%) | 5 (100.0%) |
| Total (Category) | 171 (44.0%) | 218 (56.0%) |
| Total (Overall) | 854 (49.2%) | 883 (50.8%) |
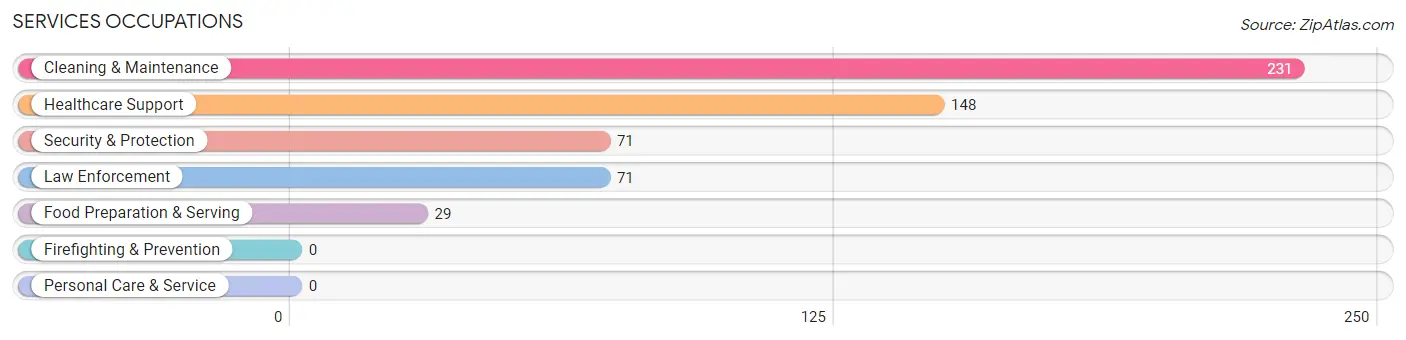
Services Occupations
The most common Services occupations in Olivarez are Cleaning & Maintenance (231 | 13.3%), Healthcare Support (148 | 8.5%), Security & Protection (71 | 4.1%), Law Enforcement (71 | 4.1%), and Food Preparation & Serving (29 | 1.7%).
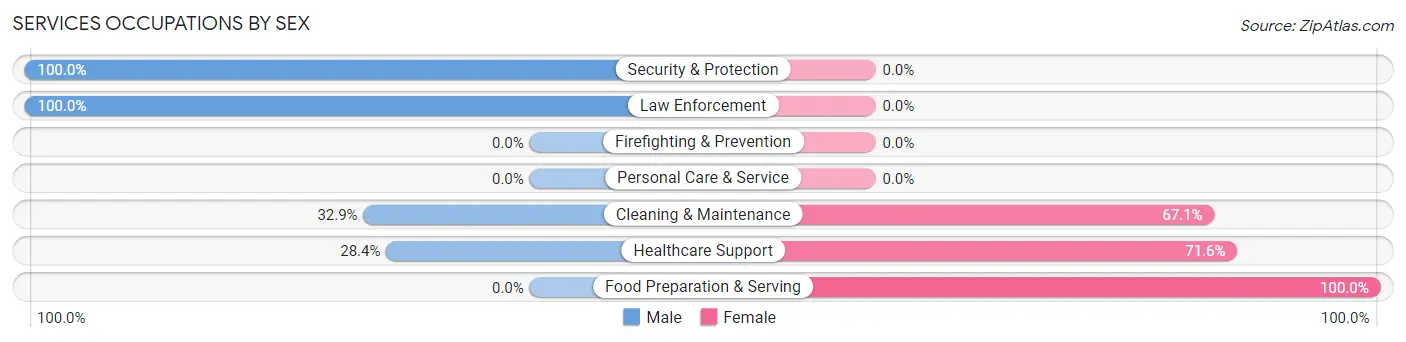
Services Occupations by Sex
Within the Services occupations in Olivarez, the most male-oriented occupations are Security & Protection (100.0%), Law Enforcement (100.0%), and Cleaning & Maintenance (32.9%), while the most female-oriented occupations are Food Preparation & Serving (100.0%), Healthcare Support (71.6%), and Cleaning & Maintenance (67.1%).
| Occupation | Male | Female |
| Healthcare Support | 42 (28.4%) | 106 (71.6%) |
| Security & Protection | 71 (100.0%) | 0 (0.0%) |
| Firefighting & Prevention | 0 (0.0%) | 0 (0.0%) |
| Law Enforcement | 71 (100.0%) | 0 (0.0%) |
| Food Preparation & Serving | 0 (0.0%) | 29 (100.0%) |
| Cleaning & Maintenance | 76 (32.9%) | 155 (67.1%) |
| Personal Care & Service | 0 (0.0%) | 0 (0.0%) |
| Total (Category) | 189 (39.5%) | 290 (60.5%) |
| Total (Overall) | 854 (49.2%) | 883 (50.8%) |
Sales and Office Occupations
The most common Sales and Office occupations in Olivarez are Sales & Related (167 | 9.6%), and Office & Administration (90 | 5.2%).
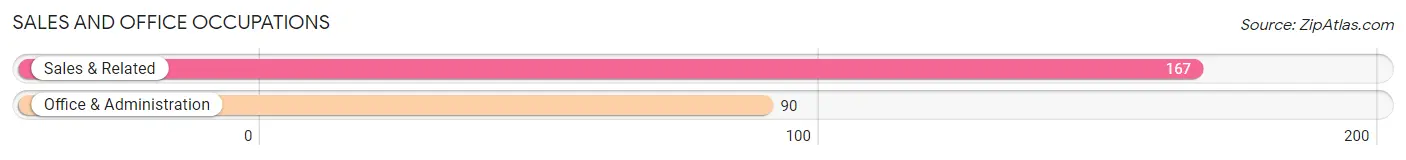
Sales and Office Occupations by Sex
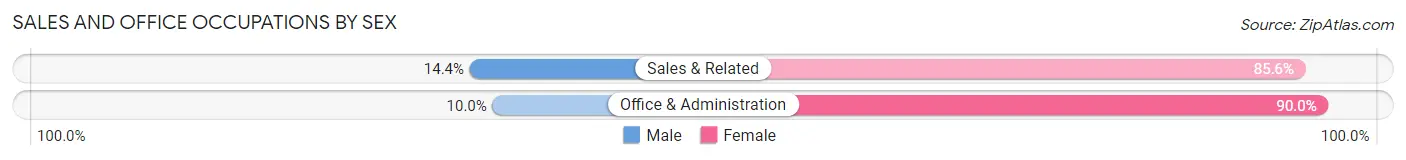
| Occupation | Male | Female |
| Sales & Related | 24 (14.4%) | 143 (85.6%) |
| Office & Administration | 9 (10.0%) | 81 (90.0%) |
| Total (Category) | 33 (12.8%) | 224 (87.2%) |
| Total (Overall) | 854 (49.2%) | 883 (50.8%) |
Natural Resources, Construction and Maintenance Occupations
The most common Natural Resources, Construction and Maintenance occupations in Olivarez are Construction & Extraction (282 | 16.2%), and Installation, Maintenance & Repair (26 | 1.5%).
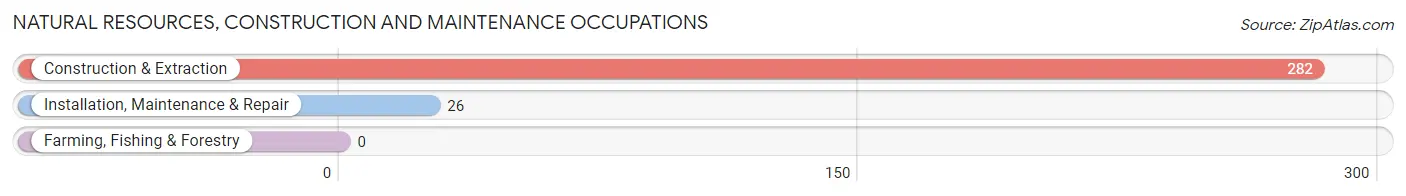
Natural Resources, Construction and Maintenance Occupations by Sex
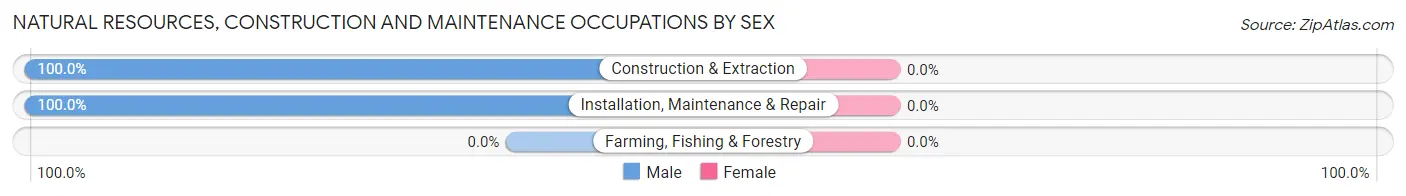
| Occupation | Male | Female |
| Farming, Fishing & Forestry | 0 (0.0%) | 0 (0.0%) |
| Construction & Extraction | 282 (100.0%) | 0 (0.0%) |
| Installation, Maintenance & Repair | 26 (100.0%) | 0 (0.0%) |
| Total (Category) | 308 (100.0%) | 0 (0.0%) |
| Total (Overall) | 854 (49.2%) | 883 (50.8%) |
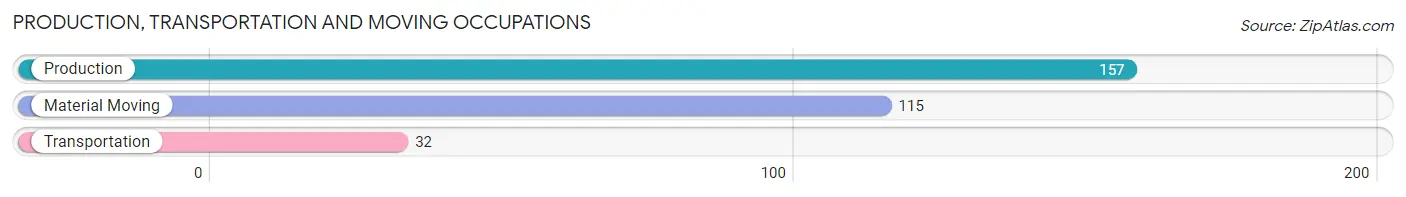
Production, Transportation and Moving Occupations
The most common Production, Transportation and Moving occupations in Olivarez are Production (157 | 9.0%), Material Moving (115 | 6.6%), and Transportation (32 | 1.8%).
Production, Transportation and Moving Occupations by Sex
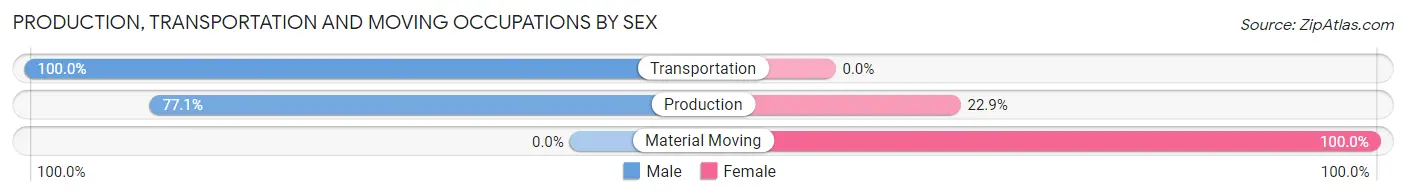
| Occupation | Male | Female |
| Production | 121 (77.1%) | 36 (22.9%) |
| Transportation | 32 (100.0%) | 0 (0.0%) |
| Material Moving | 0 (0.0%) | 115 (100.0%) |
| Total (Category) | 153 (50.3%) | 151 (49.7%) |
| Total (Overall) | 854 (49.2%) | 883 (50.8%) |
Employment Industries by Sex in Olivarez
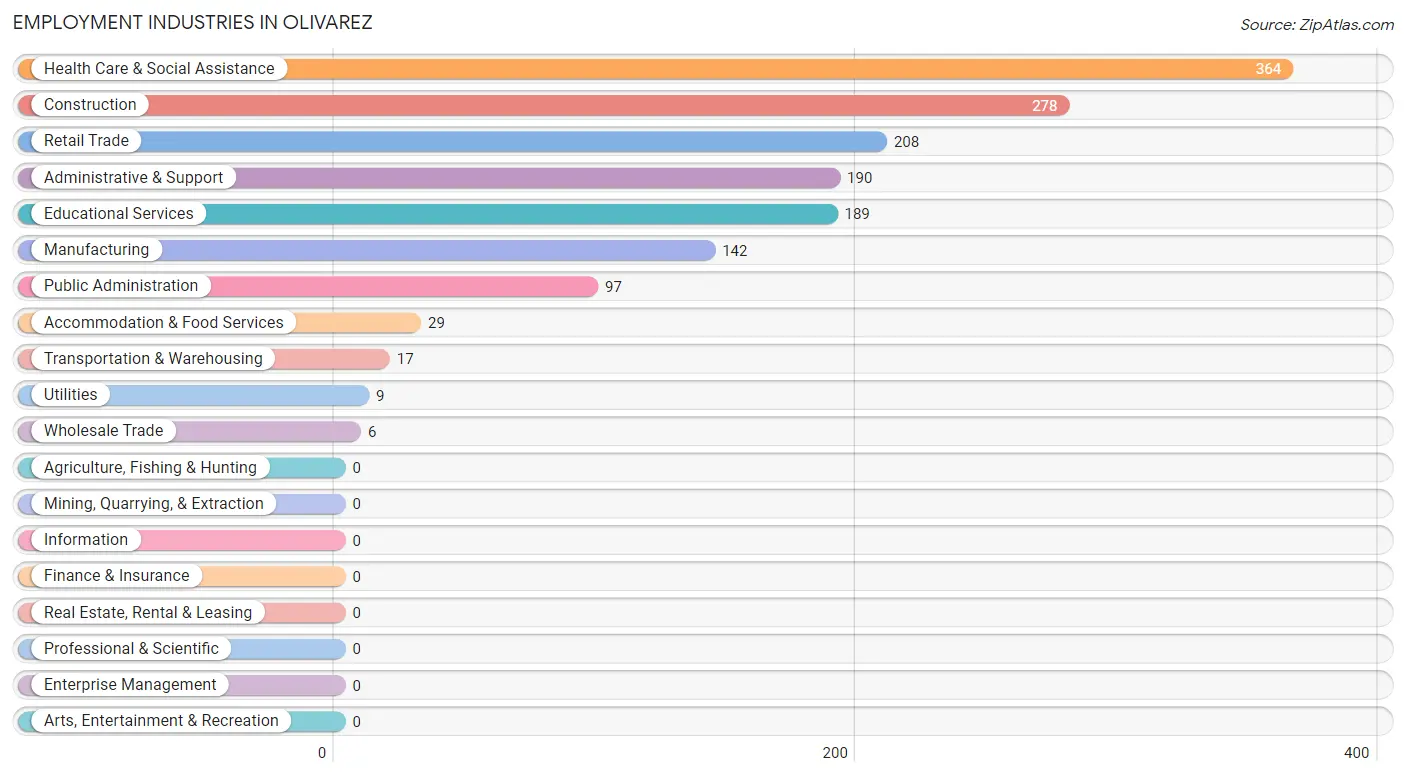
Employment Industries in Olivarez
The major employment industries in Olivarez include Health Care & Social Assistance (364 | 21.0%), Construction (278 | 16.0%), Retail Trade (208 | 12.0%), Administrative & Support (190 | 10.9%), and Educational Services (189 | 10.9%).
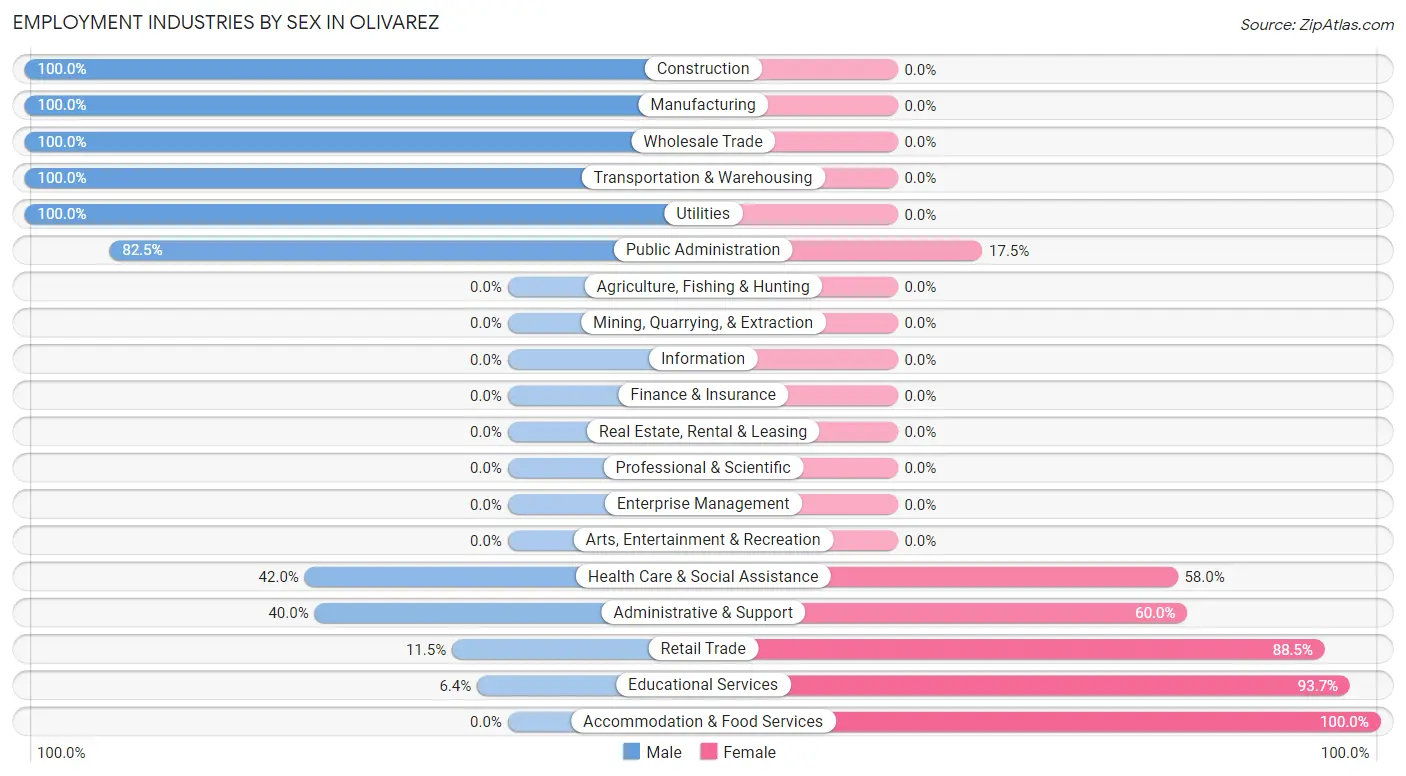
Employment Industries by Sex in Olivarez
The Olivarez industries that see more men than women are Construction (100.0%), Manufacturing (100.0%), and Wholesale Trade (100.0%), whereas the industries that tend to have a higher number of women are Accommodation & Food Services (100.0%), Educational Services (93.6%), and Retail Trade (88.5%).
| Industry | Male | Female |
| Agriculture, Fishing & Hunting | 0 (0.0%) | 0 (0.0%) |
| Mining, Quarrying, & Extraction | 0 (0.0%) | 0 (0.0%) |
| Construction | 278 (100.0%) | 0 (0.0%) |
| Manufacturing | 142 (100.0%) | 0 (0.0%) |
| Wholesale Trade | 6 (100.0%) | 0 (0.0%) |
| Retail Trade | 24 (11.5%) | 184 (88.5%) |
| Transportation & Warehousing | 17 (100.0%) | 0 (0.0%) |
| Utilities | 9 (100.0%) | 0 (0.0%) |
| Information | 0 (0.0%) | 0 (0.0%) |
| Finance & Insurance | 0 (0.0%) | 0 (0.0%) |
| Real Estate, Rental & Leasing | 0 (0.0%) | 0 (0.0%) |
| Professional & Scientific | 0 (0.0%) | 0 (0.0%) |
| Enterprise Management | 0 (0.0%) | 0 (0.0%) |
| Administrative & Support | 76 (40.0%) | 114 (60.0%) |
| Educational Services | 12 (6.4%) | 177 (93.6%) |
| Health Care & Social Assistance | 153 (42.0%) | 211 (58.0%) |
| Arts, Entertainment & Recreation | 0 (0.0%) | 0 (0.0%) |
| Accommodation & Food Services | 0 (0.0%) | 29 (100.0%) |
| Public Administration | 80 (82.5%) | 17 (17.5%) |
| Total | 854 (49.2%) | 883 (50.8%) |
Education in Olivarez
School Enrollment in Olivarez
The most common levels of schooling among the 2,556 students in Olivarez are elementary school (824 | 32.2%), middle school (533 | 20.8%), and high school (387 | 15.1%).
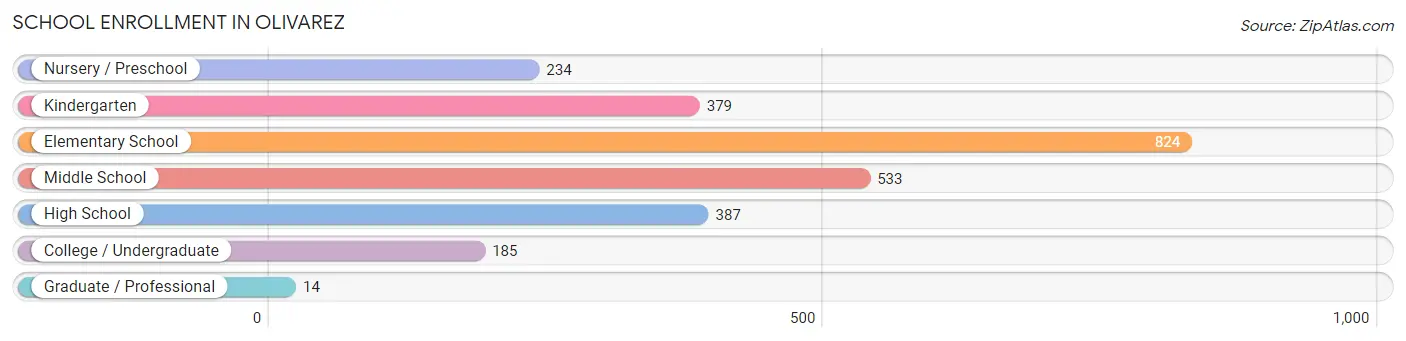
| School Level | # Students | % Students |
| Nursery / Preschool | 234 | 9.1% |
| Kindergarten | 379 | 14.8% |
| Elementary School | 824 | 32.2% |
| Middle School | 533 | 20.8% |
| High School | 387 | 15.1% |
| College / Undergraduate | 185 | 7.2% |
| Graduate / Professional | 14 | 0.5% |
| Total | 2,556 | 100.0% |
School Enrollment by Age by Funding Source in Olivarez
Out of a total of 2,556 students who are enrolled in schools in Olivarez, 54 (2.1%) attend a private institution, while the remaining 2,502 (97.9%) are enrolled in public schools. The age group of 20 to 24 year olds has the highest likelihood of being enrolled in private schools, with 48 (58.5% in the age bracket) enrolled. Conversely, the age group of 3 to 4 year olds has the lowest likelihood of being enrolled in a private school, with 360 (100.0% in the age bracket) attending a public institution.
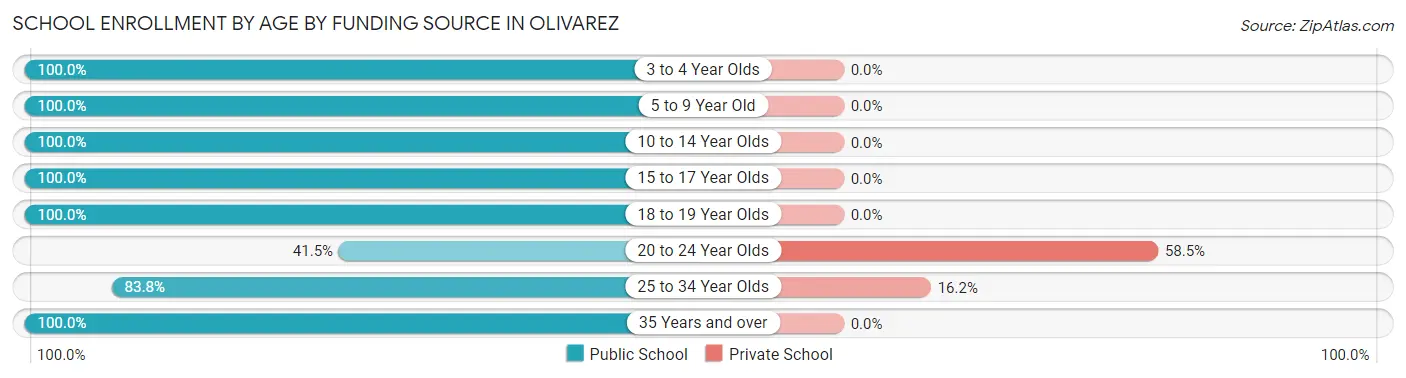
| Age Bracket | Public School | Private School |
| 3 to 4 Year Olds | 360 (100.0%) | 0 (0.0%) |
| 5 to 9 Year Old | 903 (100.0%) | 0 (0.0%) |
| 10 to 14 Year Olds | 806 (100.0%) | 0 (0.0%) |
| 15 to 17 Year Olds | 122 (100.0%) | 0 (0.0%) |
| 18 to 19 Year Olds | 192 (100.0%) | 0 (0.0%) |
| 20 to 24 Year Olds | 34 (41.5%) | 48 (58.5%) |
| 25 to 34 Year Olds | 31 (83.8%) | 6 (16.2%) |
| 35 Years and over | 54 (100.0%) | 0 (0.0%) |
| Total | 2,502 (97.9%) | 54 (2.1%) |
Educational Attainment by Field of Study in Olivarez
Education (91 | 34.1%), literature & languages (72 | 27.0%), business (69 | 25.8%), liberal arts & history (16 | 6.0%), and multidisciplinary studies (14 | 5.2%) are the most common fields of study among 267 individuals in Olivarez who have obtained a bachelor's degree or higher.
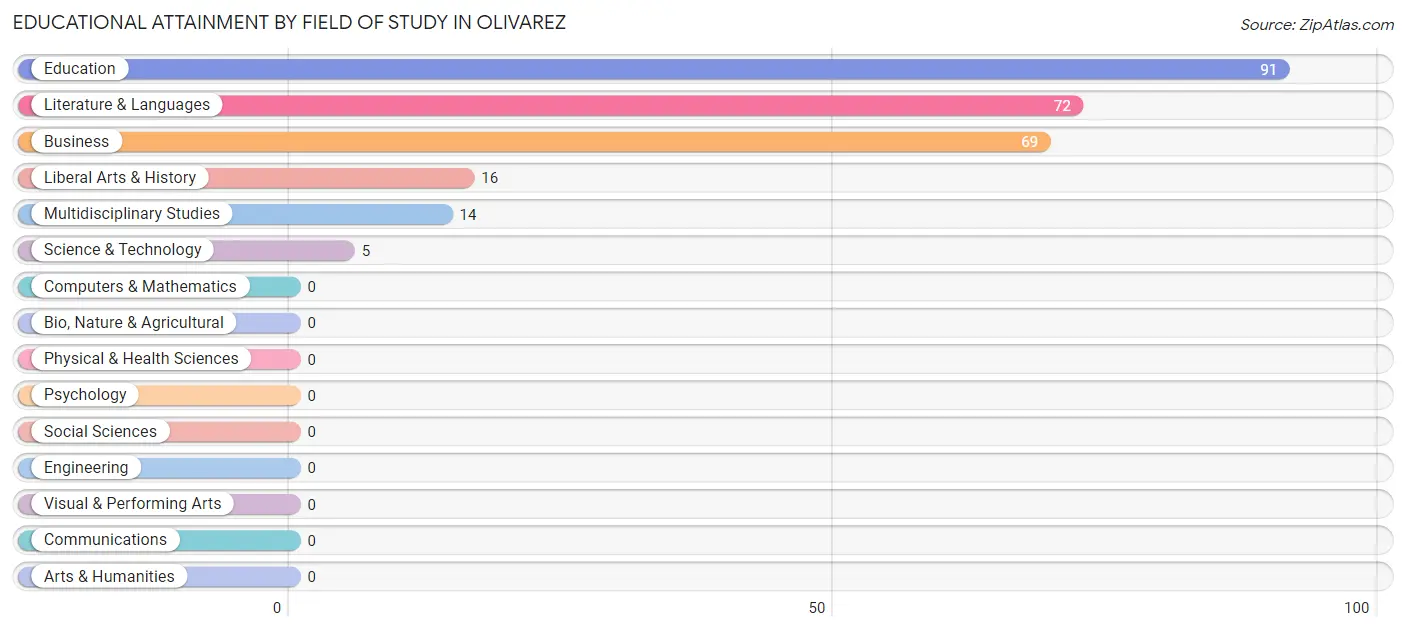
| Field of Study | # Graduates | % Graduates |
| Computers & Mathematics | 0 | 0.0% |
| Bio, Nature & Agricultural | 0 | 0.0% |
| Physical & Health Sciences | 0 | 0.0% |
| Psychology | 0 | 0.0% |
| Social Sciences | 0 | 0.0% |
| Engineering | 0 | 0.0% |
| Multidisciplinary Studies | 14 | 5.2% |
| Science & Technology | 5 | 1.9% |
| Business | 69 | 25.8% |
| Education | 91 | 34.1% |
| Literature & Languages | 72 | 27.0% |
| Liberal Arts & History | 16 | 6.0% |
| Visual & Performing Arts | 0 | 0.0% |
| Communications | 0 | 0.0% |
| Arts & Humanities | 0 | 0.0% |
| Total | 267 | 100.0% |
Transportation & Commute in Olivarez
Vehicle Availability by Sex in Olivarez
The most prevalent vehicle ownership categories in Olivarez are males with 4 vehicles (282, accounting for 33.9%) and females with 4 vehicles (134, making up 31.9%).
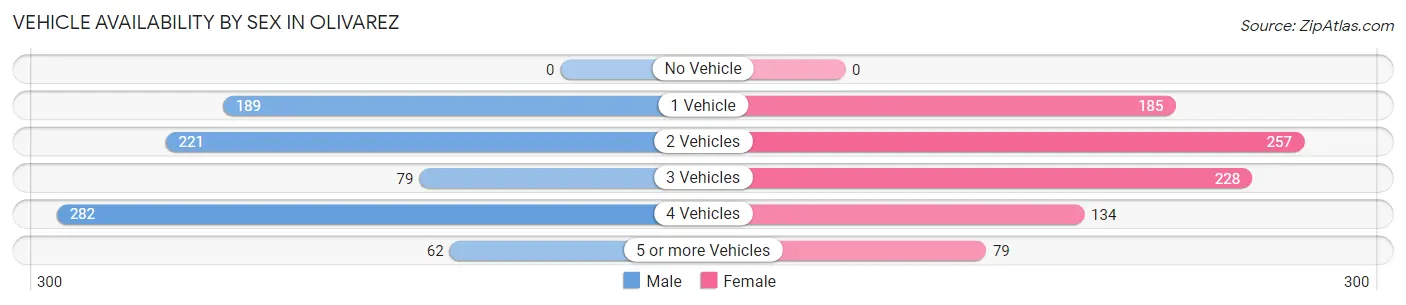
| Vehicles Available | Male | Female |
| No Vehicle | 0 (0.0%) | 0 (0.0%) |
| 1 Vehicle | 189 (22.7%) | 185 (20.9%) |
| 2 Vehicles | 221 (26.5%) | 257 (29.1%) |
| 3 Vehicles | 79 (9.5%) | 228 (25.8%) |
| 4 Vehicles | 282 (33.9%) | 134 (15.2%) |
| 5 or more Vehicles | 62 (7.4%) | 79 (8.9%) |
| Total | 833 (100.0%) | 883 (100.0%) |
Commute Time in Olivarez
The most frequently occuring commute durations in Olivarez are 15 to 19 minutes (364 commuters, 23.3%), 45 to 59 minutes (274 commuters, 17.5%), and 10 to 14 minutes (148 commuters, 9.5%).
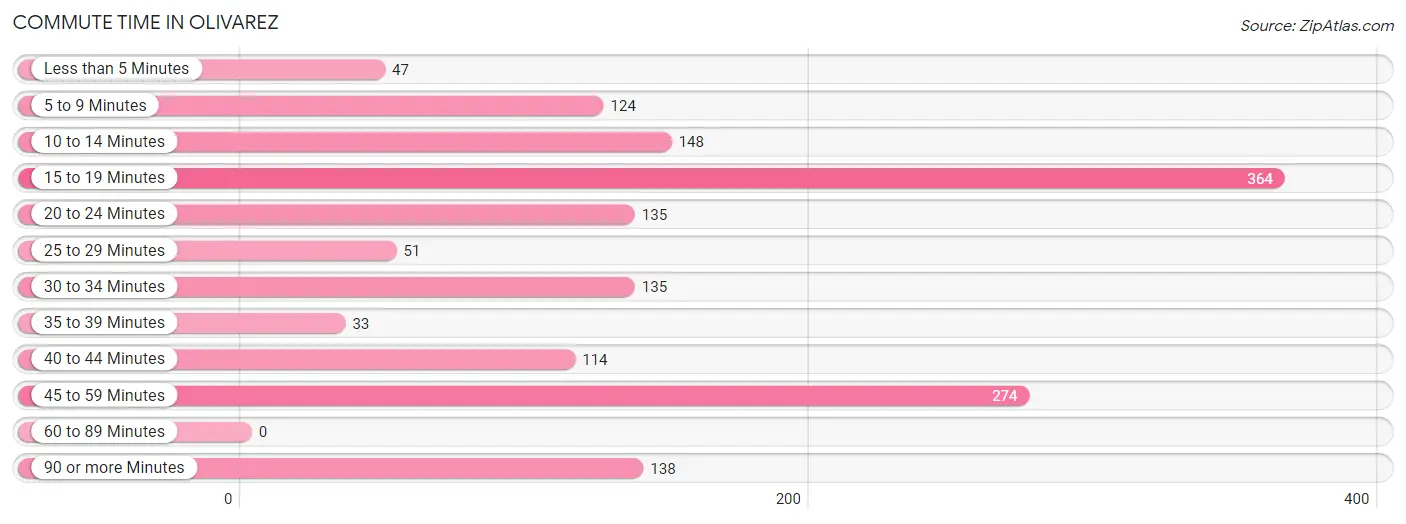
| Commute Time | # Commuters | % Commuters |
| Less than 5 Minutes | 47 | 3.0% |
| 5 to 9 Minutes | 124 | 7.9% |
| 10 to 14 Minutes | 148 | 9.5% |
| 15 to 19 Minutes | 364 | 23.3% |
| 20 to 24 Minutes | 135 | 8.6% |
| 25 to 29 Minutes | 51 | 3.3% |
| 30 to 34 Minutes | 135 | 8.6% |
| 35 to 39 Minutes | 33 | 2.1% |
| 40 to 44 Minutes | 114 | 7.3% |
| 45 to 59 Minutes | 274 | 17.5% |
| 60 to 89 Minutes | 0 | 0.0% |
| 90 or more Minutes | 138 | 8.8% |
Commute Time by Sex in Olivarez
The most common commute times in Olivarez are 15 to 19 minutes (216 commuters, 27.7%) for males and 15 to 19 minutes (148 commuters, 18.9%) for females.
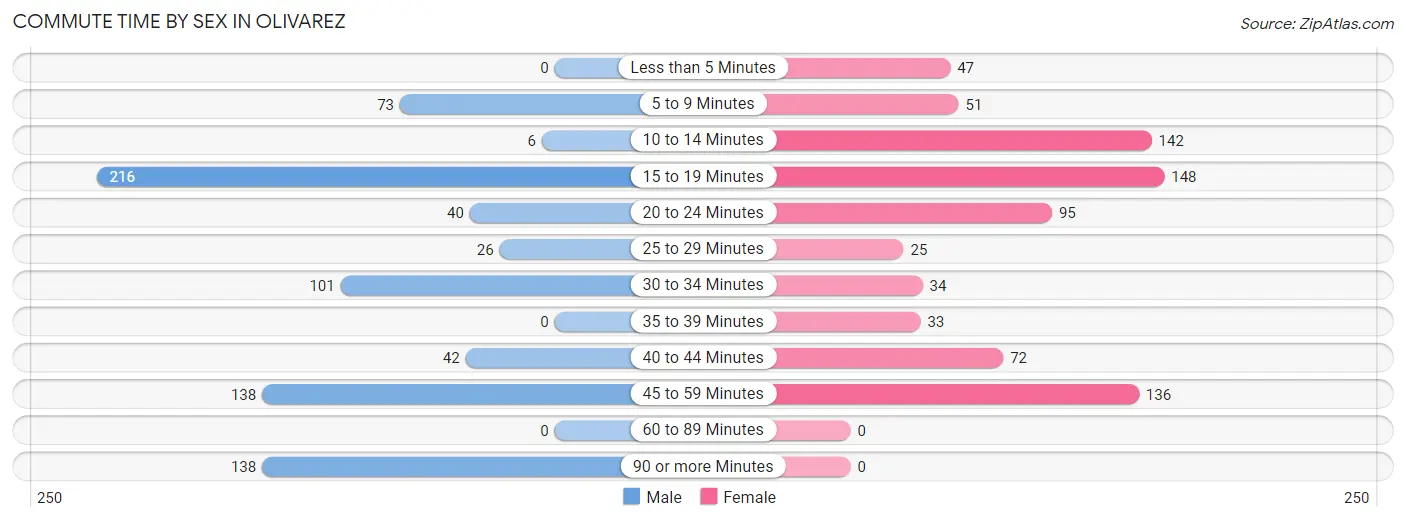
| Commute Time | Male | Female |
| Less than 5 Minutes | 0 (0.0%) | 47 (6.0%) |
| 5 to 9 Minutes | 73 (9.4%) | 51 (6.5%) |
| 10 to 14 Minutes | 6 (0.8%) | 142 (18.1%) |
| 15 to 19 Minutes | 216 (27.7%) | 148 (18.9%) |
| 20 to 24 Minutes | 40 (5.1%) | 95 (12.1%) |
| 25 to 29 Minutes | 26 (3.3%) | 25 (3.2%) |
| 30 to 34 Minutes | 101 (13.0%) | 34 (4.3%) |
| 35 to 39 Minutes | 0 (0.0%) | 33 (4.2%) |
| 40 to 44 Minutes | 42 (5.4%) | 72 (9.2%) |
| 45 to 59 Minutes | 138 (17.7%) | 136 (17.4%) |
| 60 to 89 Minutes | 0 (0.0%) | 0 (0.0%) |
| 90 or more Minutes | 138 (17.7%) | 0 (0.0%) |
Time of Departure to Work by Sex in Olivarez
The most frequent times of departure to work in Olivarez are 7:00 AM to 7:29 AM (225, 28.8%) for males and 7:00 AM to 7:29 AM (196, 25.0%) for females.
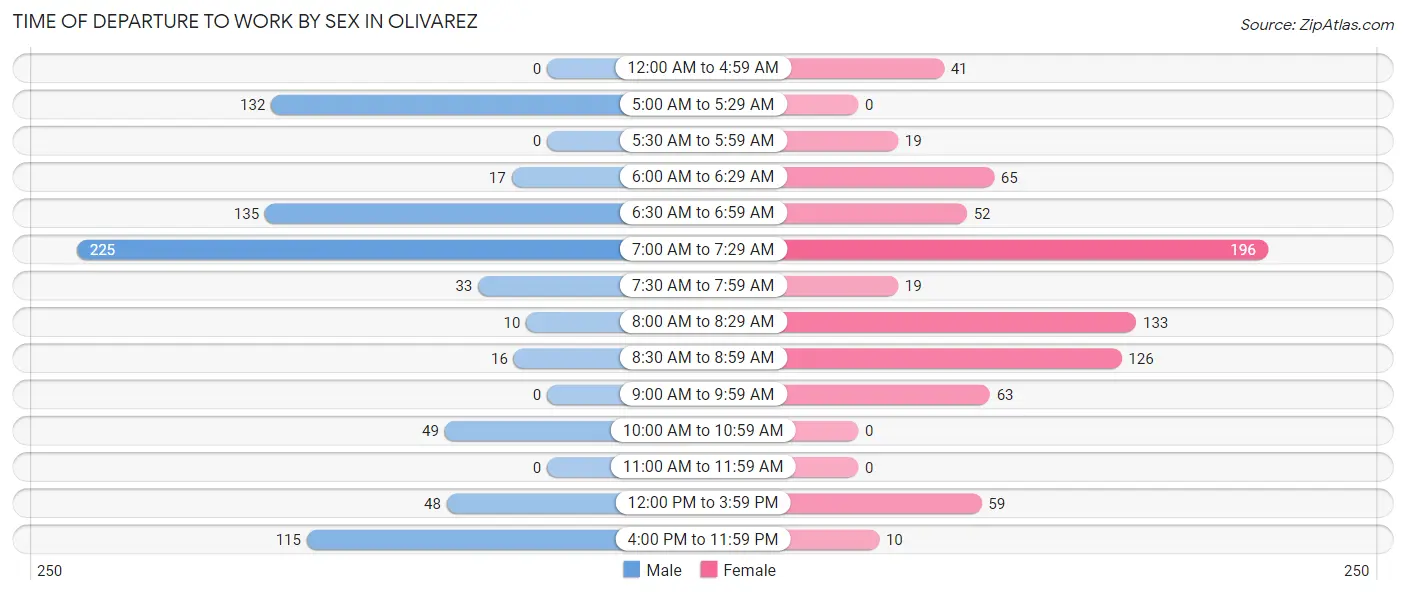
| Time of Departure | Male | Female |
| 12:00 AM to 4:59 AM | 0 (0.0%) | 41 (5.2%) |
| 5:00 AM to 5:29 AM | 132 (16.9%) | 0 (0.0%) |
| 5:30 AM to 5:59 AM | 0 (0.0%) | 19 (2.4%) |
| 6:00 AM to 6:29 AM | 17 (2.2%) | 65 (8.3%) |
| 6:30 AM to 6:59 AM | 135 (17.3%) | 52 (6.6%) |
| 7:00 AM to 7:29 AM | 225 (28.8%) | 196 (25.0%) |
| 7:30 AM to 7:59 AM | 33 (4.2%) | 19 (2.4%) |
| 8:00 AM to 8:29 AM | 10 (1.3%) | 133 (17.0%) |
| 8:30 AM to 8:59 AM | 16 (2.1%) | 126 (16.1%) |
| 9:00 AM to 9:59 AM | 0 (0.0%) | 63 (8.1%) |
| 10:00 AM to 10:59 AM | 49 (6.3%) | 0 (0.0%) |
| 11:00 AM to 11:59 AM | 0 (0.0%) | 0 (0.0%) |
| 12:00 PM to 3:59 PM | 48 (6.1%) | 59 (7.5%) |
| 4:00 PM to 11:59 PM | 115 (14.7%) | 10 (1.3%) |
| Total | 780 (100.0%) | 783 (100.0%) |
Housing Occupancy in Olivarez
Occupancy by Ownership in Olivarez
Of the total 1,235 dwellings in Olivarez, owner-occupied units account for 1,102 (89.2%), while renter-occupied units make up 133 (10.8%).
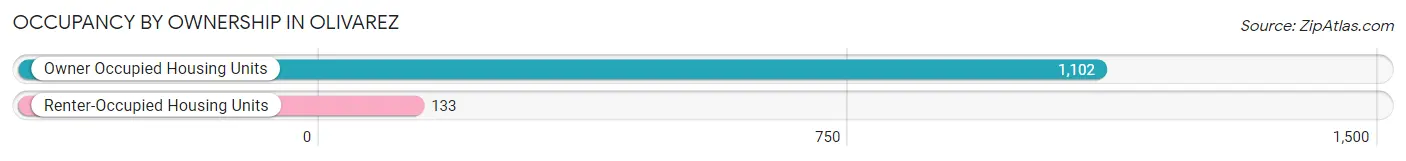
| Occupancy | # Housing Units | % Housing Units |
| Owner Occupied Housing Units | 1,102 | 89.2% |
| Renter-Occupied Housing Units | 133 | 10.8% |
| Total Occupied Housing Units | 1,235 | 100.0% |
Occupancy by Household Size in Olivarez
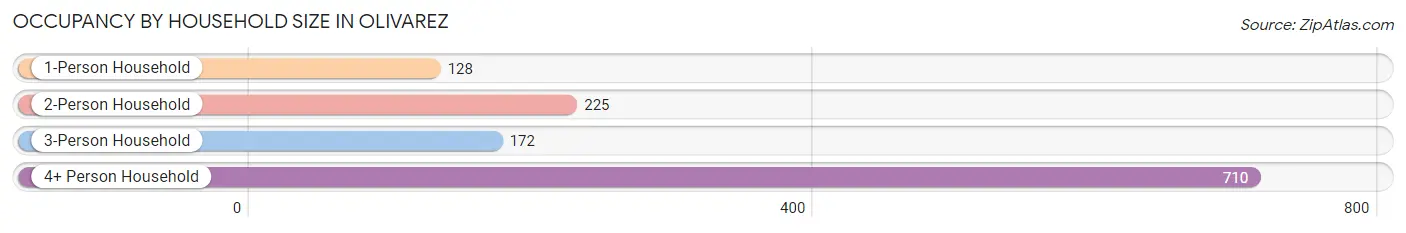
| Household Size | # Housing Units | % Housing Units |
| 1-Person Household | 128 | 10.4% |
| 2-Person Household | 225 | 18.2% |
| 3-Person Household | 172 | 13.9% |
| 4+ Person Household | 710 | 57.5% |
| Total Housing Units | 1,235 | 100.0% |
Occupancy by Ownership by Household Size in Olivarez
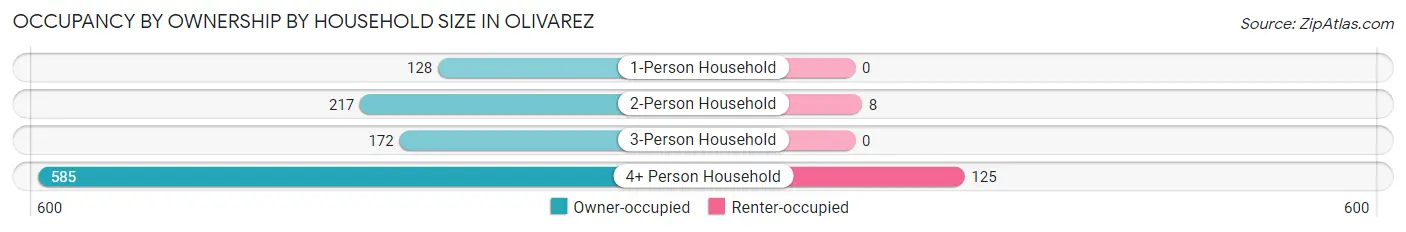
| Household Size | Owner-occupied | Renter-occupied |
| 1-Person Household | 128 (100.0%) | 0 (0.0%) |
| 2-Person Household | 217 (96.4%) | 8 (3.6%) |
| 3-Person Household | 172 (100.0%) | 0 (0.0%) |
| 4+ Person Household | 585 (82.4%) | 125 (17.6%) |
| Total Housing Units | 1,102 (89.2%) | 133 (10.8%) |
Occupancy by Educational Attainment in Olivarez
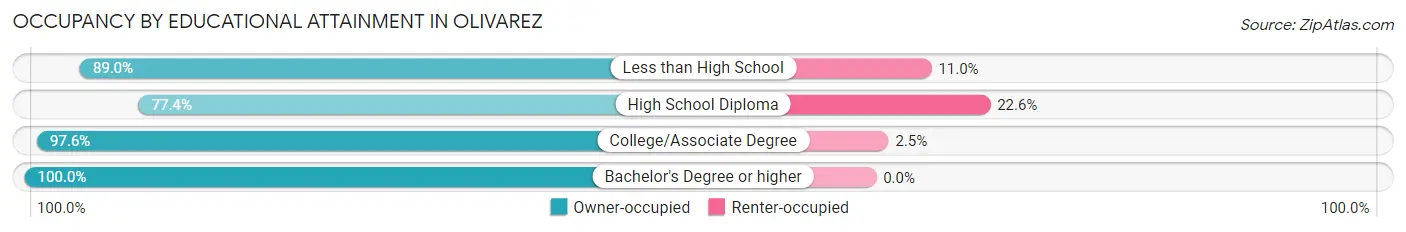
| Household Size | Owner-occupied | Renter-occupied |
| Less than High School | 536 (89.0%) | 66 (11.0%) |
| High School Diploma | 202 (77.4%) | 59 (22.6%) |
| College/Associate Degree | 318 (97.6%) | 8 (2.5%) |
| Bachelor's Degree or higher | 46 (100.0%) | 0 (0.0%) |
Occupancy by Age of Householder in Olivarez
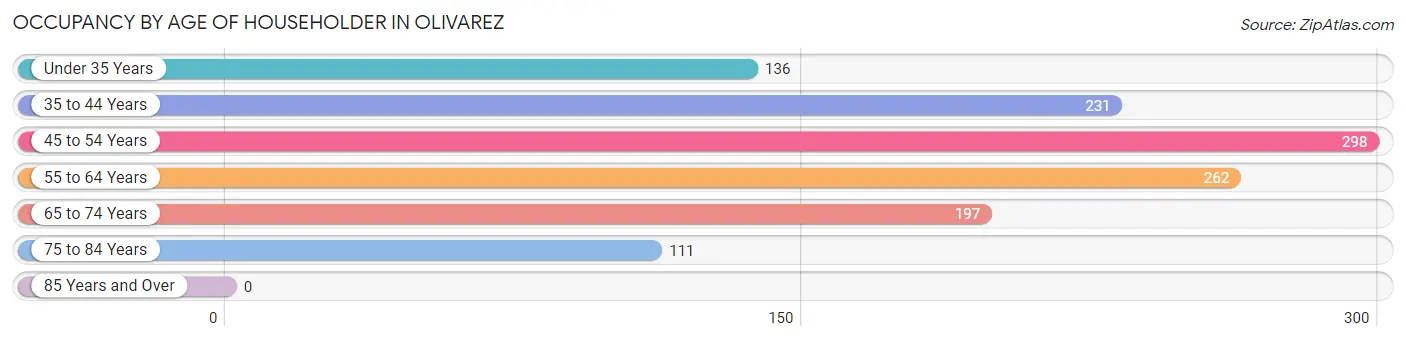
| Age Bracket | # Households | % Households |
| Under 35 Years | 136 | 11.0% |
| 35 to 44 Years | 231 | 18.7% |
| 45 to 54 Years | 298 | 24.1% |
| 55 to 64 Years | 262 | 21.2% |
| 65 to 74 Years | 197 | 16.0% |
| 75 to 84 Years | 111 | 9.0% |
| 85 Years and Over | 0 | 0.0% |
| Total | 1,235 | 100.0% |
Housing Finances in Olivarez
Median Income by Occupancy in Olivarez
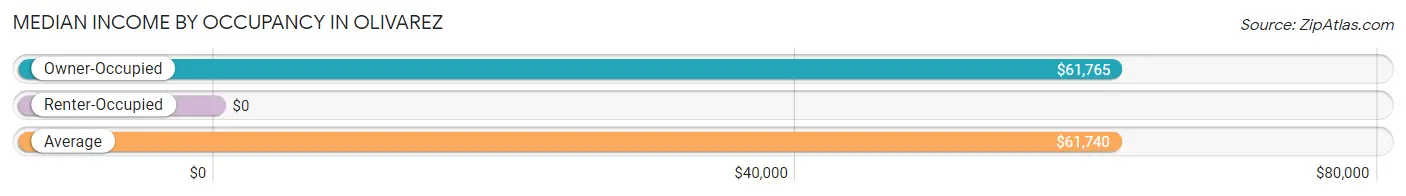
| Occupancy Type | # Households | Median Income |
| Owner-Occupied | 1,102 (89.2%) | $61,765 |
| Renter-Occupied | 133 (10.8%) | $0 |
| Average | 1,235 (100.0%) | $61,740 |
Occupancy by Householder Income Bracket in Olivarez
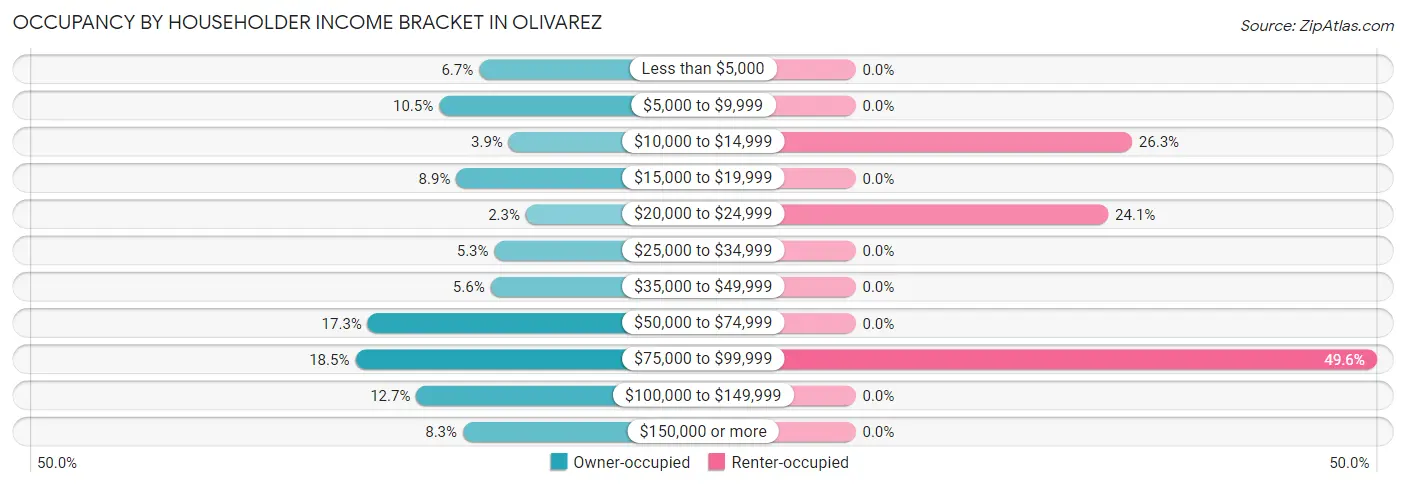
| Income Bracket | Owner-occupied | Renter-occupied |
| Less than $5,000 | 74 (6.7%) | 0 (0.0%) |
| $5,000 to $9,999 | 116 (10.5%) | 0 (0.0%) |
| $10,000 to $14,999 | 43 (3.9%) | 35 (26.3%) |
| $15,000 to $19,999 | 98 (8.9%) | 0 (0.0%) |
| $20,000 to $24,999 | 25 (2.3%) | 32 (24.1%) |
| $25,000 to $34,999 | 58 (5.3%) | 0 (0.0%) |
| $35,000 to $49,999 | 62 (5.6%) | 0 (0.0%) |
| $50,000 to $74,999 | 191 (17.3%) | 0 (0.0%) |
| $75,000 to $99,999 | 204 (18.5%) | 66 (49.6%) |
| $100,000 to $149,999 | 140 (12.7%) | 0 (0.0%) |
| $150,000 or more | 91 (8.3%) | 0 (0.0%) |
| Total | 1,102 (100.0%) | 133 (100.0%) |
Monthly Housing Cost Tiers in Olivarez
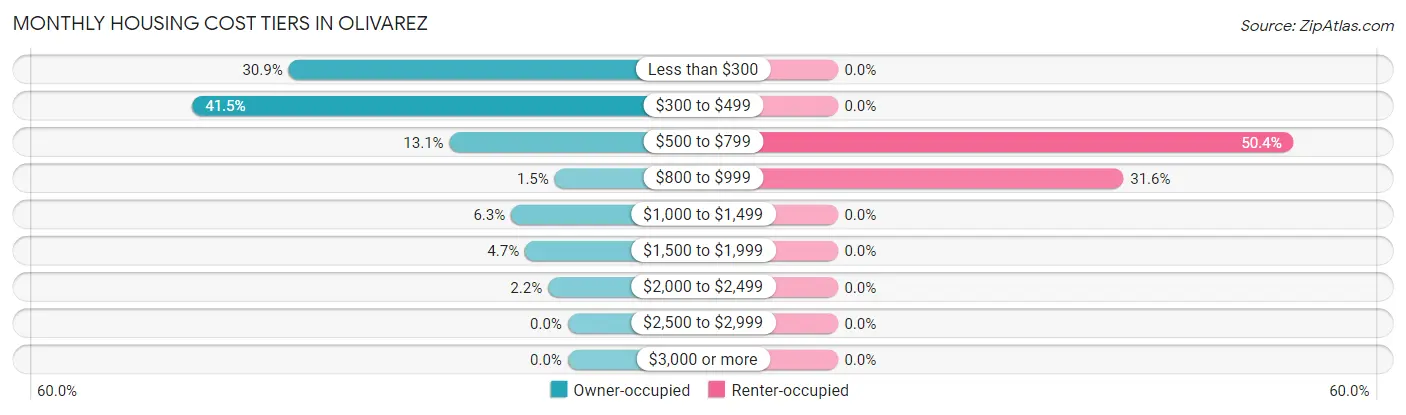
| Monthly Cost | Owner-occupied | Renter-occupied |
| Less than $300 | 340 (30.8%) | 0 (0.0%) |
| $300 to $499 | 457 (41.5%) | 0 (0.0%) |
| $500 to $799 | 144 (13.1%) | 67 (50.4%) |
| $800 to $999 | 16 (1.5%) | 42 (31.6%) |
| $1,000 to $1,499 | 69 (6.3%) | 0 (0.0%) |
| $1,500 to $1,999 | 52 (4.7%) | 0 (0.0%) |
| $2,000 to $2,499 | 24 (2.2%) | 0 (0.0%) |
| $2,500 to $2,999 | 0 (0.0%) | 0 (0.0%) |
| $3,000 or more | 0 (0.0%) | 0 (0.0%) |
| Total | 1,102 (100.0%) | 133 (100.0%) |
Physical Housing Characteristics in Olivarez
Housing Structures in Olivarez
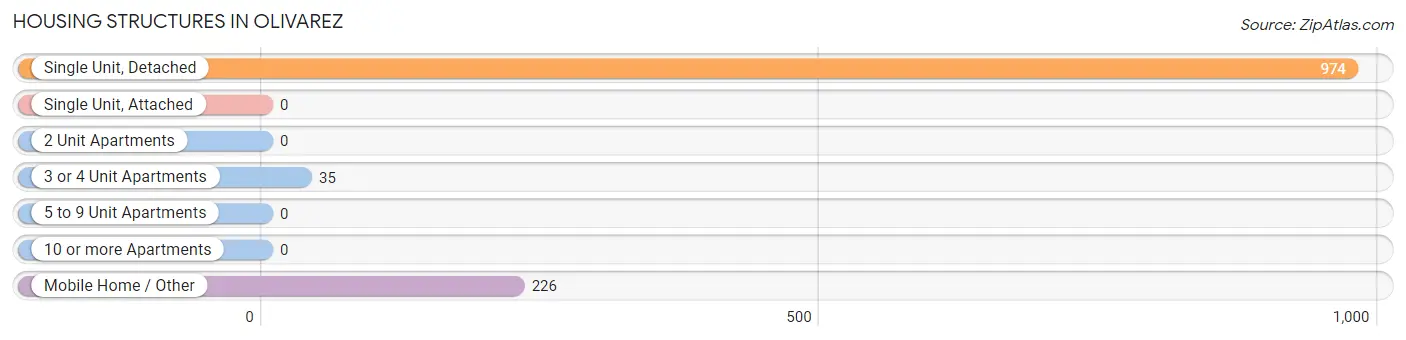
| Structure Type | # Housing Units | % Housing Units |
| Single Unit, Detached | 974 | 78.9% |
| Single Unit, Attached | 0 | 0.0% |
| 2 Unit Apartments | 0 | 0.0% |
| 3 or 4 Unit Apartments | 35 | 2.8% |
| 5 to 9 Unit Apartments | 0 | 0.0% |
| 10 or more Apartments | 0 | 0.0% |
| Mobile Home / Other | 226 | 18.3% |
| Total | 1,235 | 100.0% |
Housing Structures by Occupancy in Olivarez
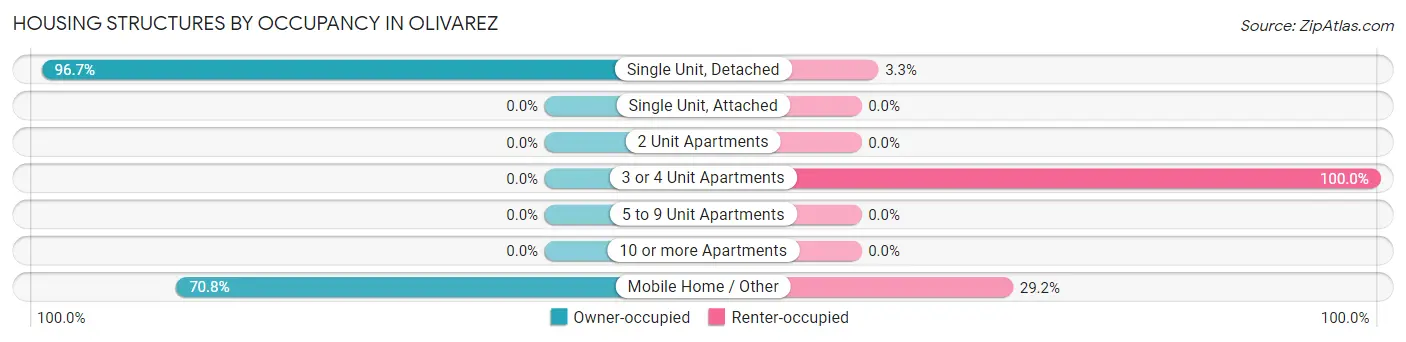
| Structure Type | Owner-occupied | Renter-occupied |
| Single Unit, Detached | 942 (96.7%) | 32 (3.3%) |
| Single Unit, Attached | 0 (0.0%) | 0 (0.0%) |
| 2 Unit Apartments | 0 (0.0%) | 0 (0.0%) |
| 3 or 4 Unit Apartments | 0 (0.0%) | 35 (100.0%) |
| 5 to 9 Unit Apartments | 0 (0.0%) | 0 (0.0%) |
| 10 or more Apartments | 0 (0.0%) | 0 (0.0%) |
| Mobile Home / Other | 160 (70.8%) | 66 (29.2%) |
| Total | 1,102 (89.2%) | 133 (10.8%) |
Housing Structures by Number of Rooms in Olivarez
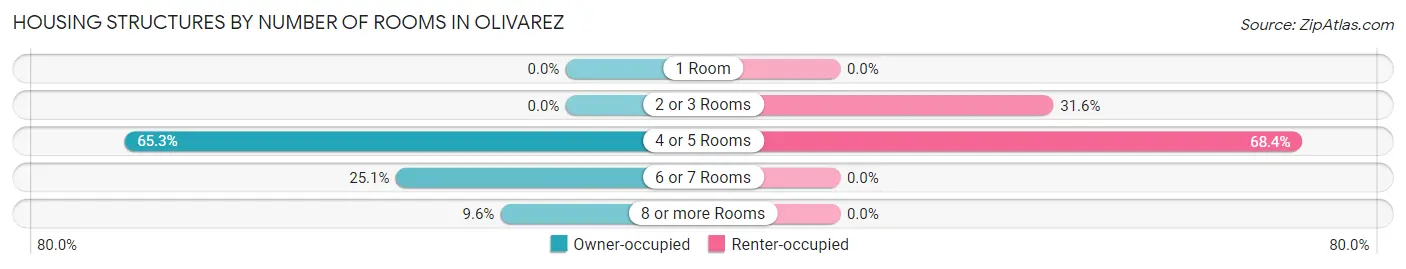
| Number of Rooms | Owner-occupied | Renter-occupied |
| 1 Room | 0 (0.0%) | 0 (0.0%) |
| 2 or 3 Rooms | 0 (0.0%) | 42 (31.6%) |
| 4 or 5 Rooms | 719 (65.2%) | 91 (68.4%) |
| 6 or 7 Rooms | 277 (25.1%) | 0 (0.0%) |
| 8 or more Rooms | 106 (9.6%) | 0 (0.0%) |
| Total | 1,102 (100.0%) | 133 (100.0%) |
Housing Structure by Heating Type in Olivarez
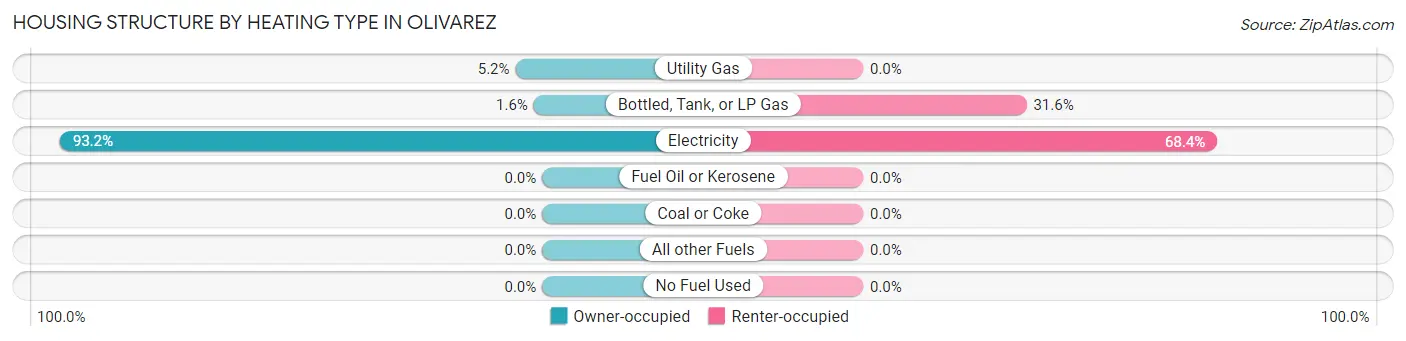
| Heating Type | Owner-occupied | Renter-occupied |
| Utility Gas | 57 (5.2%) | 0 (0.0%) |
| Bottled, Tank, or LP Gas | 18 (1.6%) | 42 (31.6%) |
| Electricity | 1,027 (93.2%) | 91 (68.4%) |
| Fuel Oil or Kerosene | 0 (0.0%) | 0 (0.0%) |
| Coal or Coke | 0 (0.0%) | 0 (0.0%) |
| All other Fuels | 0 (0.0%) | 0 (0.0%) |
| No Fuel Used | 0 (0.0%) | 0 (0.0%) |
| Total | 1,102 (100.0%) | 133 (100.0%) |
Household Vehicle Usage in Olivarez
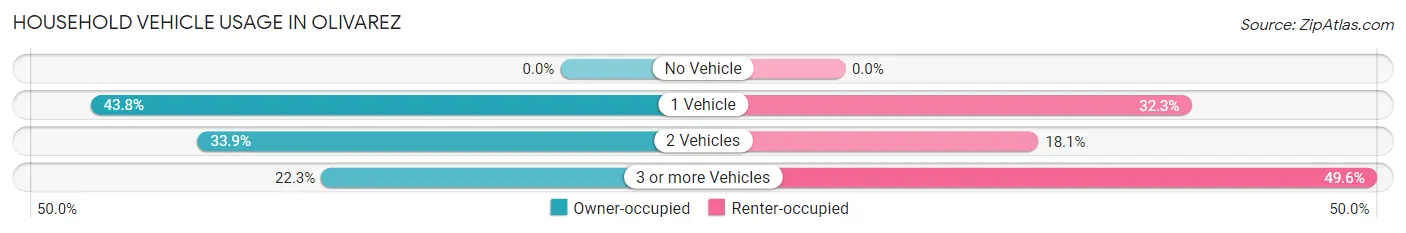
| Vehicles per Household | Owner-occupied | Renter-occupied |
| No Vehicle | 0 (0.0%) | 0 (0.0%) |
| 1 Vehicle | 483 (43.8%) | 43 (32.3%) |
| 2 Vehicles | 373 (33.9%) | 24 (18.0%) |
| 3 or more Vehicles | 246 (22.3%) | 66 (49.6%) |
| Total | 1,102 (100.0%) | 133 (100.0%) |
Real Estate & Mortgages in Olivarez
Real Estate and Mortgage Overview in Olivarez
| Characteristic | Without Mortgage | With Mortgage |
| Housing Units | 851 | 251 |
| Median Property Value | $58,000 | $94,400 |
| Median Household Income | $61,985 | $79 |
| Monthly Housing Costs | $322 | $0 |
| Real Estate Taxes | $746 | $13 |
Property Value by Mortgage Status in Olivarez
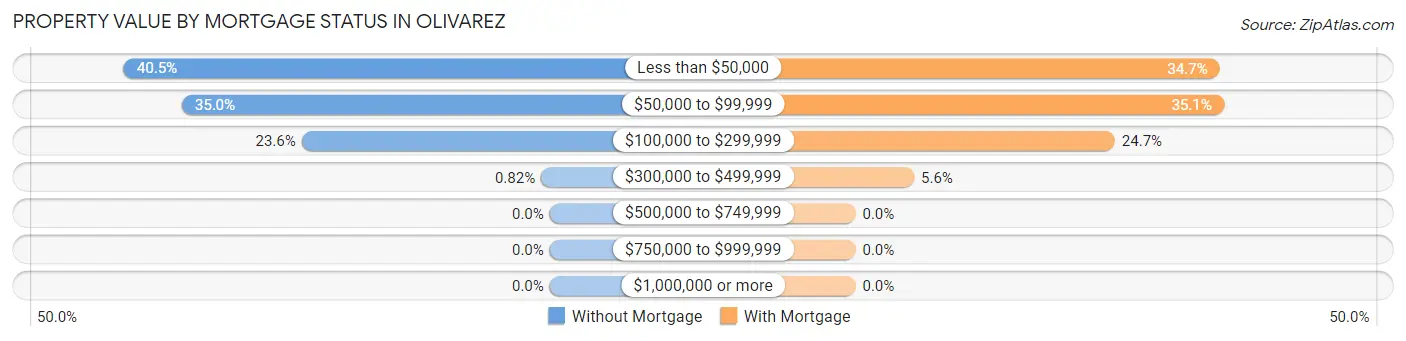
| Property Value | Without Mortgage | With Mortgage |
| Less than $50,000 | 345 (40.5%) | 87 (34.7%) |
| $50,000 to $99,999 | 298 (35.0%) | 88 (35.1%) |
| $100,000 to $299,999 | 201 (23.6%) | 62 (24.7%) |
| $300,000 to $499,999 | 7 (0.8%) | 14 (5.6%) |
| $500,000 to $749,999 | 0 (0.0%) | 0 (0.0%) |
| $750,000 to $999,999 | 0 (0.0%) | 0 (0.0%) |
| $1,000,000 or more | 0 (0.0%) | 0 (0.0%) |
| Total | 851 (100.0%) | 251 (100.0%) |
Household Income by Mortgage Status in Olivarez
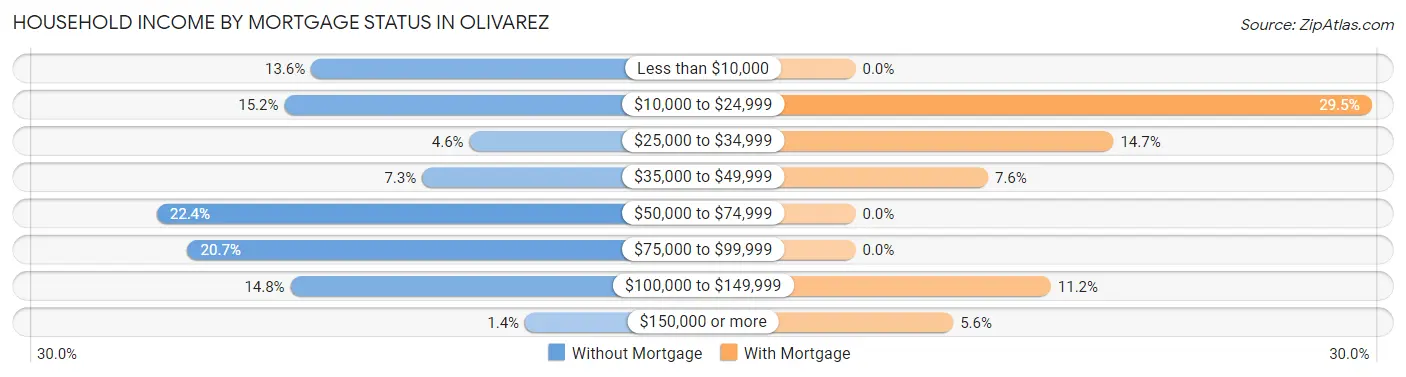
| Household Income | Without Mortgage | With Mortgage |
| Less than $10,000 | 116 (13.6%) | 0 (0.0%) |
| $10,000 to $24,999 | 129 (15.2%) | 74 (29.5%) |
| $25,000 to $34,999 | 39 (4.6%) | 37 (14.7%) |
| $35,000 to $49,999 | 62 (7.3%) | 19 (7.6%) |
| $50,000 to $74,999 | 191 (22.4%) | 0 (0.0%) |
| $75,000 to $99,999 | 176 (20.7%) | 0 (0.0%) |
| $100,000 to $149,999 | 126 (14.8%) | 28 (11.2%) |
| $150,000 or more | 12 (1.4%) | 14 (5.6%) |
| Total | 851 (100.0%) | 251 (100.0%) |
Property Value to Household Income Ratio in Olivarez
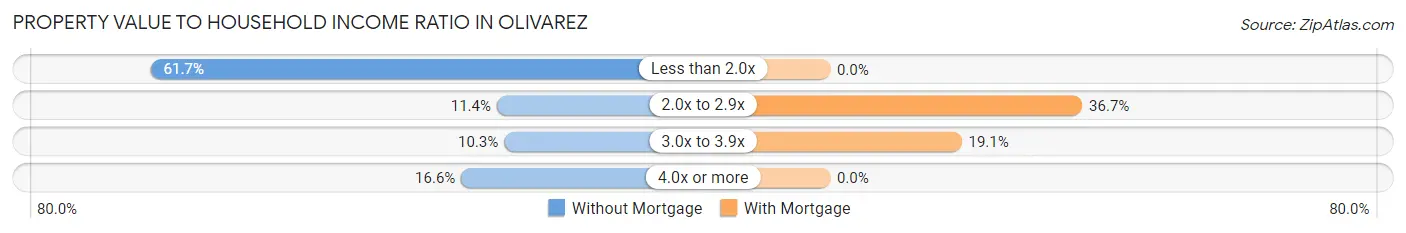
| Value-to-Income Ratio | Without Mortgage | With Mortgage |
| Less than 2.0x | 525 (61.7%) | 0 (0.0%) |
| 2.0x to 2.9x | 97 (11.4%) | 92 (36.6%) |
| 3.0x to 3.9x | 88 (10.3%) | 48 (19.1%) |
| 4.0x or more | 141 (16.6%) | 0 (0.0%) |
| Total | 851 (100.0%) | 251 (100.0%) |
Real Estate Taxes by Mortgage Status in Olivarez
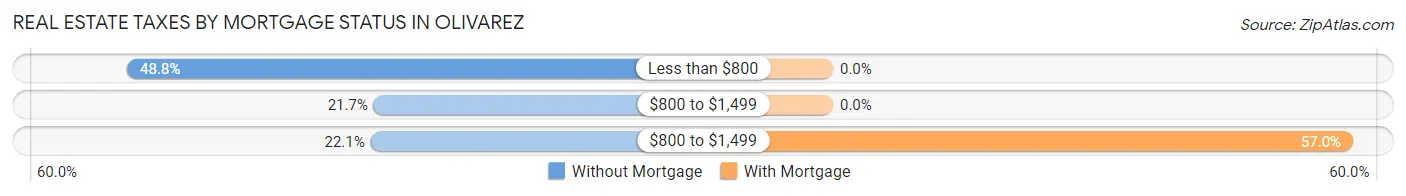
| Property Taxes | Without Mortgage | With Mortgage |
| Less than $800 | 415 (48.8%) | 0 (0.0%) |
| $800 to $1,499 | 185 (21.7%) | 0 (0.0%) |
| $800 to $1,499 | 188 (22.1%) | 143 (57.0%) |
| Total | 851 (100.0%) | 251 (100.0%) |
Health & Disability in Olivarez
Health Insurance Coverage by Age in Olivarez
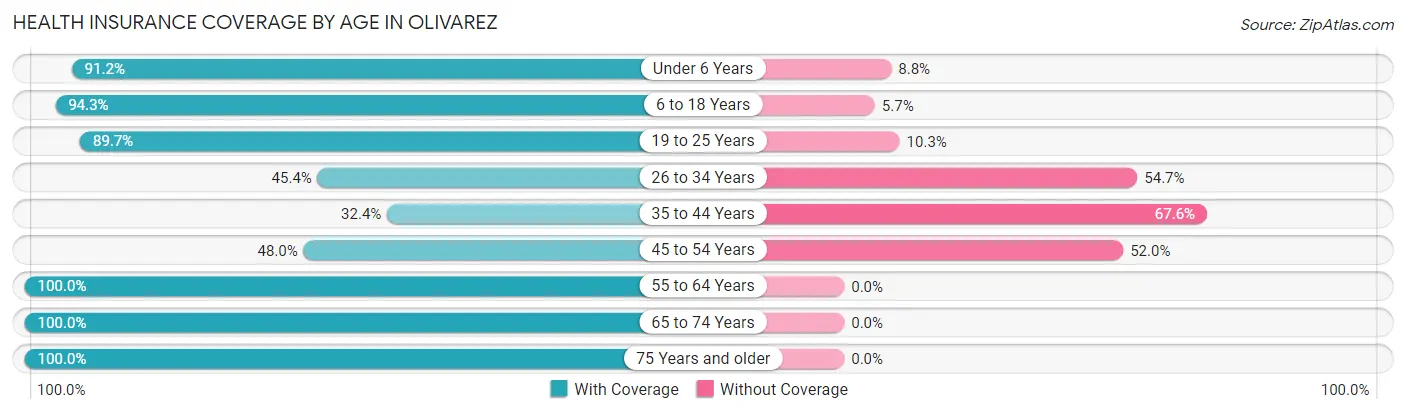
| Age Bracket | With Coverage | Without Coverage |
| Under 6 Years | 1,724 (91.2%) | 166 (8.8%) |
| 6 to 18 Years | 1,717 (94.3%) | 104 (5.7%) |
| 19 to 25 Years | 391 (89.7%) | 45 (10.3%) |
| 26 to 34 Years | 278 (45.4%) | 335 (54.6%) |
| 35 to 44 Years | 172 (32.4%) | 359 (67.6%) |
| 45 to 54 Years | 250 (48.0%) | 271 (52.0%) |
| 55 to 64 Years | 372 (100.0%) | 0 (0.0%) |
| 65 to 74 Years | 346 (100.0%) | 0 (0.0%) |
| 75 Years and older | 323 (100.0%) | 0 (0.0%) |
| Total | 5,573 (81.3%) | 1,280 (18.7%) |
Health Insurance Coverage by Citizenship Status in Olivarez
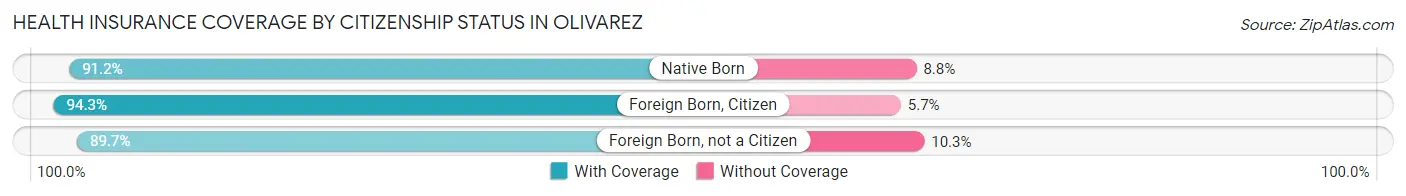
| Citizenship Status | With Coverage | Without Coverage |
| Native Born | 1,724 (91.2%) | 166 (8.8%) |
| Foreign Born, Citizen | 1,717 (94.3%) | 104 (5.7%) |
| Foreign Born, not a Citizen | 391 (89.7%) | 45 (10.3%) |
Health Insurance Coverage by Household Income in Olivarez
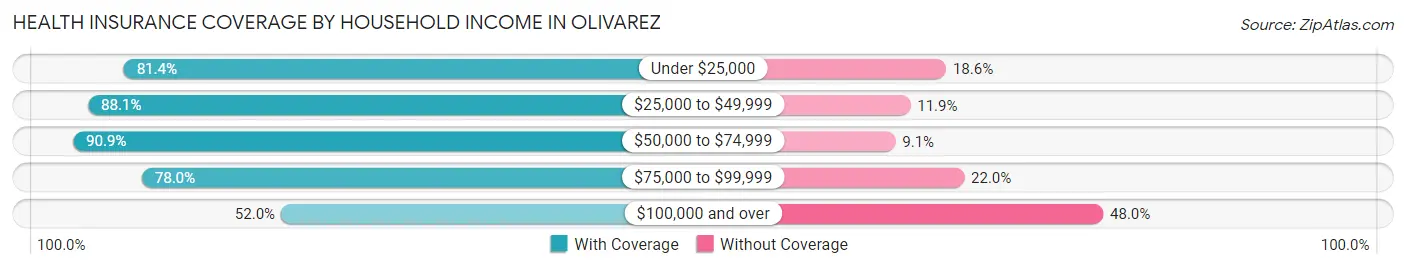
| Household Income | With Coverage | Without Coverage |
| Under $25,000 | 1,599 (81.4%) | 365 (18.6%) |
| $25,000 to $49,999 | 437 (88.1%) | 59 (11.9%) |
| $50,000 to $74,999 | 2,161 (90.9%) | 216 (9.1%) |
| $75,000 to $99,999 | 983 (78.0%) | 277 (22.0%) |
| $100,000 and over | 393 (52.0%) | 363 (48.0%) |
Public vs Private Health Insurance Coverage by Age in Olivarez
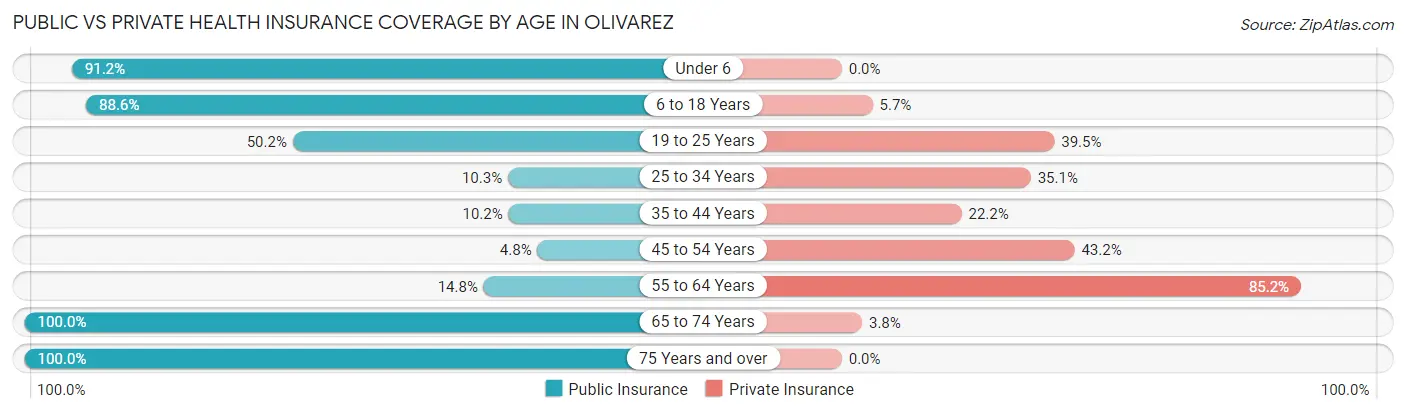
| Age Bracket | Public Insurance | Private Insurance |
| Under 6 | 1,724 (91.2%) | 0 (0.0%) |
| 6 to 18 Years | 1,613 (88.6%) | 104 (5.7%) |
| 19 to 25 Years | 219 (50.2%) | 172 (39.5%) |
| 25 to 34 Years | 63 (10.3%) | 215 (35.1%) |
| 35 to 44 Years | 54 (10.2%) | 118 (22.2%) |
| 45 to 54 Years | 25 (4.8%) | 225 (43.2%) |
| 55 to 64 Years | 55 (14.8%) | 317 (85.2%) |
| 65 to 74 Years | 346 (100.0%) | 13 (3.8%) |
| 75 Years and over | 323 (100.0%) | 0 (0.0%) |
| Total | 4,422 (64.5%) | 1,164 (17.0%) |
Disability Status by Sex by Age in Olivarez
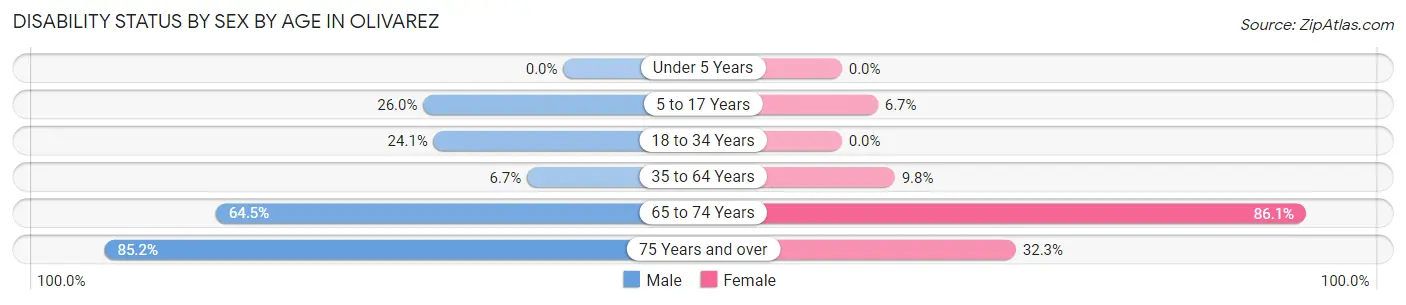
| Age Bracket | Male | Female |
| Under 5 Years | 0 (0.0%) | 0 (0.0%) |
| 5 to 17 Years | 250 (26.0%) | 59 (6.7%) |
| 18 to 34 Years | 155 (24.1%) | 0 (0.0%) |
| 35 to 64 Years | 41 (6.7%) | 80 (9.8%) |
| 65 to 74 Years | 158 (64.5%) | 87 (86.1%) |
| 75 Years and over | 109 (85.2%) | 63 (32.3%) |
Disability Class by Sex by Age in Olivarez
Disability Class: Hearing Difficulty
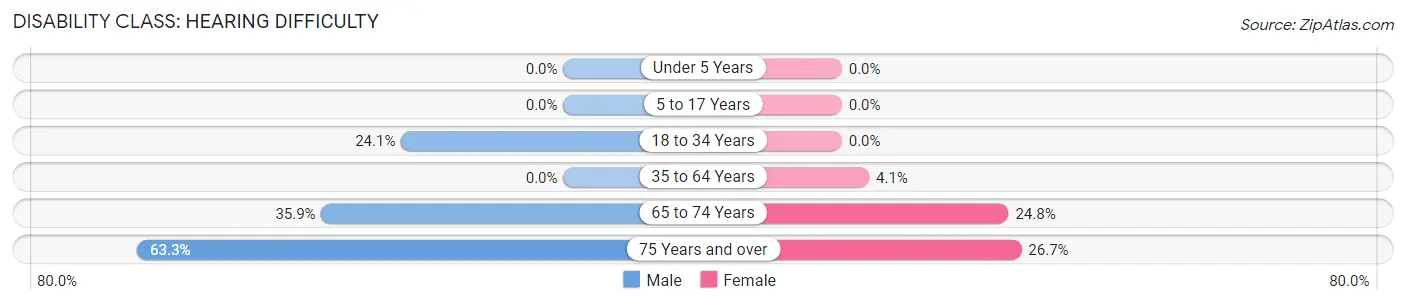
| Age Bracket | Male | Female |
| Under 5 Years | 0 (0.0%) | 0 (0.0%) |
| 5 to 17 Years | 0 (0.0%) | 0 (0.0%) |
| 18 to 34 Years | 155 (24.1%) | 0 (0.0%) |
| 35 to 64 Years | 0 (0.0%) | 33 (4.1%) |
| 65 to 74 Years | 88 (35.9%) | 25 (24.7%) |
| 75 Years and over | 81 (63.3%) | 52 (26.7%) |
Disability Class: Vision Difficulty
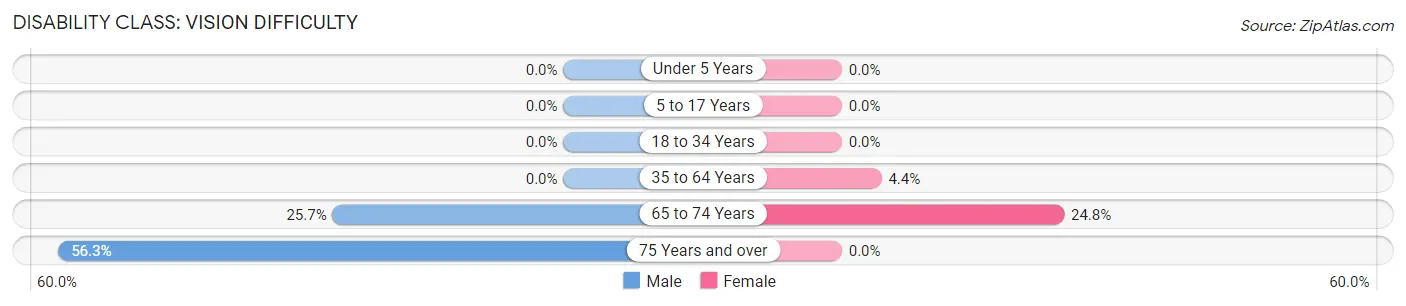
| Age Bracket | Male | Female |
| Under 5 Years | 0 (0.0%) | 0 (0.0%) |
| 5 to 17 Years | 0 (0.0%) | 0 (0.0%) |
| 18 to 34 Years | 0 (0.0%) | 0 (0.0%) |
| 35 to 64 Years | 0 (0.0%) | 36 (4.4%) |
| 65 to 74 Years | 63 (25.7%) | 25 (24.7%) |
| 75 Years and over | 72 (56.2%) | 0 (0.0%) |
Disability Class: Cognitive Difficulty
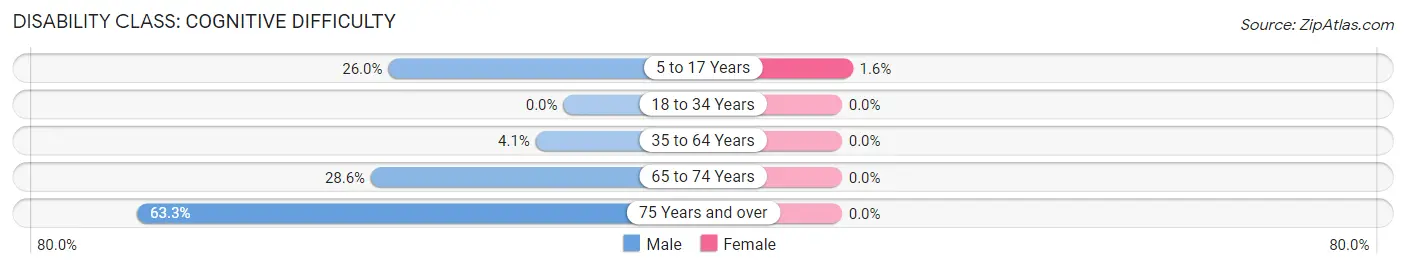
| Age Bracket | Male | Female |
| 5 to 17 Years | 250 (26.0%) | 14 (1.6%) |
| 18 to 34 Years | 0 (0.0%) | 0 (0.0%) |
| 35 to 64 Years | 25 (4.1%) | 0 (0.0%) |
| 65 to 74 Years | 70 (28.6%) | 0 (0.0%) |
| 75 Years and over | 81 (63.3%) | 0 (0.0%) |
Disability Class: Ambulatory Difficulty
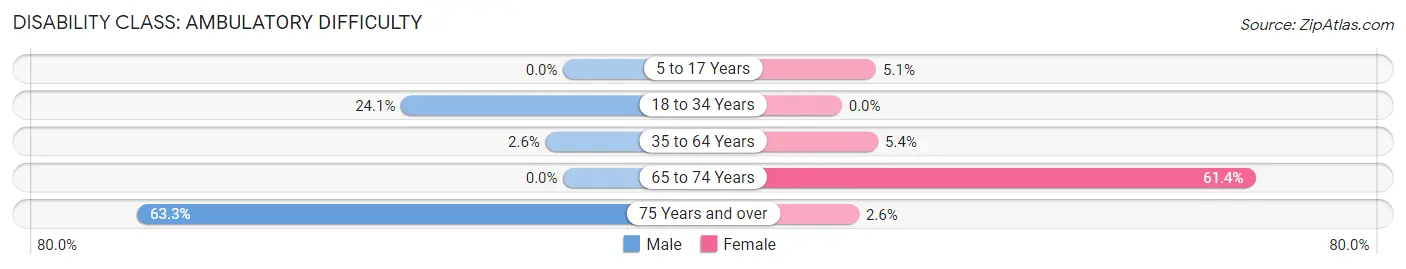
| Age Bracket | Male | Female |
| 5 to 17 Years | 0 (0.0%) | 45 (5.1%) |
| 18 to 34 Years | 155 (24.1%) | 0 (0.0%) |
| 35 to 64 Years | 16 (2.6%) | 44 (5.4%) |
| 65 to 74 Years | 0 (0.0%) | 62 (61.4%) |
| 75 Years and over | 81 (63.3%) | 5 (2.6%) |
Disability Class: Self-Care Difficulty
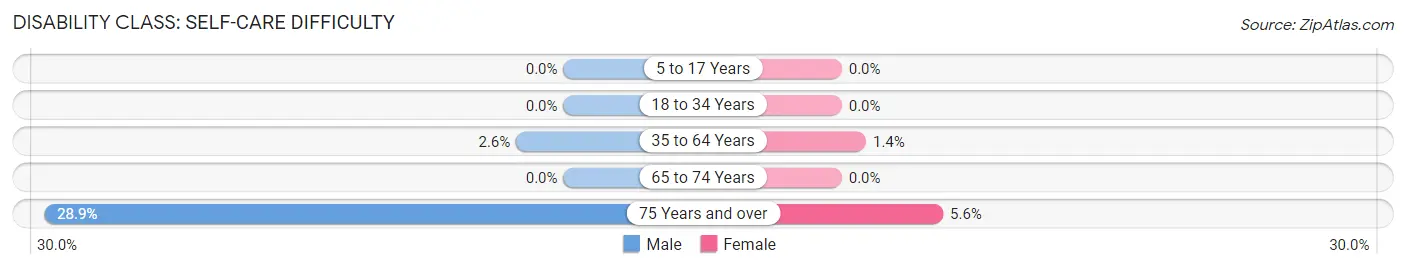
| Age Bracket | Male | Female |
| 5 to 17 Years | 0 (0.0%) | 0 (0.0%) |
| 18 to 34 Years | 0 (0.0%) | 0 (0.0%) |
| 35 to 64 Years | 16 (2.6%) | 11 (1.3%) |
| 65 to 74 Years | 0 (0.0%) | 0 (0.0%) |
| 75 Years and over | 37 (28.9%) | 11 (5.6%) |
Technology Access in Olivarez
Computing Device Access in Olivarez
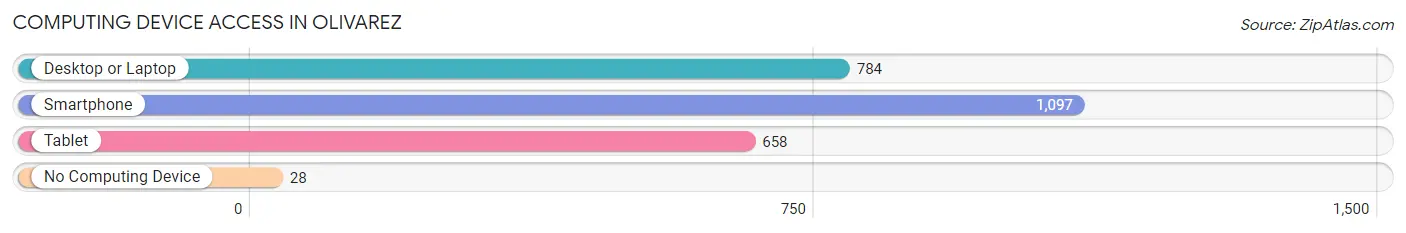
| Device Type | # Households | % Households |
| Desktop or Laptop | 784 | 63.5% |
| Smartphone | 1,097 | 88.8% |
| Tablet | 658 | 53.3% |
| No Computing Device | 28 | 2.3% |
| Total | 1,235 | 100.0% |
Internet Access in Olivarez
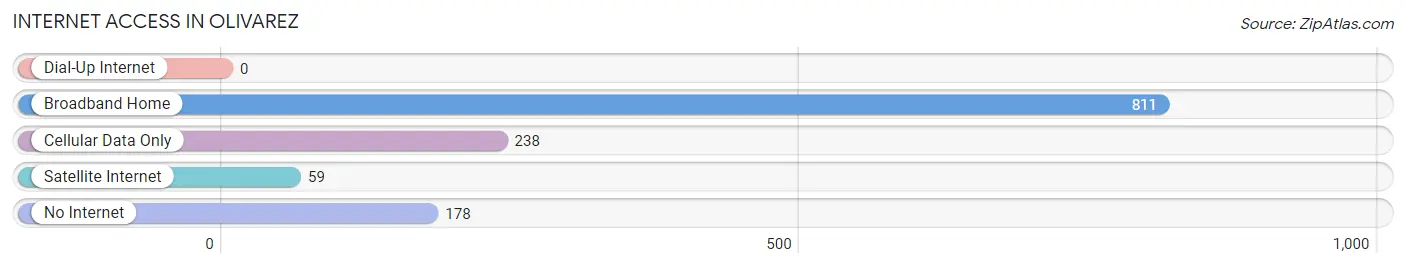
| Internet Type | # Households | % Households |
| Dial-Up Internet | 0 | 0.0% |
| Broadband Home | 811 | 65.7% |
| Cellular Data Only | 238 | 19.3% |
| Satellite Internet | 59 | 4.8% |
| No Internet | 178 | 14.4% |
| Total | 1,235 | 100.0% |
Olivarez Summary
Olivarez is a small unincorporated community located in Hidalgo County, Texas. It is situated about 10 miles south of the city of McAllen and is part of the McAllen–Edinburg–Mission metropolitan area. The population of Olivarez was estimated to be around 1,000 in 2020.
History
Olivarez was founded in the early 1900s by a group of Mexican immigrants who were looking for a place to settle and start a new life. The town was named after one of the original settlers, Juan Olivarez. The town was originally a farming community, with the main crops being cotton, corn, and sorghum. As the years passed, the town grew and more people moved in. By the 1950s, Olivarez had become a thriving community with a population of around 1,000 people.
Geography
Olivarez is located in the Rio Grande Valley of South Texas, about 10 miles south of the city of McAllen. The town is situated on the banks of the Rio Grande River, which forms the border between the United States and Mexico. The terrain of the area is mostly flat, with some rolling hills. The climate is subtropical, with hot summers and mild winters.
Economy
The economy of Olivarez is largely based on agriculture. The main crops grown in the area are cotton, corn, sorghum, and vegetables. Livestock production is also an important part of the local economy. In addition, the town has several small businesses, including restaurants, grocery stores, and auto repair shops.
Demographics
As of the 2020 census, the population of Olivarez was estimated to be around 1,000 people. The racial makeup of the town was 94.2% Hispanic or Latino, 4.2% White, and 1.6% other. The median household income was $30,000, and the median age was 33.
Olivarez is a small but vibrant community that has a rich history and culture. The town is a great place to live and work, and it offers a variety of activities and amenities for its residents. With its close proximity to the Rio Grande River, Olivarez is a great place to explore the outdoors and enjoy the beauty of South Texas.
Common Questions
What is Per Capita Income in Olivarez?
Per Capita income in Olivarez is $12,415.
What is the Median Family Income in Olivarez?
Median Family Income in Olivarez is $61,103.
What is the Median Household income in Olivarez?
Median Household Income in Olivarez is $61,740.
What is Income or Wage Gap in Olivarez?
Income or Wage Gap in Olivarez is 64.2%.
Women in Olivarez earn 35.8 cents for every dollar earned by a man.
What is Inequality or Gini Index in Olivarez?
Inequality or Gini Index in Olivarez is 0.45.
What is the Total Population of Olivarez?
Total Population of Olivarez is 6,853.
What is the Total Male Population of Olivarez?
Total Male Population of Olivarez is 3,305.
What is the Total Female Population of Olivarez?
Total Female Population of Olivarez is 3,548.
What is the Ratio of Males per 100 Females in Olivarez?
There are 93.15 Males per 100 Females in Olivarez.
What is the Ratio of Females per 100 Males in Olivarez?
There are 107.35 Females per 100 Males in Olivarez.
What is the Median Population Age in Olivarez?
Median Population Age in Olivarez is 15.2 Years.
What is the Average Family Size in Olivarez
Average Family Size in Olivarez is 6.0 People.
What is the Average Household Size in Olivarez
Average Household Size in Olivarez is 5.5 People.
How Large is the Labor Force in Olivarez?
There are 1,803 People in the Labor Forcein in Olivarez.
What is the Percentage of People in the Labor Force in Olivarez?
53.3% of People are in the Labor Force in Olivarez.
What is the Unemployment Rate in Olivarez?
Unemployment Rate in Olivarez is 3.7%.