Zip Codes with the Highest Percentage of Families with Income Below $10,000 in Corsicana, TX
RELATED REPORTS & OPTIONS
Family Income | $0-10k
Corsicana
Compare Zip Codes
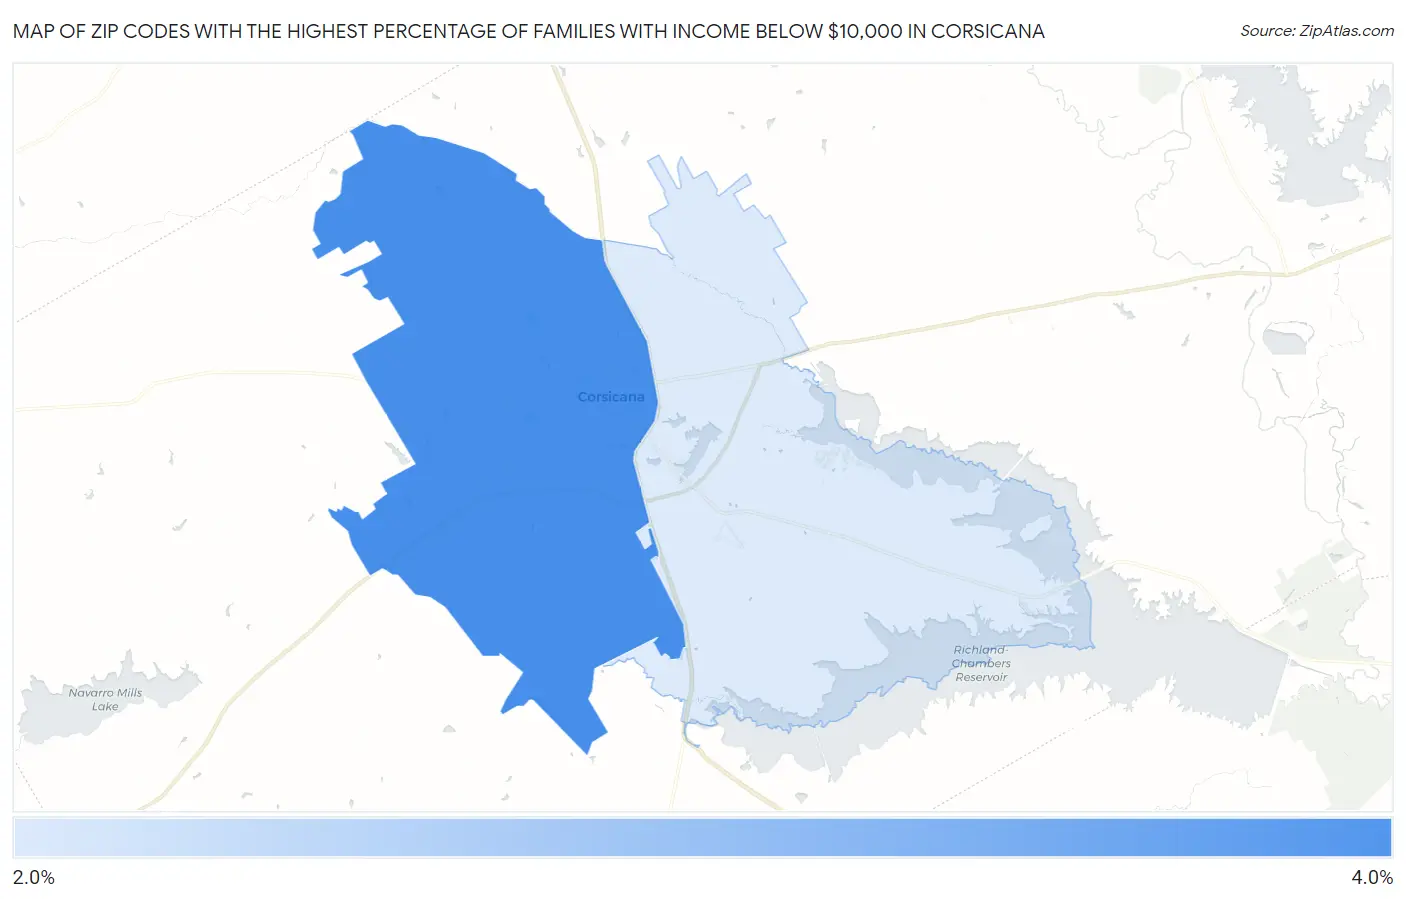
Map of Zip Codes with the Highest Percentage of Families with Income Below $10,000 in Corsicana
2.4%
3.6%
Zip Codes with the Highest Percentage of Families with Income Below $10,000 in Corsicana, TX
| Zip Code | Families with Income < $10k | vs State | vs National | |
| 1. | 75110 | 3.6% | 3.5%(+0.100)#647 | 3.1%(+0.500)#9,244 |
| 2. | 75109 | 2.4% | 3.5%(-1.10)#939 | 3.1%(-0.700)#13,679 |
1
Common Questions
What are the Top Zip Codes with the Highest Percentage of Families with Income Below $10,000 in Corsicana, TX?
Top Zip Codes with the Highest Percentage of Families with Income Below $10,000 in Corsicana, TX are:
What zip code has the Highest Percentage of Families with Income Below $10,000 in Corsicana, TX?
75110 has the Highest Percentage of Families with Income Below $10,000 in Corsicana, TX with 3.6%.
What is the Percentage of Families with Income Below $10,000 in Corsicana, TX?
Percentage of Families with Income Below $10,000 in Corsicana is 3.5%.
What is the Percentage of Families with Income Below $10,000 in Texas?
Percentage of Families with Income Below $10,000 in Texas is 3.5%.
What is the Percentage of Families with Income Below $10,000 in the United States?
Percentage of Families with Income Below $10,000 in the United States is 3.1%.