Zip Codes with the Highest Percentage of Families with Income Below $10,000 in Duncanville, TX
RELATED REPORTS & OPTIONS
Family Income | $0-10k
Duncanville
Compare Zip Codes
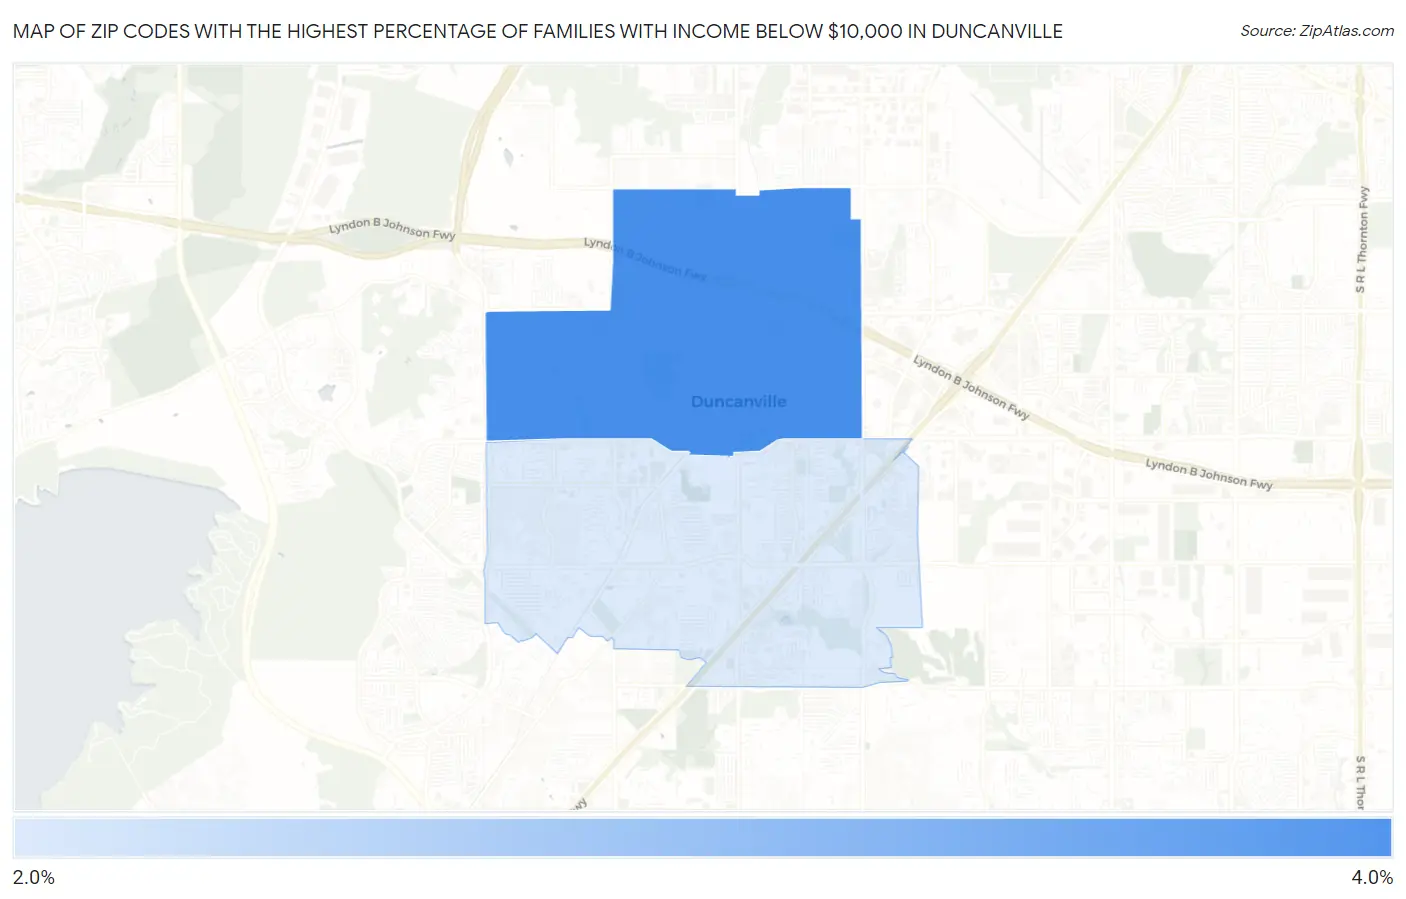
Map of Zip Codes with the Highest Percentage of Families with Income Below $10,000 in Duncanville
2.6%
3.3%
Zip Codes with the Highest Percentage of Families with Income Below $10,000 in Duncanville, TX
| Zip Code | Families with Income < $10k | vs State | vs National | |
| 1. | 75116 | 3.3% | 3.5%(-0.200)#712 | 3.1%(+0.200)#10,173 |
| 2. | 75137 | 2.6% | 3.5%(-0.900)#879 | 3.1%(-0.500)#12,724 |
1
Common Questions
What are the Top Zip Codes with the Highest Percentage of Families with Income Below $10,000 in Duncanville, TX?
Top Zip Codes with the Highest Percentage of Families with Income Below $10,000 in Duncanville, TX are:
What zip code has the Highest Percentage of Families with Income Below $10,000 in Duncanville, TX?
75116 has the Highest Percentage of Families with Income Below $10,000 in Duncanville, TX with 3.3%.
What is the Percentage of Families with Income Below $10,000 in Duncanville, TX?
Percentage of Families with Income Below $10,000 in Duncanville is 3.0%.
What is the Percentage of Families with Income Below $10,000 in Texas?
Percentage of Families with Income Below $10,000 in Texas is 3.5%.
What is the Percentage of Families with Income Below $10,000 in the United States?
Percentage of Families with Income Below $10,000 in the United States is 3.1%.