Caney City, TX Map & Demographics
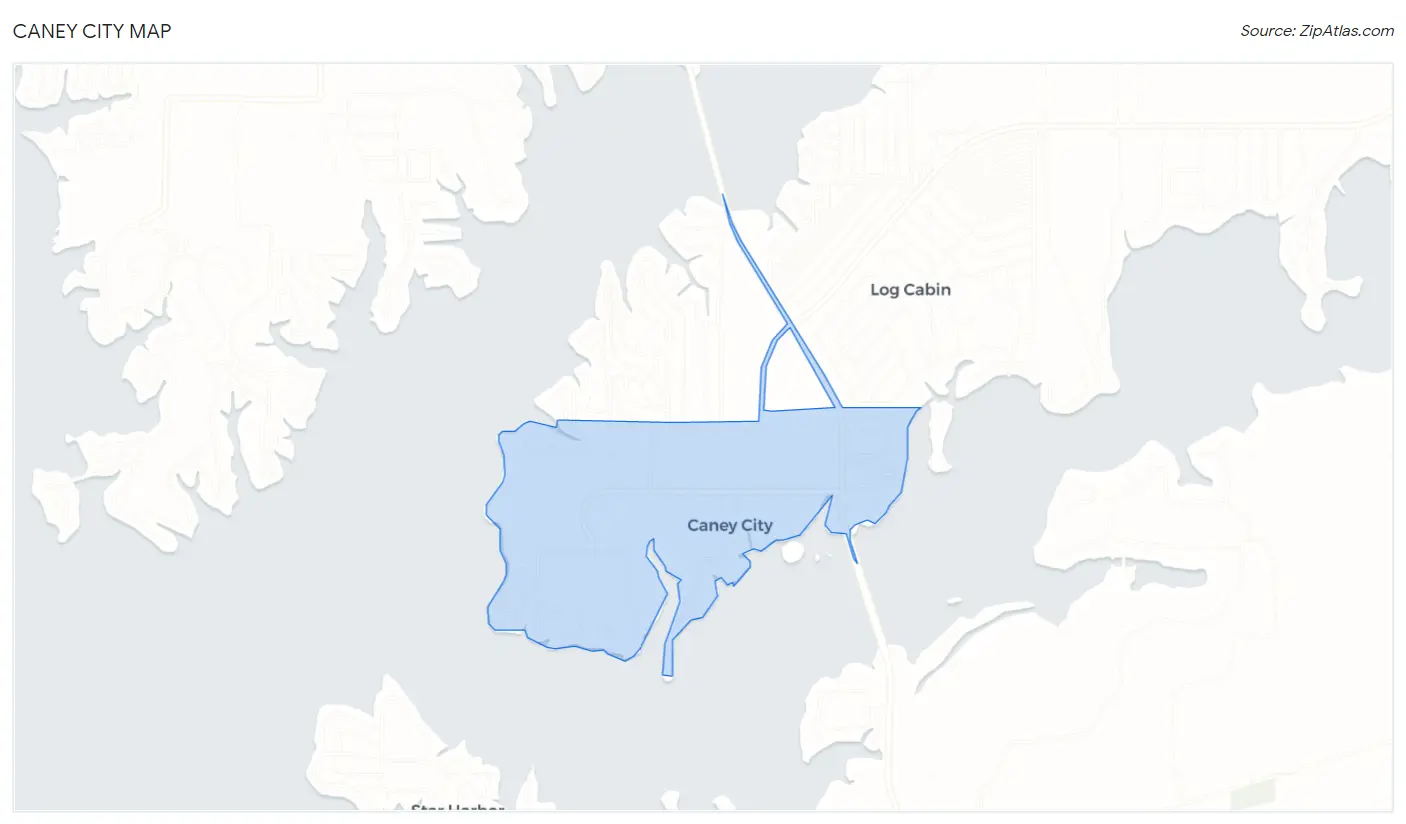
Caney City Map
Caney City Overview
$51,793
PER CAPITA INCOME
$52,500
AVG HOUSEHOLD INCOME
0.62
INEQUALITY / GINI INDEX
149
TOTAL POPULATION
88
MALE POPULATION
61
FEMALE POPULATION
144.26
MALES / 100 FEMALES
69.32
FEMALES / 100 MALES
59.9
MEDIAN AGE
2.1
AVG FAMILY SIZE
1.8
AVG HOUSEHOLD SIZE
58
LABOR FORCE [ PEOPLE ]
42.6%
PERCENT IN LABOR FORCE
Income in Caney City
Income Overview in Caney City
| Characteristic | Number | Measure |
| Per Capita Income | 149 | $51,793 |
| Median Family Income | 61 | $0 |
| Mean Family Income | 61 | $133,305 |
| Median Household Income | 84 | $52,500 |
| Mean Household Income | 84 | $109,536 |
| Income Deficit | 61 | $0 |
| Wage / Income Gap (%) | 149 | 0.00% |
| Wage / Income Gap ($) | 149 | 100.00¢ per $1 |
| Gini / Inequality Index | 149 | 0.62 |
Earnings by Sex in Caney City
| Sex | Number | Average Earnings |
| Male | 30 (49.2%) | $0 |
| Female | 31 (50.8%) | $0 |
| Total | 61 (100.0%) | $0 |
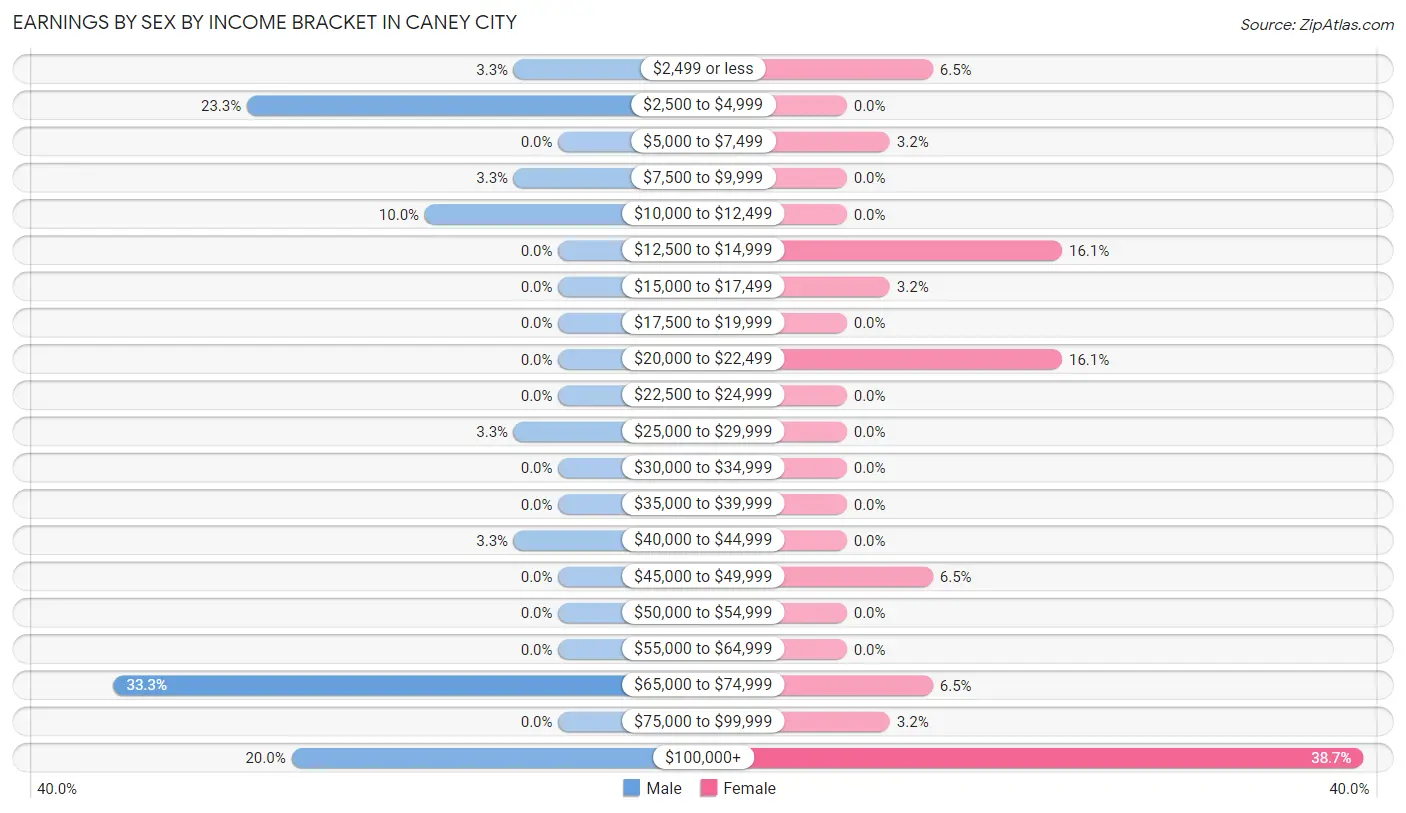
Earnings by Sex by Income Bracket in Caney City
The most common earnings brackets in Caney City are $65,000 to $74,999 for men (10 | 33.3%) and $100,000+ for women (12 | 38.7%).
| Income | Male | Female |
| $2,499 or less | 1 (3.3%) | 2 (6.5%) |
| $2,500 to $4,999 | 7 (23.3%) | 0 (0.0%) |
| $5,000 to $7,499 | 0 (0.0%) | 1 (3.2%) |
| $7,500 to $9,999 | 1 (3.3%) | 0 (0.0%) |
| $10,000 to $12,499 | 3 (10.0%) | 0 (0.0%) |
| $12,500 to $14,999 | 0 (0.0%) | 5 (16.1%) |
| $15,000 to $17,499 | 0 (0.0%) | 1 (3.2%) |
| $17,500 to $19,999 | 0 (0.0%) | 0 (0.0%) |
| $20,000 to $22,499 | 0 (0.0%) | 5 (16.1%) |
| $22,500 to $24,999 | 0 (0.0%) | 0 (0.0%) |
| $25,000 to $29,999 | 1 (3.3%) | 0 (0.0%) |
| $30,000 to $34,999 | 0 (0.0%) | 0 (0.0%) |
| $35,000 to $39,999 | 0 (0.0%) | 0 (0.0%) |
| $40,000 to $44,999 | 1 (3.3%) | 0 (0.0%) |
| $45,000 to $49,999 | 0 (0.0%) | 2 (6.5%) |
| $50,000 to $54,999 | 0 (0.0%) | 0 (0.0%) |
| $55,000 to $64,999 | 0 (0.0%) | 0 (0.0%) |
| $65,000 to $74,999 | 10 (33.3%) | 2 (6.5%) |
| $75,000 to $99,999 | 0 (0.0%) | 1 (3.2%) |
| $100,000+ | 6 (20.0%) | 12 (38.7%) |
| Total | 30 (100.0%) | 31 (100.0%) |
Earnings by Sex by Educational Attainment in Caney City
| Educational Attainment | Male Income | Female Income |
| Less than High School | - | - |
| High School Diploma | - | - |
| College or Associate's Degree | - | - |
| Bachelor's Degree | - | - |
| Graduate Degree | - | - |
| Total | - | - |
Family Income in Caney City
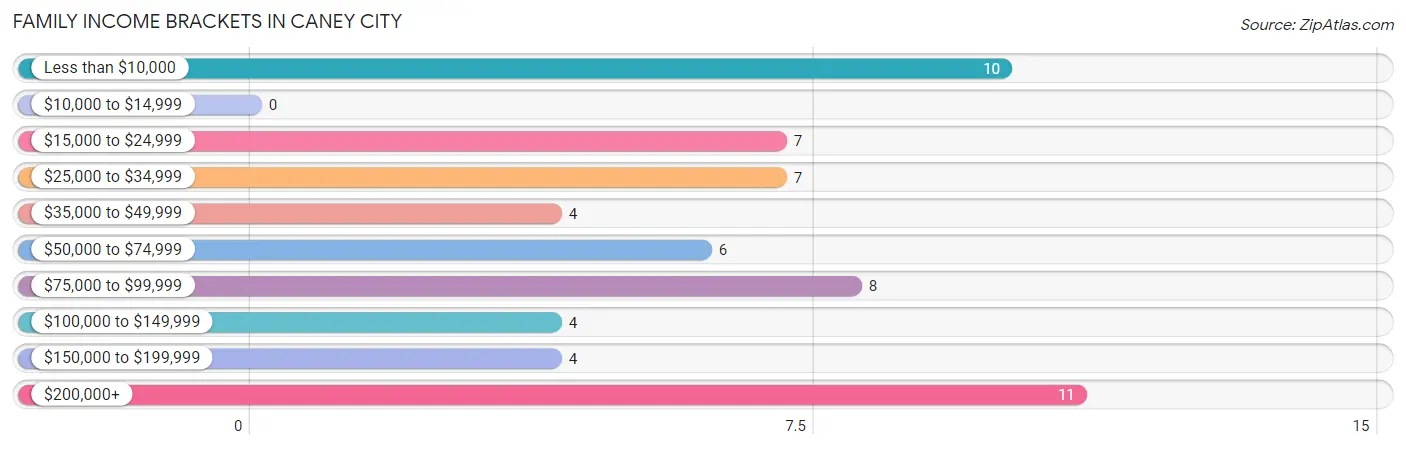
Family Income Brackets in Caney City
According to the Caney City family income data, there are 11 families falling into the $200,000+ income range, which is the most common income bracket and makes up 18.0% of all families.
| Income Bracket | # Families | % Families |
| Less than $10,000 | 10 | 16.4% |
| $10,000 to $14,999 | 0 | 0.0% |
| $15,000 to $24,999 | 7 | 11.5% |
| $25,000 to $34,999 | 7 | 11.5% |
| $35,000 to $49,999 | 4 | 6.6% |
| $50,000 to $74,999 | 6 | 9.8% |
| $75,000 to $99,999 | 8 | 13.1% |
| $100,000 to $149,999 | 4 | 6.6% |
| $150,000 to $199,999 | 4 | 6.6% |
| $200,000+ | 11 | 18.0% |
Family Income by Famaliy Size in Caney City
| Income Bracket | # Families | Median Income |
| 2-Person Families | 54 (88.5%) | $0 |
| 3-Person Families | 2 (3.3%) | $0 |
| 4-Person Families | 5 (8.2%) | $0 |
| 5-Person Families | 0 (0.0%) | $0 |
| 6-Person Families | 0 (0.0%) | $0 |
| 7+ Person Families | 0 (0.0%) | $0 |
| Total | 61 (100.0%) | $0 |
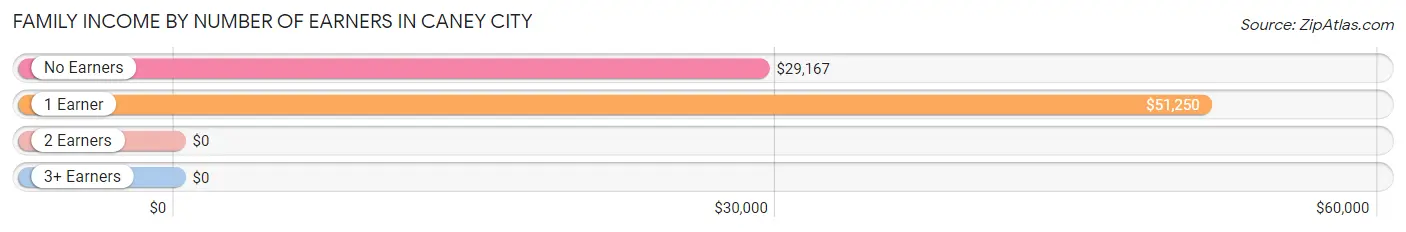
Family Income by Number of Earners in Caney City
| Number of Earners | # Families | Median Income |
| No Earners | 26 (42.6%) | $29,167 |
| 1 Earner | 10 (16.4%) | $51,250 |
| 2 Earners | 25 (41.0%) | $0 |
| 3+ Earners | 0 (0.0%) | $0 |
| Total | 61 (100.0%) | $0 |
Household Income in Caney City
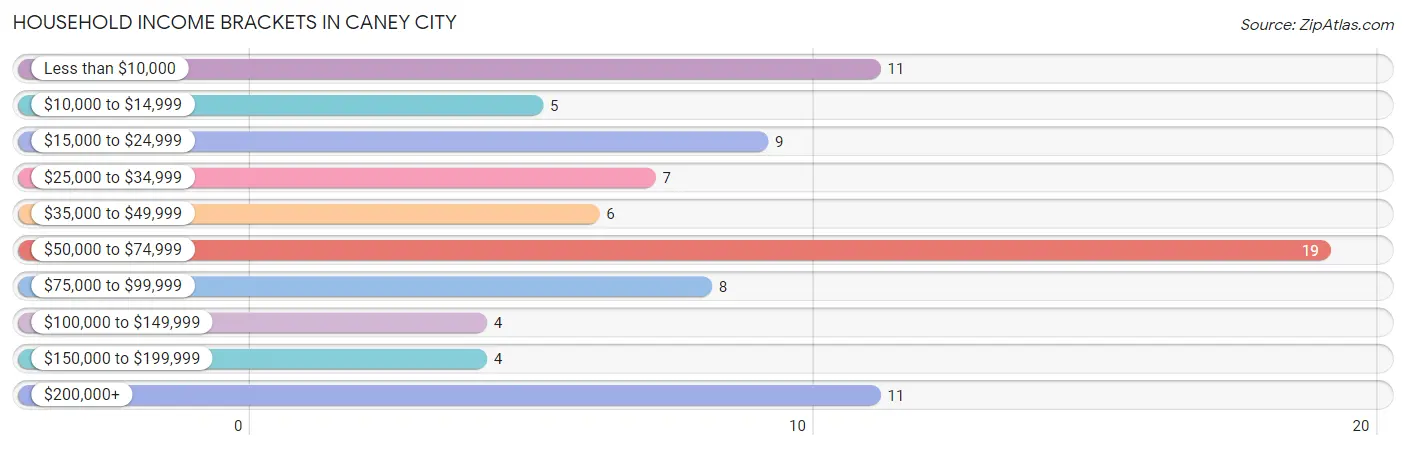
Household Income Brackets in Caney City
With 19 households falling in the category, the $50,000 to $74,999 income range is the most frequent in Caney City, accounting for 22.6% of all households. In contrast, only 4 households (4.8%) fall into the $100,000 to $149,999 income bracket, making it the least populous group.
| Income Bracket | # Households | % Households |
| Less than $10,000 | 11 | 13.1% |
| $10,000 to $14,999 | 5 | 6.0% |
| $15,000 to $24,999 | 9 | 10.7% |
| $25,000 to $34,999 | 7 | 8.3% |
| $35,000 to $49,999 | 6 | 7.1% |
| $50,000 to $74,999 | 19 | 22.6% |
| $75,000 to $99,999 | 8 | 9.5% |
| $100,000 to $149,999 | 4 | 4.8% |
| $150,000 to $199,999 | 4 | 4.8% |
| $200,000+ | 11 | 13.1% |
Household Income by Householder Age in Caney City
The median household income in Caney City is $52,500, with the highest median household income of $31,250 found in the 65+ years age bracket for the primary householder. A total of 41 households (48.8%) fall into this category.
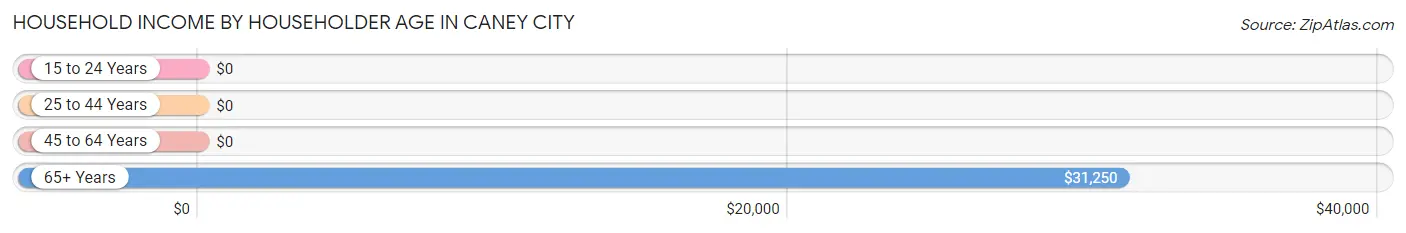
| Income Bracket | # Households | Median Income |
| 15 to 24 Years | 0 (0.0%) | $0 |
| 25 to 44 Years | 8 (9.5%) | $0 |
| 45 to 64 Years | 35 (41.7%) | $0 |
| 65+ Years | 41 (48.8%) | $31,250 |
| Total | 84 (100.0%) | $52,500 |
Poverty in Caney City
Income Below Poverty by Sex and Age in Caney City
With 40.9% poverty level for males and 14.7% for females among the residents of Caney City, 6 to 11 year old males and 35 to 44 year old females are the most vulnerable to poverty, with 8 males (100.0%) and 5 females (62.5%) in their respective age groups living below the poverty level.
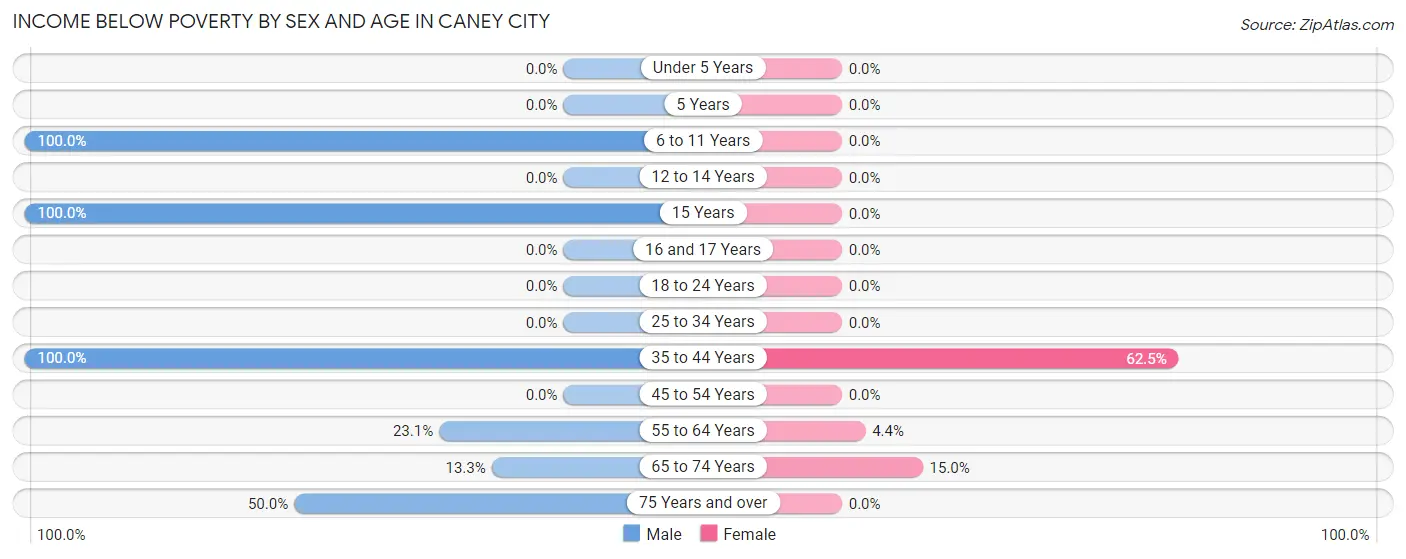
| Age Bracket | Male | Female |
| Under 5 Years | 0 (0.0%) | 0 (0.0%) |
| 5 Years | 0 (0.0%) | 0 (0.0%) |
| 6 to 11 Years | 8 (100.0%) | 0 (0.0%) |
| 12 to 14 Years | 0 (0.0%) | 0 (0.0%) |
| 15 Years | 5 (100.0%) | 0 (0.0%) |
| 16 and 17 Years | 0 (0.0%) | 0 (0.0%) |
| 18 to 24 Years | 0 (0.0%) | 0 (0.0%) |
| 25 to 34 Years | 0 (0.0%) | 0 (0.0%) |
| 35 to 44 Years | 5 (100.0%) | 5 (62.5%) |
| 45 to 54 Years | 0 (0.0%) | 0 (0.0%) |
| 55 to 64 Years | 6 (23.1%) | 1 (4.3%) |
| 65 to 74 Years | 2 (13.3%) | 3 (15.0%) |
| 75 Years and over | 10 (50.0%) | 0 (0.0%) |
| Total | 36 (40.9%) | 9 (14.7%) |
Income Above Poverty by Sex and Age in Caney City
According to the poverty statistics in Caney City, males aged 18 to 24 years and females aged 16 and 17 years are the age groups that are most secure financially, with 100.0% of males and 100.0% of females in these age groups living above the poverty line.
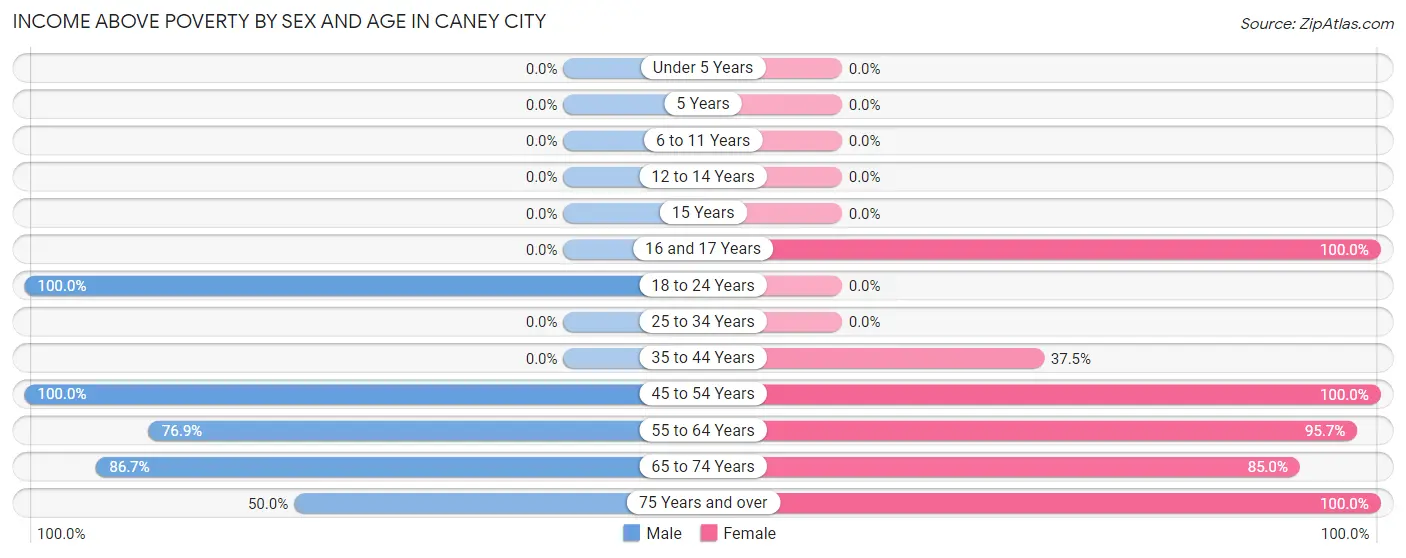
| Age Bracket | Male | Female |
| Under 5 Years | 0 (0.0%) | 0 (0.0%) |
| 5 Years | 0 (0.0%) | 0 (0.0%) |
| 6 to 11 Years | 0 (0.0%) | 0 (0.0%) |
| 12 to 14 Years | 0 (0.0%) | 0 (0.0%) |
| 15 Years | 0 (0.0%) | 0 (0.0%) |
| 16 and 17 Years | 0 (0.0%) | 1 (100.0%) |
| 18 to 24 Years | 5 (100.0%) | 0 (0.0%) |
| 25 to 34 Years | 0 (0.0%) | 0 (0.0%) |
| 35 to 44 Years | 0 (0.0%) | 3 (37.5%) |
| 45 to 54 Years | 4 (100.0%) | 3 (100.0%) |
| 55 to 64 Years | 20 (76.9%) | 22 (95.7%) |
| 65 to 74 Years | 13 (86.7%) | 17 (85.0%) |
| 75 Years and over | 10 (50.0%) | 6 (100.0%) |
| Total | 52 (59.1%) | 52 (85.3%) |
Income Below Poverty Among Married-Couple Families in Caney City
The poverty statistics for married-couple families in Caney City show that 15.7% or 8 of the total 51 families live below the poverty line. Families with 1 or 2 children have the highest poverty rate of 83.3%, comprising of 5 families. On the other hand, families with no children have the lowest poverty rate of 6.7%, which includes 3 families.
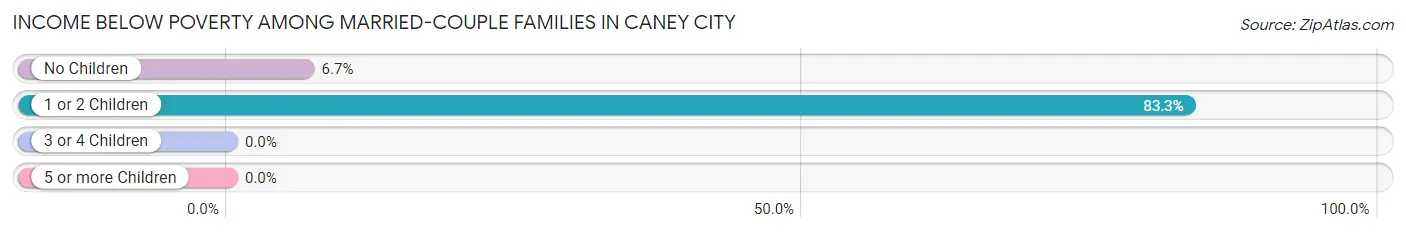
| Children | Above Poverty | Below Poverty |
| No Children | 42 (93.3%) | 3 (6.7%) |
| 1 or 2 Children | 1 (16.7%) | 5 (83.3%) |
| 3 or 4 Children | 0 (0.0%) | 0 (0.0%) |
| 5 or more Children | 0 (0.0%) | 0 (0.0%) |
| Total | 43 (84.3%) | 8 (15.7%) |
Income Below Poverty Among Single-Parent Households in Caney City
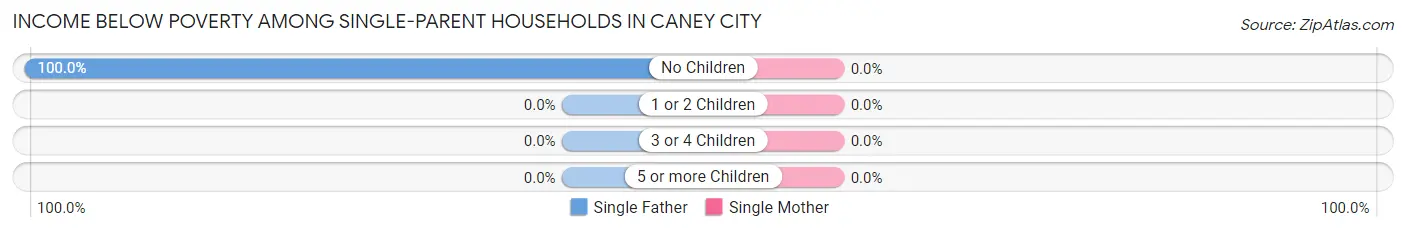
| Children | Single Father | Single Mother |
| No Children | 7 (100.0%) | 0 (0.0%) |
| 1 or 2 Children | 0 (0.0%) | 0 (0.0%) |
| 3 or 4 Children | 0 (0.0%) | 0 (0.0%) |
| 5 or more Children | 0 (0.0%) | 0 (0.0%) |
| Total | 7 (100.0%) | 0 (0.0%) |
Income Below Poverty Among Married-Couple vs Single-Parent Households in Caney City
The poverty data for Caney City shows that 8 of the married-couple family households (15.7%) and 7 of the single-parent households (70.0%) are living below the poverty level. Within the married-couple family households, those with 1 or 2 children have the highest poverty rate, with 5 households (83.3%) falling below the poverty line. Among the single-parent households, those with no children have the highest poverty rate, with 7 household (70.0%) living below poverty.
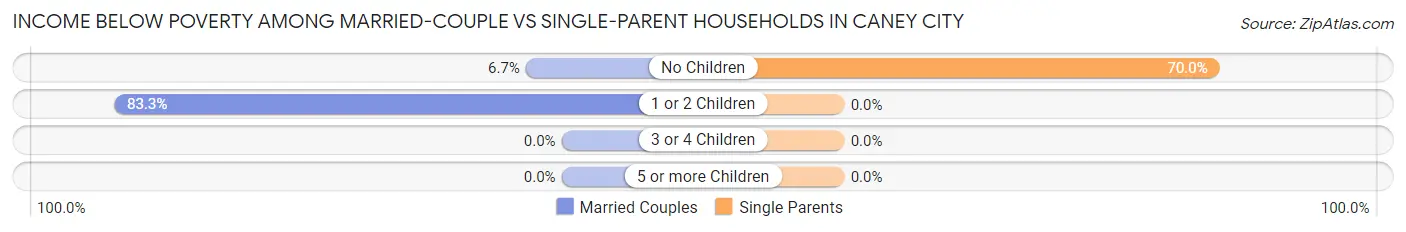
| Children | Married-Couple Families | Single-Parent Households |
| No Children | 3 (6.7%) | 7 (70.0%) |
| 1 or 2 Children | 5 (83.3%) | 0 (0.0%) |
| 3 or 4 Children | 0 (0.0%) | 0 (0.0%) |
| 5 or more Children | 0 (0.0%) | 0 (0.0%) |
| Total | 8 (15.7%) | 7 (70.0%) |
Race in Caney City
The most populous races in Caney City are White / Caucasian (81 | 54.4%), Black / African American (56 | 37.6%), and Two or more Races (11 | 7.4%).
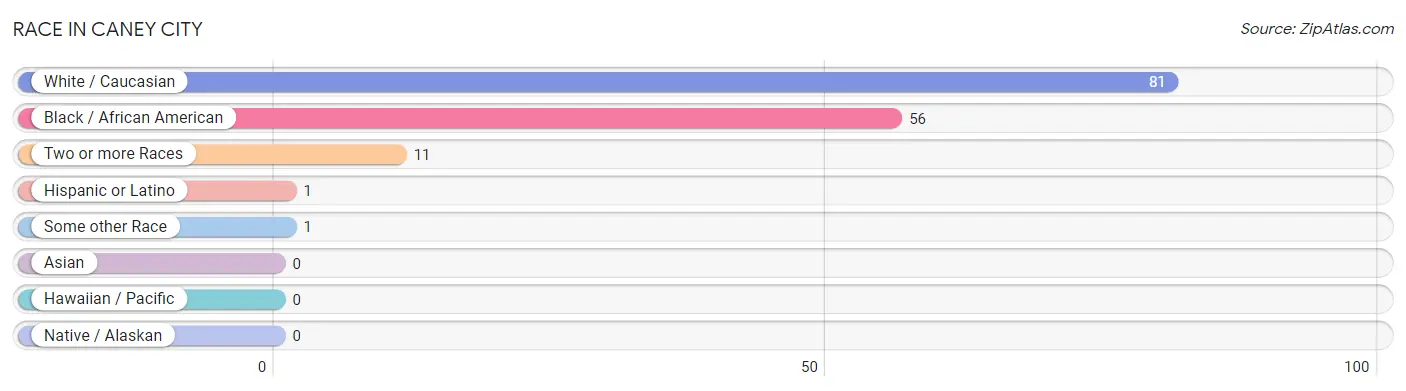
| Race | # Population | % Population |
| Asian | 0 | 0.0% |
| Black / African American | 56 | 37.6% |
| Hawaiian / Pacific | 0 | 0.0% |
| Hispanic or Latino | 1 | 0.7% |
| Native / Alaskan | 0 | 0.0% |
| White / Caucasian | 81 | 54.4% |
| Two or more Races | 11 | 7.4% |
| Some other Race | 1 | 0.7% |
| Total | 149 | 100.0% |
Ancestry in Caney City
The most populous ancestries reported in Caney City are American (14 | 9.4%), German (9 | 6.0%), European (6 | 4.0%), Irish (6 | 4.0%), and Czech (2 | 1.3%), together accounting for 24.8% of all Caney City residents.
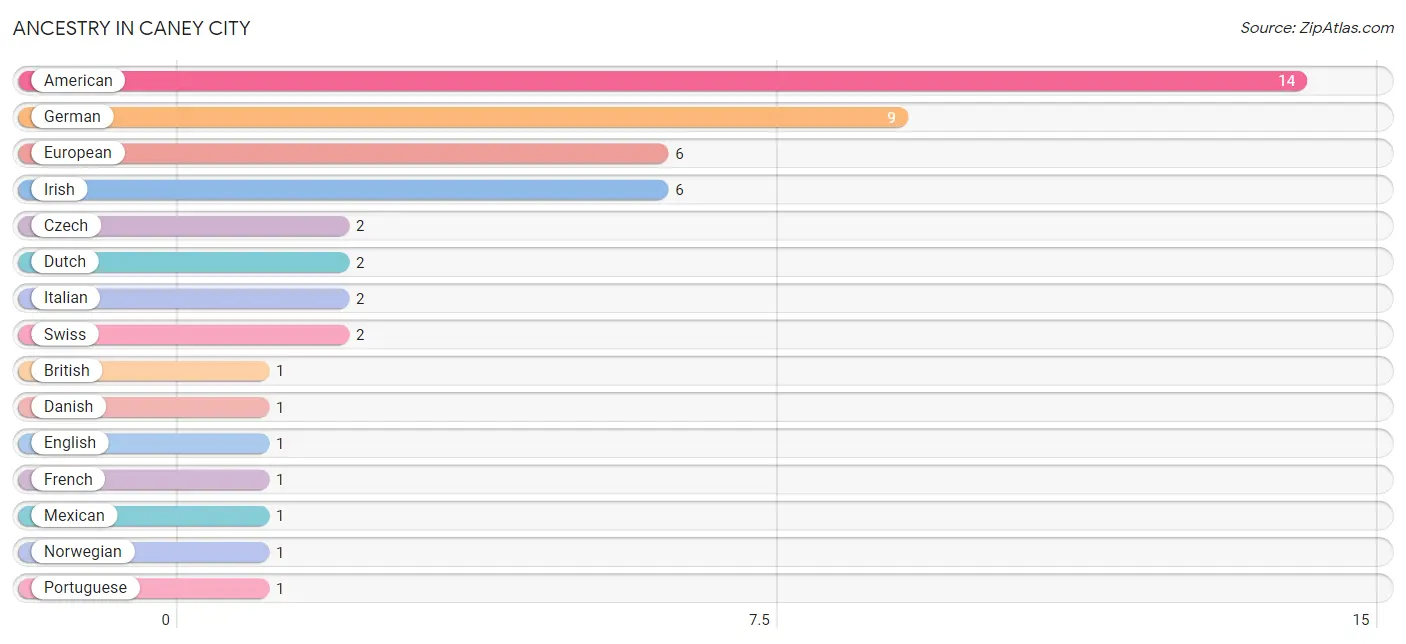
| Ancestry | # Population | % Population |
| American | 14 | 9.4% |
| British | 1 | 0.7% |
| Czech | 2 | 1.3% |
| Danish | 1 | 0.7% |
| Dutch | 2 | 1.3% |
| English | 1 | 0.7% |
| European | 6 | 4.0% |
| French | 1 | 0.7% |
| German | 9 | 6.0% |
| Irish | 6 | 4.0% |
| Italian | 2 | 1.3% |
| Mexican | 1 | 0.7% |
| Norwegian | 1 | 0.7% |
| Portuguese | 1 | 0.7% |
| Swedish | 1 | 0.7% |
| Swiss | 2 | 1.3% | View All 16 Rows |
Immigrants in Caney City

| Immigration Origin | # Population | % Population | View All 0 Rows |
Sex and Age in Caney City
Sex and Age in Caney City
The most populous age groups in Caney City are 55 to 59 Years (17 | 19.3%) for men and 55 to 59 Years (19 | 31.1%) for women.
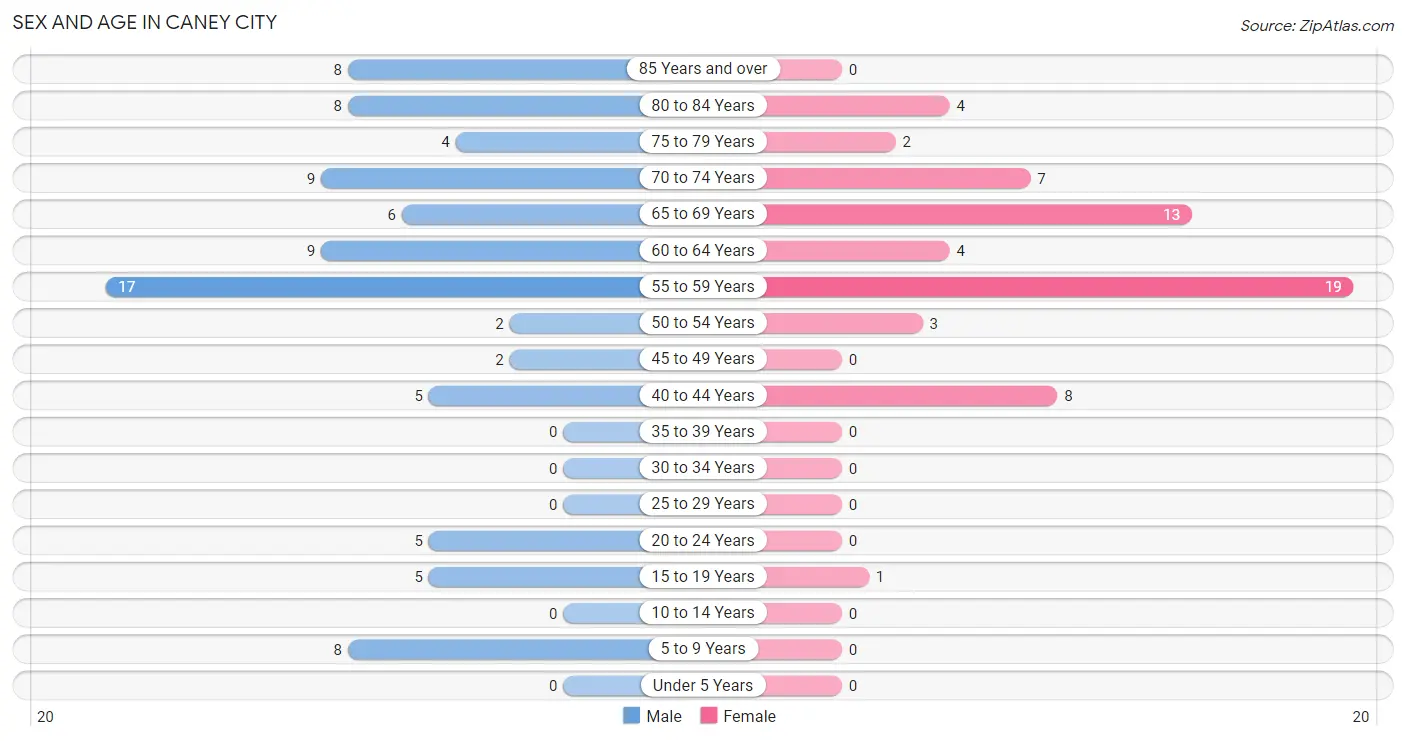
| Age Bracket | Male | Female |
| Under 5 Years | 0 (0.0%) | 0 (0.0%) |
| 5 to 9 Years | 8 (9.1%) | 0 (0.0%) |
| 10 to 14 Years | 0 (0.0%) | 0 (0.0%) |
| 15 to 19 Years | 5 (5.7%) | 1 (1.6%) |
| 20 to 24 Years | 5 (5.7%) | 0 (0.0%) |
| 25 to 29 Years | 0 (0.0%) | 0 (0.0%) |
| 30 to 34 Years | 0 (0.0%) | 0 (0.0%) |
| 35 to 39 Years | 0 (0.0%) | 0 (0.0%) |
| 40 to 44 Years | 5 (5.7%) | 8 (13.1%) |
| 45 to 49 Years | 2 (2.3%) | 0 (0.0%) |
| 50 to 54 Years | 2 (2.3%) | 3 (4.9%) |
| 55 to 59 Years | 17 (19.3%) | 19 (31.1%) |
| 60 to 64 Years | 9 (10.2%) | 4 (6.6%) |
| 65 to 69 Years | 6 (6.8%) | 13 (21.3%) |
| 70 to 74 Years | 9 (10.2%) | 7 (11.5%) |
| 75 to 79 Years | 4 (4.5%) | 2 (3.3%) |
| 80 to 84 Years | 8 (9.1%) | 4 (6.6%) |
| 85 Years and over | 8 (9.1%) | 0 (0.0%) |
| Total | 88 (100.0%) | 61 (100.0%) |
Families and Households in Caney City
Median Family Size in Caney City
The median family size in Caney City is 2.07 persons per family, with single female/mother families (3 | 4.9%) accounting for the largest median family size of 2.67 persons per family. On the other hand, single male/father families (7 | 11.5%) represent the smallest median family size with 1.71 persons per family.
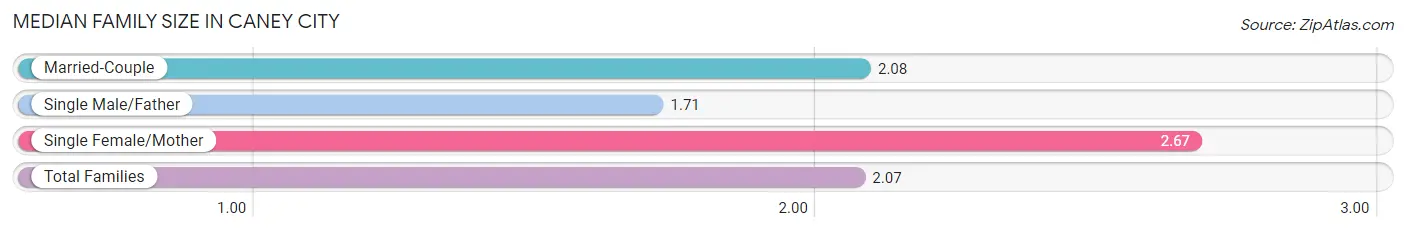
| Family Type | # Families | Family Size |
| Married-Couple | 51 (83.6%) | 2.08 |
| Single Male/Father | 7 (11.5%) | 1.71 |
| Single Female/Mother | 3 (4.9%) | 2.67 |
| Total Families | 61 (100.0%) | 2.07 |
Median Household Size in Caney City
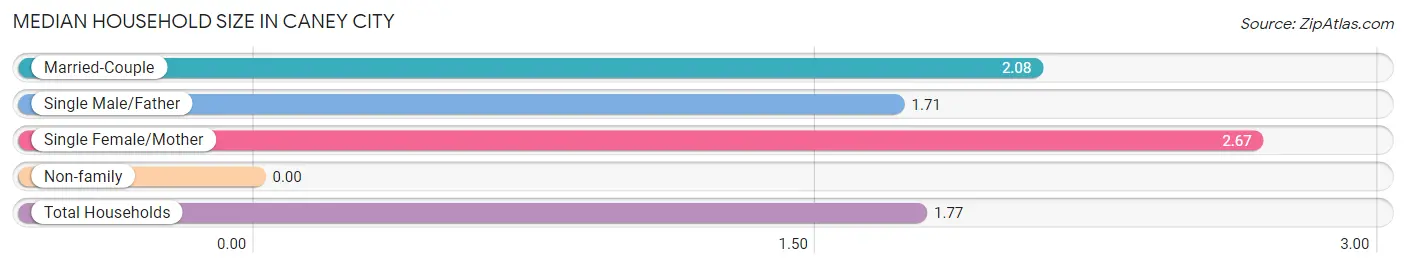
| Household Type | # Households | Household Size |
| Married-Couple | 51 (60.7%) | 2.08 |
| Single Male/Father | 7 (8.3%) | 1.71 |
| Single Female/Mother | 3 (3.6%) | 2.67 |
| Non-family | 23 (27.4%) | - |
| Total Households | 84 (100.0%) | 1.77 |
Household Size by Marriage Status in Caney City
Out of a total of 84 households in Caney City, 61 (72.6%) are family households, while 23 (27.4%) are nonfamily households. The most numerous type of family households are 2-person households, comprising 54, and the most common type of nonfamily households are 1-person households, comprising 23.
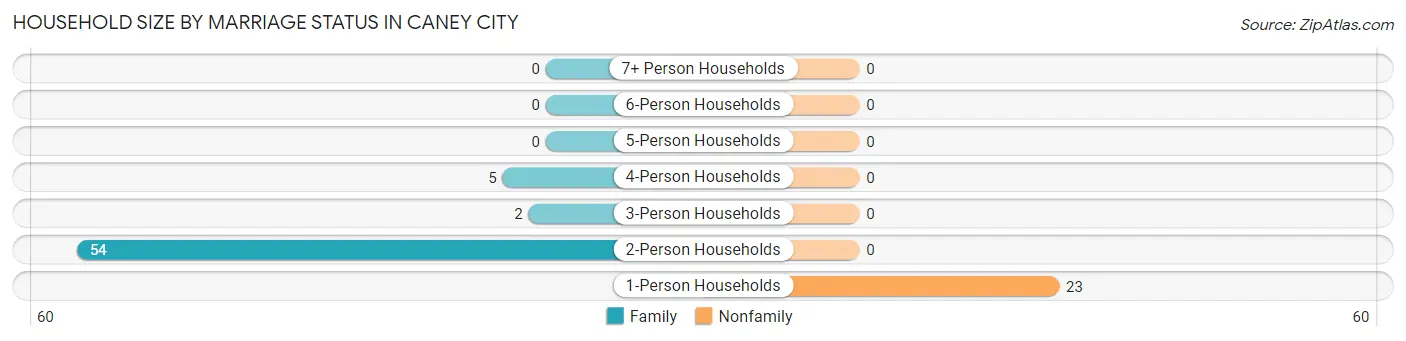
| Household Size | Family Households | Nonfamily Households |
| 1-Person Households | - | 23 (27.4%) |
| 2-Person Households | 54 (64.3%) | 0 (0.0%) |
| 3-Person Households | 2 (2.4%) | 0 (0.0%) |
| 4-Person Households | 5 (5.9%) | 0 (0.0%) |
| 5-Person Households | 0 (0.0%) | 0 (0.0%) |
| 6-Person Households | 0 (0.0%) | 0 (0.0%) |
| 7+ Person Households | 0 (0.0%) | 0 (0.0%) |
| Total | 61 (72.6%) | 23 (27.4%) |
Female Fertility in Caney City
Fertility by Age in Caney City
| Age Bracket | Women with Births | Births / 1,000 Women |
| 15 to 19 years | 0 (0.0%) | 0.0 |
| 20 to 34 years | 0 (0.0%) | 0.0 |
| 35 to 50 years | 0 (0.0%) | 0.0 |
| Total | 0 (0.0%) | 0.0 |
Fertility by Age by Marriage Status in Caney City
| Age Bracket | Married | Unmarried |
| 15 to 19 years | 0 (0.0%) | 0 (0.0%) |
| 20 to 34 years | 0 (0.0%) | 0 (0.0%) |
| 35 to 50 years | 0 (0.0%) | 0 (0.0%) |
| Total | 0 (0.0%) | 0 (0.0%) |
Fertility by Education in Caney City
| Educational Attainment | Women with Births | Births / 1,000 Women |
| Less than High School | 0 (0.0%) | 0.0 |
| High School Diploma | 0 (0.0%) | 0.0 |
| College or Associate's Degree | 0 (0.0%) | 0.0 |
| Bachelor's Degree | 0 (0.0%) | 0.0 |
| Graduate Degree | 0 (0.0%) | 0.0 |
| Total | 0 (0.0%) | 0.0 |
Fertility by Education by Marriage Status in Caney City
| Educational Attainment | Married | Unmarried |
| Less than High School | 0 (0.0%) | 0 (0.0%) |
| High School Diploma | 0 (0.0%) | 0 (0.0%) |
| College or Associate's Degree | 0 (0.0%) | 0 (0.0%) |
| Bachelor's Degree | 0 (0.0%) | 0 (0.0%) |
| Graduate Degree | 0 (0.0%) | 0 (0.0%) |
| Total | 0 (0.0%) | 0 (0.0%) |
Employment Characteristics in Caney City
Employment by Class of Employer in Caney City
Among the 58 employed individuals in Caney City, private company employees (26 | 44.8%), self-employed (not incorporated) (18 | 31.0%), and self-employed (incorporated) (6 | 10.3%) make up the most common classes of employment.
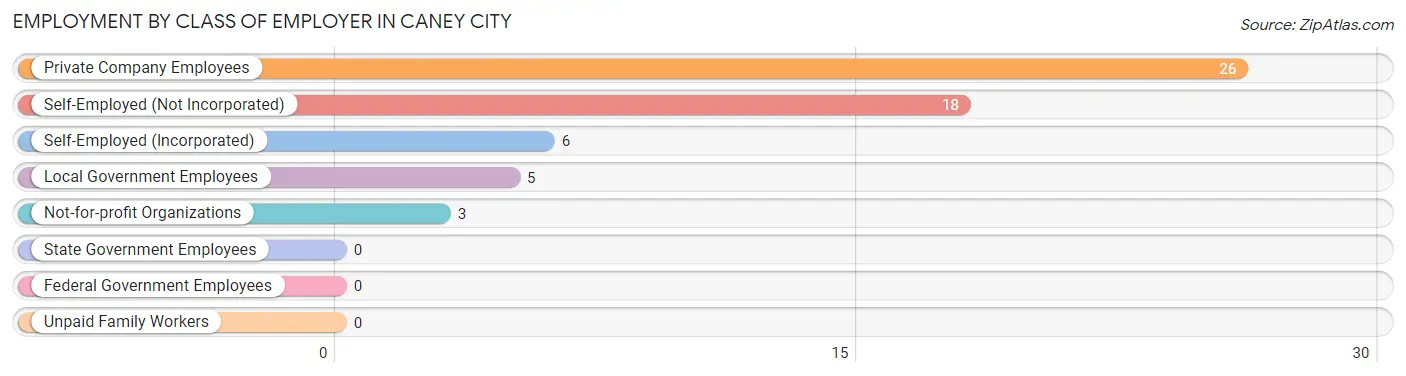
| Employer Class | # Employees | % Employees |
| Private Company Employees | 26 | 44.8% |
| Self-Employed (Incorporated) | 6 | 10.3% |
| Self-Employed (Not Incorporated) | 18 | 31.0% |
| Not-for-profit Organizations | 3 | 5.2% |
| Local Government Employees | 5 | 8.6% |
| State Government Employees | 0 | 0.0% |
| Federal Government Employees | 0 | 0.0% |
| Unpaid Family Workers | 0 | 0.0% |
| Total | 58 | 100.0% |
Employment Status by Age in Caney City
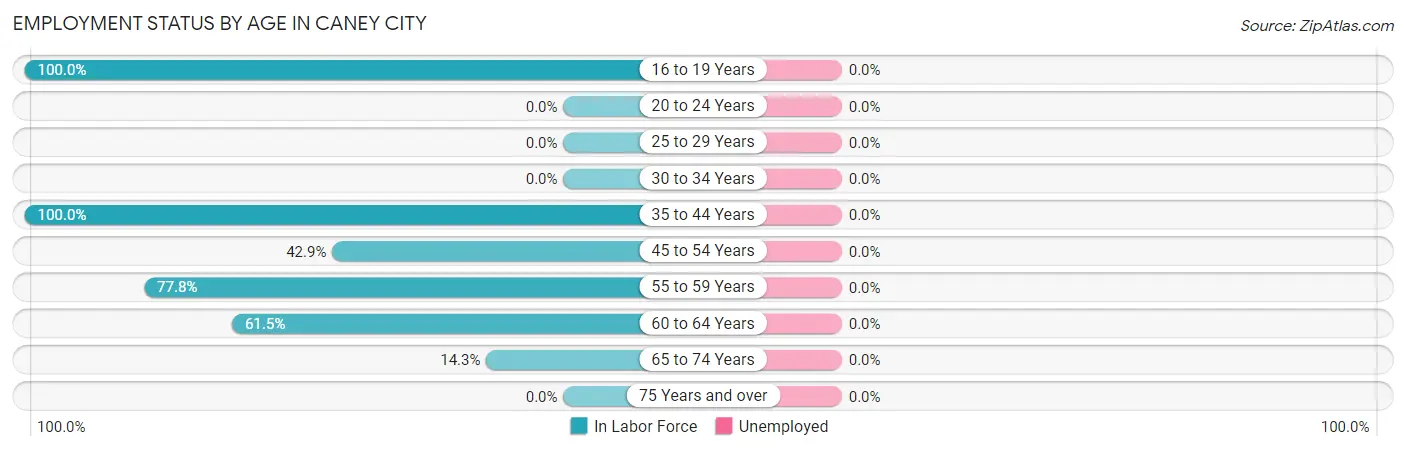
| Age Bracket | In Labor Force | Unemployed |
| 16 to 19 Years | 1 (100.0%) | 0 (0.0%) |
| 20 to 24 Years | 0 (0.0%) | 0 (0.0%) |
| 25 to 29 Years | 0 (0.0%) | 0 (0.0%) |
| 30 to 34 Years | 0 (0.0%) | 0 (0.0%) |
| 35 to 44 Years | 13 (100.0%) | 0 (0.0%) |
| 45 to 54 Years | 3 (42.9%) | 0 (0.0%) |
| 55 to 59 Years | 28 (77.8%) | 0 (0.0%) |
| 60 to 64 Years | 8 (61.5%) | 0 (0.0%) |
| 65 to 74 Years | 5 (14.3%) | 0 (0.0%) |
| 75 Years and over | 0 (0.0%) | 0 (0.0%) |
| Total | 58 (42.6%) | 0 (0.0%) |
Employment Status by Educational Attainment in Caney City
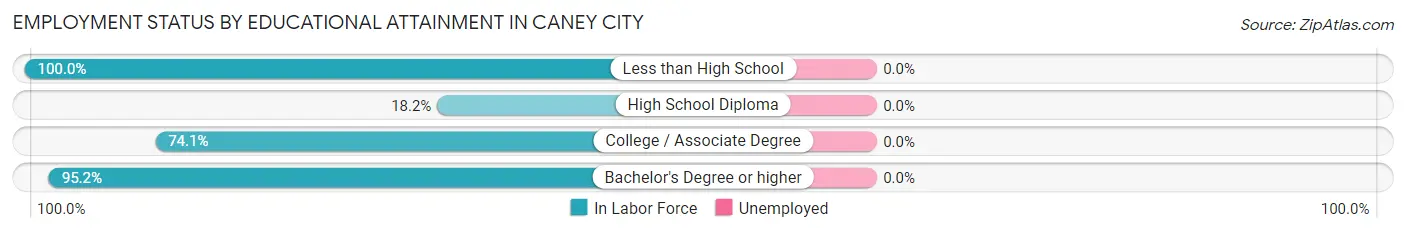
| Educational Attainment | In Labor Force | Unemployed |
| Less than High School | 10 (100.0%) | 0 (0.0%) |
| High School Diploma | 2 (18.2%) | 0 (0.0%) |
| College / Associate Degree | 20 (74.1%) | 0 (0.0%) |
| Bachelor's Degree or higher | 20 (95.2%) | 0 (0.0%) |
| Total | 52 (75.4%) | 0 (0.0%) |
Employment Occupations by Sex in Caney City
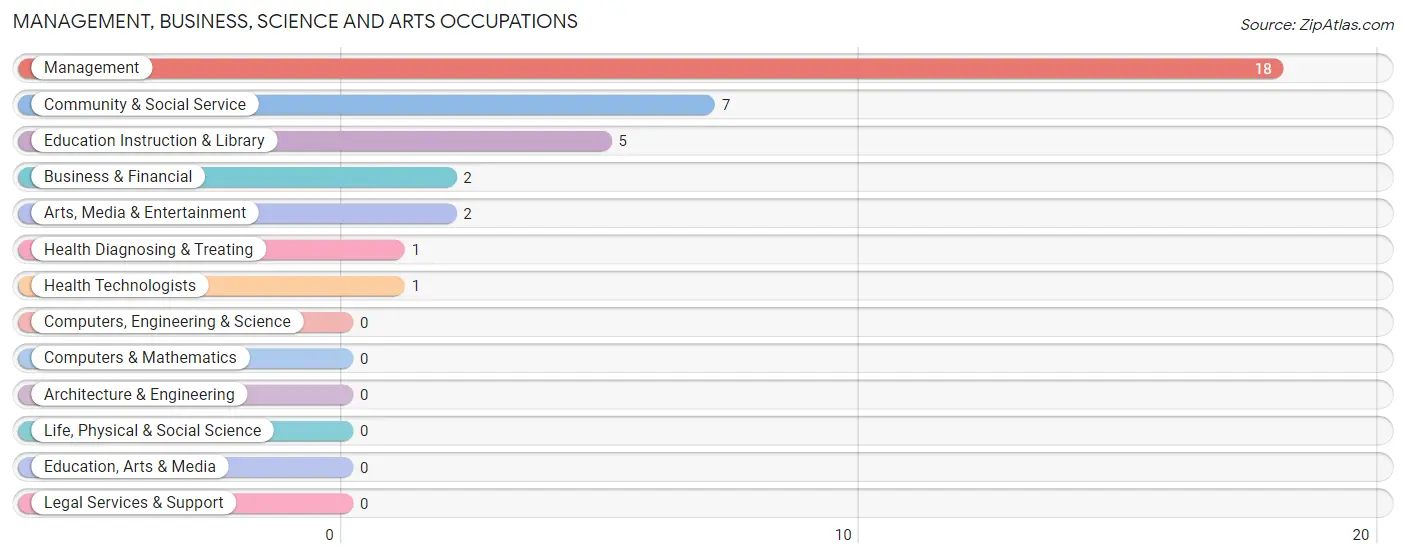
Management, Business, Science and Arts Occupations
The most common Management, Business, Science and Arts occupations in Caney City are Management (18 | 31.0%), Community & Social Service (7 | 12.1%), Education Instruction & Library (5 | 8.6%), Business & Financial (2 | 3.5%), and Arts, Media & Entertainment (2 | 3.5%).
Management, Business, Science and Arts Occupations by Sex
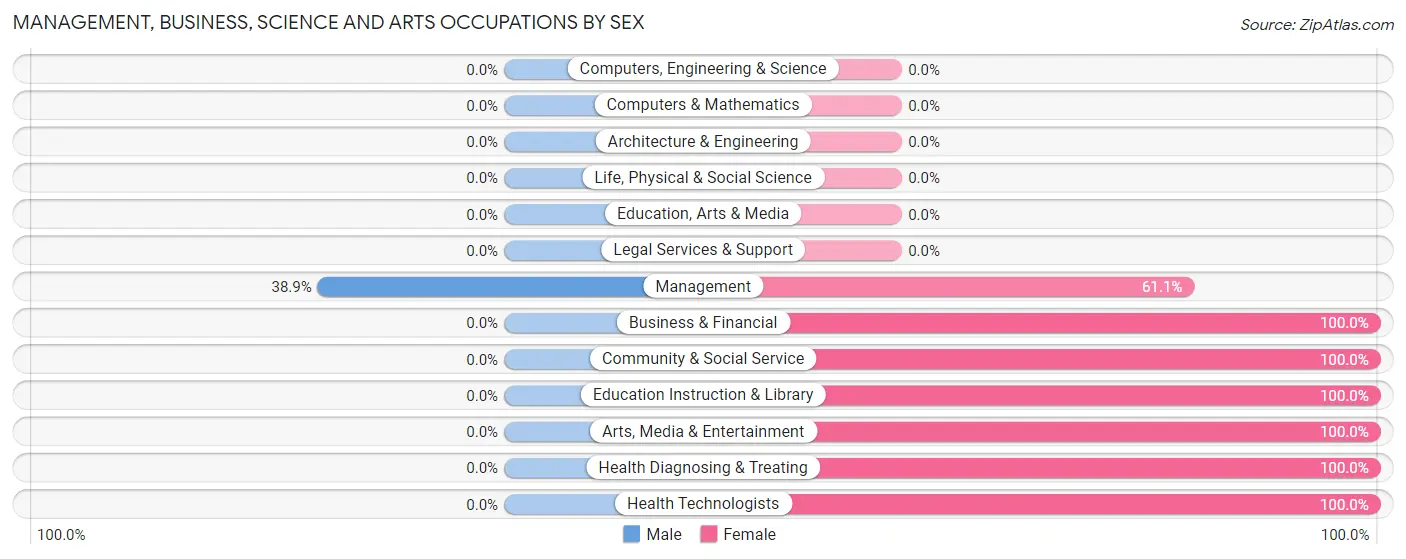
| Occupation | Male | Female |
| Management | 7 (38.9%) | 11 (61.1%) |
| Business & Financial | 0 (0.0%) | 2 (100.0%) |
| Computers, Engineering & Science | 0 (0.0%) | 0 (0.0%) |
| Computers & Mathematics | 0 (0.0%) | 0 (0.0%) |
| Architecture & Engineering | 0 (0.0%) | 0 (0.0%) |
| Life, Physical & Social Science | 0 (0.0%) | 0 (0.0%) |
| Community & Social Service | 0 (0.0%) | 7 (100.0%) |
| Education, Arts & Media | 0 (0.0%) | 0 (0.0%) |
| Legal Services & Support | 0 (0.0%) | 0 (0.0%) |
| Education Instruction & Library | 0 (0.0%) | 5 (100.0%) |
| Arts, Media & Entertainment | 0 (0.0%) | 2 (100.0%) |
| Health Diagnosing & Treating | 0 (0.0%) | 1 (100.0%) |
| Health Technologists | 0 (0.0%) | 1 (100.0%) |
| Total (Category) | 7 (25.0%) | 21 (75.0%) |
| Total (Overall) | 29 (50.0%) | 29 (50.0%) |
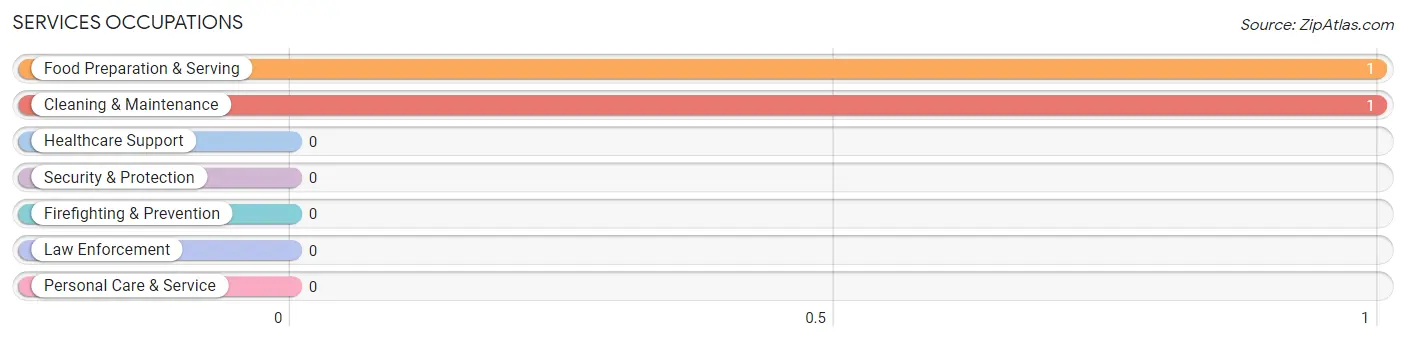
Services Occupations
The most common Services occupations in Caney City are Food Preparation & Serving (1 | 1.7%), and Cleaning & Maintenance (1 | 1.7%).
Services Occupations by Sex
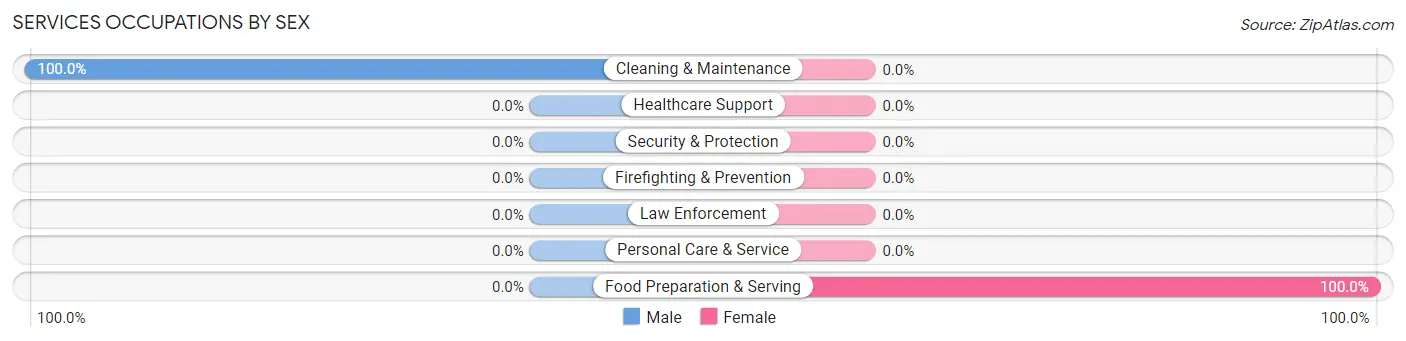
| Occupation | Male | Female |
| Healthcare Support | 0 (0.0%) | 0 (0.0%) |
| Security & Protection | 0 (0.0%) | 0 (0.0%) |
| Firefighting & Prevention | 0 (0.0%) | 0 (0.0%) |
| Law Enforcement | 0 (0.0%) | 0 (0.0%) |
| Food Preparation & Serving | 0 (0.0%) | 1 (100.0%) |
| Cleaning & Maintenance | 1 (100.0%) | 0 (0.0%) |
| Personal Care & Service | 0 (0.0%) | 0 (0.0%) |
| Total (Category) | 1 (50.0%) | 1 (50.0%) |
| Total (Overall) | 29 (50.0%) | 29 (50.0%) |
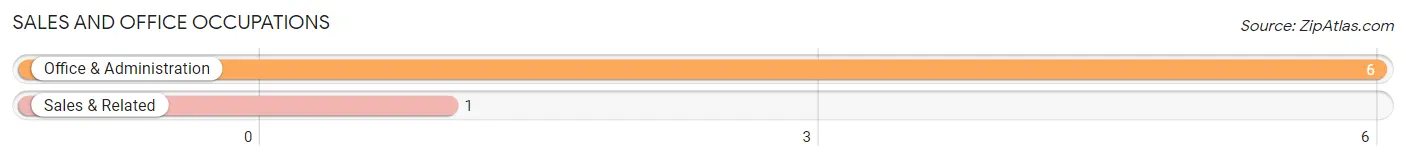
Sales and Office Occupations
The most common Sales and Office occupations in Caney City are Office & Administration (6 | 10.3%), and Sales & Related (1 | 1.7%).
Sales and Office Occupations by Sex
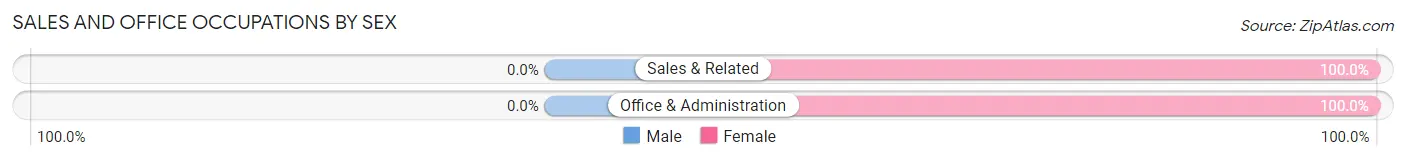
| Occupation | Male | Female |
| Sales & Related | 0 (0.0%) | 1 (100.0%) |
| Office & Administration | 0 (0.0%) | 6 (100.0%) |
| Total (Category) | 0 (0.0%) | 7 (100.0%) |
| Total (Overall) | 29 (50.0%) | 29 (50.0%) |
Natural Resources, Construction and Maintenance Occupations
The most common Natural Resources, Construction and Maintenance occupations in Caney City are , and Construction & Extraction (3 | 5.2%).
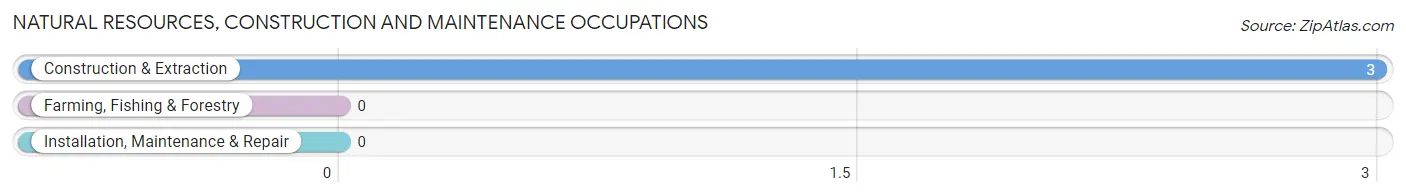
Natural Resources, Construction and Maintenance Occupations by Sex
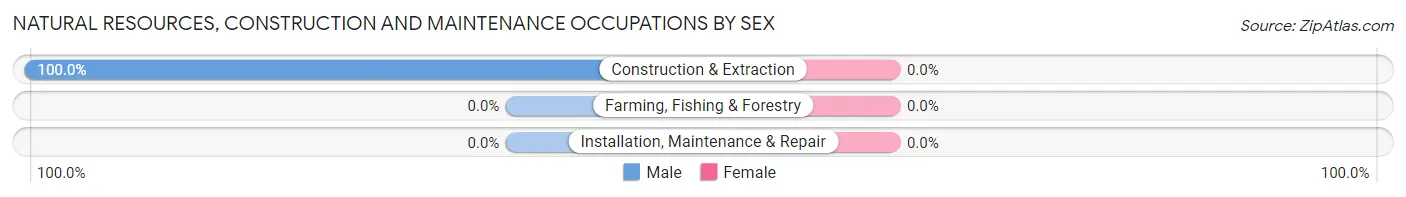
| Occupation | Male | Female |
| Farming, Fishing & Forestry | 0 (0.0%) | 0 (0.0%) |
| Construction & Extraction | 3 (100.0%) | 0 (0.0%) |
| Installation, Maintenance & Repair | 0 (0.0%) | 0 (0.0%) |
| Total (Category) | 3 (100.0%) | 0 (0.0%) |
| Total (Overall) | 29 (50.0%) | 29 (50.0%) |
Production, Transportation and Moving Occupations
The most common Production, Transportation and Moving occupations in Caney City are Production (10 | 17.2%), and Transportation (8 | 13.8%).
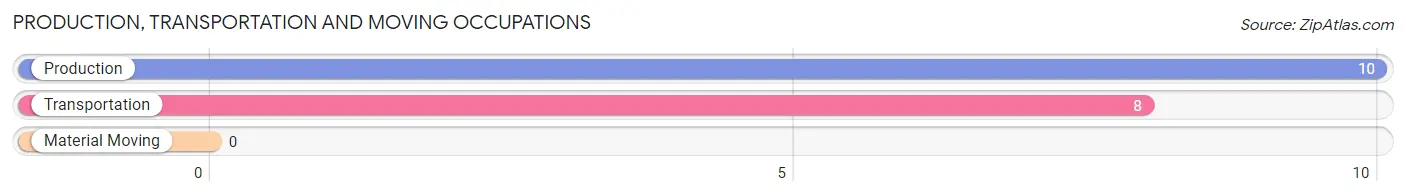
Production, Transportation and Moving Occupations by Sex
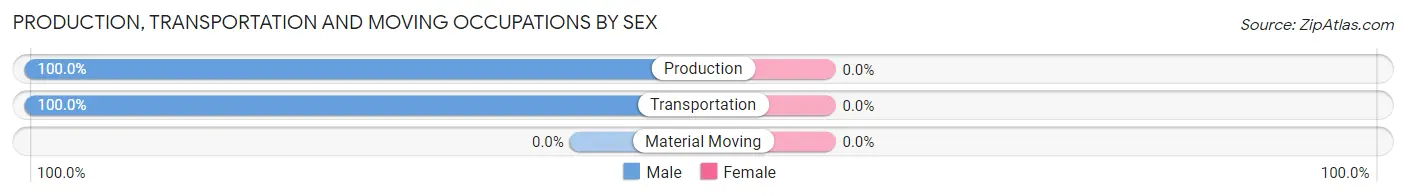
| Occupation | Male | Female |
| Production | 10 (100.0%) | 0 (0.0%) |
| Transportation | 8 (100.0%) | 0 (0.0%) |
| Material Moving | 0 (0.0%) | 0 (0.0%) |
| Total (Category) | 18 (100.0%) | 0 (0.0%) |
| Total (Overall) | 29 (50.0%) | 29 (50.0%) |
Employment Industries by Sex in Caney City
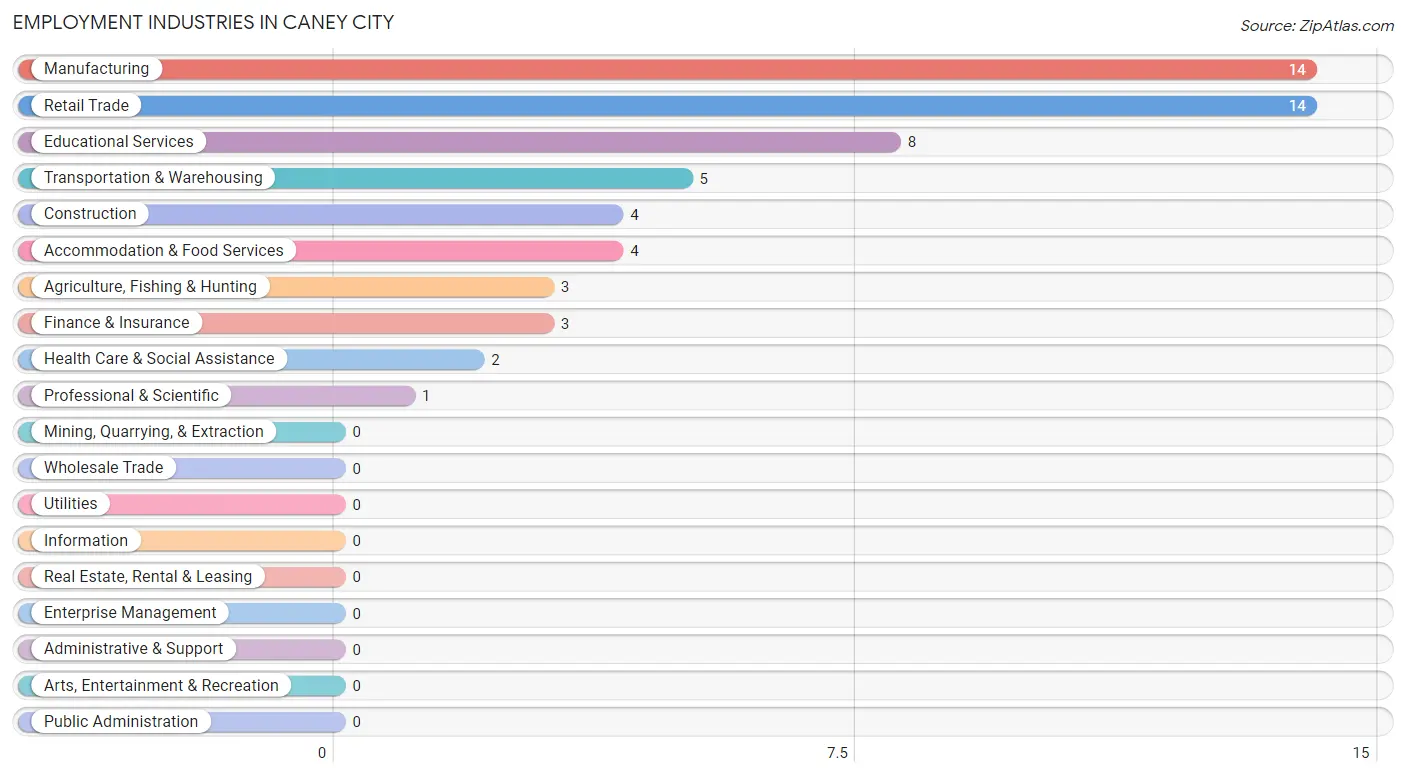
Employment Industries in Caney City
The major employment industries in Caney City include Manufacturing (14 | 24.1%), Retail Trade (14 | 24.1%), Educational Services (8 | 13.8%), Transportation & Warehousing (5 | 8.6%), and Construction (4 | 6.9%).
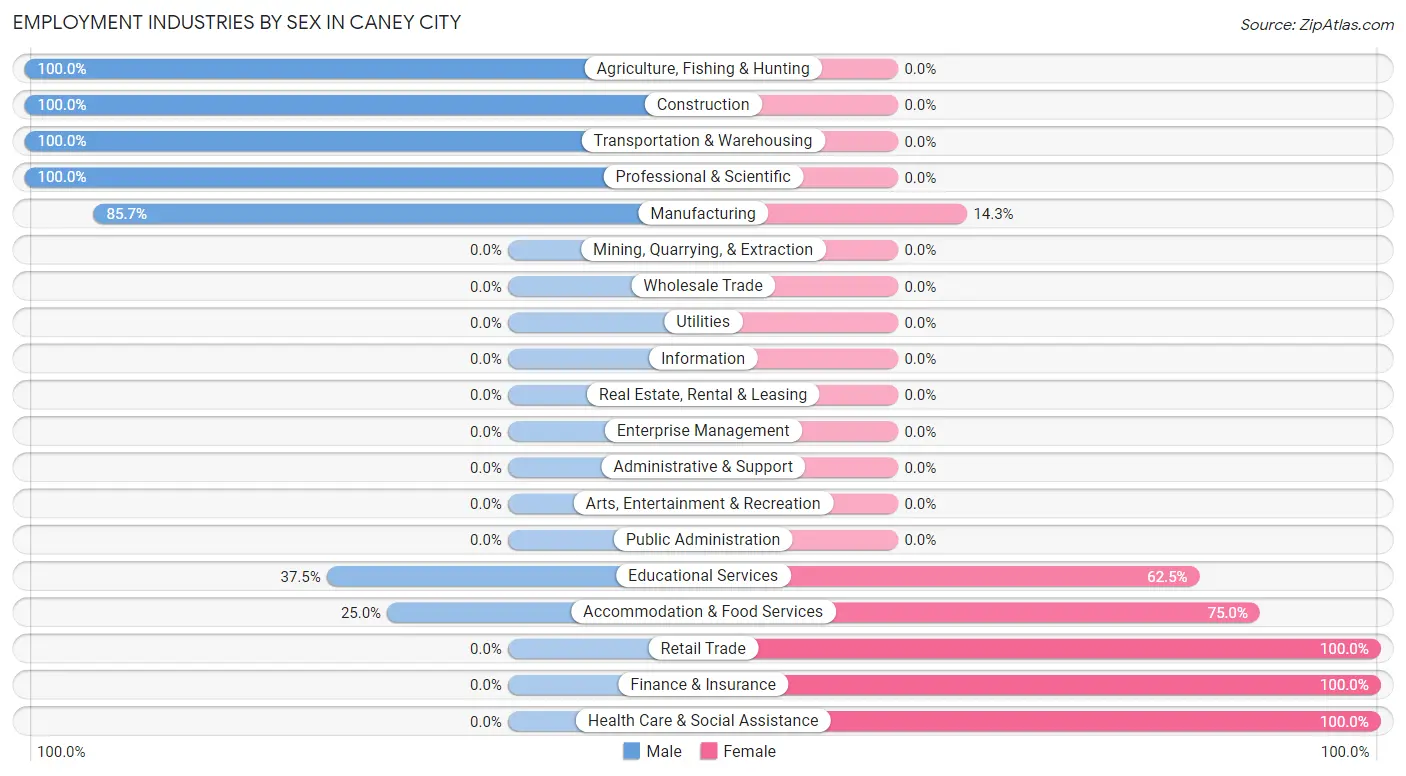
Employment Industries by Sex in Caney City
The Caney City industries that see more men than women are Agriculture, Fishing & Hunting (100.0%), Construction (100.0%), and Transportation & Warehousing (100.0%), whereas the industries that tend to have a higher number of women are Retail Trade (100.0%), Finance & Insurance (100.0%), and Health Care & Social Assistance (100.0%).
| Industry | Male | Female |
| Agriculture, Fishing & Hunting | 3 (100.0%) | 0 (0.0%) |
| Mining, Quarrying, & Extraction | 0 (0.0%) | 0 (0.0%) |
| Construction | 4 (100.0%) | 0 (0.0%) |
| Manufacturing | 12 (85.7%) | 2 (14.3%) |
| Wholesale Trade | 0 (0.0%) | 0 (0.0%) |
| Retail Trade | 0 (0.0%) | 14 (100.0%) |
| Transportation & Warehousing | 5 (100.0%) | 0 (0.0%) |
| Utilities | 0 (0.0%) | 0 (0.0%) |
| Information | 0 (0.0%) | 0 (0.0%) |
| Finance & Insurance | 0 (0.0%) | 3 (100.0%) |
| Real Estate, Rental & Leasing | 0 (0.0%) | 0 (0.0%) |
| Professional & Scientific | 1 (100.0%) | 0 (0.0%) |
| Enterprise Management | 0 (0.0%) | 0 (0.0%) |
| Administrative & Support | 0 (0.0%) | 0 (0.0%) |
| Educational Services | 3 (37.5%) | 5 (62.5%) |
| Health Care & Social Assistance | 0 (0.0%) | 2 (100.0%) |
| Arts, Entertainment & Recreation | 0 (0.0%) | 0 (0.0%) |
| Accommodation & Food Services | 1 (25.0%) | 3 (75.0%) |
| Public Administration | 0 (0.0%) | 0 (0.0%) |
| Total | 29 (50.0%) | 29 (50.0%) |
Education in Caney City
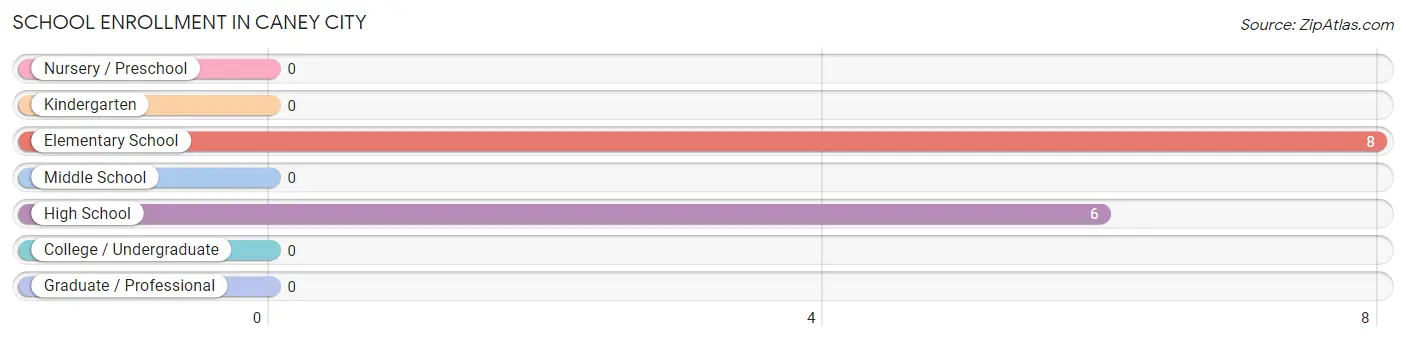
School Enrollment in Caney City
The most common levels of schooling among the 14 students in Caney City are elementary school (8 | 57.1%), and high school (6 | 42.9%).
| School Level | # Students | % Students |
| Nursery / Preschool | 0 | 0.0% |
| Kindergarten | 0 | 0.0% |
| Elementary School | 8 | 57.1% |
| Middle School | 0 | 0.0% |
| High School | 6 | 42.9% |
| College / Undergraduate | 0 | 0.0% |
| Graduate / Professional | 0 | 0.0% |
| Total | 14 | 100.0% |
School Enrollment by Age by Funding Source in Caney City
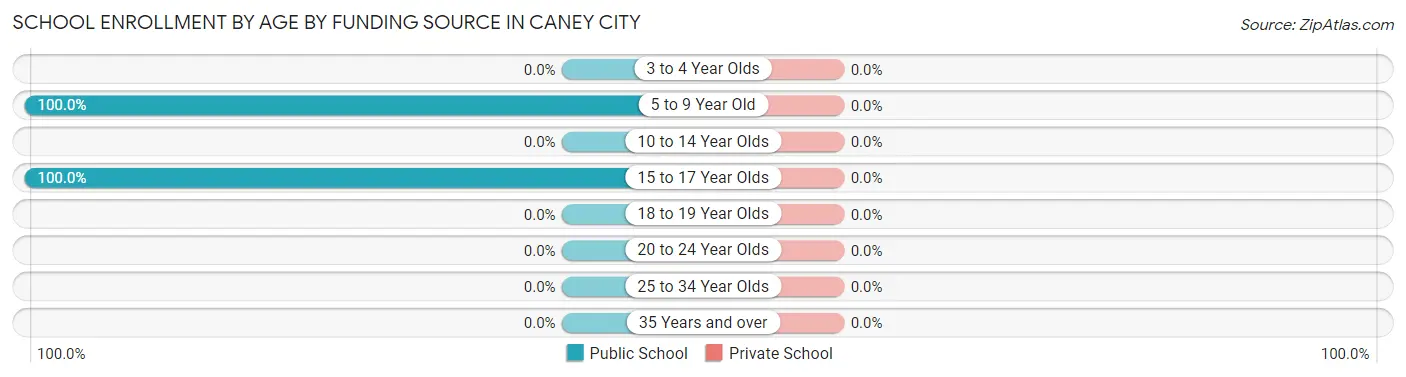
| Age Bracket | Public School | Private School |
| 3 to 4 Year Olds | 0 (0.0%) | 0 (0.0%) |
| 5 to 9 Year Old | 8 (100.0%) | 0 (0.0%) |
| 10 to 14 Year Olds | 0 (0.0%) | 0 (0.0%) |
| 15 to 17 Year Olds | 6 (100.0%) | 0 (0.0%) |
| 18 to 19 Year Olds | 0 (0.0%) | 0 (0.0%) |
| 20 to 24 Year Olds | 0 (0.0%) | 0 (0.0%) |
| 25 to 34 Year Olds | 0 (0.0%) | 0 (0.0%) |
| 35 Years and over | 0 (0.0%) | 0 (0.0%) |
| Total | 14 (100.0%) | 0 (0.0%) |
Educational Attainment by Field of Study in Caney City
Education (15 | 41.7%), computers & mathematics (8 | 22.2%), business (8 | 22.2%), visual & performing arts (2 | 5.6%), and bio, nature & agricultural (1 | 2.8%) are the most common fields of study among 36 individuals in Caney City who have obtained a bachelor's degree or higher.
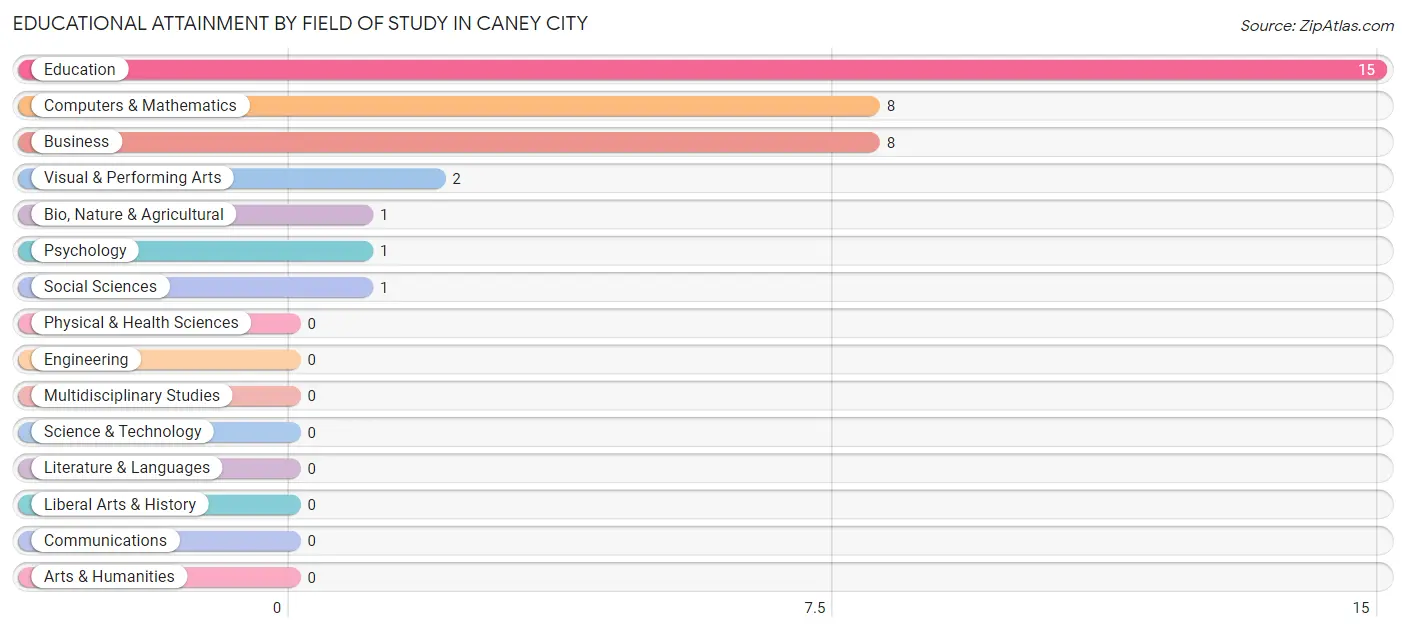
| Field of Study | # Graduates | % Graduates |
| Computers & Mathematics | 8 | 22.2% |
| Bio, Nature & Agricultural | 1 | 2.8% |
| Physical & Health Sciences | 0 | 0.0% |
| Psychology | 1 | 2.8% |
| Social Sciences | 1 | 2.8% |
| Engineering | 0 | 0.0% |
| Multidisciplinary Studies | 0 | 0.0% |
| Science & Technology | 0 | 0.0% |
| Business | 8 | 22.2% |
| Education | 15 | 41.7% |
| Literature & Languages | 0 | 0.0% |
| Liberal Arts & History | 0 | 0.0% |
| Visual & Performing Arts | 2 | 5.6% |
| Communications | 0 | 0.0% |
| Arts & Humanities | 0 | 0.0% |
| Total | 36 | 100.0% |
Transportation & Commute in Caney City
Vehicle Availability by Sex in Caney City
The most prevalent vehicle ownership categories in Caney City are males with 2 vehicles (16, accounting for 55.2%) and females with 2 vehicles (17, making up 55.2%).
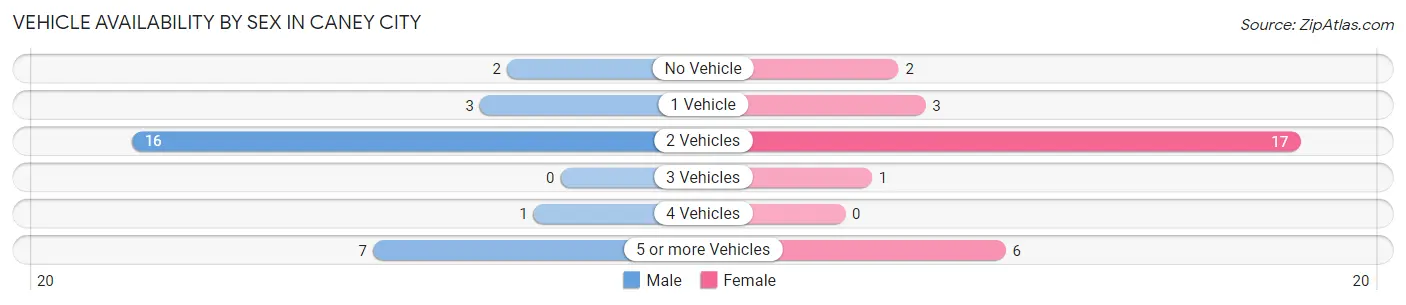
| Vehicles Available | Male | Female |
| No Vehicle | 2 (6.9%) | 2 (6.9%) |
| 1 Vehicle | 3 (10.3%) | 3 (10.3%) |
| 2 Vehicles | 16 (55.2%) | 17 (58.6%) |
| 3 Vehicles | 0 (0.0%) | 1 (3.5%) |
| 4 Vehicles | 1 (3.5%) | 0 (0.0%) |
| 5 or more Vehicles | 7 (24.1%) | 6 (20.7%) |
| Total | 29 (100.0%) | 29 (100.0%) |
Commute Time in Caney City
The most frequently occuring commute durations in Caney City are 30 to 34 minutes (24 commuters, 42.1%), 5 to 9 minutes (9 commuters, 15.8%), and 25 to 29 minutes (6 commuters, 10.5%).
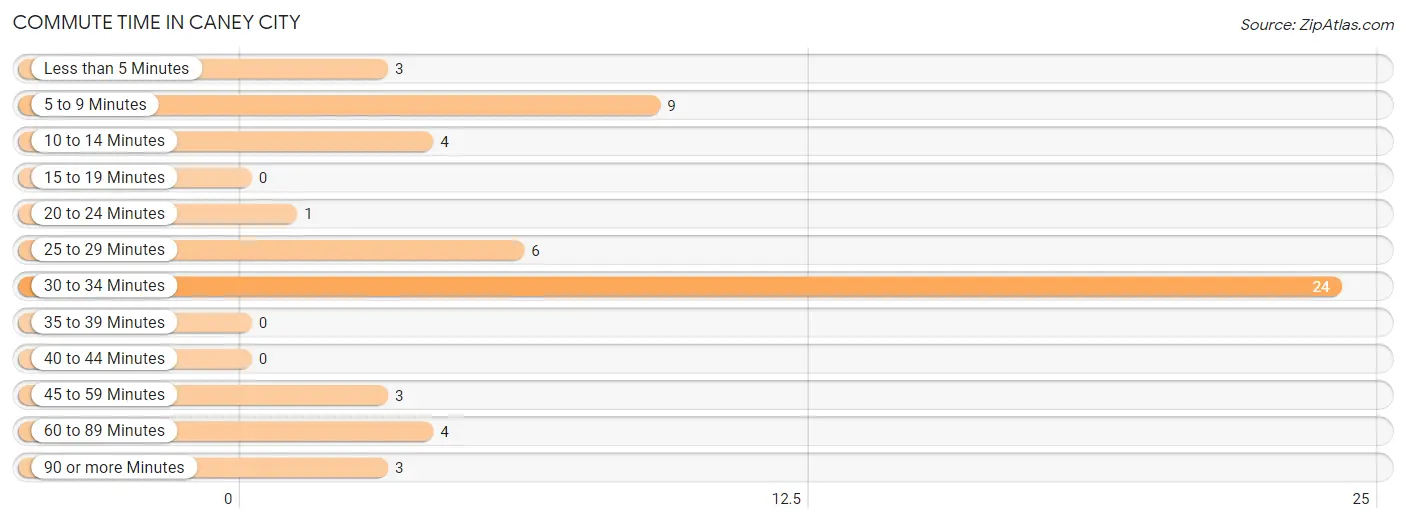
| Commute Time | # Commuters | % Commuters |
| Less than 5 Minutes | 3 | 5.3% |
| 5 to 9 Minutes | 9 | 15.8% |
| 10 to 14 Minutes | 4 | 7.0% |
| 15 to 19 Minutes | 0 | 0.0% |
| 20 to 24 Minutes | 1 | 1.8% |
| 25 to 29 Minutes | 6 | 10.5% |
| 30 to 34 Minutes | 24 | 42.1% |
| 35 to 39 Minutes | 0 | 0.0% |
| 40 to 44 Minutes | 0 | 0.0% |
| 45 to 59 Minutes | 3 | 5.3% |
| 60 to 89 Minutes | 4 | 7.0% |
| 90 or more Minutes | 3 | 5.3% |
Commute Time by Sex in Caney City
The most common commute times in Caney City are 30 to 34 minutes (12 commuters, 41.4%) for males and 30 to 34 minutes (12 commuters, 42.9%) for females.
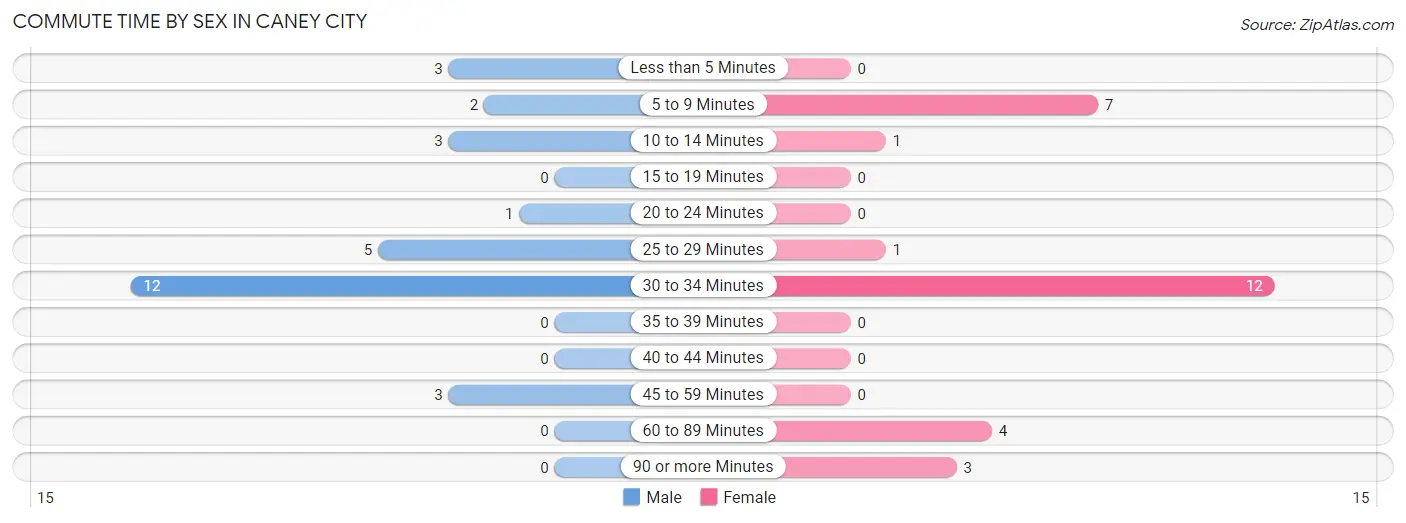
| Commute Time | Male | Female |
| Less than 5 Minutes | 3 (10.3%) | 0 (0.0%) |
| 5 to 9 Minutes | 2 (6.9%) | 7 (25.0%) |
| 10 to 14 Minutes | 3 (10.3%) | 1 (3.6%) |
| 15 to 19 Minutes | 0 (0.0%) | 0 (0.0%) |
| 20 to 24 Minutes | 1 (3.5%) | 0 (0.0%) |
| 25 to 29 Minutes | 5 (17.2%) | 1 (3.6%) |
| 30 to 34 Minutes | 12 (41.4%) | 12 (42.9%) |
| 35 to 39 Minutes | 0 (0.0%) | 0 (0.0%) |
| 40 to 44 Minutes | 0 (0.0%) | 0 (0.0%) |
| 45 to 59 Minutes | 3 (10.3%) | 0 (0.0%) |
| 60 to 89 Minutes | 0 (0.0%) | 4 (14.3%) |
| 90 or more Minutes | 0 (0.0%) | 3 (10.7%) |
Time of Departure to Work by Sex in Caney City
The most frequent times of departure to work in Caney City are 6:30 AM to 6:59 AM (13, 44.8%) for males and 6:00 AM to 6:29 AM (13, 46.4%) for females.
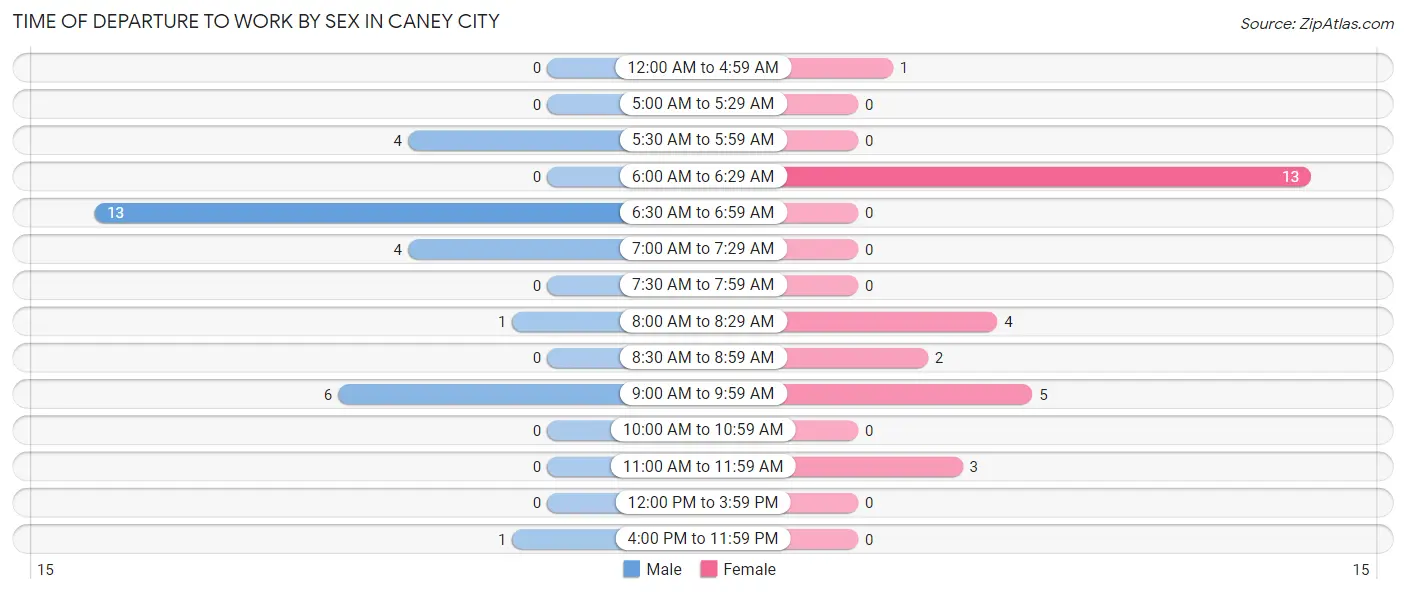
| Time of Departure | Male | Female |
| 12:00 AM to 4:59 AM | 0 (0.0%) | 1 (3.6%) |
| 5:00 AM to 5:29 AM | 0 (0.0%) | 0 (0.0%) |
| 5:30 AM to 5:59 AM | 4 (13.8%) | 0 (0.0%) |
| 6:00 AM to 6:29 AM | 0 (0.0%) | 13 (46.4%) |
| 6:30 AM to 6:59 AM | 13 (44.8%) | 0 (0.0%) |
| 7:00 AM to 7:29 AM | 4 (13.8%) | 0 (0.0%) |
| 7:30 AM to 7:59 AM | 0 (0.0%) | 0 (0.0%) |
| 8:00 AM to 8:29 AM | 1 (3.5%) | 4 (14.3%) |
| 8:30 AM to 8:59 AM | 0 (0.0%) | 2 (7.1%) |
| 9:00 AM to 9:59 AM | 6 (20.7%) | 5 (17.9%) |
| 10:00 AM to 10:59 AM | 0 (0.0%) | 0 (0.0%) |
| 11:00 AM to 11:59 AM | 0 (0.0%) | 3 (10.7%) |
| 12:00 PM to 3:59 PM | 0 (0.0%) | 0 (0.0%) |
| 4:00 PM to 11:59 PM | 1 (3.5%) | 0 (0.0%) |
| Total | 29 (100.0%) | 28 (100.0%) |
Housing Occupancy in Caney City
Occupancy by Ownership in Caney City
Of the total 84 dwellings in Caney City, owner-occupied units account for 66 (78.6%), while renter-occupied units make up 18 (21.4%).
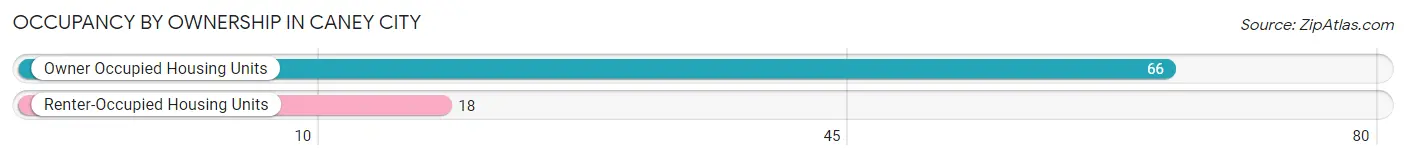
| Occupancy | # Housing Units | % Housing Units |
| Owner Occupied Housing Units | 66 | 78.6% |
| Renter-Occupied Housing Units | 18 | 21.4% |
| Total Occupied Housing Units | 84 | 100.0% |
Occupancy by Household Size in Caney City
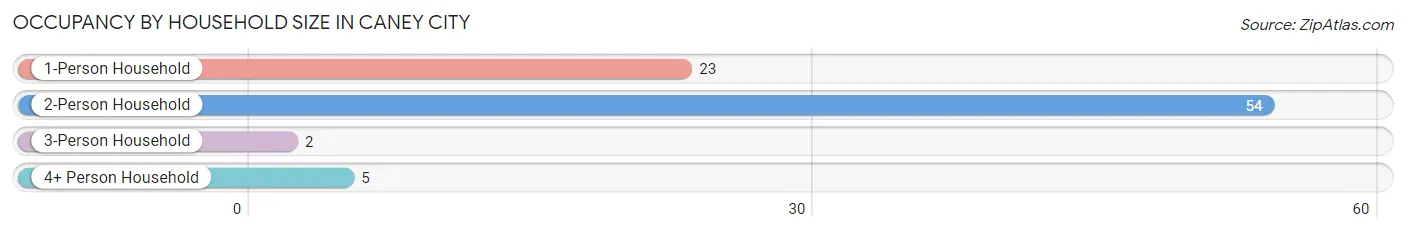
| Household Size | # Housing Units | % Housing Units |
| 1-Person Household | 23 | 27.4% |
| 2-Person Household | 54 | 64.3% |
| 3-Person Household | 2 | 2.4% |
| 4+ Person Household | 5 | 5.9% |
| Total Housing Units | 84 | 100.0% |
Occupancy by Ownership by Household Size in Caney City
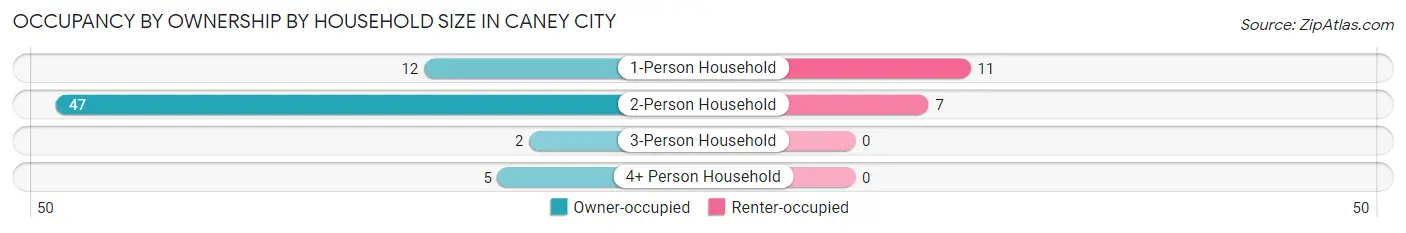
| Household Size | Owner-occupied | Renter-occupied |
| 1-Person Household | 12 (52.2%) | 11 (47.8%) |
| 2-Person Household | 47 (87.0%) | 7 (13.0%) |
| 3-Person Household | 2 (100.0%) | 0 (0.0%) |
| 4+ Person Household | 5 (100.0%) | 0 (0.0%) |
| Total Housing Units | 66 (78.6%) | 18 (21.4%) |
Occupancy by Educational Attainment in Caney City
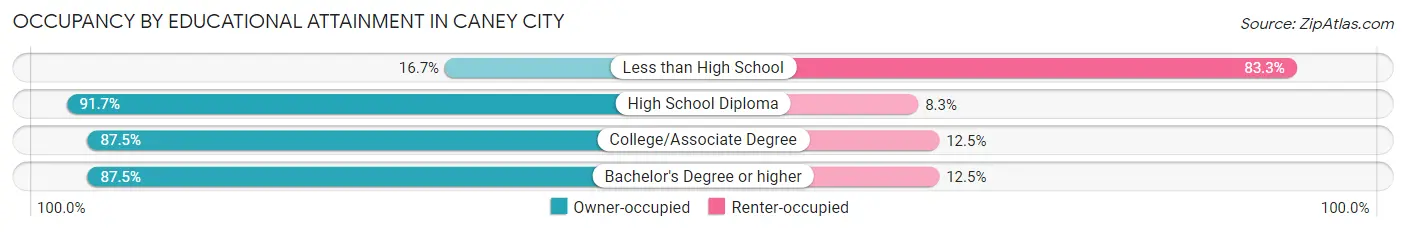
| Household Size | Owner-occupied | Renter-occupied |
| Less than High School | 2 (16.7%) | 10 (83.3%) |
| High School Diploma | 22 (91.7%) | 2 (8.3%) |
| College/Associate Degree | 21 (87.5%) | 3 (12.5%) |
| Bachelor's Degree or higher | 21 (87.5%) | 3 (12.5%) |
Occupancy by Age of Householder in Caney City
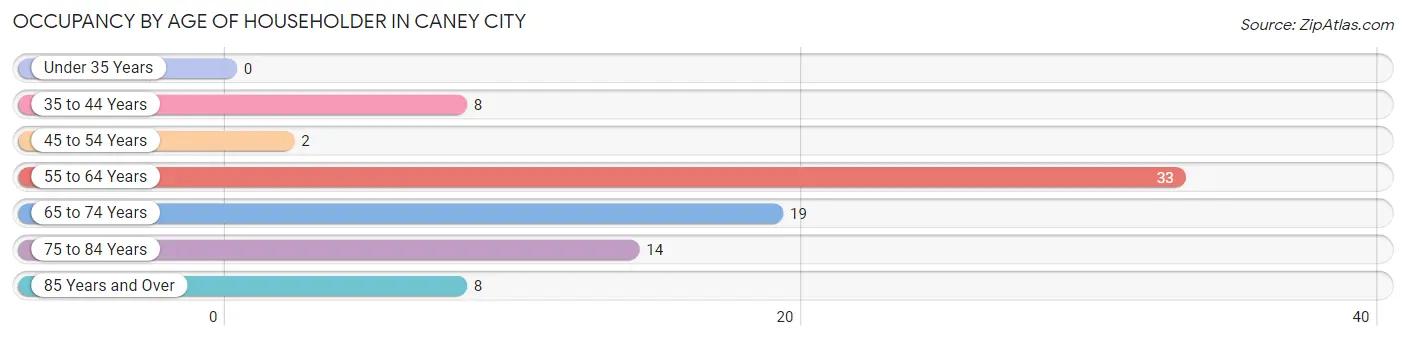
| Age Bracket | # Households | % Households |
| Under 35 Years | 0 | 0.0% |
| 35 to 44 Years | 8 | 9.5% |
| 45 to 54 Years | 2 | 2.4% |
| 55 to 64 Years | 33 | 39.3% |
| 65 to 74 Years | 19 | 22.6% |
| 75 to 84 Years | 14 | 16.7% |
| 85 Years and Over | 8 | 9.5% |
| Total | 84 | 100.0% |
Housing Finances in Caney City
Median Income by Occupancy in Caney City
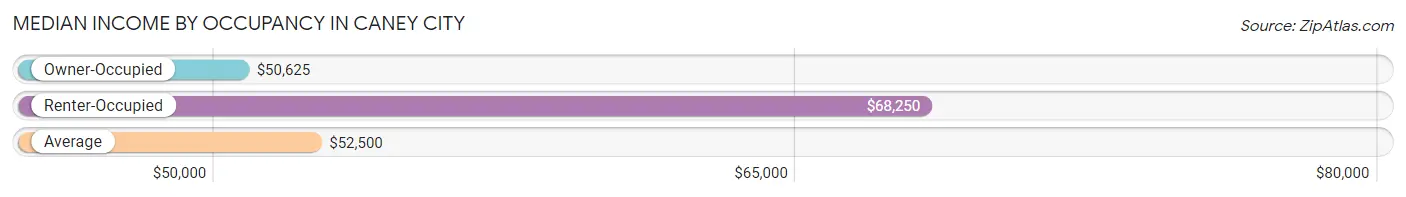
| Occupancy Type | # Households | Median Income |
| Owner-Occupied | 66 (78.6%) | $50,625 |
| Renter-Occupied | 18 (21.4%) | $68,250 |
| Average | 84 (100.0%) | $52,500 |
Occupancy by Householder Income Bracket in Caney City
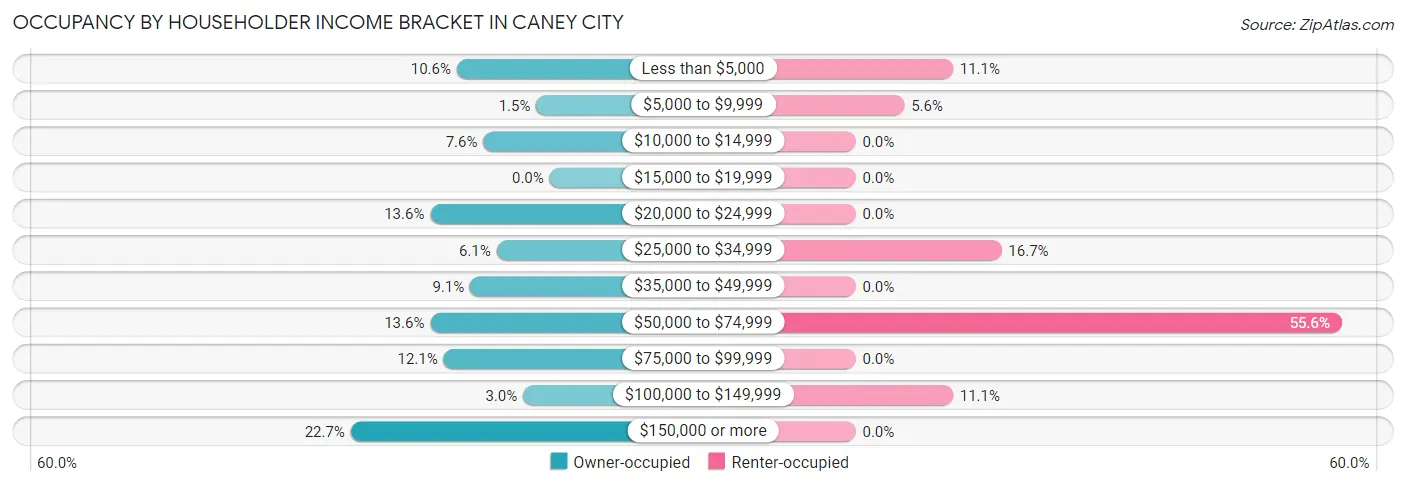
| Income Bracket | Owner-occupied | Renter-occupied |
| Less than $5,000 | 7 (10.6%) | 2 (11.1%) |
| $5,000 to $9,999 | 1 (1.5%) | 1 (5.6%) |
| $10,000 to $14,999 | 5 (7.6%) | 0 (0.0%) |
| $15,000 to $19,999 | 0 (0.0%) | 0 (0.0%) |
| $20,000 to $24,999 | 9 (13.6%) | 0 (0.0%) |
| $25,000 to $34,999 | 4 (6.1%) | 3 (16.7%) |
| $35,000 to $49,999 | 6 (9.1%) | 0 (0.0%) |
| $50,000 to $74,999 | 9 (13.6%) | 10 (55.6%) |
| $75,000 to $99,999 | 8 (12.1%) | 0 (0.0%) |
| $100,000 to $149,999 | 2 (3.0%) | 2 (11.1%) |
| $150,000 or more | 15 (22.7%) | 0 (0.0%) |
| Total | 66 (100.0%) | 18 (100.0%) |
Monthly Housing Cost Tiers in Caney City
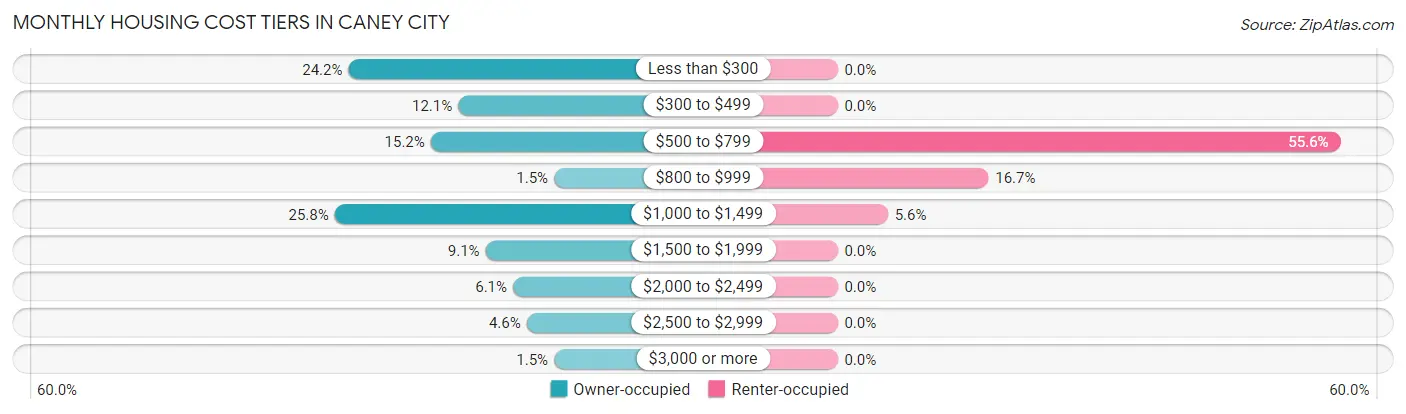
| Monthly Cost | Owner-occupied | Renter-occupied |
| Less than $300 | 16 (24.2%) | 0 (0.0%) |
| $300 to $499 | 8 (12.1%) | 0 (0.0%) |
| $500 to $799 | 10 (15.1%) | 10 (55.6%) |
| $800 to $999 | 1 (1.5%) | 3 (16.7%) |
| $1,000 to $1,499 | 17 (25.8%) | 1 (5.6%) |
| $1,500 to $1,999 | 6 (9.1%) | 0 (0.0%) |
| $2,000 to $2,499 | 4 (6.1%) | 0 (0.0%) |
| $2,500 to $2,999 | 3 (4.5%) | 0 (0.0%) |
| $3,000 or more | 1 (1.5%) | 0 (0.0%) |
| Total | 66 (100.0%) | 18 (100.0%) |
Physical Housing Characteristics in Caney City
Housing Structures in Caney City
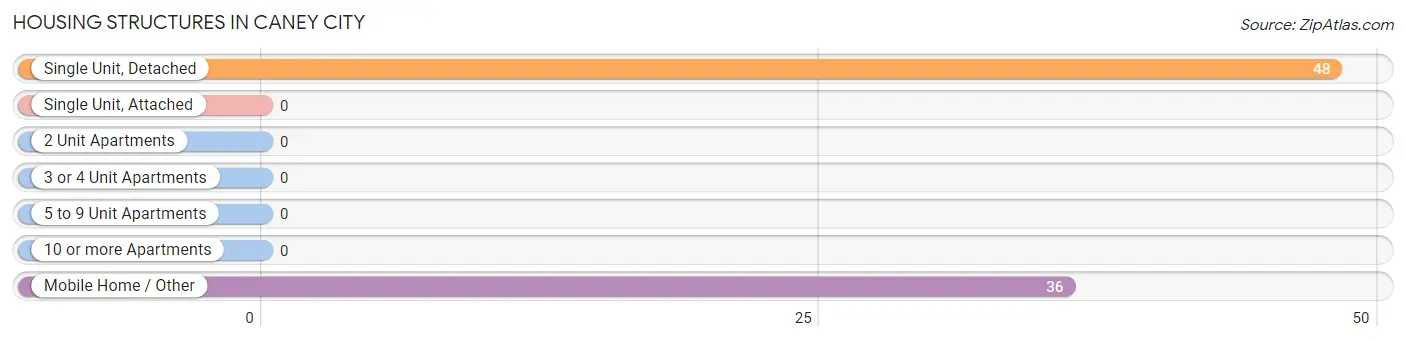
| Structure Type | # Housing Units | % Housing Units |
| Single Unit, Detached | 48 | 57.1% |
| Single Unit, Attached | 0 | 0.0% |
| 2 Unit Apartments | 0 | 0.0% |
| 3 or 4 Unit Apartments | 0 | 0.0% |
| 5 to 9 Unit Apartments | 0 | 0.0% |
| 10 or more Apartments | 0 | 0.0% |
| Mobile Home / Other | 36 | 42.9% |
| Total | 84 | 100.0% |
Housing Structures by Occupancy in Caney City
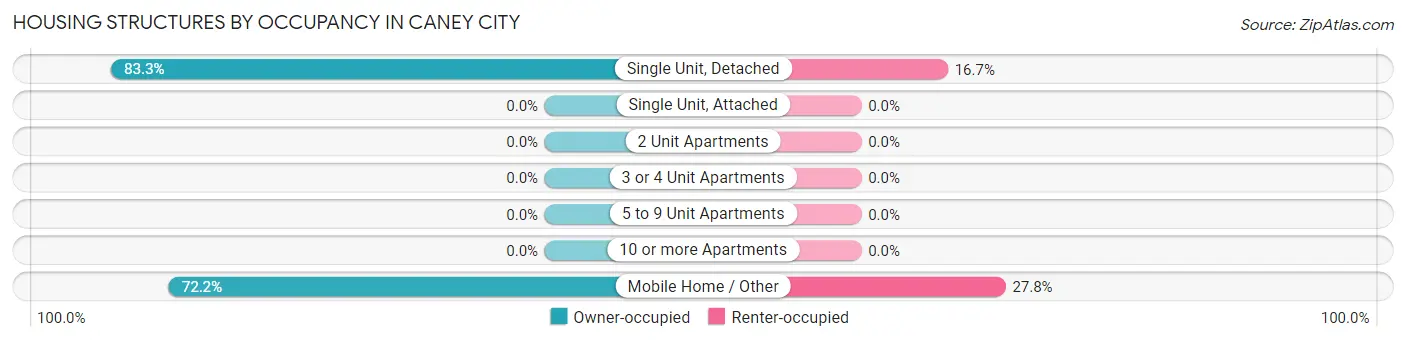
| Structure Type | Owner-occupied | Renter-occupied |
| Single Unit, Detached | 40 (83.3%) | 8 (16.7%) |
| Single Unit, Attached | 0 (0.0%) | 0 (0.0%) |
| 2 Unit Apartments | 0 (0.0%) | 0 (0.0%) |
| 3 or 4 Unit Apartments | 0 (0.0%) | 0 (0.0%) |
| 5 to 9 Unit Apartments | 0 (0.0%) | 0 (0.0%) |
| 10 or more Apartments | 0 (0.0%) | 0 (0.0%) |
| Mobile Home / Other | 26 (72.2%) | 10 (27.8%) |
| Total | 66 (78.6%) | 18 (21.4%) |
Housing Structures by Number of Rooms in Caney City
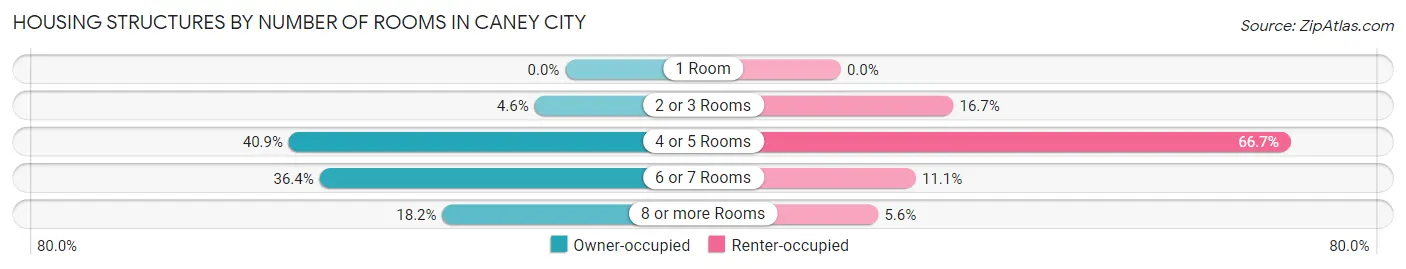
| Number of Rooms | Owner-occupied | Renter-occupied |
| 1 Room | 0 (0.0%) | 0 (0.0%) |
| 2 or 3 Rooms | 3 (4.5%) | 3 (16.7%) |
| 4 or 5 Rooms | 27 (40.9%) | 12 (66.7%) |
| 6 or 7 Rooms | 24 (36.4%) | 2 (11.1%) |
| 8 or more Rooms | 12 (18.2%) | 1 (5.6%) |
| Total | 66 (100.0%) | 18 (100.0%) |
Housing Structure by Heating Type in Caney City
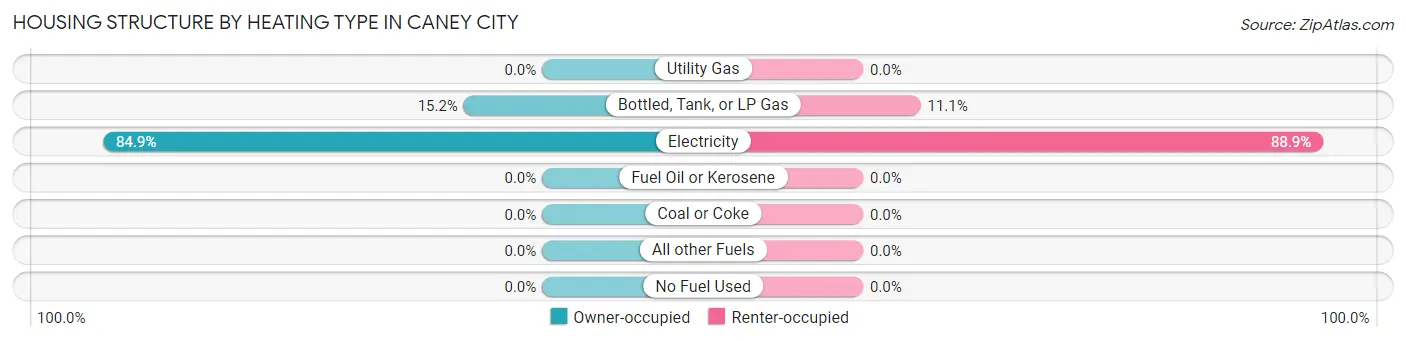
| Heating Type | Owner-occupied | Renter-occupied |
| Utility Gas | 0 (0.0%) | 0 (0.0%) |
| Bottled, Tank, or LP Gas | 10 (15.1%) | 2 (11.1%) |
| Electricity | 56 (84.9%) | 16 (88.9%) |
| Fuel Oil or Kerosene | 0 (0.0%) | 0 (0.0%) |
| Coal or Coke | 0 (0.0%) | 0 (0.0%) |
| All other Fuels | 0 (0.0%) | 0 (0.0%) |
| No Fuel Used | 0 (0.0%) | 0 (0.0%) |
| Total | 66 (100.0%) | 18 (100.0%) |
Household Vehicle Usage in Caney City
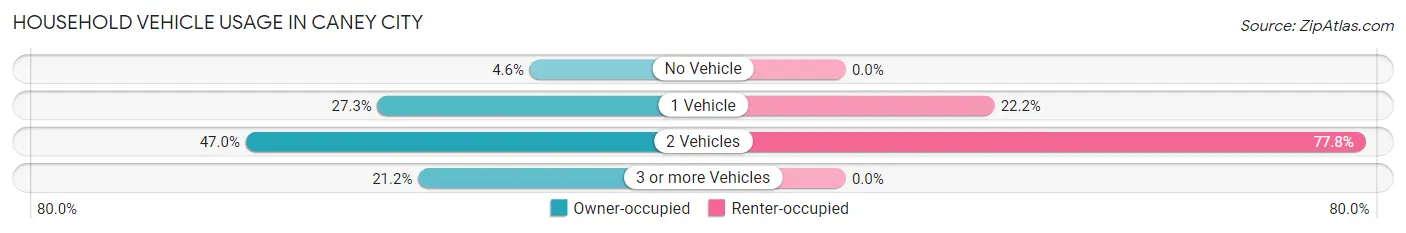
| Vehicles per Household | Owner-occupied | Renter-occupied |
| No Vehicle | 3 (4.5%) | 0 (0.0%) |
| 1 Vehicle | 18 (27.3%) | 4 (22.2%) |
| 2 Vehicles | 31 (47.0%) | 14 (77.8%) |
| 3 or more Vehicles | 14 (21.2%) | 0 (0.0%) |
| Total | 66 (100.0%) | 18 (100.0%) |
Real Estate & Mortgages in Caney City
Real Estate and Mortgage Overview in Caney City
| Characteristic | Without Mortgage | With Mortgage |
| Housing Units | 39 | 27 |
| Median Property Value | - | - |
| Median Household Income | $29,583 | $12 |
| Monthly Housing Costs | $325 | $1 |
| Real Estate Taxes | - | - |
Property Value by Mortgage Status in Caney City
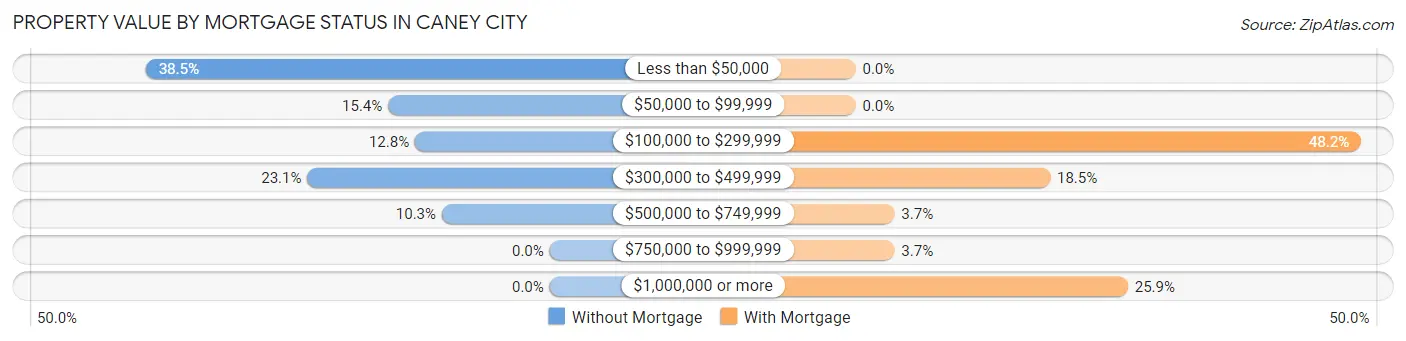
| Property Value | Without Mortgage | With Mortgage |
| Less than $50,000 | 15 (38.5%) | 0 (0.0%) |
| $50,000 to $99,999 | 6 (15.4%) | 0 (0.0%) |
| $100,000 to $299,999 | 5 (12.8%) | 13 (48.1%) |
| $300,000 to $499,999 | 9 (23.1%) | 5 (18.5%) |
| $500,000 to $749,999 | 4 (10.3%) | 1 (3.7%) |
| $750,000 to $999,999 | 0 (0.0%) | 1 (3.7%) |
| $1,000,000 or more | 0 (0.0%) | 7 (25.9%) |
| Total | 39 (100.0%) | 27 (100.0%) |
Household Income by Mortgage Status in Caney City
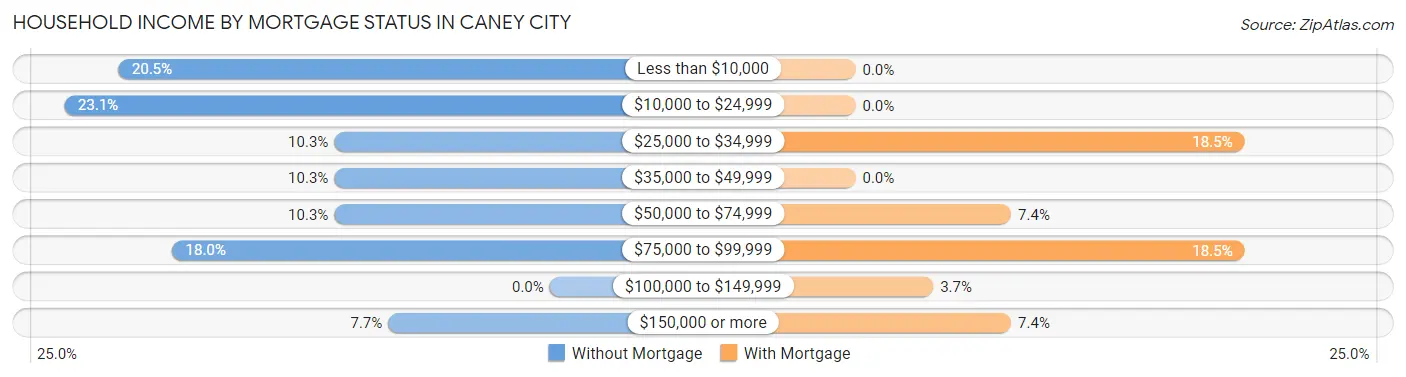
| Household Income | Without Mortgage | With Mortgage |
| Less than $10,000 | 8 (20.5%) | 0 (0.0%) |
| $10,000 to $24,999 | 9 (23.1%) | 0 (0.0%) |
| $25,000 to $34,999 | 4 (10.3%) | 5 (18.5%) |
| $35,000 to $49,999 | 4 (10.3%) | 0 (0.0%) |
| $50,000 to $74,999 | 4 (10.3%) | 2 (7.4%) |
| $75,000 to $99,999 | 7 (17.9%) | 5 (18.5%) |
| $100,000 to $149,999 | 0 (0.0%) | 1 (3.7%) |
| $150,000 or more | 3 (7.7%) | 2 (7.4%) |
| Total | 39 (100.0%) | 27 (100.0%) |
Property Value to Household Income Ratio in Caney City
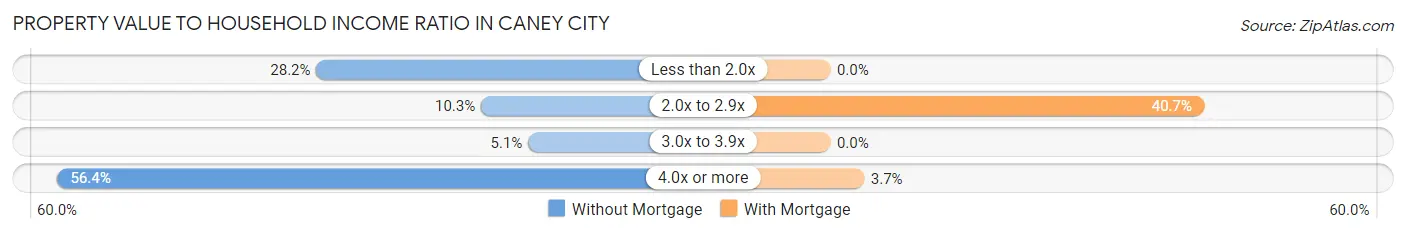
| Value-to-Income Ratio | Without Mortgage | With Mortgage |
| Less than 2.0x | 11 (28.2%) | 0 (0.0%) |
| 2.0x to 2.9x | 4 (10.3%) | 11 (40.7%) |
| 3.0x to 3.9x | 2 (5.1%) | 0 (0.0%) |
| 4.0x or more | 22 (56.4%) | 1 (3.7%) |
| Total | 39 (100.0%) | 27 (100.0%) |
Real Estate Taxes by Mortgage Status in Caney City
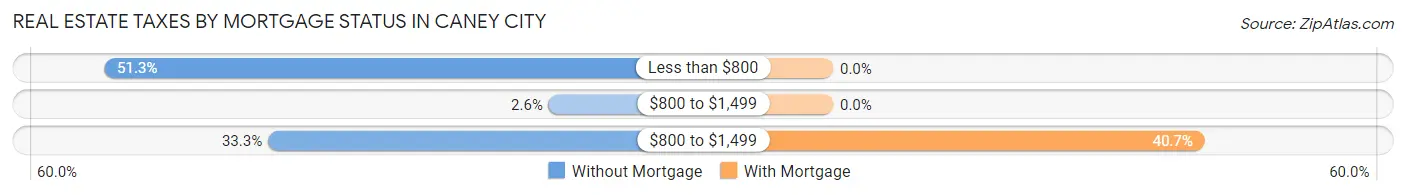
| Property Taxes | Without Mortgage | With Mortgage |
| Less than $800 | 20 (51.3%) | 0 (0.0%) |
| $800 to $1,499 | 1 (2.6%) | 0 (0.0%) |
| $800 to $1,499 | 13 (33.3%) | 11 (40.7%) |
| Total | 39 (100.0%) | 27 (100.0%) |
Health & Disability in Caney City
Health Insurance Coverage by Age in Caney City
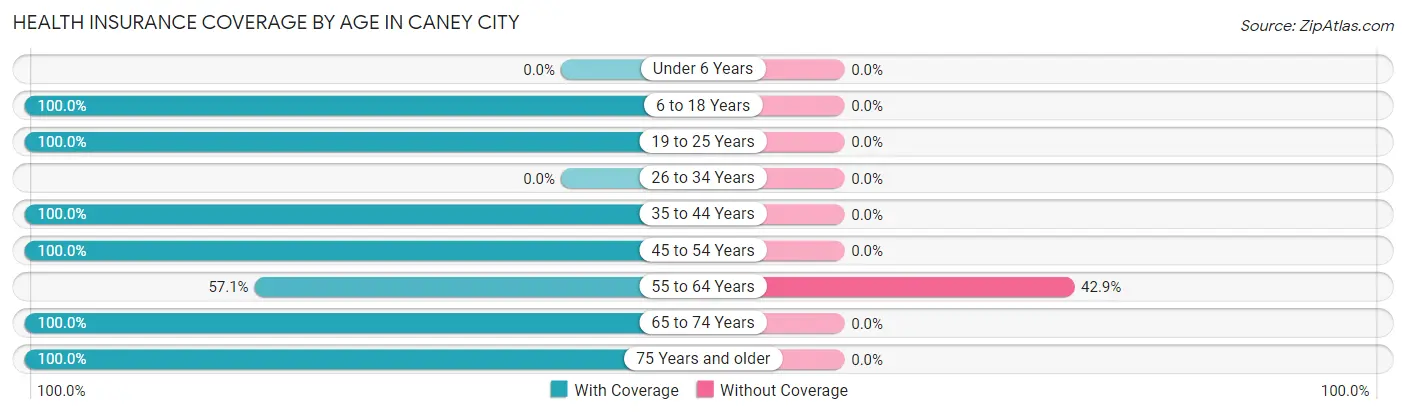
| Age Bracket | With Coverage | Without Coverage |
| Under 6 Years | 0 (0.0%) | 0 (0.0%) |
| 6 to 18 Years | 14 (100.0%) | 0 (0.0%) |
| 19 to 25 Years | 5 (100.0%) | 0 (0.0%) |
| 26 to 34 Years | 0 (0.0%) | 0 (0.0%) |
| 35 to 44 Years | 13 (100.0%) | 0 (0.0%) |
| 45 to 54 Years | 7 (100.0%) | 0 (0.0%) |
| 55 to 64 Years | 28 (57.1%) | 21 (42.9%) |
| 65 to 74 Years | 35 (100.0%) | 0 (0.0%) |
| 75 Years and older | 26 (100.0%) | 0 (0.0%) |
| Total | 128 (85.9%) | 21 (14.1%) |
Health Insurance Coverage by Citizenship Status in Caney City
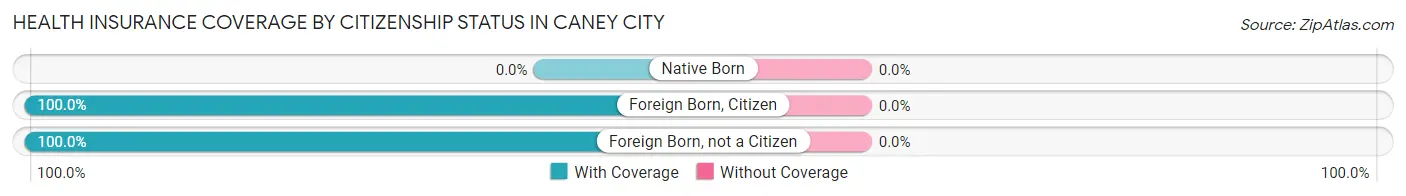
| Citizenship Status | With Coverage | Without Coverage |
| Native Born | 0 (0.0%) | 0 (0.0%) |
| Foreign Born, Citizen | 14 (100.0%) | 0 (0.0%) |
| Foreign Born, not a Citizen | 5 (100.0%) | 0 (0.0%) |
Health Insurance Coverage by Household Income in Caney City
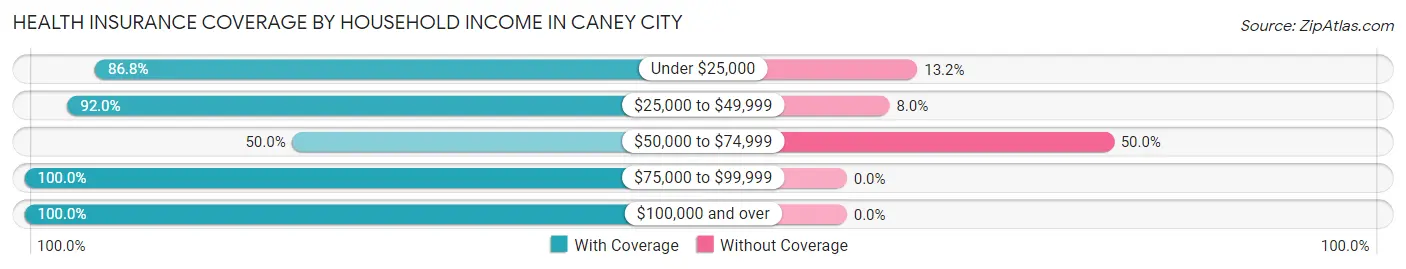
| Household Income | With Coverage | Without Coverage |
| Under $25,000 | 46 (86.8%) | 7 (13.2%) |
| $25,000 to $49,999 | 23 (92.0%) | 2 (8.0%) |
| $50,000 to $74,999 | 12 (50.0%) | 12 (50.0%) |
| $75,000 to $99,999 | 17 (100.0%) | 0 (0.0%) |
| $100,000 and over | 30 (100.0%) | 0 (0.0%) |
Public vs Private Health Insurance Coverage by Age in Caney City
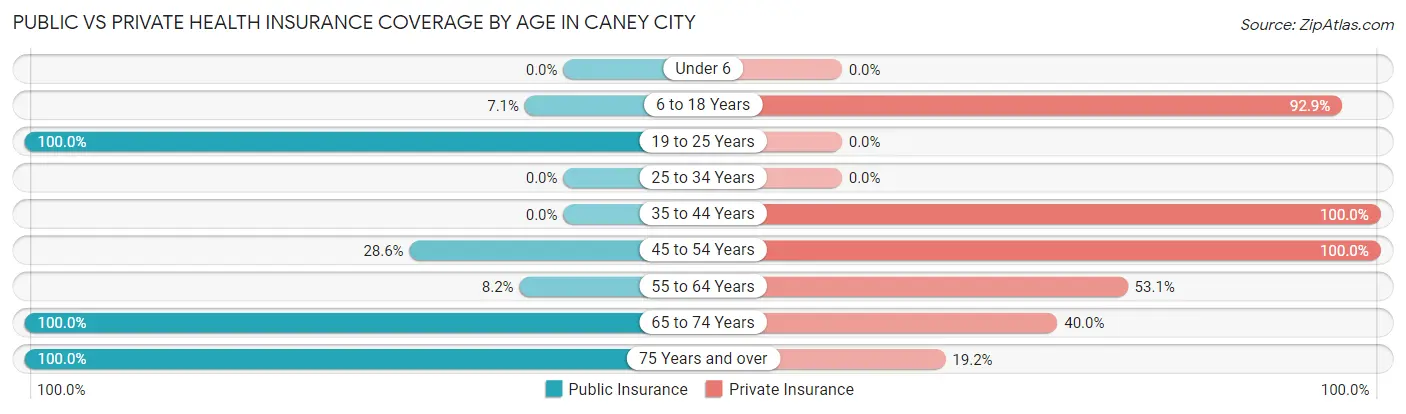
| Age Bracket | Public Insurance | Private Insurance |
| Under 6 | 0 (0.0%) | 0 (0.0%) |
| 6 to 18 Years | 1 (7.1%) | 13 (92.9%) |
| 19 to 25 Years | 5 (100.0%) | 0 (0.0%) |
| 25 to 34 Years | 0 (0.0%) | 0 (0.0%) |
| 35 to 44 Years | 0 (0.0%) | 13 (100.0%) |
| 45 to 54 Years | 2 (28.6%) | 7 (100.0%) |
| 55 to 64 Years | 4 (8.2%) | 26 (53.1%) |
| 65 to 74 Years | 35 (100.0%) | 14 (40.0%) |
| 75 Years and over | 26 (100.0%) | 5 (19.2%) |
| Total | 73 (49.0%) | 78 (52.3%) |
Disability Status by Sex by Age in Caney City
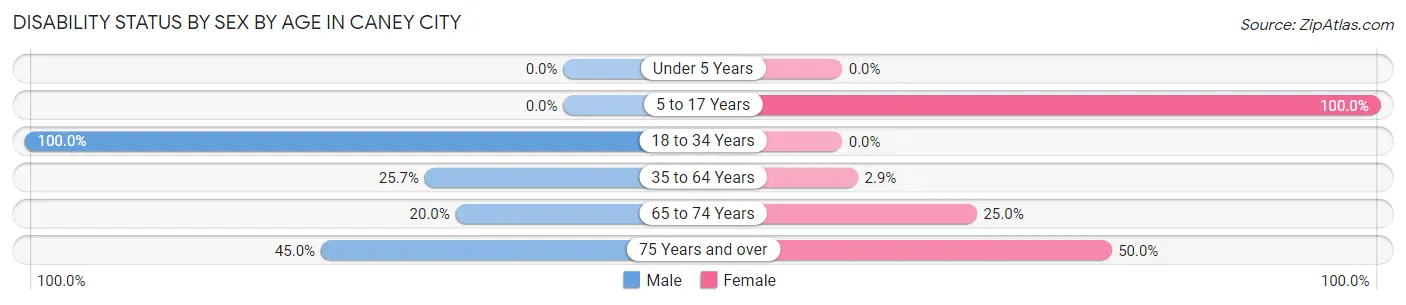
| Age Bracket | Male | Female |
| Under 5 Years | 0 (0.0%) | 0 (0.0%) |
| 5 to 17 Years | 0 (0.0%) | 1 (100.0%) |
| 18 to 34 Years | 5 (100.0%) | 0 (0.0%) |
| 35 to 64 Years | 9 (25.7%) | 1 (2.9%) |
| 65 to 74 Years | 3 (20.0%) | 5 (25.0%) |
| 75 Years and over | 9 (45.0%) | 3 (50.0%) |
Disability Class by Sex by Age in Caney City
Disability Class: Hearing Difficulty
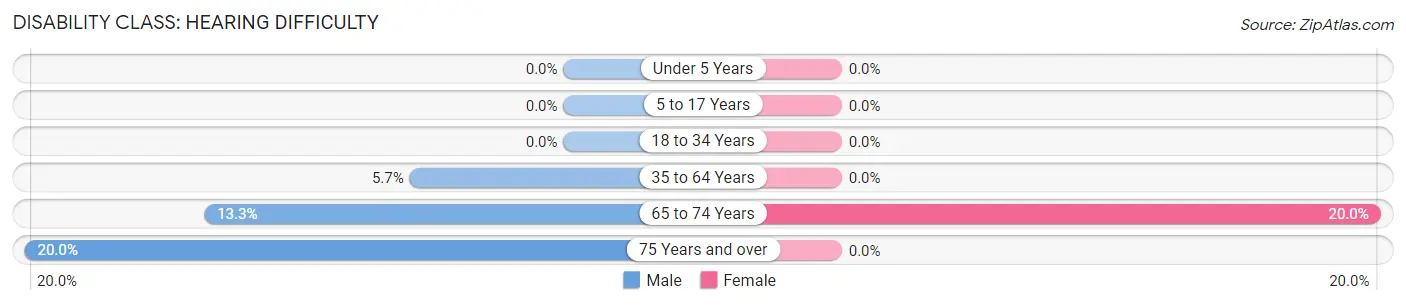
| Age Bracket | Male | Female |
| Under 5 Years | 0 (0.0%) | 0 (0.0%) |
| 5 to 17 Years | 0 (0.0%) | 0 (0.0%) |
| 18 to 34 Years | 0 (0.0%) | 0 (0.0%) |
| 35 to 64 Years | 2 (5.7%) | 0 (0.0%) |
| 65 to 74 Years | 2 (13.3%) | 4 (20.0%) |
| 75 Years and over | 4 (20.0%) | 0 (0.0%) |
Disability Class: Vision Difficulty
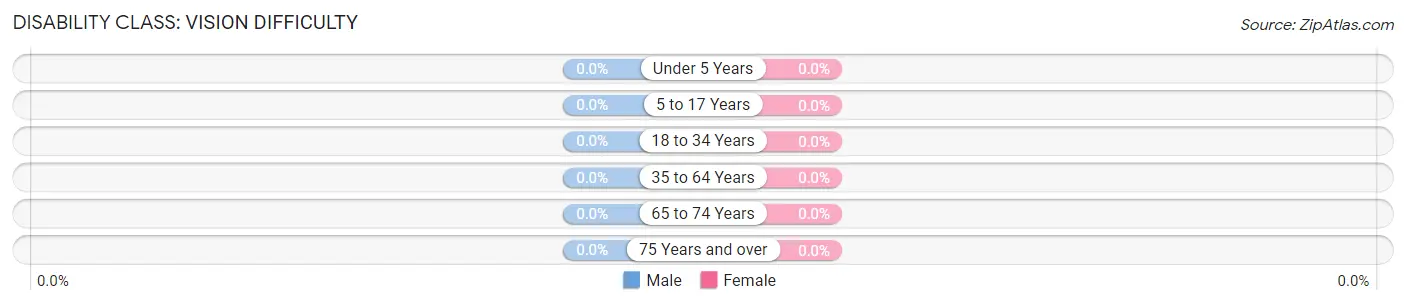
| Age Bracket | Male | Female |
| Under 5 Years | 0 (0.0%) | 0 (0.0%) |
| 5 to 17 Years | 0 (0.0%) | 0 (0.0%) |
| 18 to 34 Years | 0 (0.0%) | 0 (0.0%) |
| 35 to 64 Years | 0 (0.0%) | 0 (0.0%) |
| 65 to 74 Years | 0 (0.0%) | 0 (0.0%) |
| 75 Years and over | 0 (0.0%) | 0 (0.0%) |
Disability Class: Cognitive Difficulty
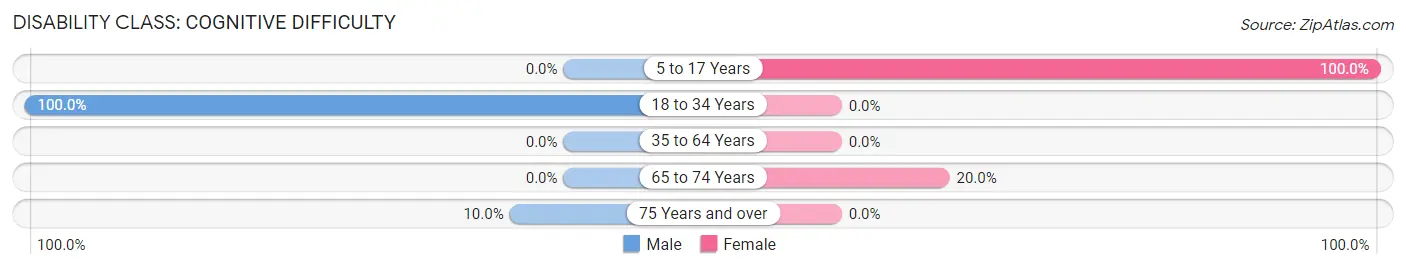
| Age Bracket | Male | Female |
| 5 to 17 Years | 0 (0.0%) | 1 (100.0%) |
| 18 to 34 Years | 5 (100.0%) | 0 (0.0%) |
| 35 to 64 Years | 0 (0.0%) | 0 (0.0%) |
| 65 to 74 Years | 0 (0.0%) | 4 (20.0%) |
| 75 Years and over | 2 (10.0%) | 0 (0.0%) |
Disability Class: Ambulatory Difficulty
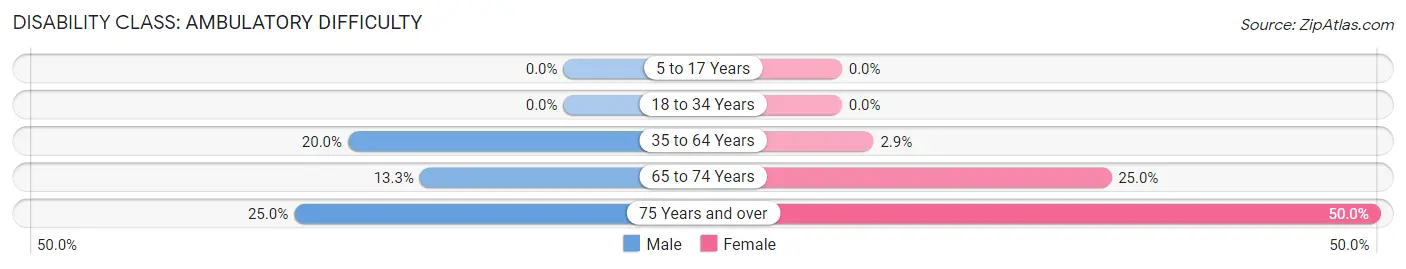
| Age Bracket | Male | Female |
| 5 to 17 Years | 0 (0.0%) | 0 (0.0%) |
| 18 to 34 Years | 0 (0.0%) | 0 (0.0%) |
| 35 to 64 Years | 7 (20.0%) | 1 (2.9%) |
| 65 to 74 Years | 2 (13.3%) | 5 (25.0%) |
| 75 Years and over | 5 (25.0%) | 3 (50.0%) |
Disability Class: Self-Care Difficulty
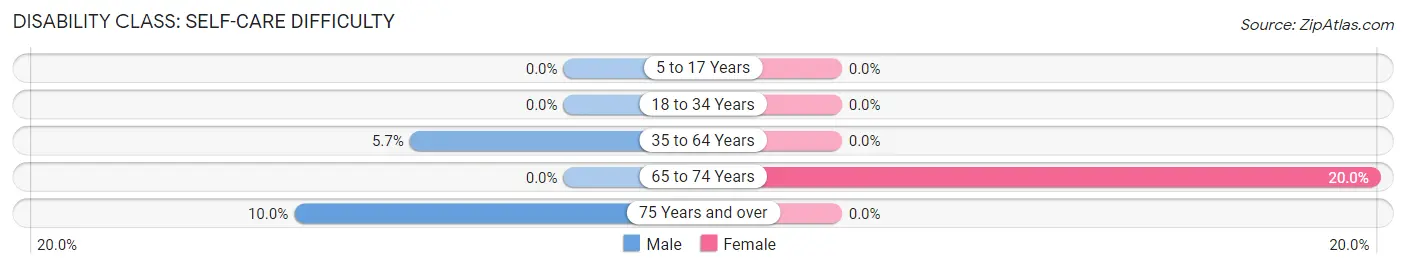
| Age Bracket | Male | Female |
| 5 to 17 Years | 0 (0.0%) | 0 (0.0%) |
| 18 to 34 Years | 0 (0.0%) | 0 (0.0%) |
| 35 to 64 Years | 2 (5.7%) | 0 (0.0%) |
| 65 to 74 Years | 0 (0.0%) | 4 (20.0%) |
| 75 Years and over | 2 (10.0%) | 0 (0.0%) |
Technology Access in Caney City
Computing Device Access in Caney City
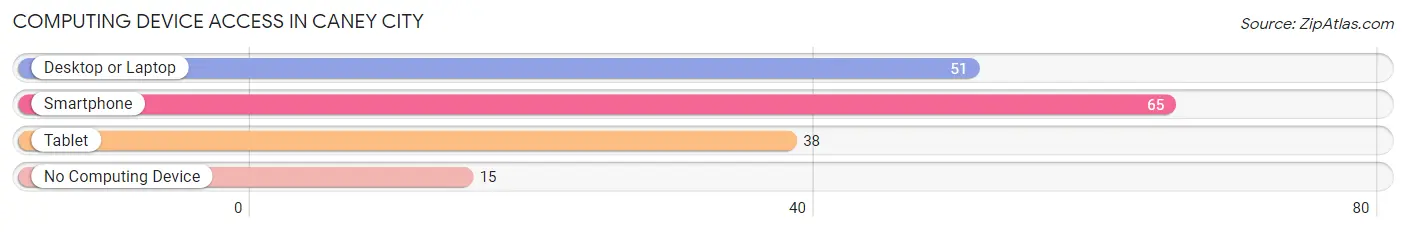
| Device Type | # Households | % Households |
| Desktop or Laptop | 51 | 60.7% |
| Smartphone | 65 | 77.4% |
| Tablet | 38 | 45.2% |
| No Computing Device | 15 | 17.9% |
| Total | 84 | 100.0% |
Internet Access in Caney City
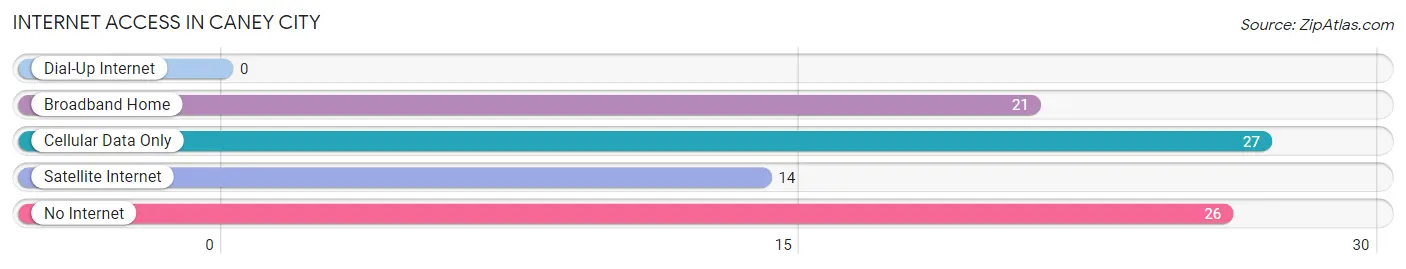
| Internet Type | # Households | % Households |
| Dial-Up Internet | 0 | 0.0% |
| Broadband Home | 21 | 25.0% |
| Cellular Data Only | 27 | 32.1% |
| Satellite Internet | 14 | 16.7% |
| No Internet | 26 | 30.9% |
| Total | 84 | 100.0% |
Caney City Summary
Caney City, Texas is a small town located in the southeastern corner of Texas, in the county of Liberty. It is situated on the banks of the Trinity River, and is part of the Beaumont-Port Arthur metropolitan area. The town has a population of just over 1,000 people, and is known for its rural charm and small-town atmosphere.
History
Caney City was founded in 1845 by a group of settlers from the nearby town of Liberty. The town was originally known as “Caney”, and was named after the nearby Caney Creek. The town was officially incorporated in 1891, and the name was changed to Caney City.
The town was a thriving agricultural center in the early 1900s, with cotton, corn, and other crops being grown in the area. The town also had a thriving lumber industry, with several sawmills located in the area.
In the 1920s, the town began to experience a decline in population, as many of the residents moved away to larger cities. This trend continued until the 1950s, when the town began to experience a resurgence in population. This was due in part to the discovery of oil in the area, which led to an influx of new residents and businesses.
Geography
Caney City is located in the southeastern corner of Texas, in the county of Liberty. It is situated on the banks of the Trinity River, and is part of the Beaumont-Port Arthur metropolitan area. The town has a total area of 1.2 square miles, all of which is land.
The town is located in a humid subtropical climate zone, with hot summers and mild winters. The average annual temperature is around 70 degrees Fahrenheit, with the average high temperature in the summer months reaching around 90 degrees Fahrenheit.
Economy
The economy of Caney City is largely based on agriculture and oil production. The town is home to several farms, which produce a variety of crops, including cotton, corn, and soybeans. The town also has several oil wells, which produce a significant amount of oil for the local economy.
In addition to agriculture and oil production, the town also has a thriving tourism industry. The town is home to several attractions, including the Caney City Museum, the Caney City Historical Society, and the Caney City Nature Center.
Demographics
As of the 2010 census, the population of Caney City was 1,072. The racial makeup of the town was 79.3% White, 16.2% African American, 0.7% Native American, 0.3% Asian, 0.1% Pacific Islander, and 3.4% from other races. Hispanic or Latino of any race were 6.2% of the population.
The median income for a household in the town was $31,250, and the median income for a family was $37,500. The per capita income for the town was $15,945. About 17.2% of families and 20.2% of the population were below the poverty line, including 28.3% of those under age 18 and 11.3% of those age 65 or over.
Common Questions
What is Per Capita Income in Caney City?
Per Capita income in Caney City is $51,793.
What is the Median Household income in Caney City?
Median Household Income in Caney City is $52,500.
What is Inequality or Gini Index in Caney City?
Inequality or Gini Index in Caney City is 0.62.
What is the Total Population of Caney City?
Total Population of Caney City is 149.
What is the Total Male Population of Caney City?
Total Male Population of Caney City is 88.
What is the Total Female Population of Caney City?
Total Female Population of Caney City is 61.
What is the Ratio of Males per 100 Females in Caney City?
There are 144.26 Males per 100 Females in Caney City.
What is the Ratio of Females per 100 Males in Caney City?
There are 69.32 Females per 100 Males in Caney City.
What is the Median Population Age in Caney City?
Median Population Age in Caney City is 59.9 Years.
What is the Average Family Size in Caney City
Average Family Size in Caney City is 2.1 People.
What is the Average Household Size in Caney City
Average Household Size in Caney City is 1.8 People.
How Large is the Labor Force in Caney City?
There are 58 People in the Labor Forcein in Caney City.
What is the Percentage of People in the Labor Force in Caney City?
42.6% of People are in the Labor Force in Caney City.