Matagorda, TX Map & Demographics
Matagorda Map
Matagorda Overview
$21,297
PER CAPITA INCOME
$29,167
AVG FAMILY INCOME
0.62
INEQUALITY / GINI INDEX
383
TOTAL POPULATION
179
MALE POPULATION
204
FEMALE POPULATION
87.75
MALES / 100 FEMALES
113.97
FEMALES / 100 MALES
62.6
MEDIAN AGE
2.0
AVG FAMILY SIZE
1.6
AVG HOUSEHOLD SIZE
224
LABOR FORCE [ PEOPLE ]
58.5%
PERCENT IN LABOR FORCE
17.4%
UNEMPLOYMENT RATE
Matagorda Zip Codes
Income in Matagorda
Income Overview in Matagorda
| Characteristic | Number | Measure |
| Per Capita Income | 383 | $21,297 |
| Median Family Income | 140 | $29,167 |
| Mean Family Income | 140 | $50,246 |
| Median Household Income | 238 | $0 |
| Mean Household Income | 238 | $37,367 |
| Income Deficit | 140 | $0 |
| Wage / Income Gap (%) | 383 | 0.00% |
| Wage / Income Gap ($) | 383 | 100.00¢ per $1 |
| Gini / Inequality Index | 383 | 0.62 |
Earnings by Sex in Matagorda
| Sex | Number | Average Earnings |
| Male | 123 (48.8%) | $0 |
| Female | 129 (51.2%) | $0 |
| Total | 252 (100.0%) | $0 |
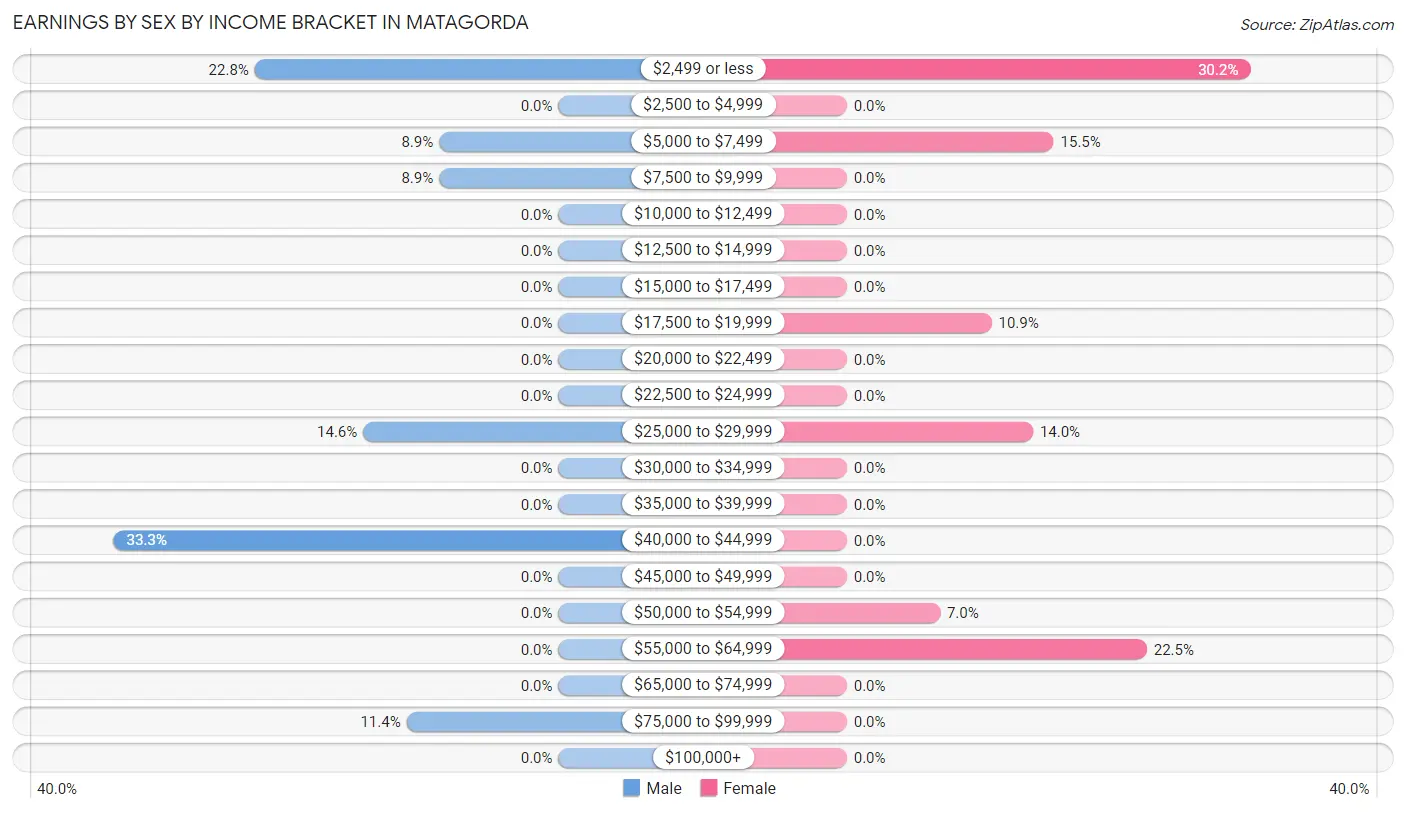
Earnings by Sex by Income Bracket in Matagorda
The most common earnings brackets in Matagorda are $40,000 to $44,999 for men (41 | 33.3%) and $2,499 or less for women (39 | 30.2%).
| Income | Male | Female |
| $2,499 or less | 28 (22.8%) | 39 (30.2%) |
| $2,500 to $4,999 | 0 (0.0%) | 0 (0.0%) |
| $5,000 to $7,499 | 11 (8.9%) | 20 (15.5%) |
| $7,500 to $9,999 | 11 (8.9%) | 0 (0.0%) |
| $10,000 to $12,499 | 0 (0.0%) | 0 (0.0%) |
| $12,500 to $14,999 | 0 (0.0%) | 0 (0.0%) |
| $15,000 to $17,499 | 0 (0.0%) | 0 (0.0%) |
| $17,500 to $19,999 | 0 (0.0%) | 14 (10.8%) |
| $20,000 to $22,499 | 0 (0.0%) | 0 (0.0%) |
| $22,500 to $24,999 | 0 (0.0%) | 0 (0.0%) |
| $25,000 to $29,999 | 18 (14.6%) | 18 (14.0%) |
| $30,000 to $34,999 | 0 (0.0%) | 0 (0.0%) |
| $35,000 to $39,999 | 0 (0.0%) | 0 (0.0%) |
| $40,000 to $44,999 | 41 (33.3%) | 0 (0.0%) |
| $45,000 to $49,999 | 0 (0.0%) | 0 (0.0%) |
| $50,000 to $54,999 | 0 (0.0%) | 9 (7.0%) |
| $55,000 to $64,999 | 0 (0.0%) | 29 (22.5%) |
| $65,000 to $74,999 | 0 (0.0%) | 0 (0.0%) |
| $75,000 to $99,999 | 14 (11.4%) | 0 (0.0%) |
| $100,000+ | 0 (0.0%) | 0 (0.0%) |
| Total | 123 (100.0%) | 129 (100.0%) |
Earnings by Sex by Educational Attainment in Matagorda
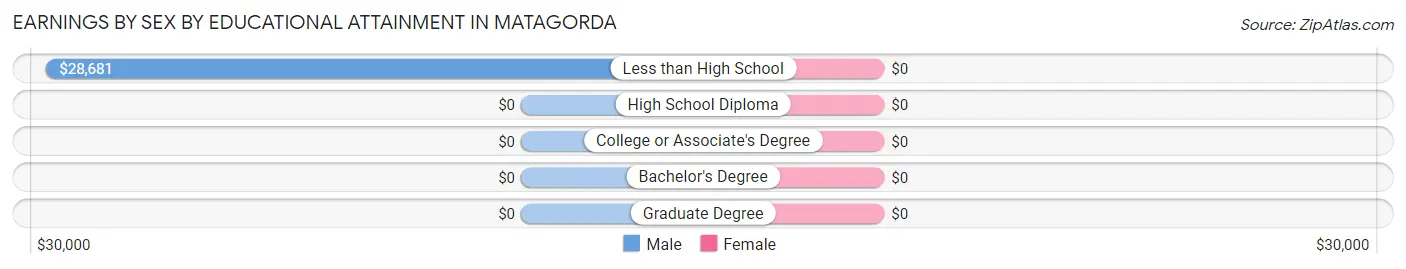
| Educational Attainment | Male Income | Female Income |
| Less than High School | $28,681 | $0 |
| High School Diploma | - | - |
| College or Associate's Degree | - | - |
| Bachelor's Degree | - | - |
| Graduate Degree | - | - |
| Total | - | - |
Family Income in Matagorda
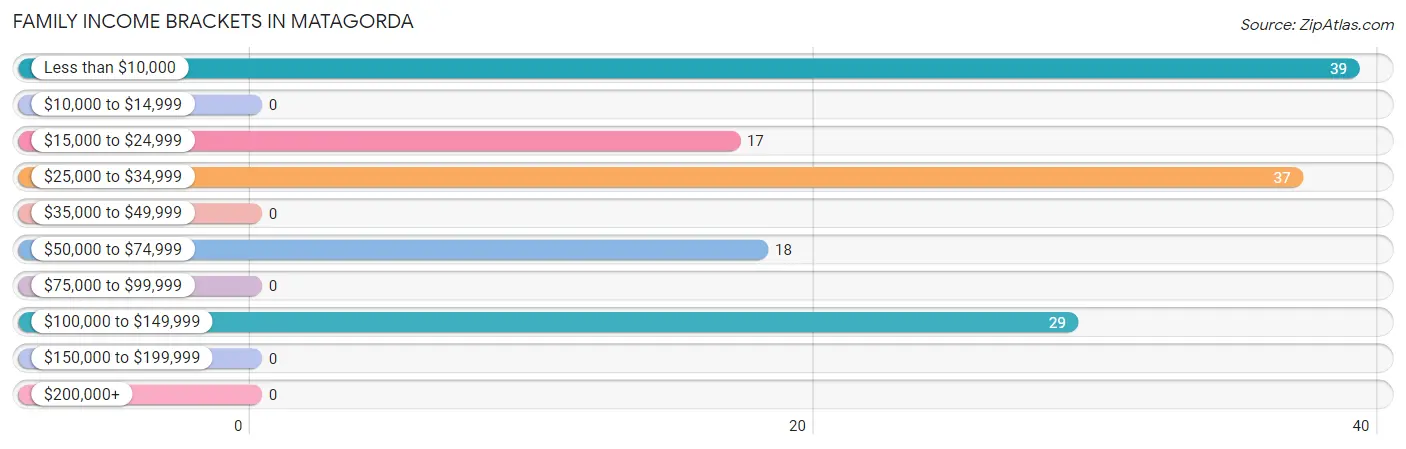
Family Income Brackets in Matagorda
According to the Matagorda family income data, there are 39 families falling into the less than $10,000 income range, which is the most common income bracket and makes up 27.9% of all families.
| Income Bracket | # Families | % Families |
| Less than $10,000 | 39 | 27.9% |
| $10,000 to $14,999 | 0 | 0.0% |
| $15,000 to $24,999 | 17 | 12.1% |
| $25,000 to $34,999 | 37 | 26.4% |
| $35,000 to $49,999 | 0 | 0.0% |
| $50,000 to $74,999 | 18 | 12.9% |
| $75,000 to $99,999 | 0 | 0.0% |
| $100,000 to $149,999 | 29 | 20.7% |
| $150,000 to $199,999 | 0 | 0.0% |
| $200,000+ | 0 | 0.0% |
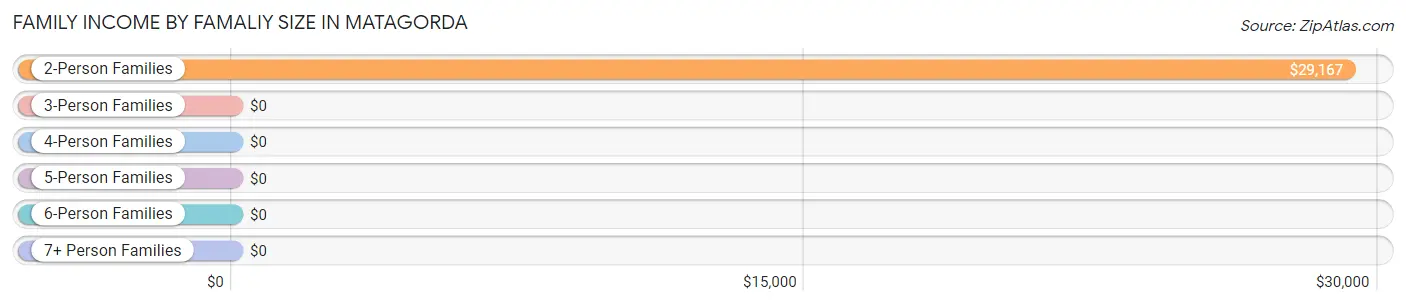
Family Income by Famaliy Size in Matagorda
2-person families (140 | 100.0%) account for the highest median family income in Matagorda with $29,167 per family, while 2-person families (140 | 100.0%) have the highest median income of $14,584 per family member.
| Income Bracket | # Families | Median Income |
| 2-Person Families | 140 (100.0%) | $29,167 |
| 3-Person Families | 0 (0.0%) | $0 |
| 4-Person Families | 0 (0.0%) | $0 |
| 5-Person Families | 0 (0.0%) | $0 |
| 6-Person Families | 0 (0.0%) | $0 |
| 7+ Person Families | 0 (0.0%) | $0 |
| Total | 140 (100.0%) | $29,167 |
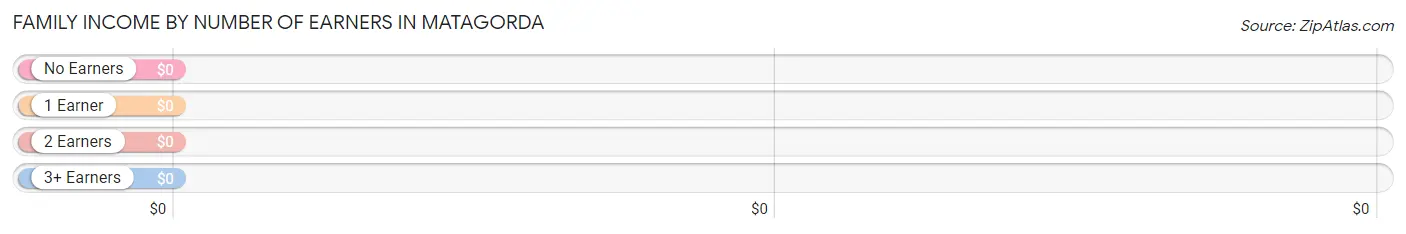
Family Income by Number of Earners in Matagorda
| Number of Earners | # Families | Median Income |
| No Earners | 16 (11.4%) | $0 |
| 1 Earner | 38 (27.1%) | $0 |
| 2 Earners | 86 (61.4%) | $0 |
| 3+ Earners | 0 (0.0%) | $0 |
| Total | 140 (100.0%) | $29,167 |
Household Income in Matagorda
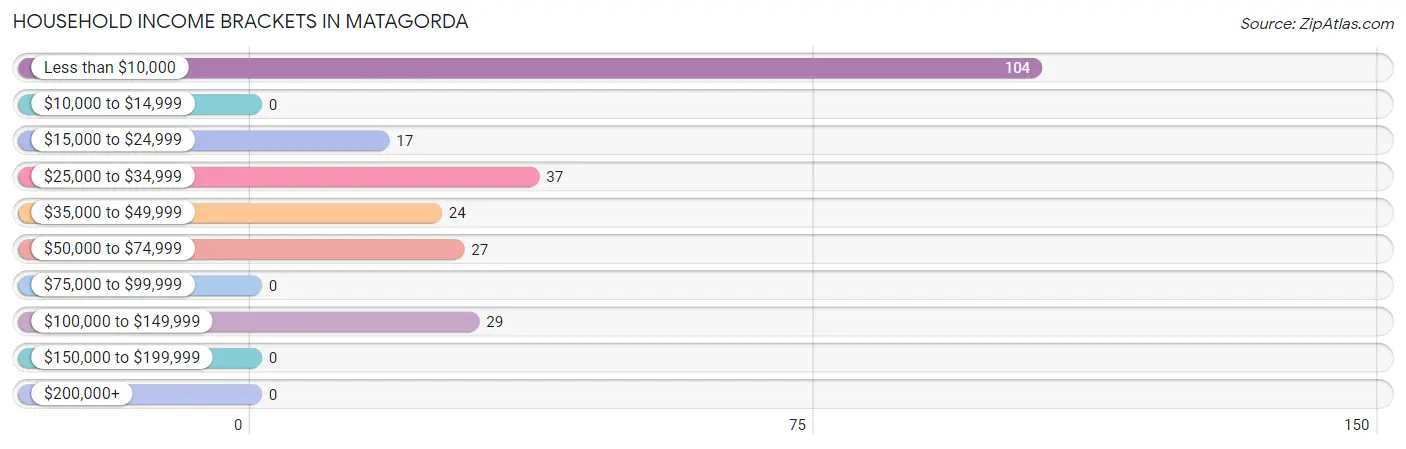
Household Income Brackets in Matagorda
With 104 households falling in the category, the less than $10,000 income range is the most frequent in Matagorda, accounting for 43.7% of all households.
| Income Bracket | # Households | % Households |
| Less than $10,000 | 104 | 43.7% |
| $10,000 to $14,999 | 0 | 0.0% |
| $15,000 to $24,999 | 17 | 7.1% |
| $25,000 to $34,999 | 37 | 15.5% |
| $35,000 to $49,999 | 24 | 10.1% |
| $50,000 to $74,999 | 27 | 11.3% |
| $75,000 to $99,999 | 0 | 0.0% |
| $100,000 to $149,999 | 29 | 12.2% |
| $150,000 to $199,999 | 0 | 0.0% |
| $200,000+ | 0 | 0.0% |
Household Income by Householder Age in Matagorda
The median household income in Matagorda is $0, with the highest median household income of $8,083 found in the 65+ years age bracket for the primary householder. A total of 51 households (21.4%) fall into this category.
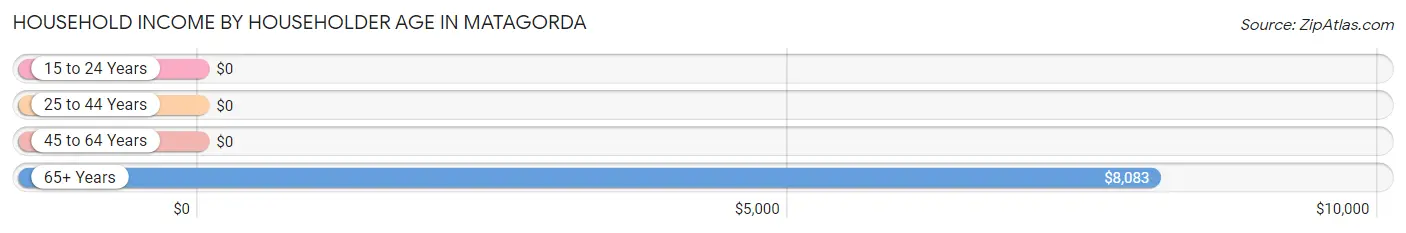
| Income Bracket | # Households | Median Income |
| 15 to 24 Years | 0 (0.0%) | $0 |
| 25 to 44 Years | 19 (8.0%) | $0 |
| 45 to 64 Years | 168 (70.6%) | $0 |
| 65+ Years | 51 (21.4%) | $8,083 |
| Total | 238 (100.0%) | $0 |
Poverty in Matagorda
Income Below Poverty by Sex and Age in Matagorda
With 37.4% poverty level for males and 55.4% for females among the residents of Matagorda, 25 to 34 year old males and 65 to 74 year old females are the most vulnerable to poverty, with 11 males (100.0%) and 15 females (100.0%) in their respective age groups living below the poverty level.
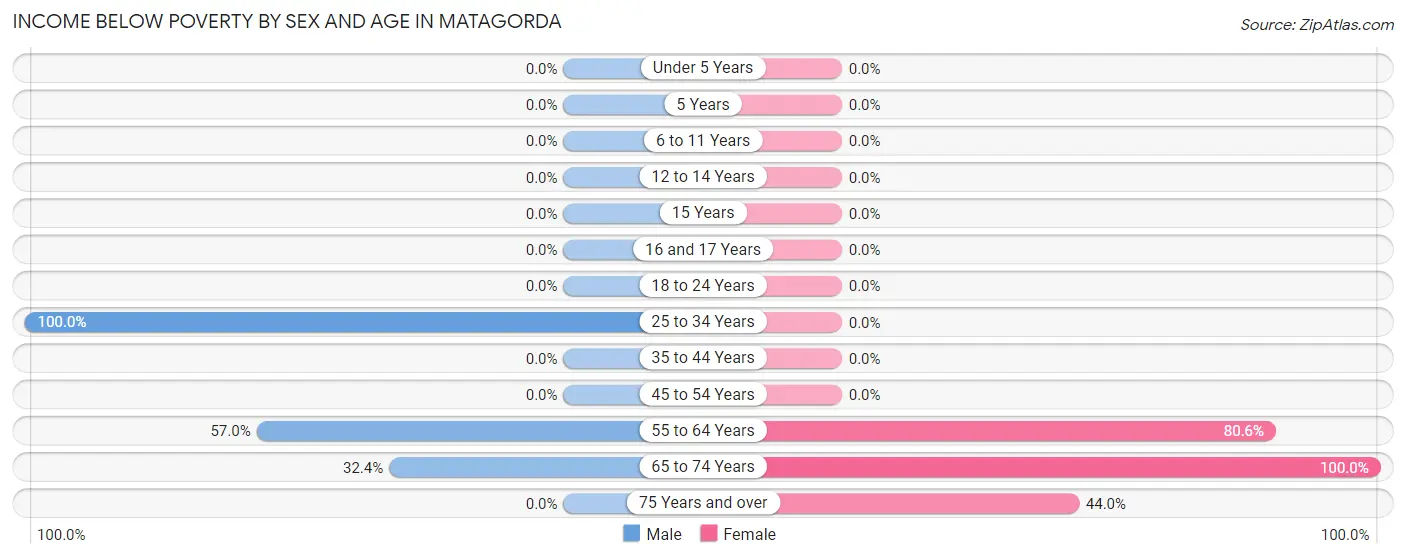
| Age Bracket | Male | Female |
| Under 5 Years | 0 (0.0%) | 0 (0.0%) |
| 5 Years | 0 (0.0%) | 0 (0.0%) |
| 6 to 11 Years | 0 (0.0%) | 0 (0.0%) |
| 12 to 14 Years | 0 (0.0%) | 0 (0.0%) |
| 15 Years | 0 (0.0%) | 0 (0.0%) |
| 16 and 17 Years | 0 (0.0%) | 0 (0.0%) |
| 18 to 24 Years | 0 (0.0%) | 0 (0.0%) |
| 25 to 34 Years | 11 (100.0%) | 0 (0.0%) |
| 35 to 44 Years | 0 (0.0%) | 0 (0.0%) |
| 45 to 54 Years | 0 (0.0%) | 0 (0.0%) |
| 55 to 64 Years | 45 (57.0%) | 87 (80.6%) |
| 65 to 74 Years | 11 (32.4%) | 15 (100.0%) |
| 75 Years and over | 0 (0.0%) | 11 (44.0%) |
| Total | 67 (37.4%) | 113 (55.4%) |
Income Above Poverty by Sex and Age in Matagorda
According to the poverty statistics in Matagorda, males aged 35 to 44 years and females aged 25 to 34 years are the age groups that are most secure financially, with 100.0% of males and 100.0% of females in these age groups living above the poverty line.
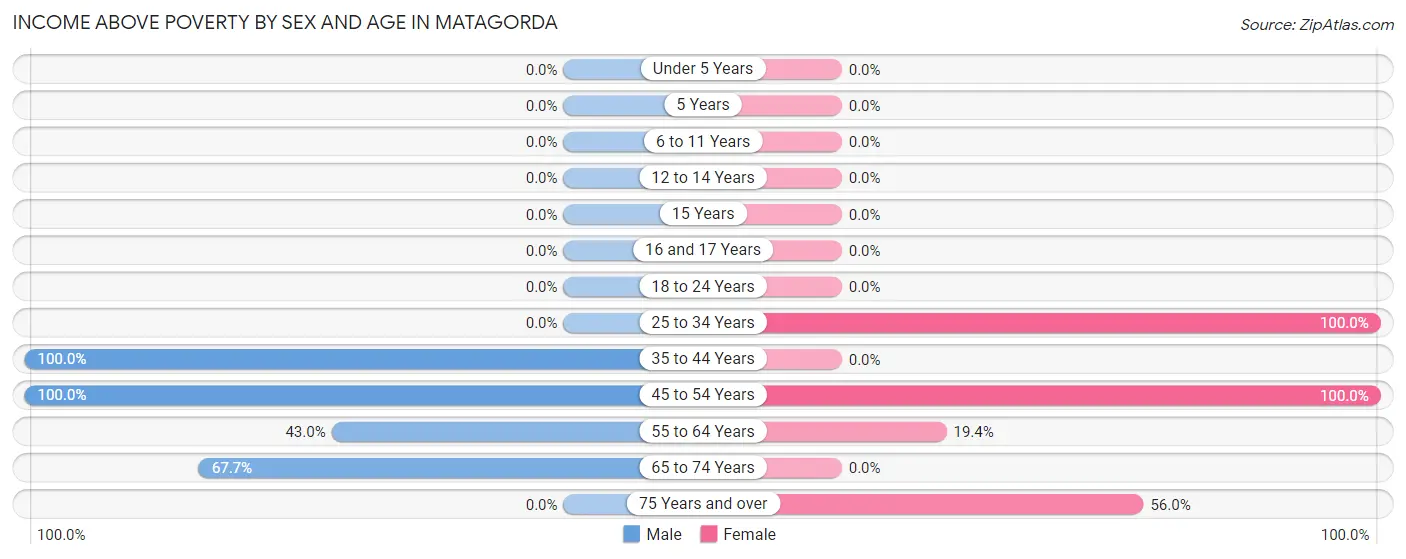
| Age Bracket | Male | Female |
| Under 5 Years | 0 (0.0%) | 0 (0.0%) |
| 5 Years | 0 (0.0%) | 0 (0.0%) |
| 6 to 11 Years | 0 (0.0%) | 0 (0.0%) |
| 12 to 14 Years | 0 (0.0%) | 0 (0.0%) |
| 15 Years | 0 (0.0%) | 0 (0.0%) |
| 16 and 17 Years | 0 (0.0%) | 0 (0.0%) |
| 18 to 24 Years | 0 (0.0%) | 0 (0.0%) |
| 25 to 34 Years | 0 (0.0%) | 9 (100.0%) |
| 35 to 44 Years | 10 (100.0%) | 0 (0.0%) |
| 45 to 54 Years | 45 (100.0%) | 47 (100.0%) |
| 55 to 64 Years | 34 (43.0%) | 21 (19.4%) |
| 65 to 74 Years | 23 (67.6%) | 0 (0.0%) |
| 75 Years and over | 0 (0.0%) | 14 (56.0%) |
| Total | 112 (62.6%) | 91 (44.6%) |
Income Below Poverty Among Married-Couple Families in Matagorda
The poverty statistics for married-couple families in Matagorda show that 45.2% or 56 of the total 124 families live below the poverty line. Families with no children have the highest poverty rate of 45.2%, comprising of 56 families. On the other hand, families with no children have the lowest poverty rate of 45.2%, which includes 56 families.
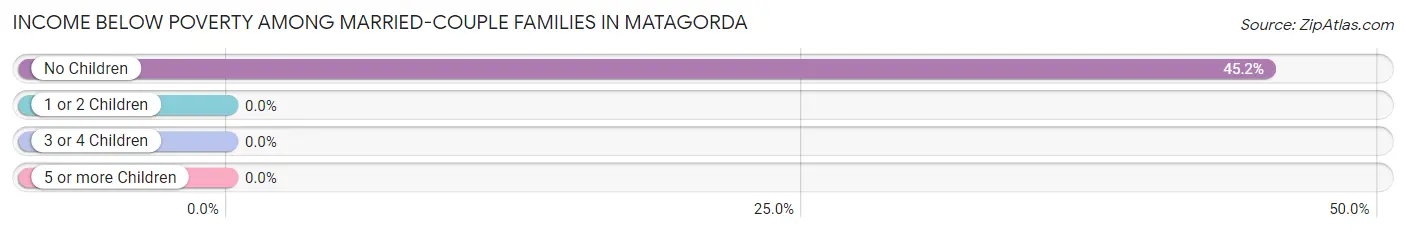
| Children | Above Poverty | Below Poverty |
| No Children | 68 (54.8%) | 56 (45.2%) |
| 1 or 2 Children | 0 (0.0%) | 0 (0.0%) |
| 3 or 4 Children | 0 (0.0%) | 0 (0.0%) |
| 5 or more Children | 0 (0.0%) | 0 (0.0%) |
| Total | 68 (54.8%) | 56 (45.2%) |
Income Below Poverty Among Single-Parent Households in Matagorda
| Children | Single Father | Single Mother |
| No Children | 0 (0.0%) | 0 (0.0%) |
| 1 or 2 Children | 0 (0.0%) | 0 (0.0%) |
| 3 or 4 Children | 0 (0.0%) | 0 (0.0%) |
| 5 or more Children | 0 (0.0%) | 0 (0.0%) |
| Total | 0 (0.0%) | 0 (0.0%) |
Income Below Poverty Among Married-Couple vs Single-Parent Households in Matagorda
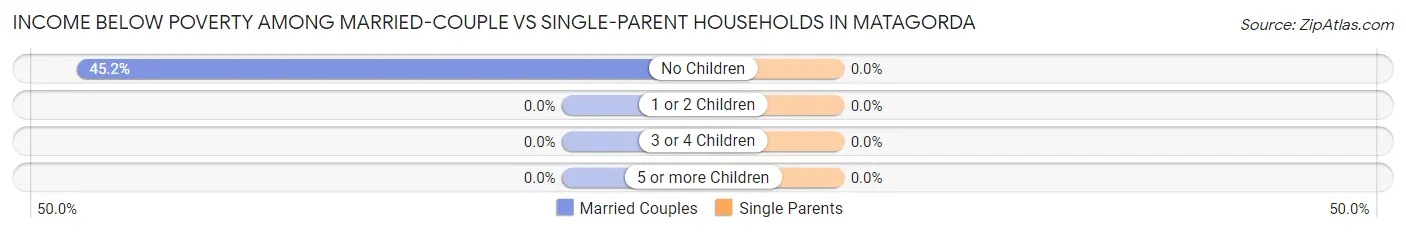
| Children | Married-Couple Families | Single-Parent Households |
| No Children | 56 (45.2%) | 0 (0.0%) |
| 1 or 2 Children | 0 (0.0%) | 0 (0.0%) |
| 3 or 4 Children | 0 (0.0%) | 0 (0.0%) |
| 5 or more Children | 0 (0.0%) | 0 (0.0%) |
| Total | 56 (45.2%) | 0 (0.0%) |
Race in Matagorda
The most populous races in Matagorda are White / Caucasian (372 | 97.1%), Hispanic or Latino (38 | 9.9%), and Hawaiian / Pacific (11 | 2.9%).
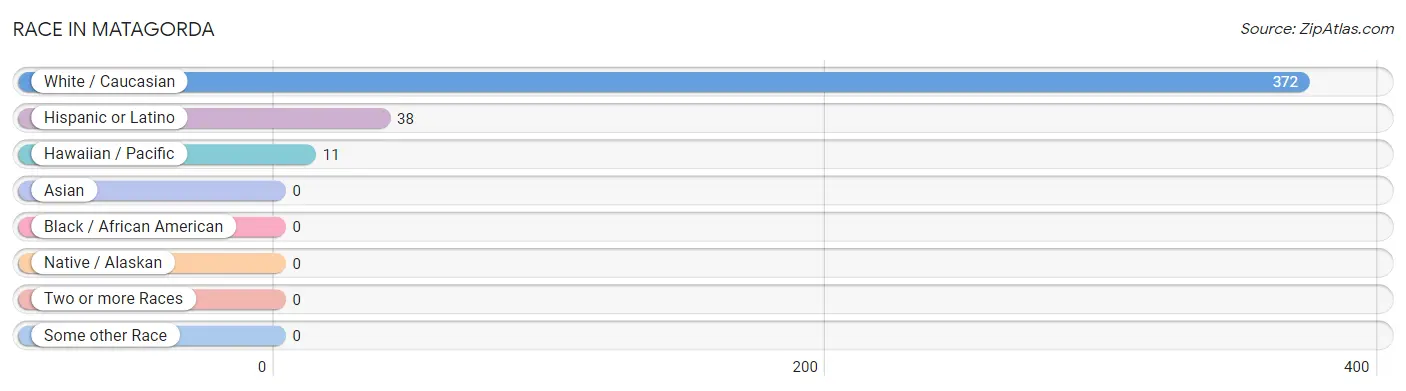
| Race | # Population | % Population |
| Asian | 0 | 0.0% |
| Black / African American | 0 | 0.0% |
| Hawaiian / Pacific | 11 | 2.9% |
| Hispanic or Latino | 38 | 9.9% |
| Native / Alaskan | 0 | 0.0% |
| White / Caucasian | 372 | 97.1% |
| Two or more Races | 0 | 0.0% |
| Some other Race | 0 | 0.0% |
| Total | 383 | 100.0% |
Ancestry in Matagorda
The most populous ancestries reported in Matagorda are Irish (73 | 19.1%), German (56 | 14.6%), English (50 | 13.1%), Mexican (38 | 9.9%), and British (28 | 7.3%), together accounting for 64.0% of all Matagorda residents.
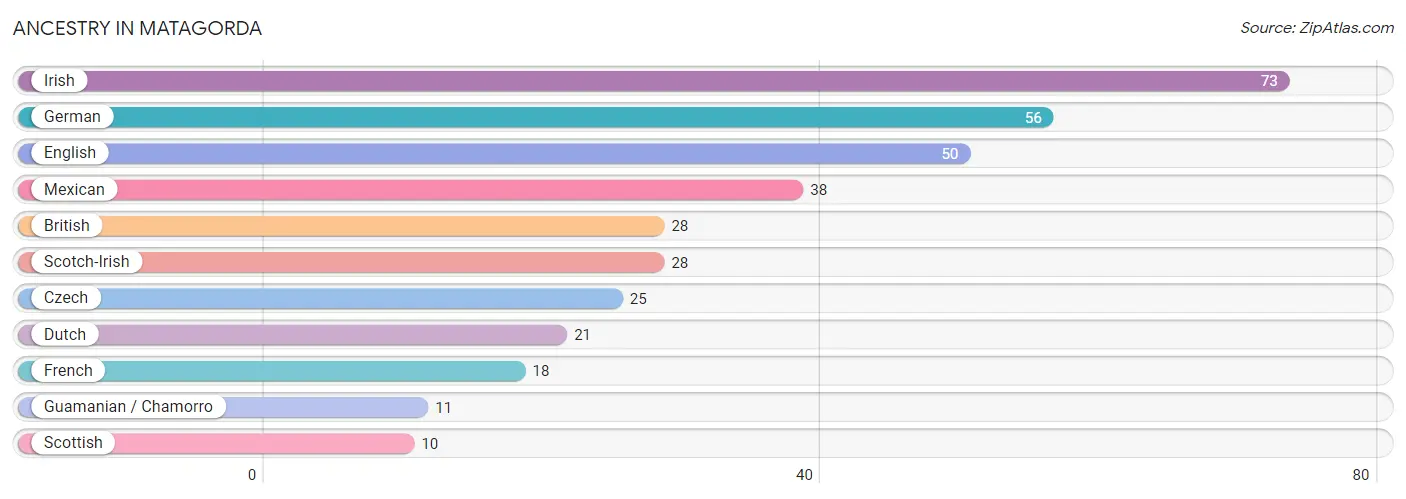
| Ancestry | # Population | % Population |
| British | 28 | 7.3% |
| Czech | 25 | 6.5% |
| Dutch | 21 | 5.5% |
| English | 50 | 13.1% |
| French | 18 | 4.7% |
| German | 56 | 14.6% |
| Guamanian / Chamorro | 11 | 2.9% |
| Irish | 73 | 19.1% |
| Mexican | 38 | 9.9% |
| Scotch-Irish | 28 | 7.3% |
| Scottish | 10 | 2.6% | View All 11 Rows |
Immigrants in Matagorda

| Immigration Origin | # Population | % Population | View All 0 Rows |
Sex and Age in Matagorda
Sex and Age in Matagorda
The most populous age groups in Matagorda are 60 to 64 Years (61 | 34.1%) for men and 60 to 64 Years (108 | 52.9%) for women.
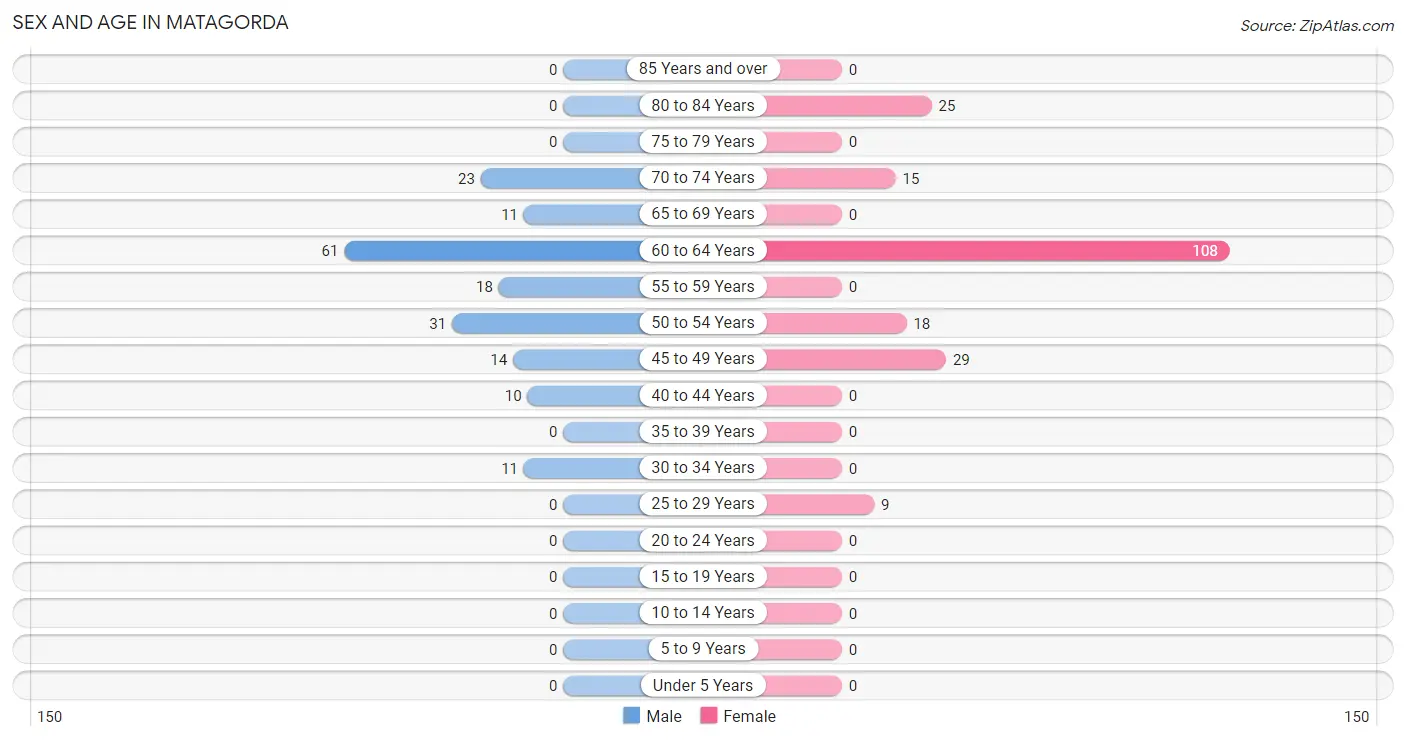
| Age Bracket | Male | Female |
| Under 5 Years | 0 (0.0%) | 0 (0.0%) |
| 5 to 9 Years | 0 (0.0%) | 0 (0.0%) |
| 10 to 14 Years | 0 (0.0%) | 0 (0.0%) |
| 15 to 19 Years | 0 (0.0%) | 0 (0.0%) |
| 20 to 24 Years | 0 (0.0%) | 0 (0.0%) |
| 25 to 29 Years | 0 (0.0%) | 9 (4.4%) |
| 30 to 34 Years | 11 (6.1%) | 0 (0.0%) |
| 35 to 39 Years | 0 (0.0%) | 0 (0.0%) |
| 40 to 44 Years | 10 (5.6%) | 0 (0.0%) |
| 45 to 49 Years | 14 (7.8%) | 29 (14.2%) |
| 50 to 54 Years | 31 (17.3%) | 18 (8.8%) |
| 55 to 59 Years | 18 (10.1%) | 0 (0.0%) |
| 60 to 64 Years | 61 (34.1%) | 108 (52.9%) |
| 65 to 69 Years | 11 (6.1%) | 0 (0.0%) |
| 70 to 74 Years | 23 (12.9%) | 15 (7.3%) |
| 75 to 79 Years | 0 (0.0%) | 0 (0.0%) |
| 80 to 84 Years | 0 (0.0%) | 25 (12.2%) |
| 85 Years and over | 0 (0.0%) | 0 (0.0%) |
| Total | 179 (100.0%) | 204 (100.0%) |
Families and Households in Matagorda
Median Family Size in Matagorda
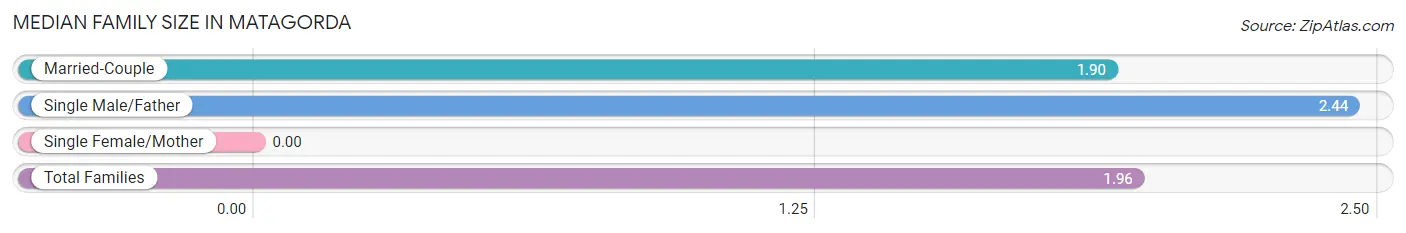
| Family Type | # Families | Family Size |
| Married-Couple | 124 (88.6%) | 1.90 |
| Single Male/Father | 16 (11.4%) | 2.44 |
| Single Female/Mother | 0 (0.0%) | - |
| Total Families | 140 (100.0%) | 1.96 |
Median Household Size in Matagorda
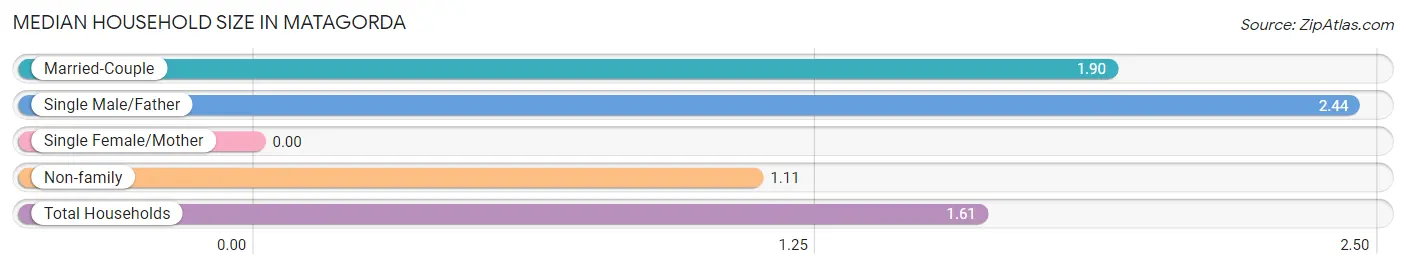
| Household Type | # Households | Household Size |
| Married-Couple | 124 (52.1%) | 1.90 |
| Single Male/Father | 16 (6.7%) | 2.44 |
| Single Female/Mother | 0 (0.0%) | - |
| Non-family | 98 (41.2%) | 1.11 |
| Total Households | 238 (100.0%) | 1.61 |
Household Size by Marriage Status in Matagorda
Out of a total of 238 households in Matagorda, 140 (58.8%) are family households, while 98 (41.2%) are nonfamily households. The most numerous type of family households are 2-person households, comprising 140, and the most common type of nonfamily households are 1-person households, comprising 89.
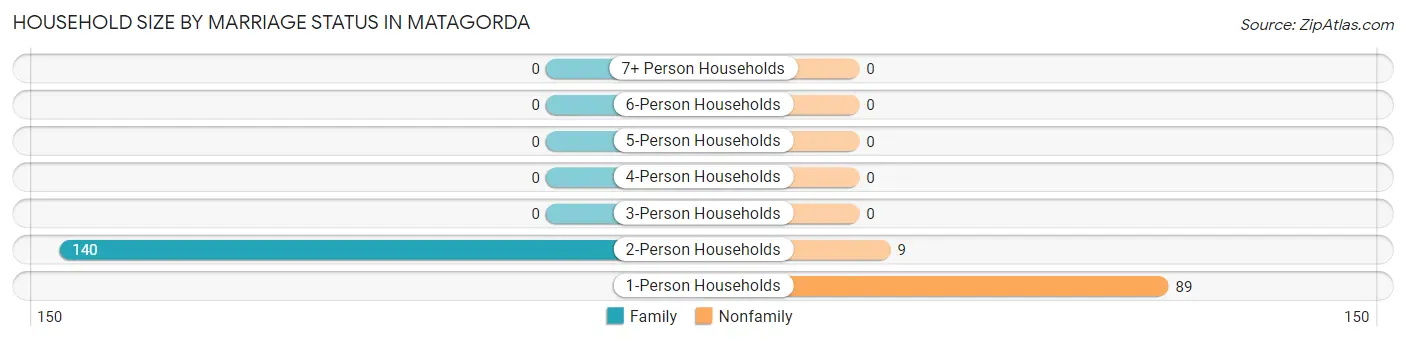
| Household Size | Family Households | Nonfamily Households |
| 1-Person Households | - | 89 (37.4%) |
| 2-Person Households | 140 (58.8%) | 9 (3.8%) |
| 3-Person Households | 0 (0.0%) | 0 (0.0%) |
| 4-Person Households | 0 (0.0%) | 0 (0.0%) |
| 5-Person Households | 0 (0.0%) | 0 (0.0%) |
| 6-Person Households | 0 (0.0%) | 0 (0.0%) |
| 7+ Person Households | 0 (0.0%) | 0 (0.0%) |
| Total | 140 (58.8%) | 98 (41.2%) |
Female Fertility in Matagorda
Fertility by Age in Matagorda
| Age Bracket | Women with Births | Births / 1,000 Women |
| 15 to 19 years | 0 (0.0%) | 0.0 |
| 20 to 34 years | 0 (0.0%) | 0.0 |
| 35 to 50 years | 0 (0.0%) | 0.0 |
| Total | 0 (0.0%) | 0.0 |
Fertility by Age by Marriage Status in Matagorda
| Age Bracket | Married | Unmarried |
| 15 to 19 years | 0 (0.0%) | 0 (0.0%) |
| 20 to 34 years | 0 (0.0%) | 0 (0.0%) |
| 35 to 50 years | 0 (0.0%) | 0 (0.0%) |
| Total | 0 (0.0%) | 0 (0.0%) |
Fertility by Education in Matagorda
| Educational Attainment | Women with Births | Births / 1,000 Women |
| Less than High School | 0 (0.0%) | 0.0 |
| High School Diploma | 0 (0.0%) | 0.0 |
| College or Associate's Degree | 0 (0.0%) | 0.0 |
| Bachelor's Degree | 0 (0.0%) | 0.0 |
| Graduate Degree | 0 (0.0%) | 0.0 |
| Total | 0 (0.0%) | 0.0 |
Fertility by Education by Marriage Status in Matagorda
| Educational Attainment | Married | Unmarried |
| Less than High School | 0 (0.0%) | 0 (0.0%) |
| High School Diploma | 0 (0.0%) | 0 (0.0%) |
| College or Associate's Degree | 0 (0.0%) | 0 (0.0%) |
| Bachelor's Degree | 0 (0.0%) | 0 (0.0%) |
| Graduate Degree | 0 (0.0%) | 0 (0.0%) |
| Total | 0 (0.0%) | 0 (0.0%) |
Employment Characteristics in Matagorda
Employment by Class of Employer in Matagorda
Among the 185 employed individuals in Matagorda, private company employees (106 | 57.3%), local government employees (58 | 31.4%), and self-employed (not incorporated) (21 | 11.4%) make up the most common classes of employment.
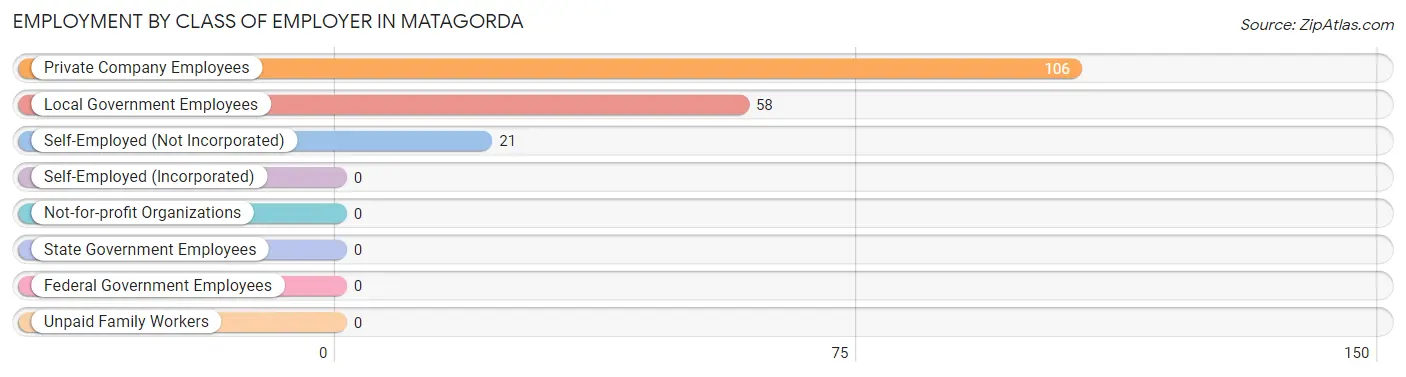
| Employer Class | # Employees | % Employees |
| Private Company Employees | 106 | 57.3% |
| Self-Employed (Incorporated) | 0 | 0.0% |
| Self-Employed (Not Incorporated) | 21 | 11.4% |
| Not-for-profit Organizations | 0 | 0.0% |
| Local Government Employees | 58 | 31.4% |
| State Government Employees | 0 | 0.0% |
| Federal Government Employees | 0 | 0.0% |
| Unpaid Family Workers | 0 | 0.0% |
| Total | 185 | 100.0% |
Employment Status by Age in Matagorda
According to the labor force statistics for Matagorda, out of the total population over 16 years of age (383), 58.5% or 224 individuals are in the labor force, with 17.4% or 39 of them unemployed. The age group with the highest labor force participation rate is 25 to 29 years, with 100.0% or 9 individuals in the labor force. Within the labor force, the 60 to 64 years age range has the highest percentage of unemployed individuals, with 66.1% or 39 of them being unemployed.
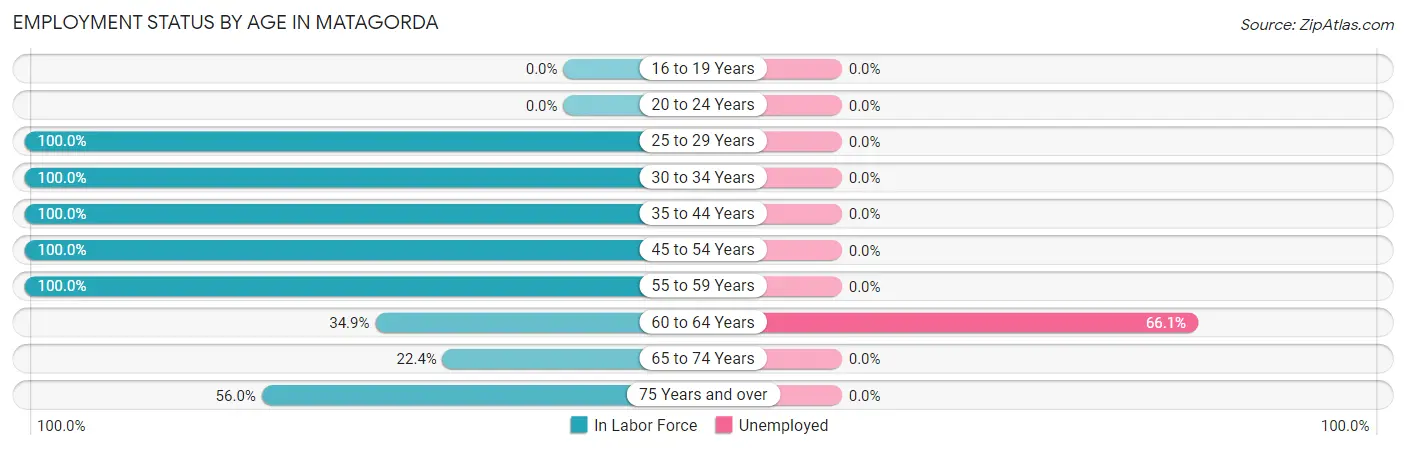
| Age Bracket | In Labor Force | Unemployed |
| 16 to 19 Years | 0 (0.0%) | 0 (0.0%) |
| 20 to 24 Years | 0 (0.0%) | 0 (0.0%) |
| 25 to 29 Years | 9 (100.0%) | 0 (0.0%) |
| 30 to 34 Years | 11 (100.0%) | 0 (0.0%) |
| 35 to 44 Years | 10 (100.0%) | 0 (0.0%) |
| 45 to 54 Years | 92 (100.0%) | 0 (0.0%) |
| 55 to 59 Years | 18 (100.0%) | 0 (0.0%) |
| 60 to 64 Years | 59 (34.9%) | 39 (66.1%) |
| 65 to 74 Years | 11 (22.4%) | 0 (0.0%) |
| 75 Years and over | 14 (56.0%) | 0 (0.0%) |
| Total | 224 (58.5%) | 39 (17.4%) |
Employment Status by Educational Attainment in Matagorda
According to labor force statistics for Matagorda, 64.4% of individuals (199) out of the total population between 25 and 64 years of age (309) are in the labor force, with 19.6% or 39 of them being unemployed. The group with the highest labor force participation rate are those with the educational attainment of high school diploma, with 100.0% or 62 individuals in the labor force. Within the labor force, individuals with college / associate degree education have the highest percentage of unemployment, with 39.0% or 39 of them being unemployed.
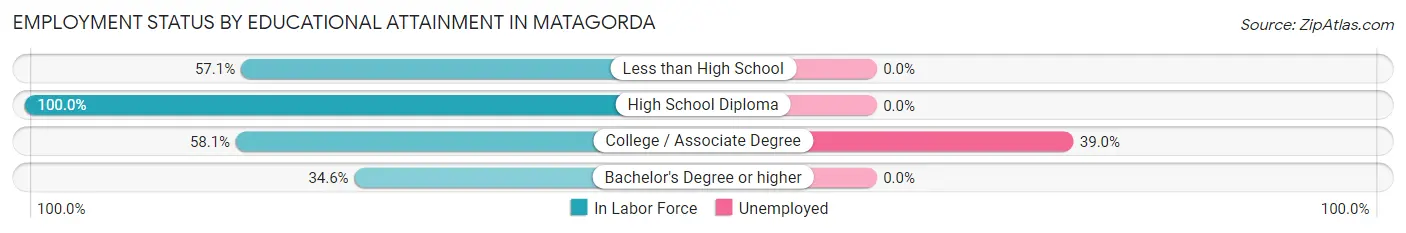
| Educational Attainment | In Labor Force | Unemployed |
| Less than High School | 28 (57.1%) | 0 (0.0%) |
| High School Diploma | 62 (100.0%) | 0 (0.0%) |
| College / Associate Degree | 100 (58.1%) | 67 (39.0%) |
| Bachelor's Degree or higher | 9 (34.6%) | 0 (0.0%) |
| Total | 199 (64.4%) | 61 (19.6%) |
Employment Occupations by Sex in Matagorda
Management, Business, Science and Arts Occupations
The most common Management, Business, Science and Arts occupations in Matagorda are Business & Financial (29 | 15.7%), Management (14 | 7.6%), Community & Social Service (9 | 4.9%), and Education Instruction & Library (9 | 4.9%).
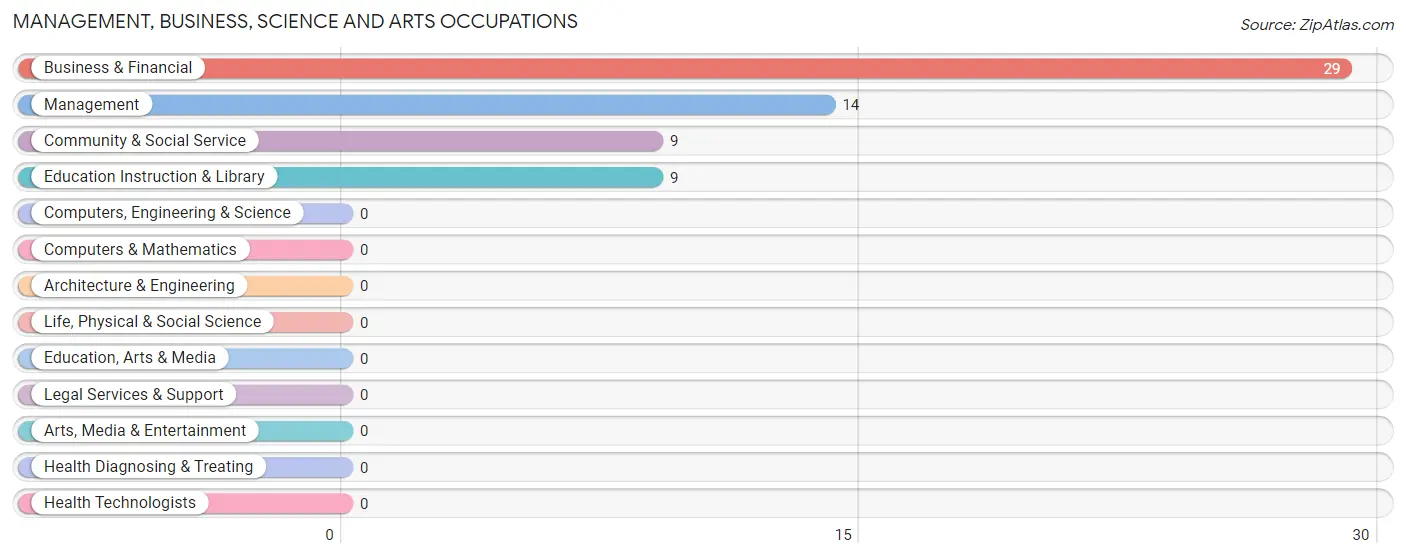
Management, Business, Science and Arts Occupations by Sex
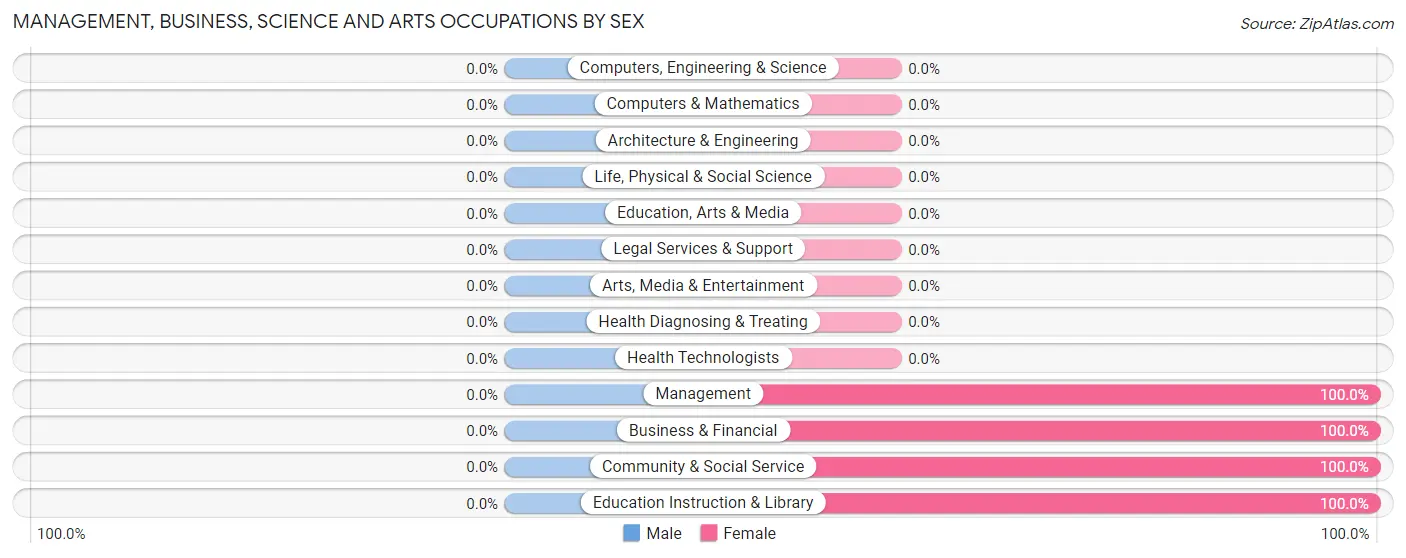
| Occupation | Male | Female |
| Management | 0 (0.0%) | 14 (100.0%) |
| Business & Financial | 0 (0.0%) | 29 (100.0%) |
| Computers, Engineering & Science | 0 (0.0%) | 0 (0.0%) |
| Computers & Mathematics | 0 (0.0%) | 0 (0.0%) |
| Architecture & Engineering | 0 (0.0%) | 0 (0.0%) |
| Life, Physical & Social Science | 0 (0.0%) | 0 (0.0%) |
| Community & Social Service | 0 (0.0%) | 9 (100.0%) |
| Education, Arts & Media | 0 (0.0%) | 0 (0.0%) |
| Legal Services & Support | 0 (0.0%) | 0 (0.0%) |
| Education Instruction & Library | 0 (0.0%) | 9 (100.0%) |
| Arts, Media & Entertainment | 0 (0.0%) | 0 (0.0%) |
| Health Diagnosing & Treating | 0 (0.0%) | 0 (0.0%) |
| Health Technologists | 0 (0.0%) | 0 (0.0%) |
| Total (Category) | 0 (0.0%) | 52 (100.0%) |
| Total (Overall) | 95 (51.3%) | 90 (48.6%) |
Services Occupations
The most common Services occupations in Matagorda are Personal Care & Service (14 | 7.6%), and Cleaning & Maintenance (10 | 5.4%).
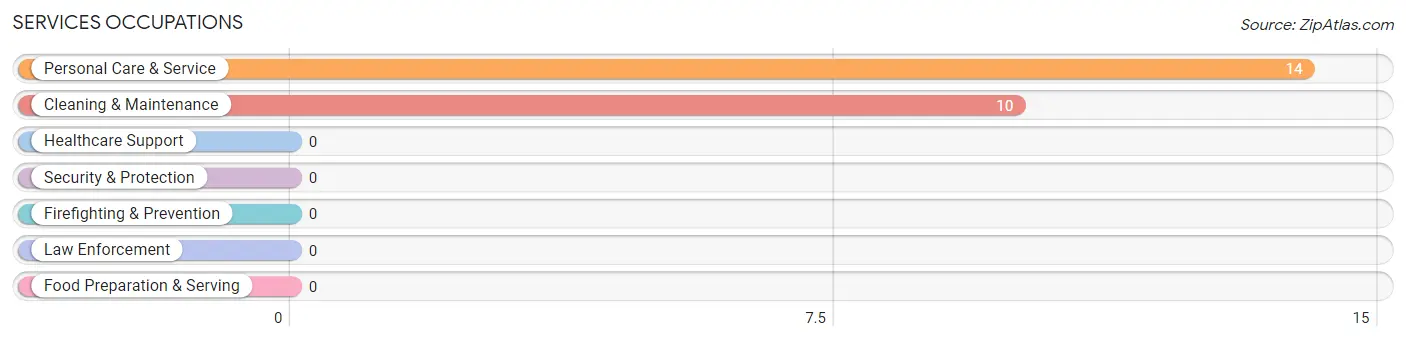
Services Occupations by Sex
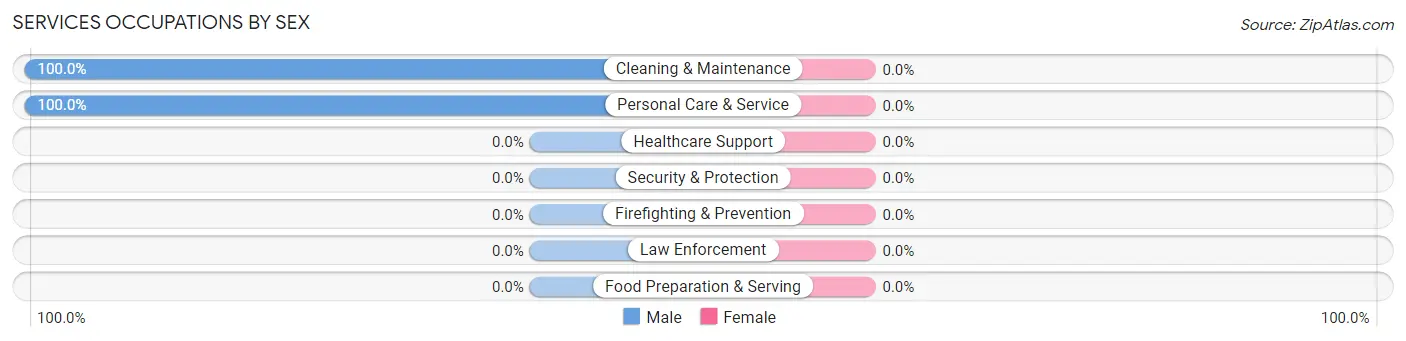
| Occupation | Male | Female |
| Healthcare Support | 0 (0.0%) | 0 (0.0%) |
| Security & Protection | 0 (0.0%) | 0 (0.0%) |
| Firefighting & Prevention | 0 (0.0%) | 0 (0.0%) |
| Law Enforcement | 0 (0.0%) | 0 (0.0%) |
| Food Preparation & Serving | 0 (0.0%) | 0 (0.0%) |
| Cleaning & Maintenance | 10 (100.0%) | 0 (0.0%) |
| Personal Care & Service | 14 (100.0%) | 0 (0.0%) |
| Total (Category) | 24 (100.0%) | 0 (0.0%) |
| Total (Overall) | 95 (51.3%) | 90 (48.6%) |
Sales and Office Occupations
The most common Sales and Office occupations in Matagorda are Office & Administration (20 | 10.8%), and Sales & Related (18 | 9.7%).
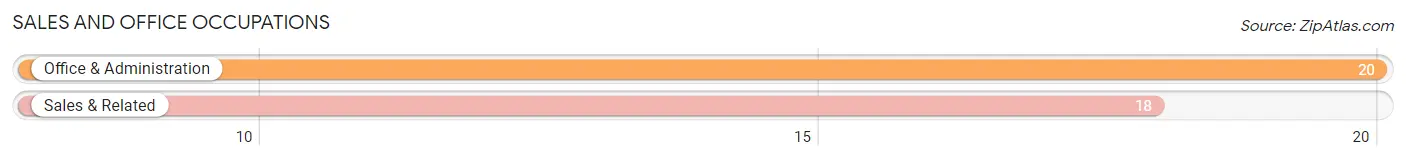
Sales and Office Occupations by Sex
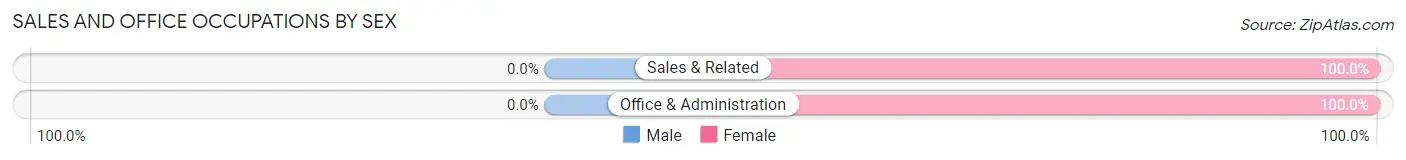
| Occupation | Male | Female |
| Sales & Related | 0 (0.0%) | 18 (100.0%) |
| Office & Administration | 0 (0.0%) | 20 (100.0%) |
| Total (Category) | 0 (0.0%) | 38 (100.0%) |
| Total (Overall) | 95 (51.3%) | 90 (48.6%) |
Natural Resources, Construction and Maintenance Occupations
The most common Natural Resources, Construction and Maintenance occupations in Matagorda are Construction & Extraction (42 | 22.7%), and Installation, Maintenance & Repair (18 | 9.7%).
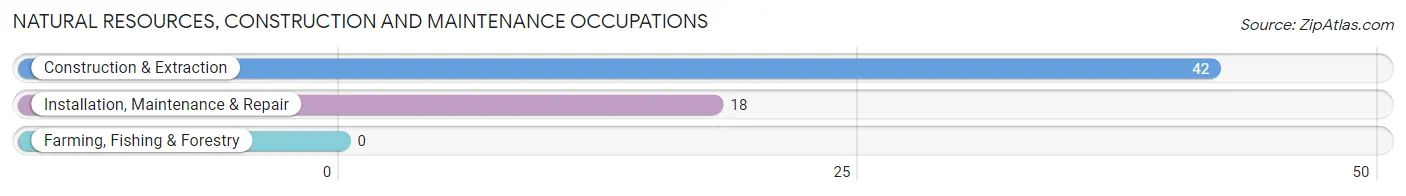
Natural Resources, Construction and Maintenance Occupations by Sex
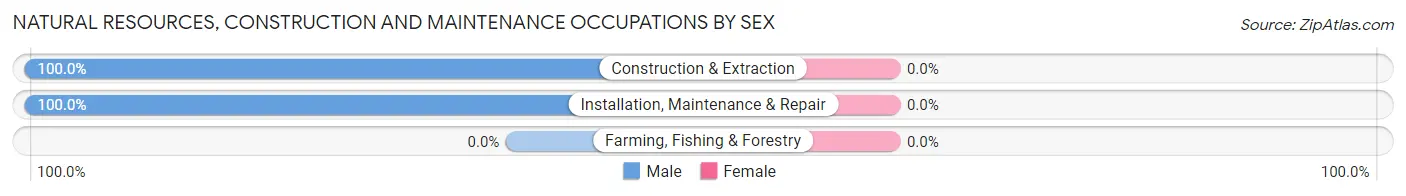
| Occupation | Male | Female |
| Farming, Fishing & Forestry | 0 (0.0%) | 0 (0.0%) |
| Construction & Extraction | 42 (100.0%) | 0 (0.0%) |
| Installation, Maintenance & Repair | 18 (100.0%) | 0 (0.0%) |
| Total (Category) | 60 (100.0%) | 0 (0.0%) |
| Total (Overall) | 95 (51.3%) | 90 (48.6%) |
Production, Transportation and Moving Occupations
The most common Production, Transportation and Moving occupations in Matagorda are , and Material Moving (11 | 5.9%).
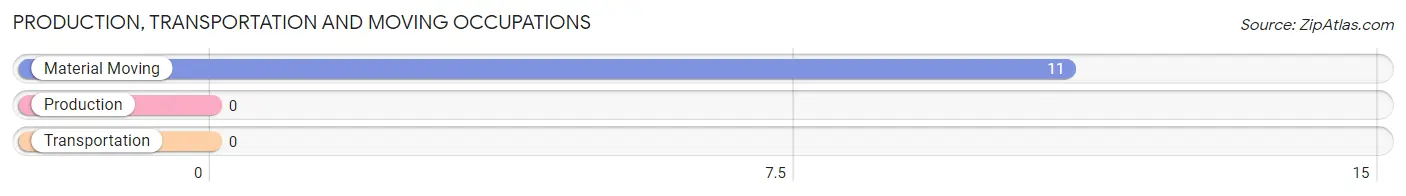
Production, Transportation and Moving Occupations by Sex
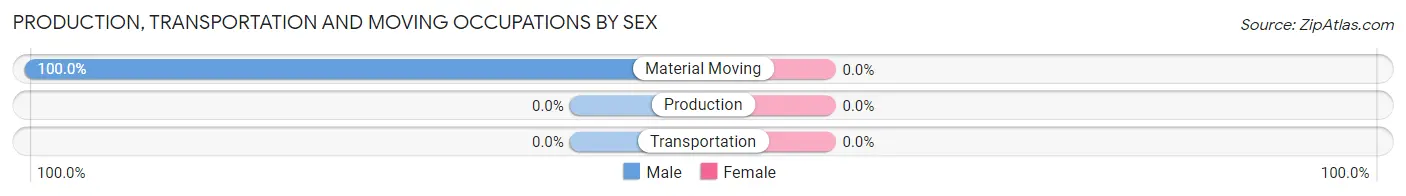
| Occupation | Male | Female |
| Production | 0 (0.0%) | 0 (0.0%) |
| Transportation | 0 (0.0%) | 0 (0.0%) |
| Material Moving | 11 (100.0%) | 0 (0.0%) |
| Total (Category) | 11 (100.0%) | 0 (0.0%) |
| Total (Overall) | 95 (51.3%) | 90 (48.6%) |
Employment Industries by Sex in Matagorda
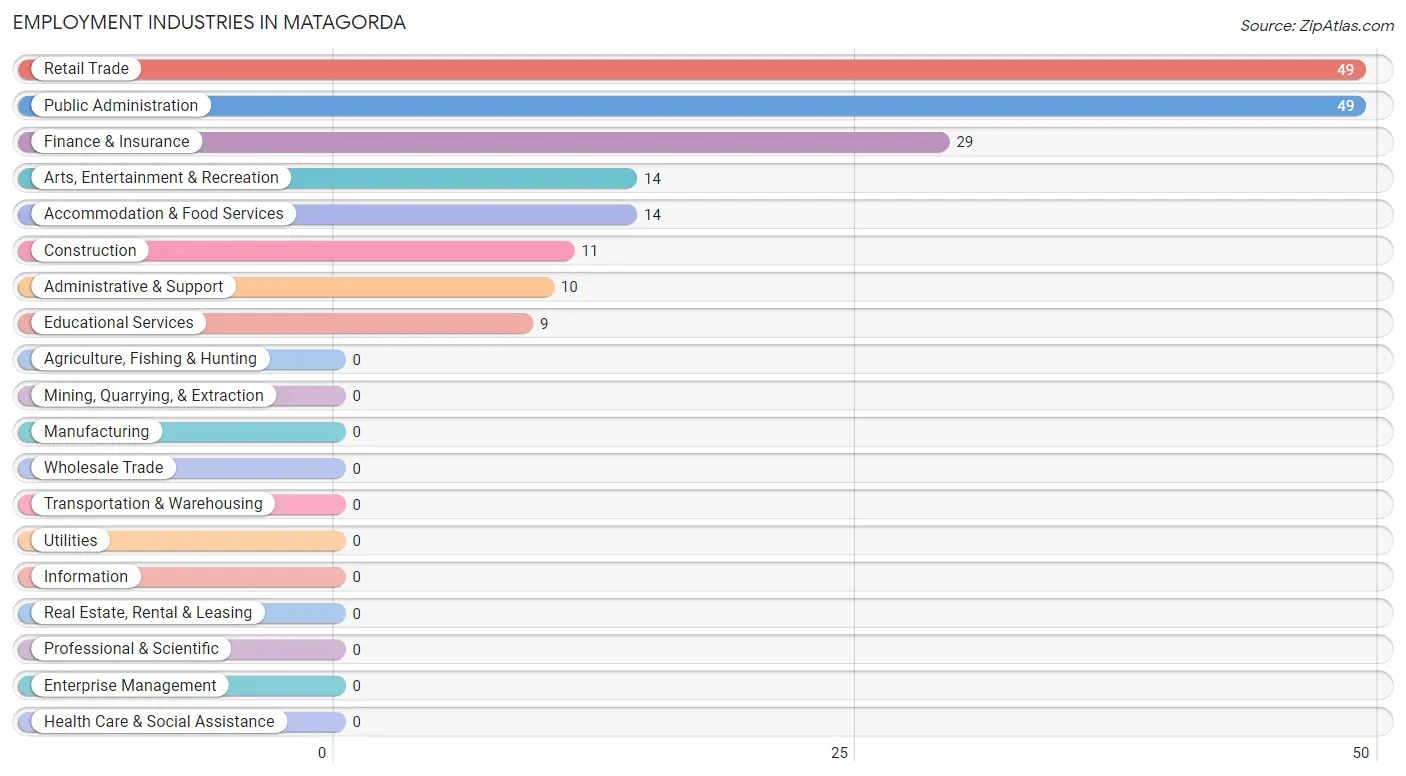
Employment Industries in Matagorda
The major employment industries in Matagorda include Retail Trade (49 | 26.5%), Public Administration (49 | 26.5%), Finance & Insurance (29 | 15.7%), Arts, Entertainment & Recreation (14 | 7.6%), and Accommodation & Food Services (14 | 7.6%).
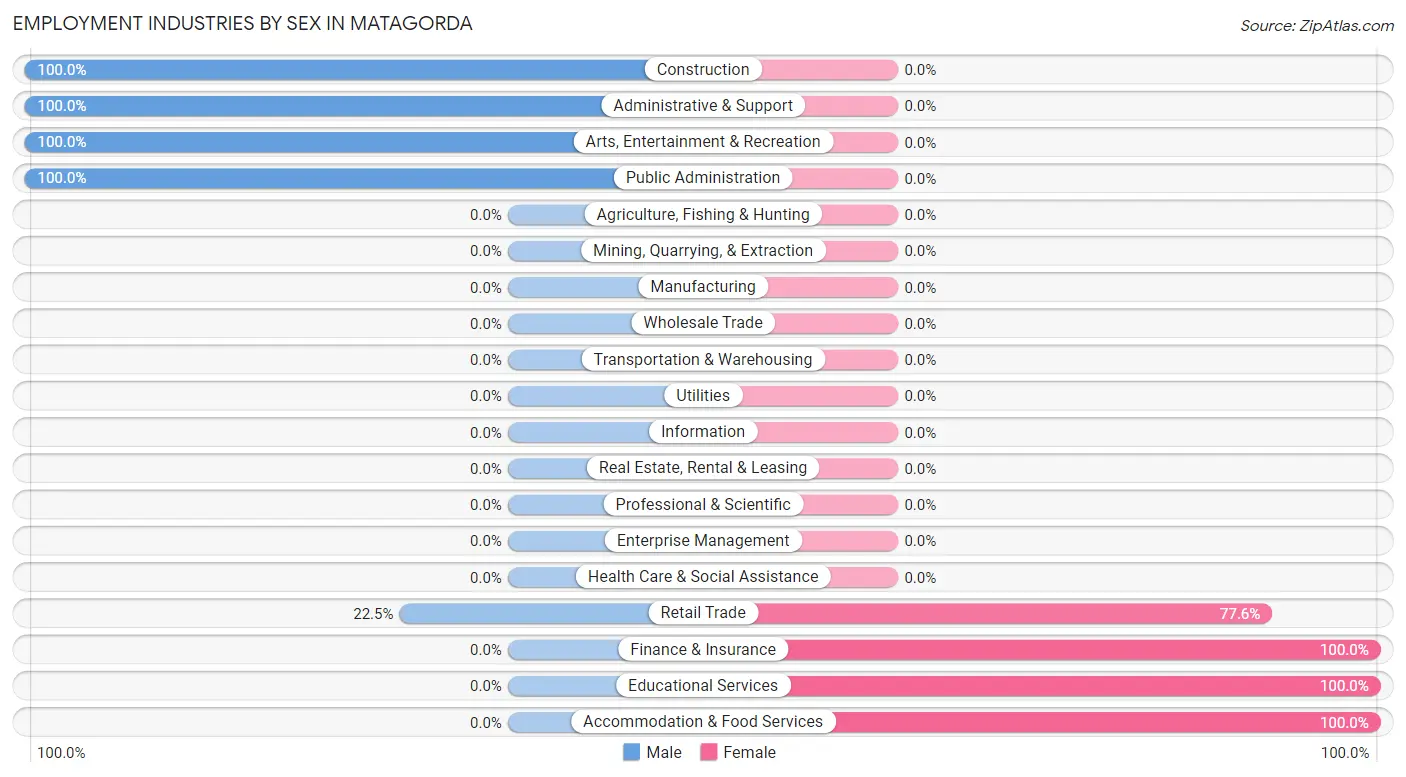
Employment Industries by Sex in Matagorda
The Matagorda industries that see more men than women are Construction (100.0%), Administrative & Support (100.0%), and Arts, Entertainment & Recreation (100.0%), whereas the industries that tend to have a higher number of women are Finance & Insurance (100.0%), Educational Services (100.0%), and Accommodation & Food Services (100.0%).
| Industry | Male | Female |
| Agriculture, Fishing & Hunting | 0 (0.0%) | 0 (0.0%) |
| Mining, Quarrying, & Extraction | 0 (0.0%) | 0 (0.0%) |
| Construction | 11 (100.0%) | 0 (0.0%) |
| Manufacturing | 0 (0.0%) | 0 (0.0%) |
| Wholesale Trade | 0 (0.0%) | 0 (0.0%) |
| Retail Trade | 11 (22.5%) | 38 (77.5%) |
| Transportation & Warehousing | 0 (0.0%) | 0 (0.0%) |
| Utilities | 0 (0.0%) | 0 (0.0%) |
| Information | 0 (0.0%) | 0 (0.0%) |
| Finance & Insurance | 0 (0.0%) | 29 (100.0%) |
| Real Estate, Rental & Leasing | 0 (0.0%) | 0 (0.0%) |
| Professional & Scientific | 0 (0.0%) | 0 (0.0%) |
| Enterprise Management | 0 (0.0%) | 0 (0.0%) |
| Administrative & Support | 10 (100.0%) | 0 (0.0%) |
| Educational Services | 0 (0.0%) | 9 (100.0%) |
| Health Care & Social Assistance | 0 (0.0%) | 0 (0.0%) |
| Arts, Entertainment & Recreation | 14 (100.0%) | 0 (0.0%) |
| Accommodation & Food Services | 0 (0.0%) | 14 (100.0%) |
| Public Administration | 49 (100.0%) | 0 (0.0%) |
| Total | 95 (51.3%) | 90 (48.6%) |
Education in Matagorda
School Enrollment in Matagorda
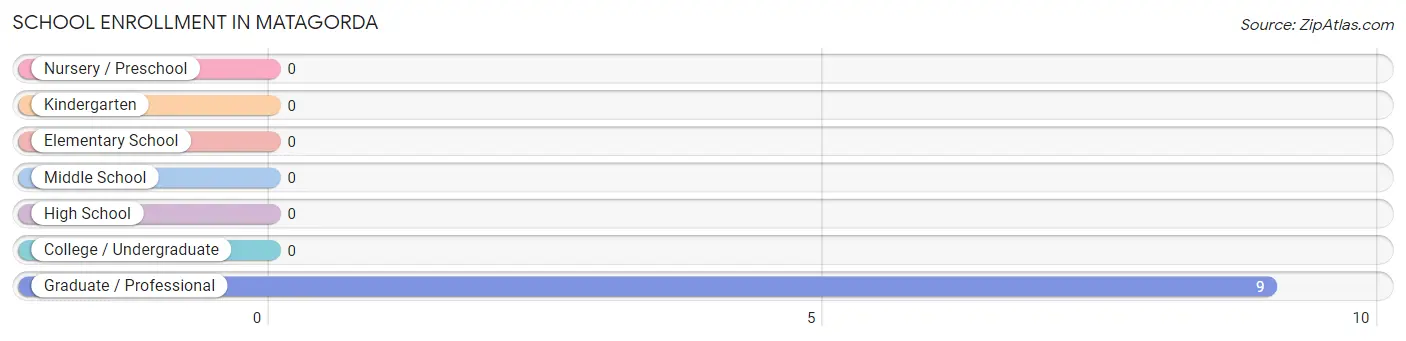
| School Level | # Students | % Students |
| Nursery / Preschool | 0 | 0.0% |
| Kindergarten | 0 | 0.0% |
| Elementary School | 0 | 0.0% |
| Middle School | 0 | 0.0% |
| High School | 0 | 0.0% |
| College / Undergraduate | 0 | 0.0% |
| Graduate / Professional | 9 | 100.0% |
| Total | 9 | 100.0% |
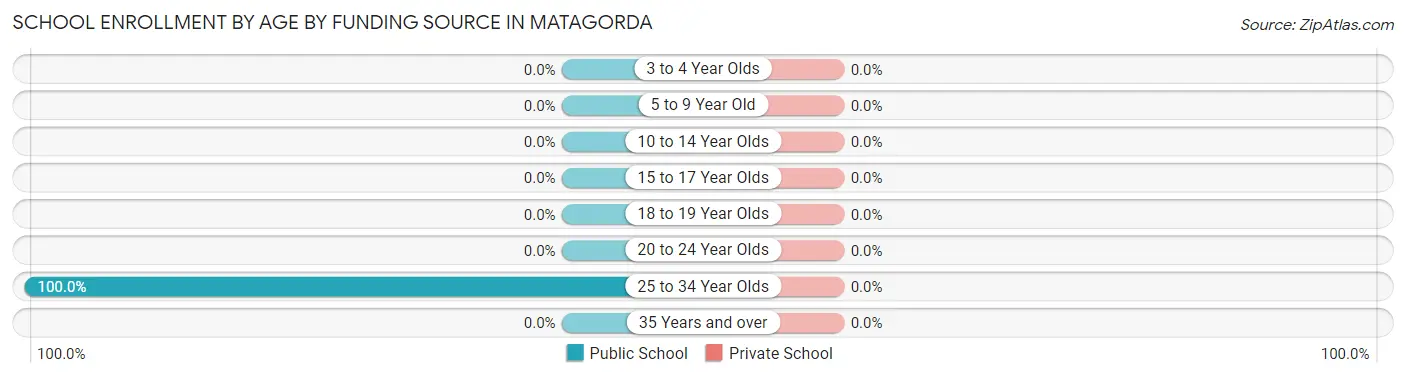
School Enrollment by Age by Funding Source in Matagorda
| Age Bracket | Public School | Private School |
| 3 to 4 Year Olds | 0 (0.0%) | 0 (0.0%) |
| 5 to 9 Year Old | 0 (0.0%) | 0 (0.0%) |
| 10 to 14 Year Olds | 0 (0.0%) | 0 (0.0%) |
| 15 to 17 Year Olds | 0 (0.0%) | 0 (0.0%) |
| 18 to 19 Year Olds | 0 (0.0%) | 0 (0.0%) |
| 20 to 24 Year Olds | 0 (0.0%) | 0 (0.0%) |
| 25 to 34 Year Olds | 9 (100.0%) | 0 (0.0%) |
| 35 Years and over | 0 (0.0%) | 0 (0.0%) |
| Total | 9 (100.0%) | 0 (0.0%) |
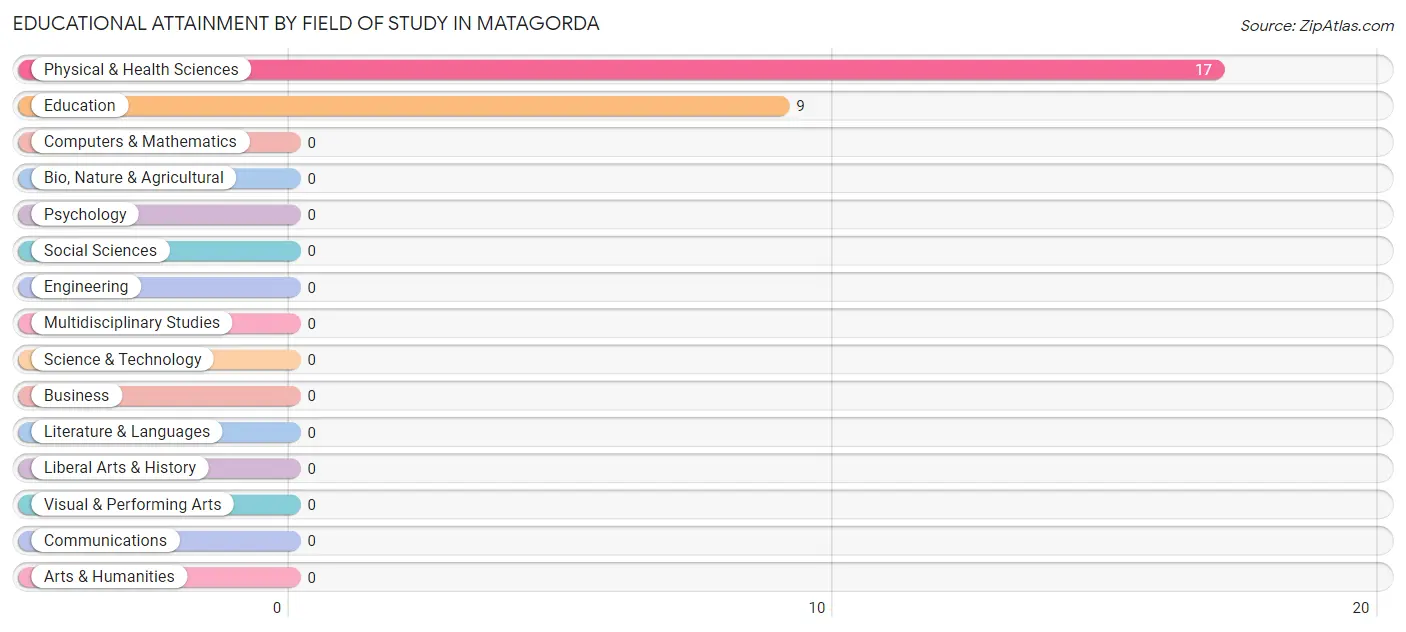
Educational Attainment by Field of Study in Matagorda
Physical & health sciences (17 | 65.4%), and education (9 | 34.6%) are the most common fields of study among 26 individuals in Matagorda who have obtained a bachelor's degree or higher.
| Field of Study | # Graduates | % Graduates |
| Computers & Mathematics | 0 | 0.0% |
| Bio, Nature & Agricultural | 0 | 0.0% |
| Physical & Health Sciences | 17 | 65.4% |
| Psychology | 0 | 0.0% |
| Social Sciences | 0 | 0.0% |
| Engineering | 0 | 0.0% |
| Multidisciplinary Studies | 0 | 0.0% |
| Science & Technology | 0 | 0.0% |
| Business | 0 | 0.0% |
| Education | 9 | 34.6% |
| Literature & Languages | 0 | 0.0% |
| Liberal Arts & History | 0 | 0.0% |
| Visual & Performing Arts | 0 | 0.0% |
| Communications | 0 | 0.0% |
| Arts & Humanities | 0 | 0.0% |
| Total | 26 | 100.0% |
Transportation & Commute in Matagorda
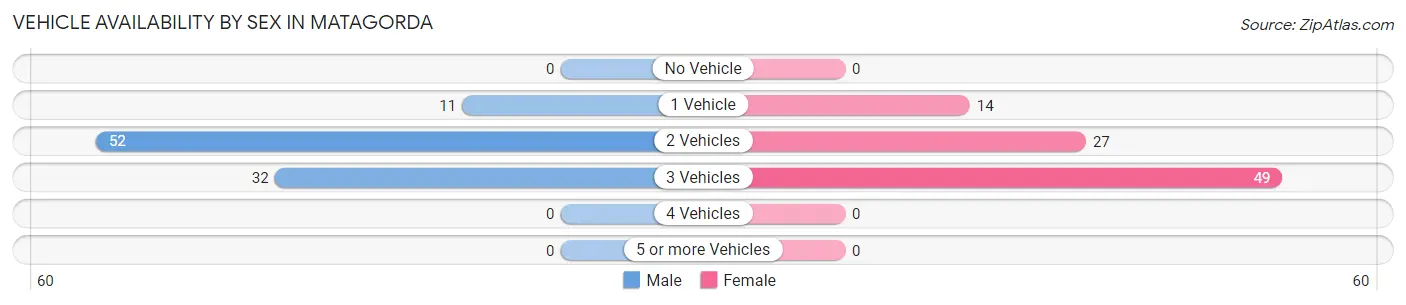
Vehicle Availability by Sex in Matagorda
The most prevalent vehicle ownership categories in Matagorda are males with 2 vehicles (52, accounting for 54.7%) and females with 2 vehicles (27, making up 57.8%).
| Vehicles Available | Male | Female |
| No Vehicle | 0 (0.0%) | 0 (0.0%) |
| 1 Vehicle | 11 (11.6%) | 14 (15.6%) |
| 2 Vehicles | 52 (54.7%) | 27 (30.0%) |
| 3 Vehicles | 32 (33.7%) | 49 (54.4%) |
| 4 Vehicles | 0 (0.0%) | 0 (0.0%) |
| 5 or more Vehicles | 0 (0.0%) | 0 (0.0%) |
| Total | 95 (100.0%) | 90 (100.0%) |
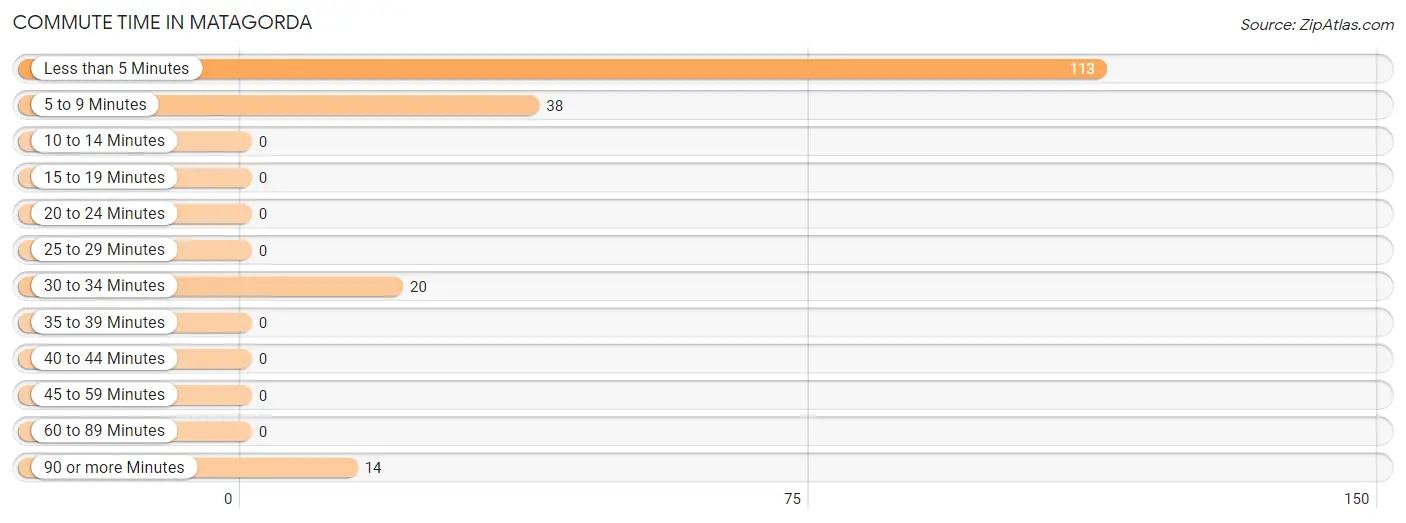
Commute Time in Matagorda
The most frequently occuring commute durations in Matagorda are less than 5 minutes (113 commuters, 61.1%), 5 to 9 minutes (38 commuters, 20.5%), and 30 to 34 minutes (20 commuters, 10.8%).
| Commute Time | # Commuters | % Commuters |
| Less than 5 Minutes | 113 | 61.1% |
| 5 to 9 Minutes | 38 | 20.5% |
| 10 to 14 Minutes | 0 | 0.0% |
| 15 to 19 Minutes | 0 | 0.0% |
| 20 to 24 Minutes | 0 | 0.0% |
| 25 to 29 Minutes | 0 | 0.0% |
| 30 to 34 Minutes | 20 | 10.8% |
| 35 to 39 Minutes | 0 | 0.0% |
| 40 to 44 Minutes | 0 | 0.0% |
| 45 to 59 Minutes | 0 | 0.0% |
| 60 to 89 Minutes | 0 | 0.0% |
| 90 or more Minutes | 14 | 7.6% |
Commute Time by Sex in Matagorda
The most common commute times in Matagorda are less than 5 minutes (52 commuters, 54.7%) for males and less than 5 minutes (61 commuters, 67.8%) for females.
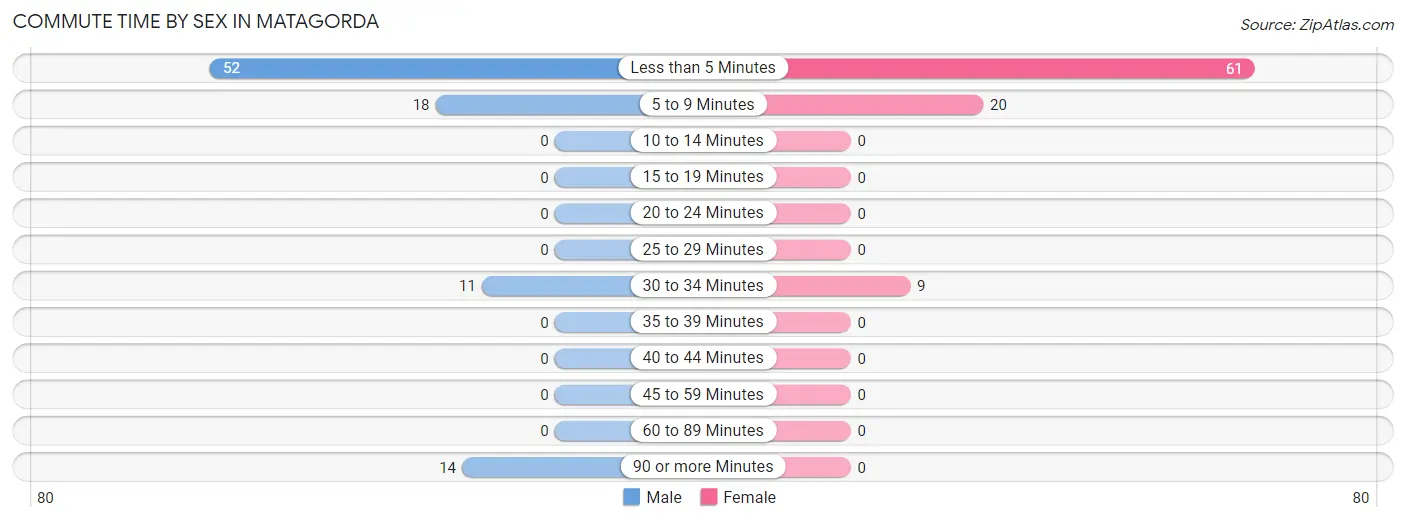
| Commute Time | Male | Female |
| Less than 5 Minutes | 52 (54.7%) | 61 (67.8%) |
| 5 to 9 Minutes | 18 (19.0%) | 20 (22.2%) |
| 10 to 14 Minutes | 0 (0.0%) | 0 (0.0%) |
| 15 to 19 Minutes | 0 (0.0%) | 0 (0.0%) |
| 20 to 24 Minutes | 0 (0.0%) | 0 (0.0%) |
| 25 to 29 Minutes | 0 (0.0%) | 0 (0.0%) |
| 30 to 34 Minutes | 11 (11.6%) | 9 (10.0%) |
| 35 to 39 Minutes | 0 (0.0%) | 0 (0.0%) |
| 40 to 44 Minutes | 0 (0.0%) | 0 (0.0%) |
| 45 to 59 Minutes | 0 (0.0%) | 0 (0.0%) |
| 60 to 89 Minutes | 0 (0.0%) | 0 (0.0%) |
| 90 or more Minutes | 14 (14.7%) | 0 (0.0%) |
Time of Departure to Work by Sex in Matagorda
The most frequent times of departure to work in Matagorda are 6:30 AM to 6:59 AM (49, 51.6%) for males and 8:30 AM to 8:59 AM (38, 42.2%) for females.
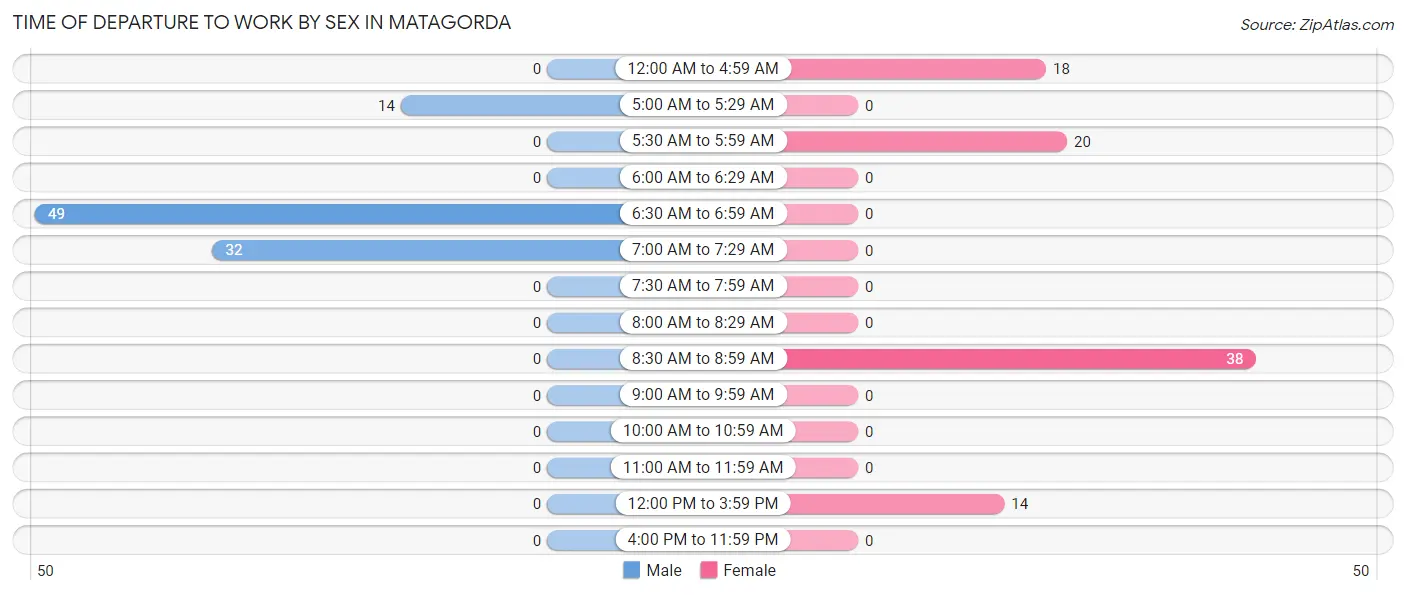
| Time of Departure | Male | Female |
| 12:00 AM to 4:59 AM | 0 (0.0%) | 18 (20.0%) |
| 5:00 AM to 5:29 AM | 14 (14.7%) | 0 (0.0%) |
| 5:30 AM to 5:59 AM | 0 (0.0%) | 20 (22.2%) |
| 6:00 AM to 6:29 AM | 0 (0.0%) | 0 (0.0%) |
| 6:30 AM to 6:59 AM | 49 (51.6%) | 0 (0.0%) |
| 7:00 AM to 7:29 AM | 32 (33.7%) | 0 (0.0%) |
| 7:30 AM to 7:59 AM | 0 (0.0%) | 0 (0.0%) |
| 8:00 AM to 8:29 AM | 0 (0.0%) | 0 (0.0%) |
| 8:30 AM to 8:59 AM | 0 (0.0%) | 38 (42.2%) |
| 9:00 AM to 9:59 AM | 0 (0.0%) | 0 (0.0%) |
| 10:00 AM to 10:59 AM | 0 (0.0%) | 0 (0.0%) |
| 11:00 AM to 11:59 AM | 0 (0.0%) | 0 (0.0%) |
| 12:00 PM to 3:59 PM | 0 (0.0%) | 14 (15.6%) |
| 4:00 PM to 11:59 PM | 0 (0.0%) | 0 (0.0%) |
| Total | 95 (100.0%) | 90 (100.0%) |
Housing Occupancy in Matagorda
Occupancy by Ownership in Matagorda
Of the total 238 dwellings in Matagorda, owner-occupied units account for 196 (82.4%), while renter-occupied units make up 42 (17.6%).
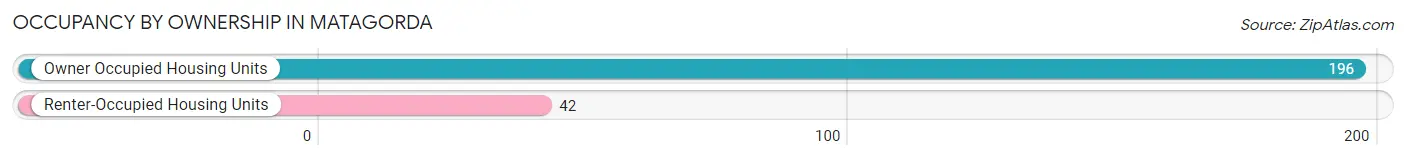
| Occupancy | # Housing Units | % Housing Units |
| Owner Occupied Housing Units | 196 | 82.4% |
| Renter-Occupied Housing Units | 42 | 17.6% |
| Total Occupied Housing Units | 238 | 100.0% |
Occupancy by Household Size in Matagorda
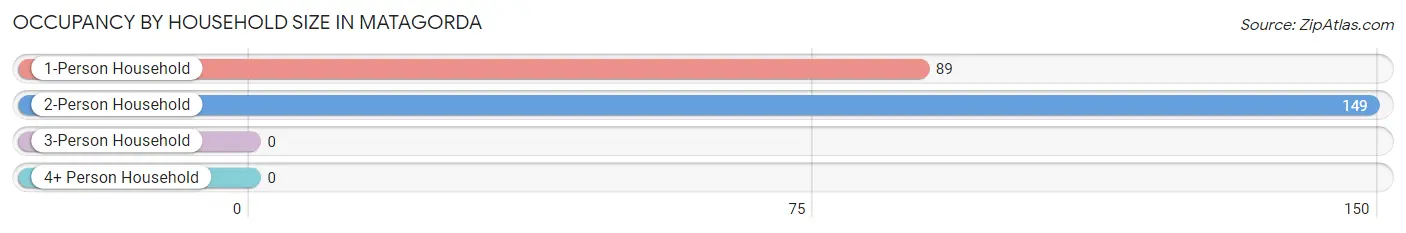
| Household Size | # Housing Units | % Housing Units |
| 1-Person Household | 89 | 37.4% |
| 2-Person Household | 149 | 62.6% |
| 3-Person Household | 0 | 0.0% |
| 4+ Person Household | 0 | 0.0% |
| Total Housing Units | 238 | 100.0% |
Occupancy by Ownership by Household Size in Matagorda
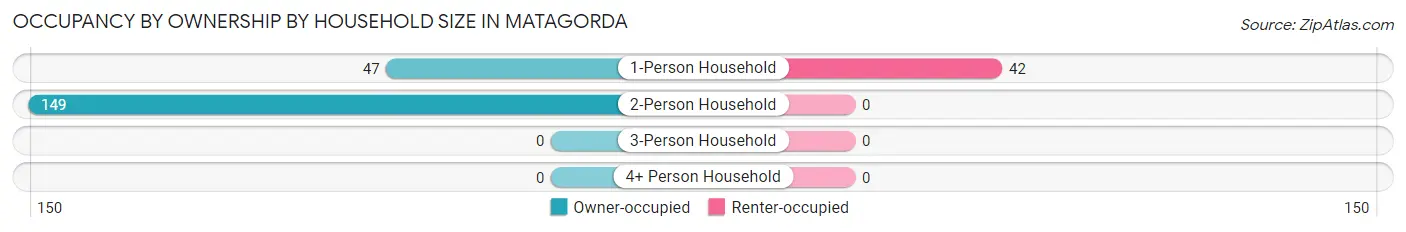
| Household Size | Owner-occupied | Renter-occupied |
| 1-Person Household | 47 (52.8%) | 42 (47.2%) |
| 2-Person Household | 149 (100.0%) | 0 (0.0%) |
| 3-Person Household | 0 (0.0%) | 0 (0.0%) |
| 4+ Person Household | 0 (0.0%) | 0 (0.0%) |
| Total Housing Units | 196 (82.4%) | 42 (17.6%) |
Occupancy by Educational Attainment in Matagorda
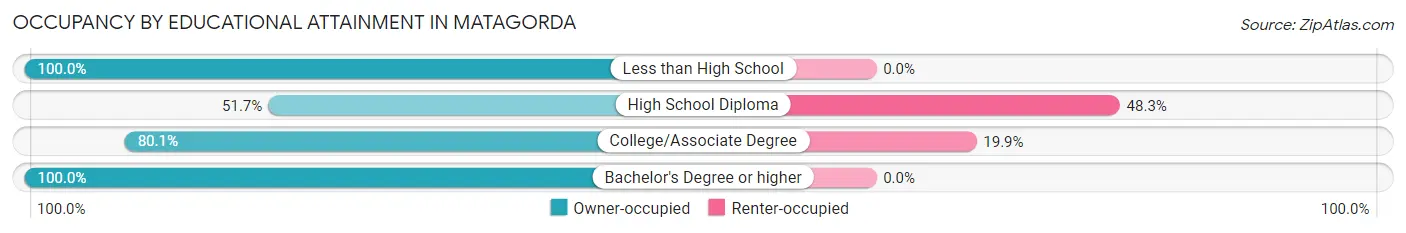
| Household Size | Owner-occupied | Renter-occupied |
| Less than High School | 42 (100.0%) | 0 (0.0%) |
| High School Diploma | 15 (51.7%) | 14 (48.3%) |
| College/Associate Degree | 113 (80.1%) | 28 (19.9%) |
| Bachelor's Degree or higher | 26 (100.0%) | 0 (0.0%) |
Occupancy by Age of Householder in Matagorda
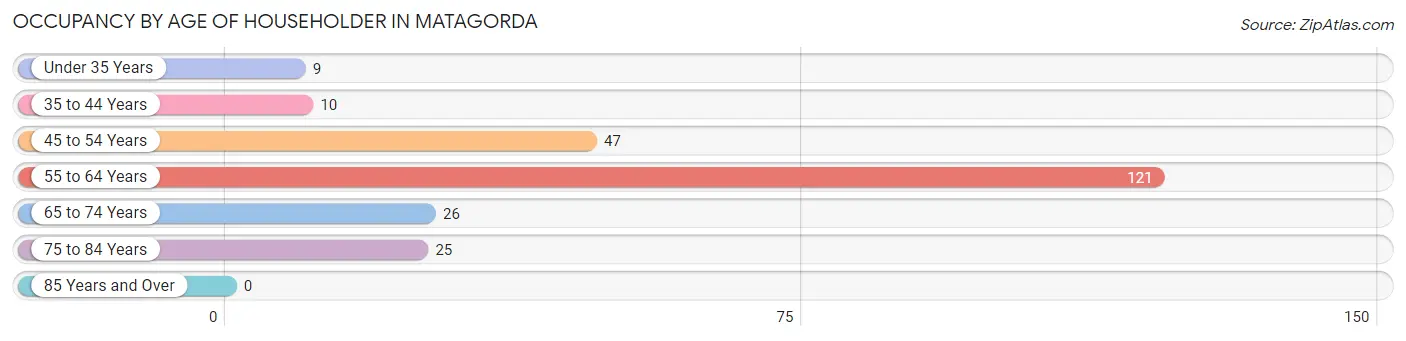
| Age Bracket | # Households | % Households |
| Under 35 Years | 9 | 3.8% |
| 35 to 44 Years | 10 | 4.2% |
| 45 to 54 Years | 47 | 19.8% |
| 55 to 64 Years | 121 | 50.8% |
| 65 to 74 Years | 26 | 10.9% |
| 75 to 84 Years | 25 | 10.5% |
| 85 Years and Over | 0 | 0.0% |
| Total | 238 | 100.0% |
Housing Finances in Matagorda
Median Income by Occupancy in Matagorda
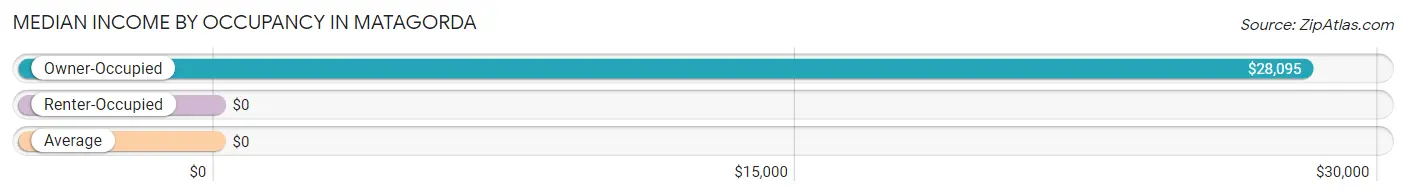
| Occupancy Type | # Households | Median Income |
| Owner-Occupied | 196 (82.4%) | $28,095 |
| Renter-Occupied | 42 (17.6%) | $0 |
| Average | 238 (100.0%) | $0 |
Occupancy by Householder Income Bracket in Matagorda
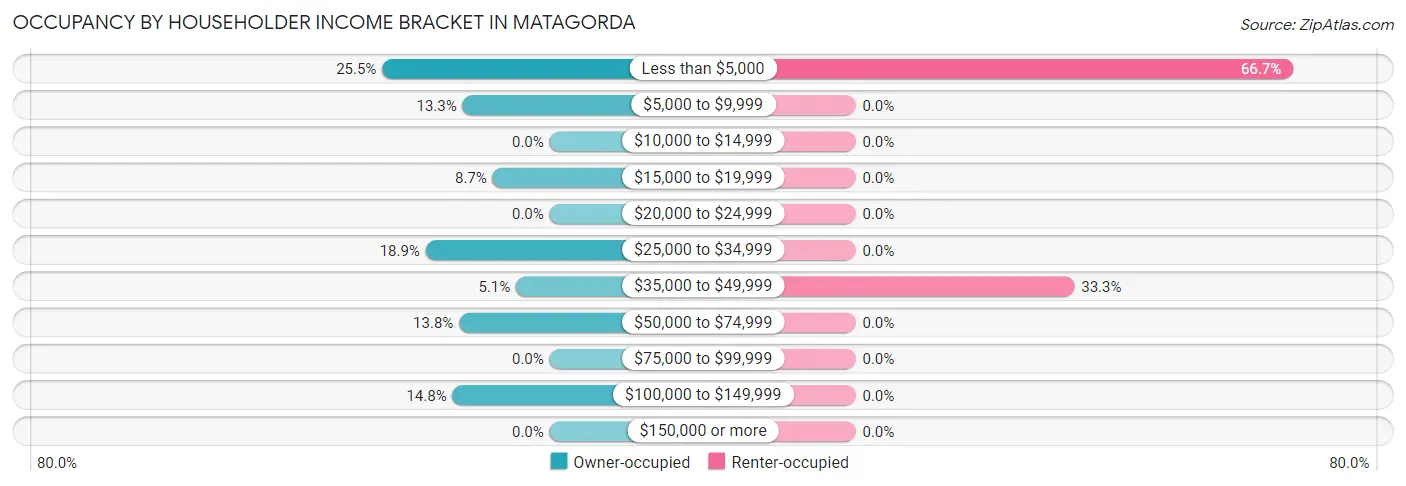
| Income Bracket | Owner-occupied | Renter-occupied |
| Less than $5,000 | 50 (25.5%) | 28 (66.7%) |
| $5,000 to $9,999 | 26 (13.3%) | 0 (0.0%) |
| $10,000 to $14,999 | 0 (0.0%) | 0 (0.0%) |
| $15,000 to $19,999 | 17 (8.7%) | 0 (0.0%) |
| $20,000 to $24,999 | 0 (0.0%) | 0 (0.0%) |
| $25,000 to $34,999 | 37 (18.9%) | 0 (0.0%) |
| $35,000 to $49,999 | 10 (5.1%) | 14 (33.3%) |
| $50,000 to $74,999 | 27 (13.8%) | 0 (0.0%) |
| $75,000 to $99,999 | 0 (0.0%) | 0 (0.0%) |
| $100,000 to $149,999 | 29 (14.8%) | 0 (0.0%) |
| $150,000 or more | 0 (0.0%) | 0 (0.0%) |
| Total | 196 (100.0%) | 42 (100.0%) |
Monthly Housing Cost Tiers in Matagorda
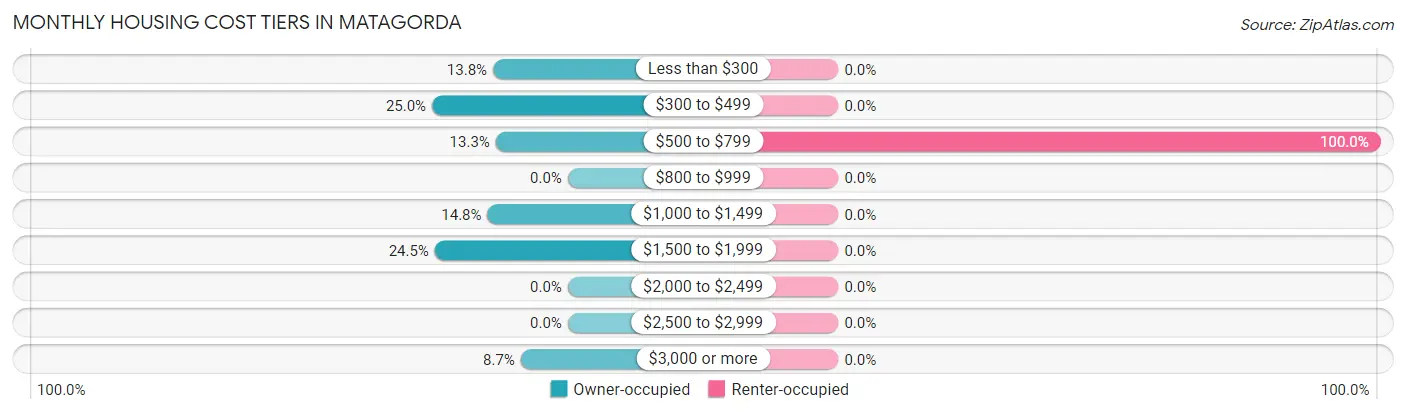
| Monthly Cost | Owner-occupied | Renter-occupied |
| Less than $300 | 27 (13.8%) | 0 (0.0%) |
| $300 to $499 | 49 (25.0%) | 0 (0.0%) |
| $500 to $799 | 26 (13.3%) | 42 (100.0%) |
| $800 to $999 | 0 (0.0%) | 0 (0.0%) |
| $1,000 to $1,499 | 29 (14.8%) | 0 (0.0%) |
| $1,500 to $1,999 | 48 (24.5%) | 0 (0.0%) |
| $2,000 to $2,499 | 0 (0.0%) | 0 (0.0%) |
| $2,500 to $2,999 | 0 (0.0%) | 0 (0.0%) |
| $3,000 or more | 17 (8.7%) | 0 (0.0%) |
| Total | 196 (100.0%) | 42 (100.0%) |
Physical Housing Characteristics in Matagorda
Housing Structures in Matagorda
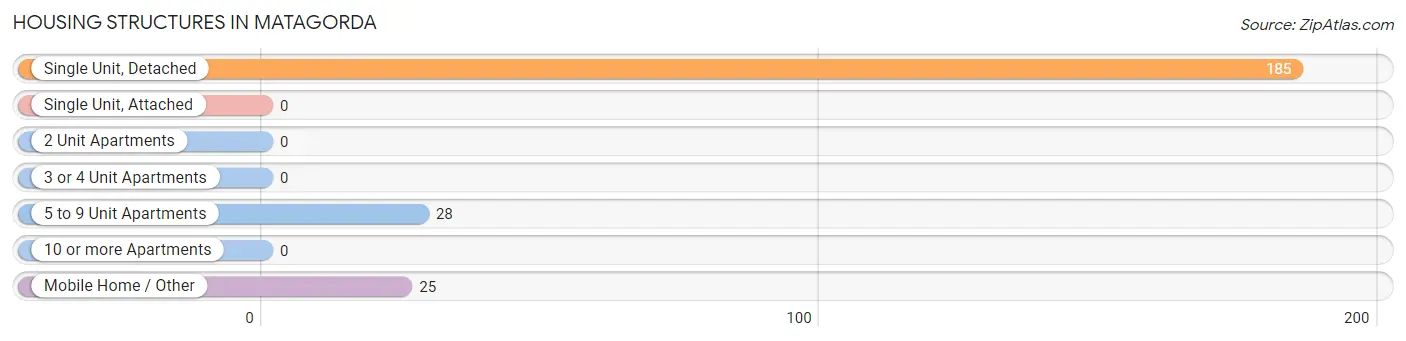
| Structure Type | # Housing Units | % Housing Units |
| Single Unit, Detached | 185 | 77.7% |
| Single Unit, Attached | 0 | 0.0% |
| 2 Unit Apartments | 0 | 0.0% |
| 3 or 4 Unit Apartments | 0 | 0.0% |
| 5 to 9 Unit Apartments | 28 | 11.8% |
| 10 or more Apartments | 0 | 0.0% |
| Mobile Home / Other | 25 | 10.5% |
| Total | 238 | 100.0% |
Housing Structures by Occupancy in Matagorda
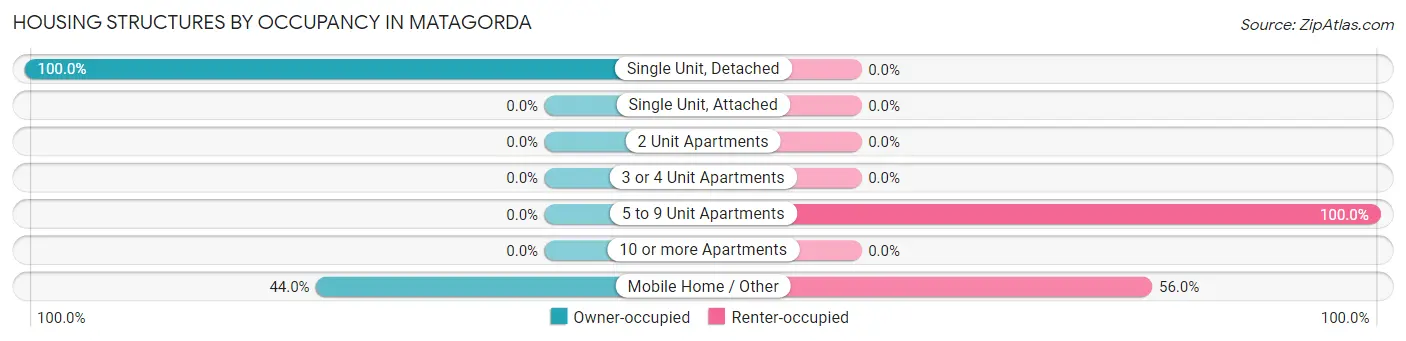
| Structure Type | Owner-occupied | Renter-occupied |
| Single Unit, Detached | 185 (100.0%) | 0 (0.0%) |
| Single Unit, Attached | 0 (0.0%) | 0 (0.0%) |
| 2 Unit Apartments | 0 (0.0%) | 0 (0.0%) |
| 3 or 4 Unit Apartments | 0 (0.0%) | 0 (0.0%) |
| 5 to 9 Unit Apartments | 0 (0.0%) | 28 (100.0%) |
| 10 or more Apartments | 0 (0.0%) | 0 (0.0%) |
| Mobile Home / Other | 11 (44.0%) | 14 (56.0%) |
| Total | 196 (82.4%) | 42 (17.6%) |
Housing Structures by Number of Rooms in Matagorda
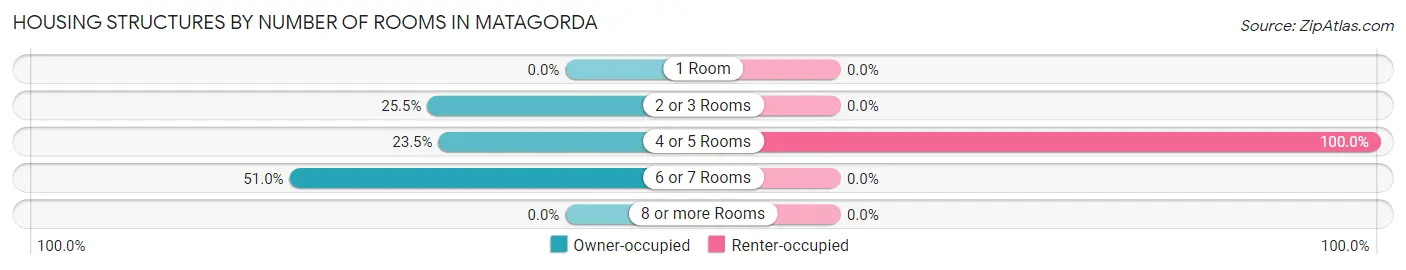
| Number of Rooms | Owner-occupied | Renter-occupied |
| 1 Room | 0 (0.0%) | 0 (0.0%) |
| 2 or 3 Rooms | 50 (25.5%) | 0 (0.0%) |
| 4 or 5 Rooms | 46 (23.5%) | 42 (100.0%) |
| 6 or 7 Rooms | 100 (51.0%) | 0 (0.0%) |
| 8 or more Rooms | 0 (0.0%) | 0 (0.0%) |
| Total | 196 (100.0%) | 42 (100.0%) |
Housing Structure by Heating Type in Matagorda
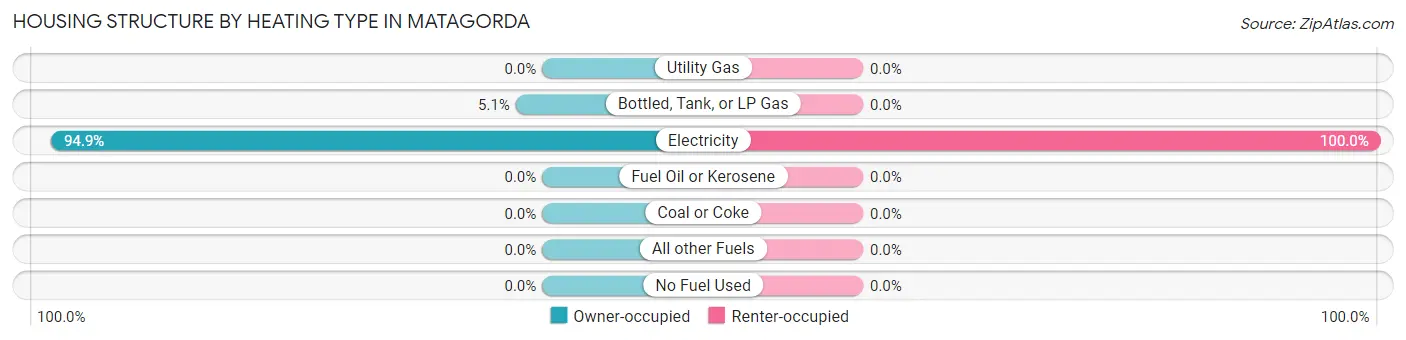
| Heating Type | Owner-occupied | Renter-occupied |
| Utility Gas | 0 (0.0%) | 0 (0.0%) |
| Bottled, Tank, or LP Gas | 10 (5.1%) | 0 (0.0%) |
| Electricity | 186 (94.9%) | 42 (100.0%) |
| Fuel Oil or Kerosene | 0 (0.0%) | 0 (0.0%) |
| Coal or Coke | 0 (0.0%) | 0 (0.0%) |
| All other Fuels | 0 (0.0%) | 0 (0.0%) |
| No Fuel Used | 0 (0.0%) | 0 (0.0%) |
| Total | 196 (100.0%) | 42 (100.0%) |
Household Vehicle Usage in Matagorda
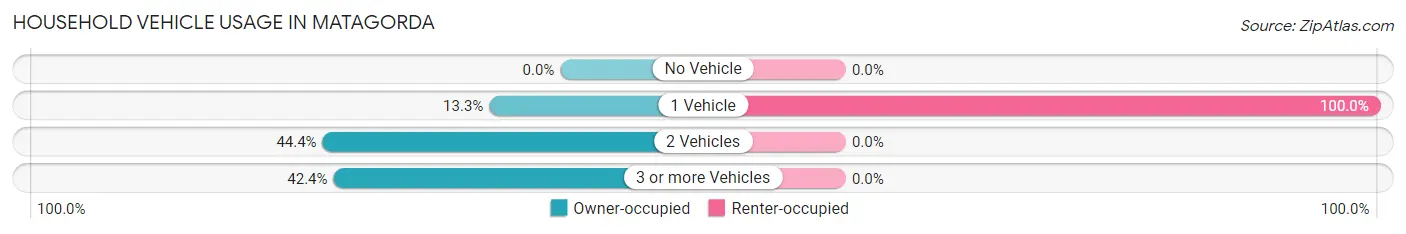
| Vehicles per Household | Owner-occupied | Renter-occupied |
| No Vehicle | 0 (0.0%) | 0 (0.0%) |
| 1 Vehicle | 26 (13.3%) | 42 (100.0%) |
| 2 Vehicles | 87 (44.4%) | 0 (0.0%) |
| 3 or more Vehicles | 83 (42.3%) | 0 (0.0%) |
| Total | 196 (100.0%) | 42 (100.0%) |
Real Estate & Mortgages in Matagorda
Real Estate and Mortgage Overview in Matagorda
| Characteristic | Without Mortgage | With Mortgage |
| Housing Units | 141 | 55 |
| Median Property Value | $135,400 | $0 |
| Median Household Income | - | - |
| Monthly Housing Costs | $445 | $17 |
| Real Estate Taxes | $1,223 | $0 |
Property Value by Mortgage Status in Matagorda
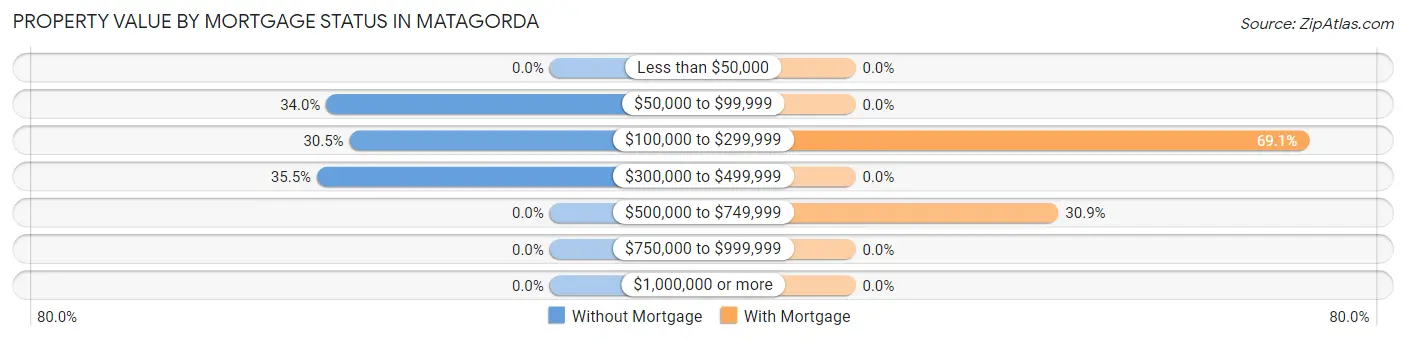
| Property Value | Without Mortgage | With Mortgage |
| Less than $50,000 | 0 (0.0%) | 0 (0.0%) |
| $50,000 to $99,999 | 48 (34.0%) | 0 (0.0%) |
| $100,000 to $299,999 | 43 (30.5%) | 38 (69.1%) |
| $300,000 to $499,999 | 50 (35.5%) | 0 (0.0%) |
| $500,000 to $749,999 | 0 (0.0%) | 17 (30.9%) |
| $750,000 to $999,999 | 0 (0.0%) | 0 (0.0%) |
| $1,000,000 or more | 0 (0.0%) | 0 (0.0%) |
| Total | 141 (100.0%) | 55 (100.0%) |
Household Income by Mortgage Status in Matagorda
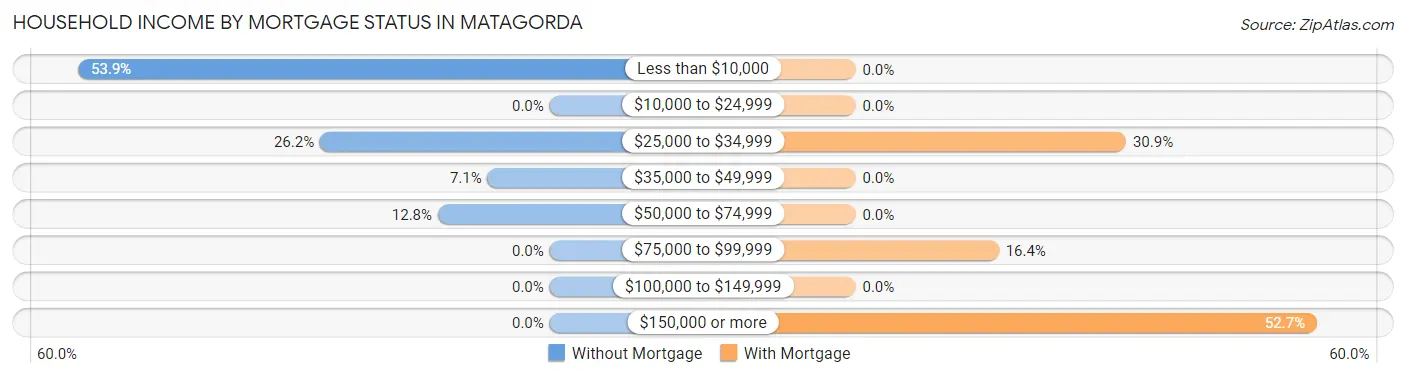
| Household Income | Without Mortgage | With Mortgage |
| Less than $10,000 | 76 (53.9%) | 0 (0.0%) |
| $10,000 to $24,999 | 0 (0.0%) | 0 (0.0%) |
| $25,000 to $34,999 | 37 (26.2%) | 17 (30.9%) |
| $35,000 to $49,999 | 10 (7.1%) | 0 (0.0%) |
| $50,000 to $74,999 | 18 (12.8%) | 0 (0.0%) |
| $75,000 to $99,999 | 0 (0.0%) | 9 (16.4%) |
| $100,000 to $149,999 | 0 (0.0%) | 0 (0.0%) |
| $150,000 or more | 0 (0.0%) | 29 (52.7%) |
| Total | 141 (100.0%) | 55 (100.0%) |
Property Value to Household Income Ratio in Matagorda
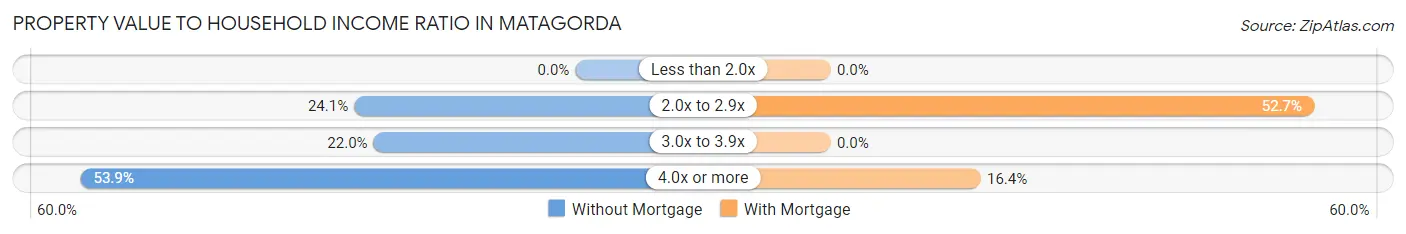
| Value-to-Income Ratio | Without Mortgage | With Mortgage |
| Less than 2.0x | 0 (0.0%) | 0 (0.0%) |
| 2.0x to 2.9x | 34 (24.1%) | 29 (52.7%) |
| 3.0x to 3.9x | 31 (22.0%) | 0 (0.0%) |
| 4.0x or more | 76 (53.9%) | 9 (16.4%) |
| Total | 141 (100.0%) | 55 (100.0%) |
Real Estate Taxes by Mortgage Status in Matagorda
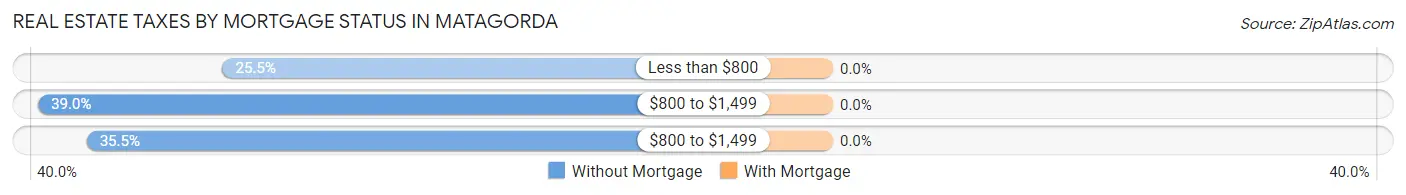
| Property Taxes | Without Mortgage | With Mortgage |
| Less than $800 | 36 (25.5%) | 0 (0.0%) |
| $800 to $1,499 | 55 (39.0%) | 0 (0.0%) |
| $800 to $1,499 | 50 (35.5%) | 0 (0.0%) |
| Total | 141 (100.0%) | 55 (100.0%) |
Health & Disability in Matagorda
Health Insurance Coverage by Age in Matagorda
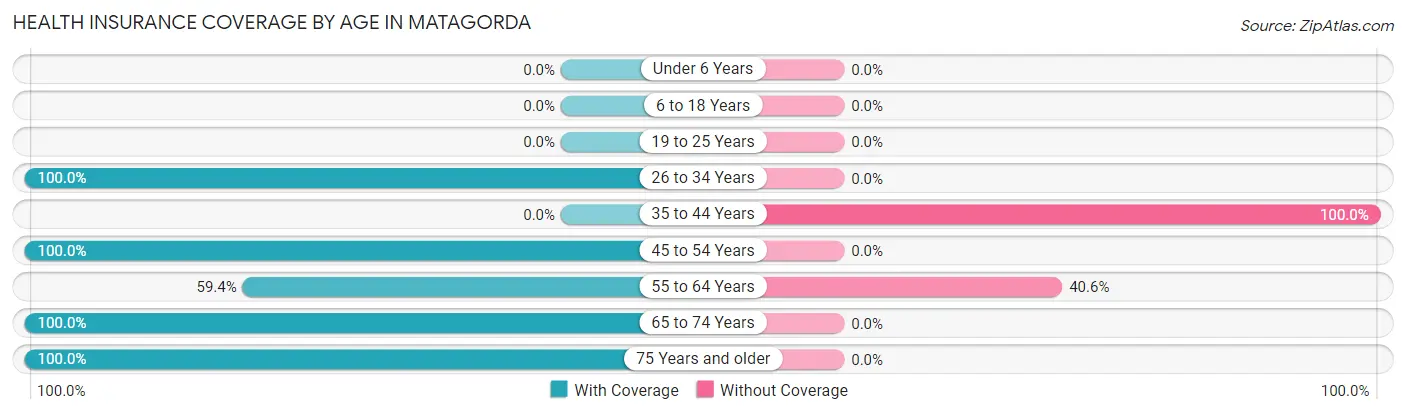
| Age Bracket | With Coverage | Without Coverage |
| Under 6 Years | 0 (0.0%) | 0 (0.0%) |
| 6 to 18 Years | 0 (0.0%) | 0 (0.0%) |
| 19 to 25 Years | 0 (0.0%) | 0 (0.0%) |
| 26 to 34 Years | 20 (100.0%) | 0 (0.0%) |
| 35 to 44 Years | 0 (0.0%) | 10 (100.0%) |
| 45 to 54 Years | 92 (100.0%) | 0 (0.0%) |
| 55 to 64 Years | 111 (59.4%) | 76 (40.6%) |
| 65 to 74 Years | 49 (100.0%) | 0 (0.0%) |
| 75 Years and older | 25 (100.0%) | 0 (0.0%) |
| Total | 297 (77.5%) | 86 (22.5%) |
Health Insurance Coverage by Citizenship Status in Matagorda
| Citizenship Status | With Coverage | Without Coverage |
| Native Born | 0 (0.0%) | 0 (0.0%) |
| Foreign Born, Citizen | 0 (0.0%) | 0 (0.0%) |
| Foreign Born, not a Citizen | 0 (0.0%) | 0 (0.0%) |
Health Insurance Coverage by Household Income in Matagorda
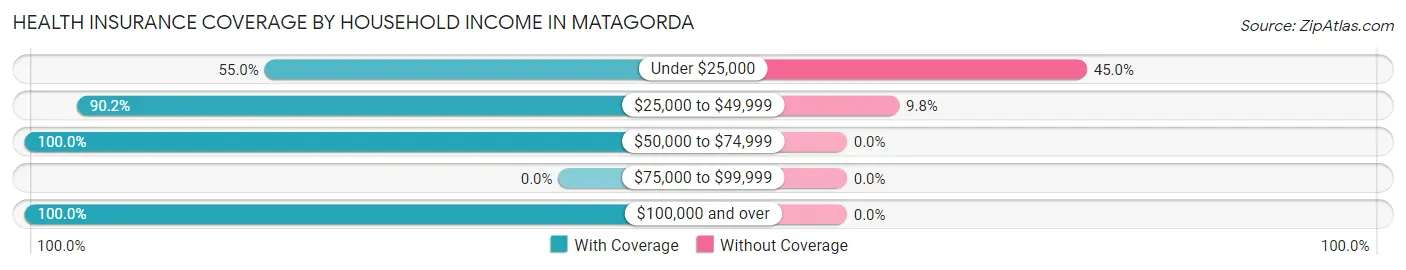
| Household Income | With Coverage | Without Coverage |
| Under $25,000 | 93 (55.0%) | 76 (45.0%) |
| $25,000 to $49,999 | 92 (90.2%) | 10 (9.8%) |
| $50,000 to $74,999 | 69 (100.0%) | 0 (0.0%) |
| $75,000 to $99,999 | 0 (0.0%) | 0 (0.0%) |
| $100,000 and over | 43 (100.0%) | 0 (0.0%) |
Public vs Private Health Insurance Coverage by Age in Matagorda
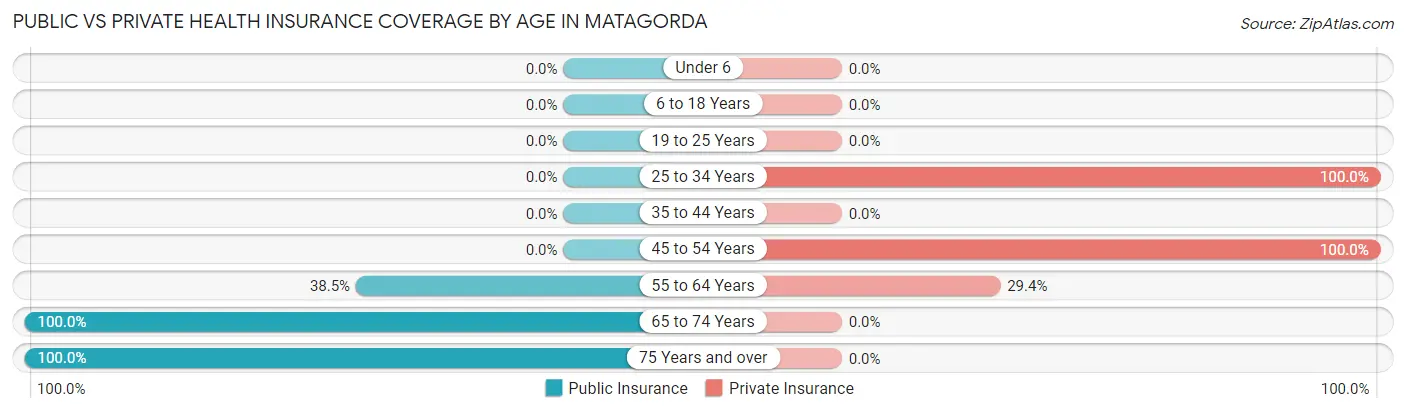
| Age Bracket | Public Insurance | Private Insurance |
| Under 6 | 0 (0.0%) | 0 (0.0%) |
| 6 to 18 Years | 0 (0.0%) | 0 (0.0%) |
| 19 to 25 Years | 0 (0.0%) | 0 (0.0%) |
| 25 to 34 Years | 0 (0.0%) | 20 (100.0%) |
| 35 to 44 Years | 0 (0.0%) | 0 (0.0%) |
| 45 to 54 Years | 0 (0.0%) | 92 (100.0%) |
| 55 to 64 Years | 72 (38.5%) | 55 (29.4%) |
| 65 to 74 Years | 49 (100.0%) | 0 (0.0%) |
| 75 Years and over | 25 (100.0%) | 0 (0.0%) |
| Total | 146 (38.1%) | 167 (43.6%) |
Disability Status by Sex by Age in Matagorda
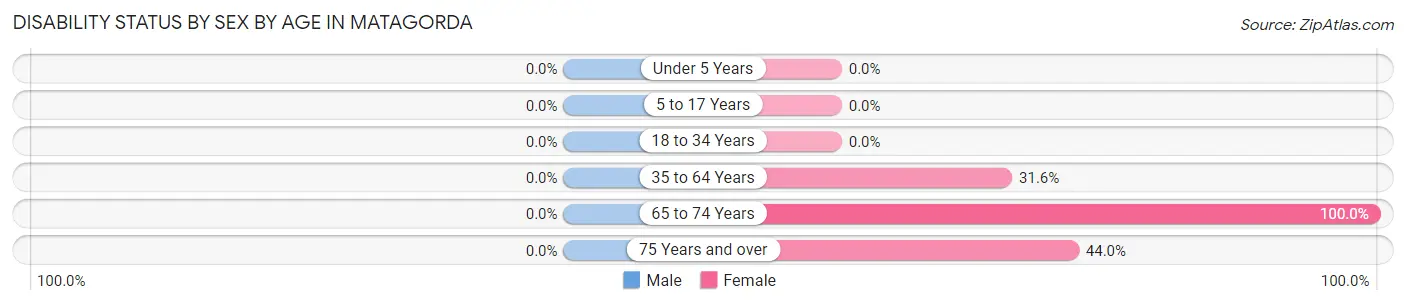
| Age Bracket | Male | Female |
| Under 5 Years | 0 (0.0%) | 0 (0.0%) |
| 5 to 17 Years | 0 (0.0%) | 0 (0.0%) |
| 18 to 34 Years | 0 (0.0%) | 0 (0.0%) |
| 35 to 64 Years | 0 (0.0%) | 49 (31.6%) |
| 65 to 74 Years | 0 (0.0%) | 15 (100.0%) |
| 75 Years and over | 0 (0.0%) | 11 (44.0%) |
Disability Class by Sex by Age in Matagorda
Disability Class: Hearing Difficulty
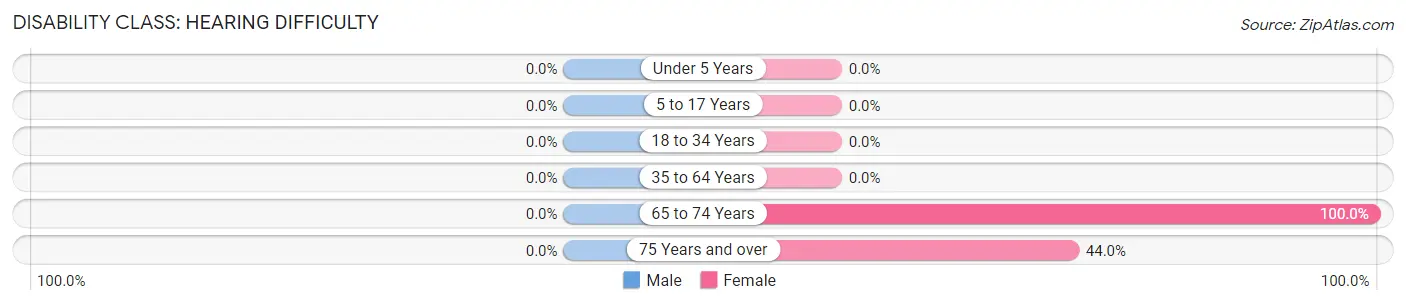
| Age Bracket | Male | Female |
| Under 5 Years | 0 (0.0%) | 0 (0.0%) |
| 5 to 17 Years | 0 (0.0%) | 0 (0.0%) |
| 18 to 34 Years | 0 (0.0%) | 0 (0.0%) |
| 35 to 64 Years | 0 (0.0%) | 0 (0.0%) |
| 65 to 74 Years | 0 (0.0%) | 15 (100.0%) |
| 75 Years and over | 0 (0.0%) | 11 (44.0%) |
Disability Class: Vision Difficulty
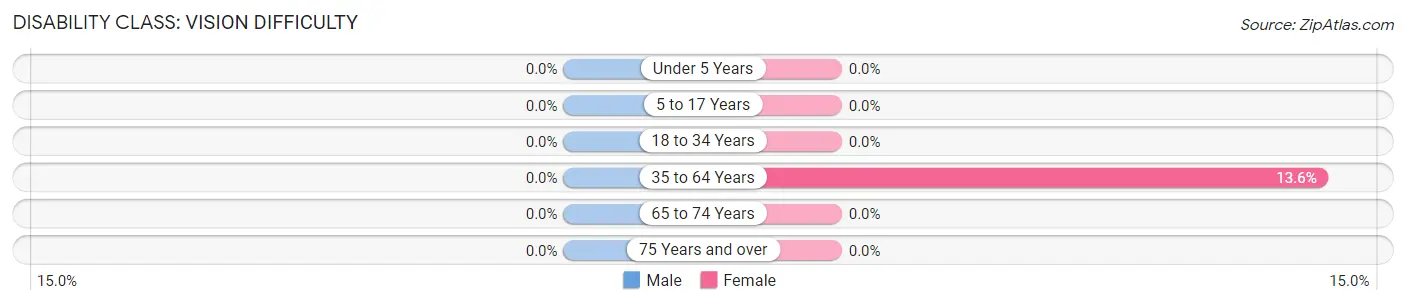
| Age Bracket | Male | Female |
| Under 5 Years | 0 (0.0%) | 0 (0.0%) |
| 5 to 17 Years | 0 (0.0%) | 0 (0.0%) |
| 18 to 34 Years | 0 (0.0%) | 0 (0.0%) |
| 35 to 64 Years | 0 (0.0%) | 21 (13.6%) |
| 65 to 74 Years | 0 (0.0%) | 0 (0.0%) |
| 75 Years and over | 0 (0.0%) | 0 (0.0%) |
Disability Class: Cognitive Difficulty
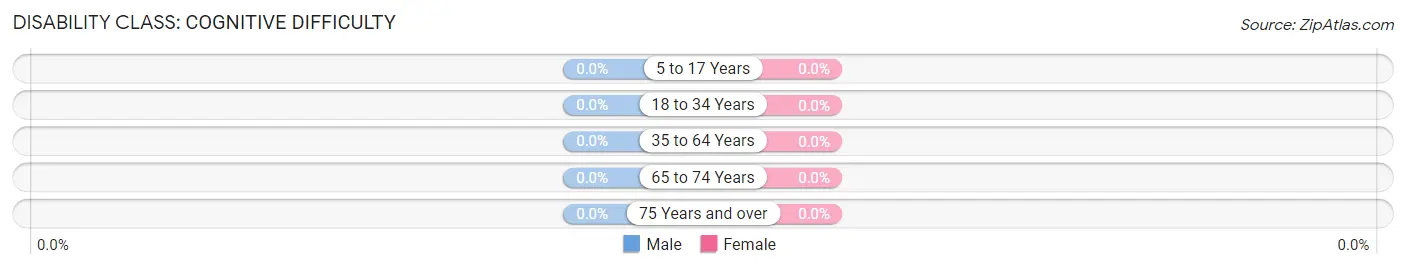
| Age Bracket | Male | Female |
| 5 to 17 Years | 0 (0.0%) | 0 (0.0%) |
| 18 to 34 Years | 0 (0.0%) | 0 (0.0%) |
| 35 to 64 Years | 0 (0.0%) | 0 (0.0%) |
| 65 to 74 Years | 0 (0.0%) | 0 (0.0%) |
| 75 Years and over | 0 (0.0%) | 0 (0.0%) |
Disability Class: Ambulatory Difficulty
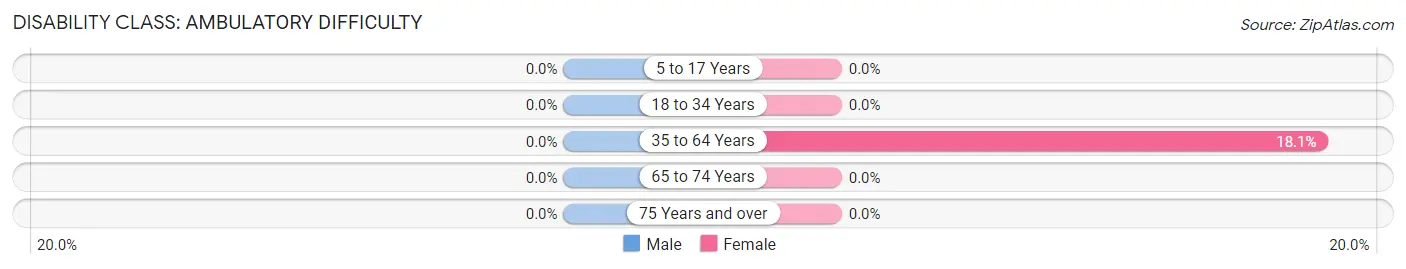
| Age Bracket | Male | Female |
| 5 to 17 Years | 0 (0.0%) | 0 (0.0%) |
| 18 to 34 Years | 0 (0.0%) | 0 (0.0%) |
| 35 to 64 Years | 0 (0.0%) | 28 (18.1%) |
| 65 to 74 Years | 0 (0.0%) | 0 (0.0%) |
| 75 Years and over | 0 (0.0%) | 0 (0.0%) |
Disability Class: Self-Care Difficulty
| Age Bracket | Male | Female |
| 5 to 17 Years | 0 (0.0%) | 0 (0.0%) |
| 18 to 34 Years | 0 (0.0%) | 0 (0.0%) |
| 35 to 64 Years | 0 (0.0%) | 0 (0.0%) |
| 65 to 74 Years | 0 (0.0%) | 0 (0.0%) |
| 75 Years and over | 0 (0.0%) | 0 (0.0%) |
Technology Access in Matagorda
Computing Device Access in Matagorda
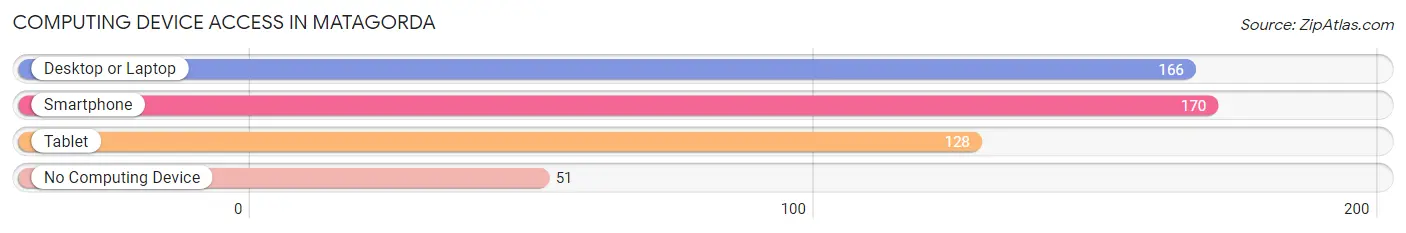
| Device Type | # Households | % Households |
| Desktop or Laptop | 166 | 69.8% |
| Smartphone | 170 | 71.4% |
| Tablet | 128 | 53.8% |
| No Computing Device | 51 | 21.4% |
| Total | 238 | 100.0% |
Internet Access in Matagorda
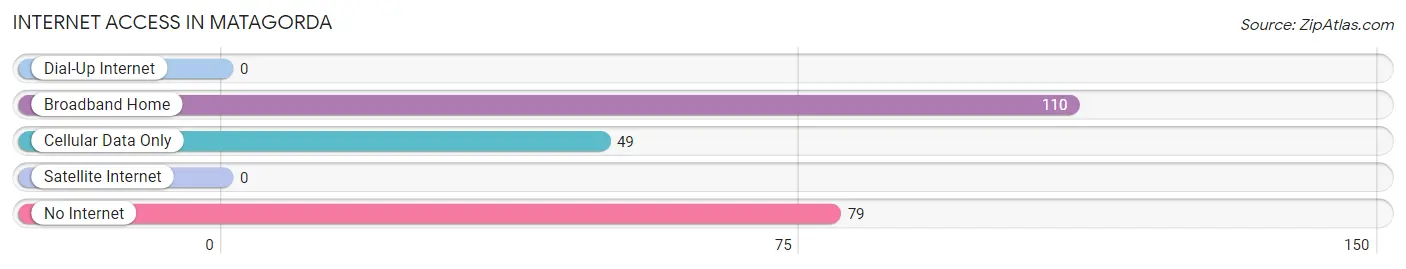
| Internet Type | # Households | % Households |
| Dial-Up Internet | 0 | 0.0% |
| Broadband Home | 110 | 46.2% |
| Cellular Data Only | 49 | 20.6% |
| Satellite Internet | 0 | 0.0% |
| No Internet | 79 | 33.2% |
| Total | 238 | 100.0% |
Matagorda Summary
Matagorda, Texas is a small town located in Matagorda County, Texas. It is situated on the Gulf Coast, approximately 90 miles southeast of Houston. The town has a population of approximately 2,000 people and is the county seat of Matagorda County.
History
The area that is now Matagorda was originally inhabited by the Karankawa Indians. The first European settlers arrived in the area in the late 1700s. The town was founded in 1827 and was named after the Matagorda Bay. The town was originally a trading post and was used as a port for ships traveling between Galveston and New Orleans.
In 1836, the town was the site of the Battle of Matagorda, which was part of the Texas Revolution. The town was also the site of the first railroad in Texas, which was built in 1853.
Geography
Matagorda is located in Matagorda County, Texas. It is situated on the Gulf Coast, approximately 90 miles southeast of Houston. The town is located on the Matagorda Peninsula, which is bordered by the Matagorda Bay to the east and the Gulf of Mexico to the south. The town is located at the intersection of State Highway 35 and State Highway 60.
The climate in Matagorda is humid subtropical, with hot summers and mild winters. The average annual temperature is 73°F (23°C). The average annual precipitation is 45 inches (114 cm).
Economy
The economy of Matagorda is largely based on tourism and fishing. The town is a popular destination for fishing, boating, and other outdoor activities. The town is also home to several seafood processing plants, which process and package seafood for export.
The town is also home to several manufacturing companies, including a paper mill and a plastics plant. The town is also home to several retail stores, restaurants, and other businesses.
Demographics
As of the 2010 census, the population of Matagorda was 2,019. The racial makeup of the town was 79.3% White, 15.2% Hispanic or Latino, 0.7% African American, 0.3% Native American, 0.2% Asian, and 4.5% other.
The median household income in Matagorda was $37,917, and the median family income was $45,938. The per capita income was $19,945. About 17.2% of the population was below the poverty line.
Matagorda is served by the Matagorda Independent School District. The town is also home to several churches, including the First United Methodist Church, the First Baptist Church, and the Church of Christ.
Common Questions
What is Per Capita Income in Matagorda?
Per Capita income in Matagorda is $21,297.
What is the Median Family Income in Matagorda?
Median Family Income in Matagorda is $29,167.
What is Inequality or Gini Index in Matagorda?
Inequality or Gini Index in Matagorda is 0.62.
What is the Total Population of Matagorda?
Total Population of Matagorda is 383.
What is the Total Male Population of Matagorda?
Total Male Population of Matagorda is 179.
What is the Total Female Population of Matagorda?
Total Female Population of Matagorda is 204.
What is the Ratio of Males per 100 Females in Matagorda?
There are 87.75 Males per 100 Females in Matagorda.
What is the Ratio of Females per 100 Males in Matagorda?
There are 113.97 Females per 100 Males in Matagorda.
What is the Median Population Age in Matagorda?
Median Population Age in Matagorda is 62.6 Years.
What is the Average Family Size in Matagorda
Average Family Size in Matagorda is 2.0 People.
What is the Average Household Size in Matagorda
Average Household Size in Matagorda is 1.6 People.
How Large is the Labor Force in Matagorda?
There are 224 People in the Labor Forcein in Matagorda.
What is the Percentage of People in the Labor Force in Matagorda?
58.5% of People are in the Labor Force in Matagorda.
What is the Unemployment Rate in Matagorda?
Unemployment Rate in Matagorda is 17.4%.