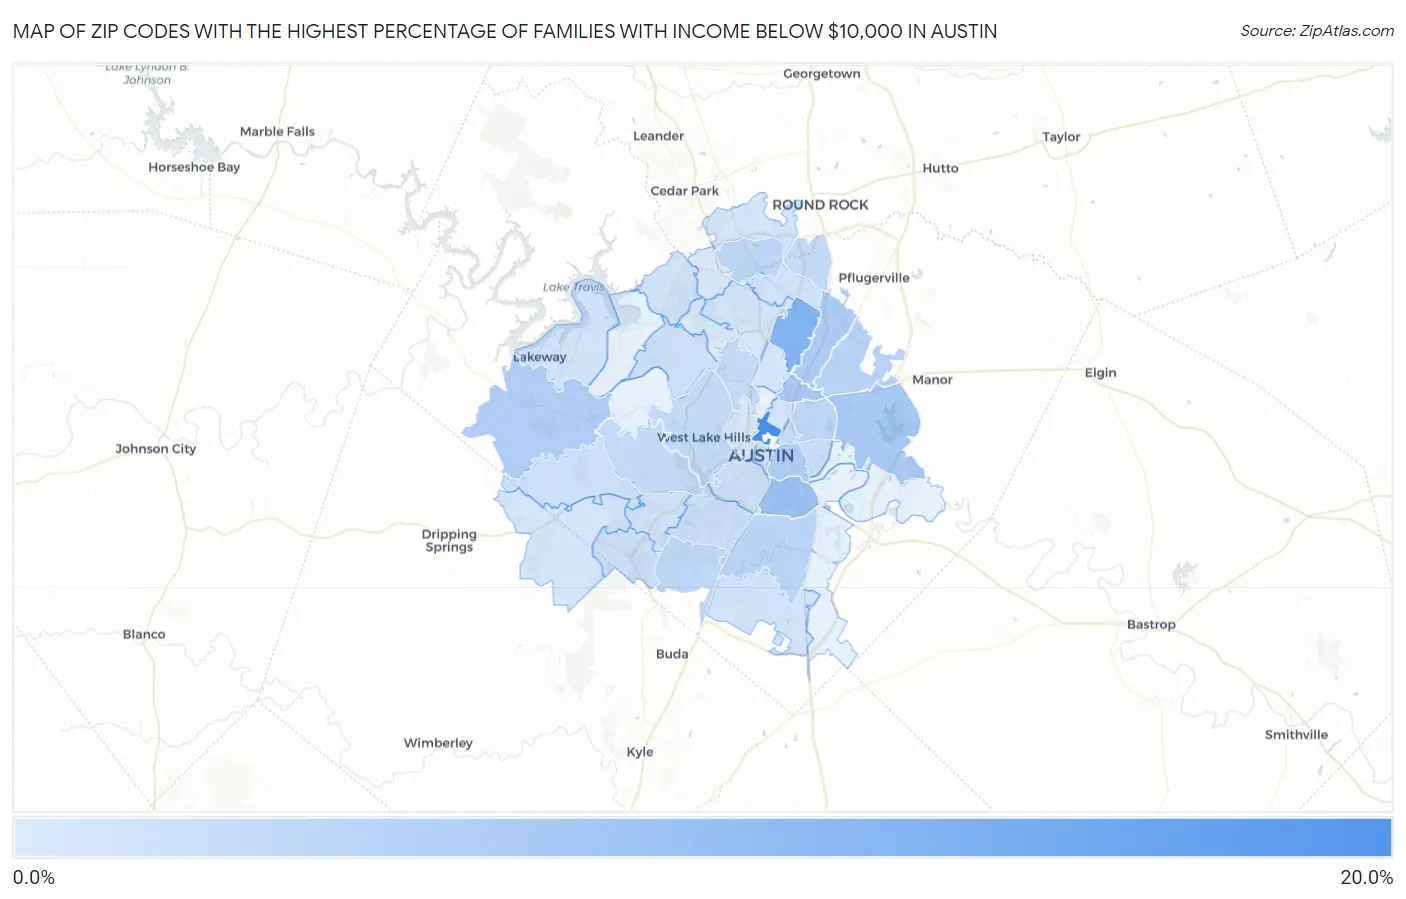
Zip Codes with the Highest Percentage of Families with Income Below $10,000 in Austin, TX
RELATED REPORTS & OPTIONS
Family Income | $0-10k
Austin
Compare Zip Codes
Map of Zip Codes with the Highest Percentage of Families with Income Below $10,000 in Austin
0.10%
15.8%
Zip Codes with the Highest Percentage of Families with Income Below $10,000 in Austin, TX
| Zip Code | Families with Income < $10k | vs State | vs National | |
| 1. | 78705 | 15.8% | 3.5%(+12.3)#36 | 3.1%(+12.7)#764 |
| 2. | 78758 | 9.2% | 3.5%(+5.70)#117 | 3.1%(+6.10)#2,240 |
| 3. | 78741 | 6.7% | 3.5%(+3.20)#231 | 3.1%(+3.60)#3,888 |
| 4. | 78752 | 5.5% | 3.5%(+2.00)#368 | 3.1%(+2.40)#5,325 |
| 5. | 78724 | 5.4% | 3.5%(+1.90)#382 | 3.1%(+2.30)#5,453 |
| 6. | 78753 | 4.9% | 3.5%(+1.40)#446 | 3.1%(+1.80)#6,242 |
| 7. | 78738 | 4.7% | 3.5%(+1.20)#472 | 3.1%(+1.60)#6,632 |
| 8. | 78702 | 4.7% | 3.5%(+1.20)#473 | 3.1%(+1.60)#6,639 |
| 9. | 78754 | 3.7% | 3.5%(+0.200)#633 | 3.1%(+0.600)#8,977 |
| 10. | 78744 | 3.5% | 3.5%(=0.000)#666 | 3.1%(+0.400)#9,479 |
| 11. | 78723 | 3.3% | 3.5%(-0.200)#707 | 3.1%(+0.200)#10,125 |
| 12. | 78729 | 3.2% | 3.5%(-0.300)#731 | 3.1%(+0.100)#10,447 |
| 13. | 78748 | 3.0% | 3.5%(-0.500)#768 | 3.1%(-0.100)#11,076 |
| 14. | 78735 | 2.6% | 3.5%(-0.900)#880 | 3.1%(-0.500)#12,726 |
| 15. | 78746 | 2.5% | 3.5%(-1.00)#902 | 3.1%(-0.600)#13,103 |
| 16. | 78728 | 2.5% | 3.5%(-1.00)#904 | 3.1%(-0.600)#13,113 |
| 17. | 78731 | 2.5% | 3.5%(-1.00)#906 | 3.1%(-0.600)#13,119 |
| 18. | 78722 | 2.3% | 3.5%(-1.20)#961 | 3.1%(-0.800)#14,105 |
| 19. | 78721 | 2.2% | 3.5%(-1.30)#991 | 3.1%(-0.900)#14,493 |
| 20. | 78745 | 1.8% | 3.5%(-1.70)#1,084 | 3.1%(-1.30)#16,198 |
| 21. | 78730 | 1.7% | 3.5%(-1.80)#1,128 | 3.1%(-1.40)#16,879 |
| 22. | 78736 | 1.7% | 3.5%(-1.80)#1,129 | 3.1%(-1.40)#16,889 |
| 23. | 78704 | 1.6% | 3.5%(-1.90)#1,145 | 3.1%(-1.50)#17,195 |
| 24. | 78739 | 1.6% | 3.5%(-1.90)#1,153 | 3.1%(-1.50)#17,307 |
| 25. | 78701 | 1.5% | 3.5%(-2.00)#1,187 | 3.1%(-1.60)#17,884 |
| 26. | 78749 | 1.3% | 3.5%(-2.20)#1,231 | 3.1%(-1.80)#18,724 |
| 27. | 78727 | 1.3% | 3.5%(-2.20)#1,233 | 3.1%(-1.80)#18,747 |
| 28. | 78734 | 1.3% | 3.5%(-2.20)#1,234 | 3.1%(-1.80)#18,798 |
| 29. | 78747 | 1.2% | 3.5%(-2.30)#1,265 | 3.1%(-1.90)#19,328 |
| 30. | 78726 | 1.2% | 3.5%(-2.30)#1,273 | 3.1%(-1.90)#19,387 |
| 31. | 78759 | 1.1% | 3.5%(-2.40)#1,297 | 3.1%(-2.00)#19,713 |
| 32. | 78717 | 1.1% | 3.5%(-2.40)#1,300 | 3.1%(-2.00)#19,734 |
| 33. | 78757 | 1.1% | 3.5%(-2.40)#1,303 | 3.1%(-2.00)#19,775 |
| 34. | 78737 | 1.1% | 3.5%(-2.40)#1,304 | 3.1%(-2.00)#19,779 |
| 35. | 78751 | 0.90% | 3.5%(-2.60)#1,344 | 3.1%(-2.20)#20,839 |
| 36. | 78703 | 0.50% | 3.5%(-3.00)#1,416 | 3.1%(-2.60)#22,648 |
| 37. | 78750 | 0.10% | 3.5%(-3.40)#1,466 | 3.1%(-3.00)#23,822 |
1
Common Questions
What are the Top 10 Zip Codes with the Highest Percentage of Families with Income Below $10,000 in Austin, TX?
Top 10 Zip Codes with the Highest Percentage of Families with Income Below $10,000 in Austin, TX are:
What zip code has the Highest Percentage of Families with Income Below $10,000 in Austin, TX?
78705 has the Highest Percentage of Families with Income Below $10,000 in Austin, TX with 15.8%.
What is the Percentage of Families with Income Below $10,000 in Austin, TX?
Percentage of Families with Income Below $10,000 in Austin is 2.9%.
What is the Percentage of Families with Income Below $10,000 in Texas?
Percentage of Families with Income Below $10,000 in Texas is 3.5%.
What is the Percentage of Families with Income Below $10,000 in the United States?
Percentage of Families with Income Below $10,000 in the United States is 3.1%.