Zip Codes with the Highest Percentage of Families with Income Below $10,000 in Houston, TX
RELATED REPORTS & OPTIONS
Family Income | $0-10k
Houston
Compare Zip Codes
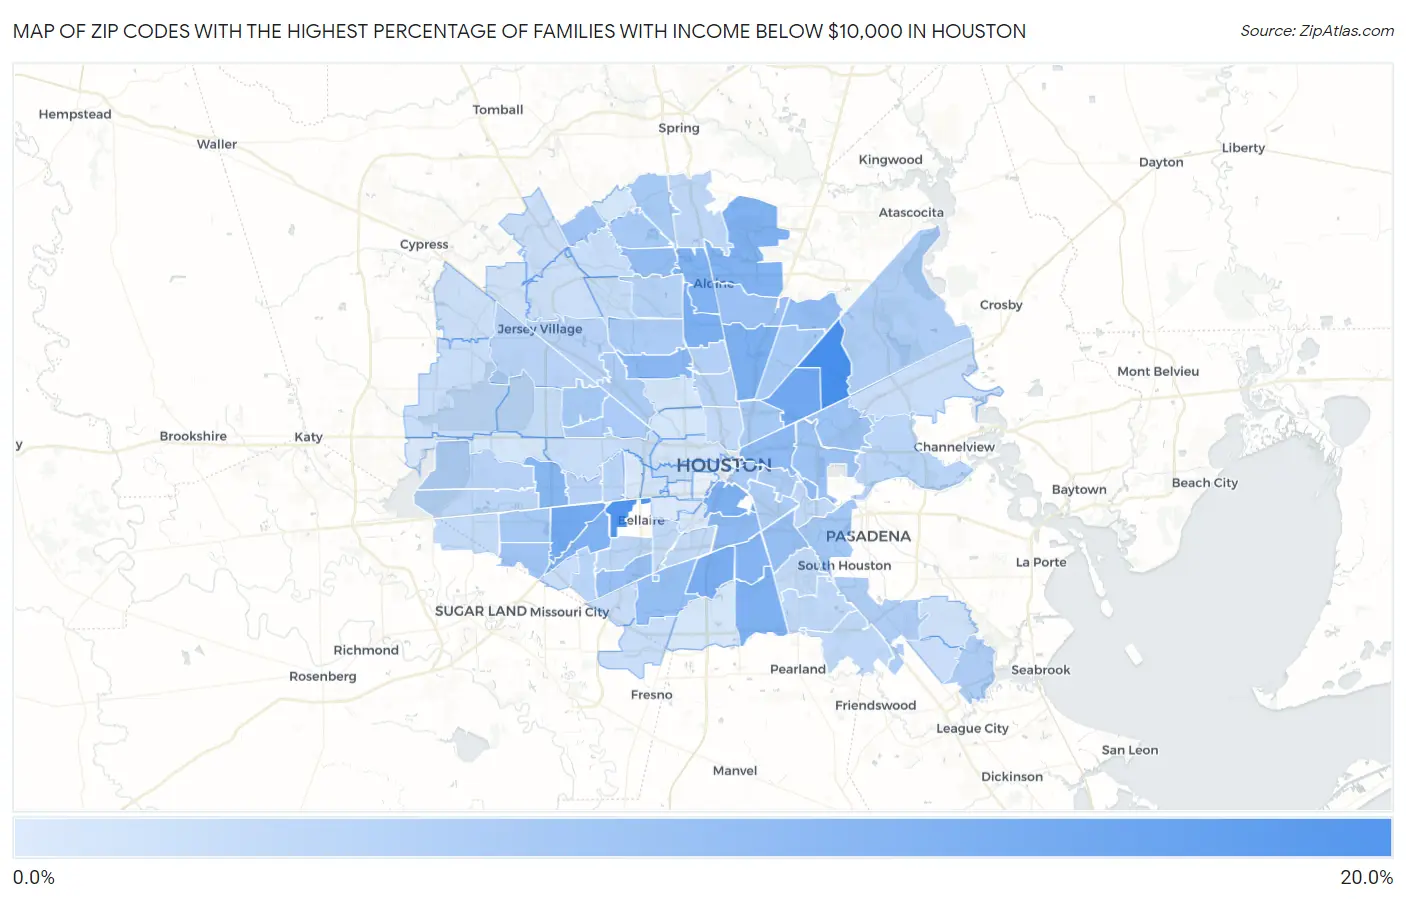
Map of Zip Codes with the Highest Percentage of Families with Income Below $10,000 in Houston
0.60%
17.5%
Zip Codes with the Highest Percentage of Families with Income Below $10,000 in Houston, TX
| Zip Code | Families with Income < $10k | vs State | vs National | |
| 1. | 77078 | 17.5% | 3.5%(+14.0)#26 | 3.1%(+14.4)#624 |
| 2. | 77081 | 16.5% | 3.5%(+13.0)#33 | 3.1%(+13.4)#703 |
| 3. | 77028 | 12.5% | 3.5%(+9.00)#56 | 3.1%(+9.40)#1,217 |
| 4. | 77036 | 12.3% | 3.5%(+8.80)#59 | 3.1%(+9.20)#1,255 |
| 5. | 77051 | 11.4% | 3.5%(+7.90)#66 | 3.1%(+8.30)#1,474 |
| 6. | 77093 | 11.1% | 3.5%(+7.60)#69 | 3.1%(+8.00)#1,551 |
| 7. | 77037 | 11.1% | 3.5%(+7.60)#70 | 3.1%(+8.00)#1,555 |
| 8. | 77048 | 11.0% | 3.5%(+7.50)#71 | 3.1%(+7.90)#1,583 |
| 9. | 77004 | 10.9% | 3.5%(+7.40)#75 | 3.1%(+7.80)#1,610 |
| 10. | 77060 | 10.8% | 3.5%(+7.30)#78 | 3.1%(+7.70)#1,643 |
| 11. | 77074 | 10.8% | 3.5%(+7.30)#79 | 3.1%(+7.70)#1,645 |
| 12. | 77032 | 10.6% | 3.5%(+7.10)#84 | 3.1%(+7.50)#1,703 |
| 13. | 77033 | 10.1% | 3.5%(+6.60)#92 | 3.1%(+7.00)#1,867 |
| 14. | 77042 | 10.0% | 3.5%(+6.50)#94 | 3.1%(+6.90)#1,901 |
| 15. | 77091 | 9.7% | 3.5%(+6.20)#100 | 3.1%(+6.60)#2,031 |
| 16. | 77021 | 9.1% | 3.5%(+5.60)#122 | 3.1%(+6.00)#2,296 |
| 17. | 77020 | 9.0% | 3.5%(+5.50)#126 | 3.1%(+5.90)#2,359 |
| 18. | 77067 | 8.7% | 3.5%(+5.20)#134 | 3.1%(+5.60)#2,507 |
| 19. | 77050 | 8.7% | 3.5%(+5.20)#136 | 3.1%(+5.60)#2,521 |
| 20. | 77045 | 8.3% | 3.5%(+4.80)#151 | 3.1%(+5.20)#2,767 |
| 21. | 77087 | 8.1% | 3.5%(+4.60)#159 | 3.1%(+5.00)#2,895 |
| 22. | 77035 | 8.1% | 3.5%(+4.60)#161 | 3.1%(+5.00)#2,897 |
| 23. | 77039 | 7.5% | 3.5%(+4.00)#194 | 3.1%(+4.40)#3,268 |
| 24. | 77029 | 7.4% | 3.5%(+3.90)#198 | 3.1%(+4.30)#3,346 |
| 25. | 77013 | 7.3% | 3.5%(+3.80)#202 | 3.1%(+4.20)#3,400 |
| 26. | 77099 | 7.1% | 3.5%(+3.60)#207 | 3.1%(+4.00)#3,534 |
| 27. | 77069 | 7.0% | 3.5%(+3.50)#214 | 3.1%(+3.90)#3,634 |
| 28. | 77017 | 6.7% | 3.5%(+3.20)#232 | 3.1%(+3.60)#3,890 |
| 29. | 77072 | 6.4% | 3.5%(+2.90)#254 | 3.1%(+3.30)#4,194 |
| 30. | 77026 | 6.4% | 3.5%(+2.90)#257 | 3.1%(+3.30)#4,218 |
| 31. | 77080 | 6.3% | 3.5%(+2.80)#268 | 3.1%(+3.20)#4,292 |
| 32. | 77090 | 6.2% | 3.5%(+2.70)#282 | 3.1%(+3.10)#4,421 |
| 33. | 77014 | 6.2% | 3.5%(+2.70)#283 | 3.1%(+3.10)#4,423 |
| 34. | 77016 | 6.2% | 3.5%(+2.70)#285 | 3.1%(+3.10)#4,428 |
| 35. | 77055 | 6.1% | 3.5%(+2.60)#292 | 3.1%(+3.00)#4,526 |
| 36. | 77003 | 6.0% | 3.5%(+2.50)#307 | 3.1%(+2.90)#4,672 |
| 37. | 77088 | 5.9% | 3.5%(+2.40)#315 | 3.1%(+2.80)#4,763 |
| 38. | 77092 | 5.9% | 3.5%(+2.40)#317 | 3.1%(+2.80)#4,772 |
| 39. | 77011 | 5.9% | 3.5%(+2.40)#321 | 3.1%(+2.80)#4,796 |
| 40. | 77034 | 5.6% | 3.5%(+2.10)#355 | 3.1%(+2.50)#5,151 |
| 41. | 77058 | 5.6% | 3.5%(+2.10)#358 | 3.1%(+2.50)#5,177 |
| 42. | 77044 | 5.5% | 3.5%(+2.00)#366 | 3.1%(+2.40)#5,295 |
| 43. | 77023 | 5.4% | 3.5%(+1.90)#384 | 3.1%(+2.30)#5,458 |
| 44. | 77076 | 5.0% | 3.5%(+1.50)#430 | 3.1%(+1.90)#6,094 |
| 45. | 77038 | 4.7% | 3.5%(+1.20)#471 | 3.1%(+1.60)#6,625 |
| 46. | 77041 | 4.6% | 3.5%(+1.10)#486 | 3.1%(+1.50)#6,815 |
| 47. | 77077 | 4.4% | 3.5%(+0.900)#526 | 3.1%(+1.30)#7,191 |
| 48. | 77040 | 4.4% | 3.5%(+0.900)#530 | 3.1%(+1.30)#7,202 |
| 49. | 77063 | 4.4% | 3.5%(+0.900)#531 | 3.1%(+1.30)#7,216 |
| 50. | 77022 | 4.4% | 3.5%(+0.900)#533 | 3.1%(+1.30)#7,231 |
| 51. | 77015 | 4.3% | 3.5%(+0.800)#545 | 3.1%(+1.20)#7,397 |
| 52. | 77057 | 4.3% | 3.5%(+0.800)#546 | 3.1%(+1.20)#7,404 |
| 53. | 77071 | 4.3% | 3.5%(+0.800)#549 | 3.1%(+1.20)#7,434 |
| 54. | 77082 | 4.0% | 3.5%(+0.500)#590 | 3.1%(+0.900)#8,111 |
| 55. | 77073 | 4.0% | 3.5%(+0.500)#591 | 3.1%(+0.900)#8,127 |
| 56. | 77096 | 3.9% | 3.5%(+0.400)#602 | 3.1%(+0.800)#8,404 |
| 57. | 77089 | 3.7% | 3.5%(+0.200)#629 | 3.1%(+0.600)#8,925 |
| 58. | 77075 | 3.7% | 3.5%(+0.200)#630 | 3.1%(+0.600)#8,946 |
| 59. | 77012 | 3.6% | 3.5%(+0.100)#652 | 3.1%(+0.500)#9,280 |
| 60. | 77009 | 3.5% | 3.5%(=0.000)#668 | 3.1%(+0.400)#9,499 |
| 61. | 77054 | 3.5% | 3.5%(=0.000)#670 | 3.1%(+0.400)#9,528 |
| 62. | 77083 | 3.4% | 3.5%(-0.100)#682 | 3.1%(+0.300)#9,756 |
| 63. | 77025 | 3.4% | 3.5%(-0.100)#690 | 3.1%(+0.300)#9,813 |
| 64. | 77061 | 3.2% | 3.5%(-0.300)#733 | 3.1%(+0.100)#10,479 |
| 65. | 77043 | 3.1% | 3.5%(-0.400)#758 | 3.1%(=0.000)#10,814 |
| 66. | 77086 | 3.0% | 3.5%(-0.500)#775 | 3.1%(-0.100)#11,136 |
| 67. | 77019 | 3.0% | 3.5%(-0.500)#778 | 3.1%(-0.100)#11,162 |
| 68. | 77084 | 2.9% | 3.5%(-0.600)#794 | 3.1%(-0.200)#11,415 |
| 69. | 77049 | 2.8% | 3.5%(-0.700)#825 | 3.1%(-0.300)#11,837 |
| 70. | 77066 | 2.8% | 3.5%(-0.700)#826 | 3.1%(-0.300)#11,841 |
| 71. | 77031 | 2.8% | 3.5%(-0.700)#832 | 3.1%(-0.300)#11,924 |
| 72. | 77085 | 2.8% | 3.5%(-0.700)#833 | 3.1%(-0.300)#11,928 |
| 73. | 77024 | 2.7% | 3.5%(-0.800)#848 | 3.1%(-0.400)#12,252 |
| 74. | 77053 | 2.7% | 3.5%(-0.800)#849 | 3.1%(-0.400)#12,282 |
| 75. | 77070 | 2.6% | 3.5%(-0.900)#874 | 3.1%(-0.500)#12,592 |
| 76. | 77062 | 2.5% | 3.5%(-1.00)#907 | 3.1%(-0.600)#13,123 |
| 77. | 77095 | 2.4% | 3.5%(-1.10)#919 | 3.1%(-0.700)#13,413 |
| 78. | 77064 | 2.2% | 3.5%(-1.30)#973 | 3.1%(-0.900)#14,327 |
| 79. | 77059 | 2.0% | 3.5%(-1.50)#1,040 | 3.1%(-1.10)#15,385 |
| 80. | 77065 | 1.7% | 3.5%(-1.80)#1,118 | 3.1%(-1.40)#16,724 |
| 81. | 77018 | 1.6% | 3.5%(-1.90)#1,152 | 3.1%(-1.50)#17,264 |
| 82. | 77007 | 1.5% | 3.5%(-2.00)#1,174 | 3.1%(-1.60)#17,682 |
| 83. | 77027 | 1.5% | 3.5%(-2.00)#1,184 | 3.1%(-1.60)#17,808 |
| 84. | 77047 | 1.4% | 3.5%(-2.10)#1,203 | 3.1%(-1.70)#18,219 |
| 85. | 77008 | 1.3% | 3.5%(-2.20)#1,229 | 3.1%(-1.80)#18,706 |
| 86. | 77079 | 1.3% | 3.5%(-2.20)#1,230 | 3.1%(-1.80)#18,722 |
| 87. | 77068 | 1.3% | 3.5%(-2.20)#1,238 | 3.1%(-1.80)#18,884 |
| 88. | 77005 | 1.1% | 3.5%(-2.40)#1,302 | 3.1%(-2.00)#19,761 |
| 89. | 77056 | 0.90% | 3.5%(-2.60)#1,343 | 3.1%(-2.20)#20,797 |
| 90. | 77094 | 0.90% | 3.5%(-2.60)#1,346 | 3.1%(-2.20)#20,877 |
| 91. | 77030 | 0.80% | 3.5%(-2.70)#1,368 | 3.1%(-2.30)#21,345 |
| 92. | 77098 | 0.60% | 3.5%(-2.90)#1,405 | 3.1%(-2.50)#22,262 |
1
Common Questions
What are the Top 10 Zip Codes with the Highest Percentage of Families with Income Below $10,000 in Houston, TX?
Top 10 Zip Codes with the Highest Percentage of Families with Income Below $10,000 in Houston, TX are:
What zip code has the Highest Percentage of Families with Income Below $10,000 in Houston, TX?
77078 has the Highest Percentage of Families with Income Below $10,000 in Houston, TX with 17.5%.
What is the Percentage of Families with Income Below $10,000 in Houston, TX?
Percentage of Families with Income Below $10,000 in Houston is 5.9%.
What is the Percentage of Families with Income Below $10,000 in Texas?
Percentage of Families with Income Below $10,000 in Texas is 3.5%.
What is the Percentage of Families with Income Below $10,000 in the United States?
Percentage of Families with Income Below $10,000 in the United States is 3.1%.