St Paul, TX Map & Demographics
St Paul Map
St Paul Overview
$15,815
PER CAPITA INCOME
$68,066
AVG FAMILY INCOME
38.9%
WAGE / INCOME GAP [ % ]
61.1¢/ $1
WAGE / INCOME GAP [ $ ]
0.71
INEQUALITY / GINI INDEX
1,102
TOTAL POPULATION
612
MALE POPULATION
490
FEMALE POPULATION
124.90
MALES / 100 FEMALES
80.07
FEMALES / 100 MALES
35.3
MEDIAN AGE
5.0
AVG FAMILY SIZE
3.1
AVG HOUSEHOLD SIZE
394
LABOR FORCE [ PEOPLE ]
47.0%
PERCENT IN LABOR FORCE
Income in St Paul
Income Overview in St Paul
| Characteristic | Number | Measure |
| Per Capita Income | 1,102 | $15,815 |
| Median Family Income | 184 | $68,066 |
| Mean Family Income | 184 | $73,683 |
| Median Household Income | 356 | $0 |
| Mean Household Income | 356 | $38,083 |
| Income Deficit | 184 | $0 |
| Wage / Income Gap (%) | 1,102 | 38.90% |
| Wage / Income Gap ($) | 1,102 | 61.10¢ per $1 |
| Gini / Inequality Index | 1,102 | 0.71 |
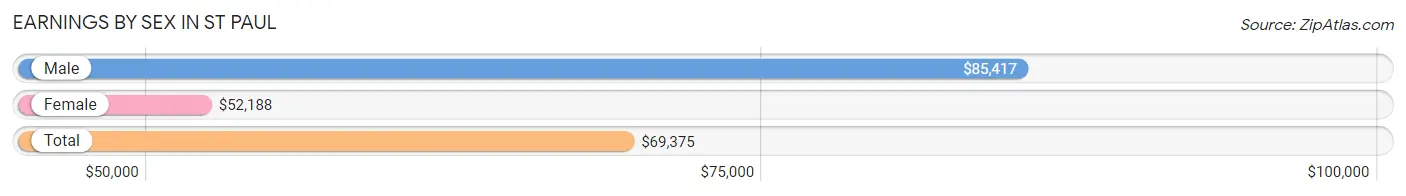
Earnings by Sex in St Paul
Average Earnings in St Paul are $69,375, $85,417 for men and $52,188 for women, a difference of 38.9%.
| Sex | Number | Average Earnings |
| Male | 323 (76.5%) | $85,417 |
| Female | 99 (23.5%) | $52,188 |
| Total | 422 (100.0%) | $69,375 |
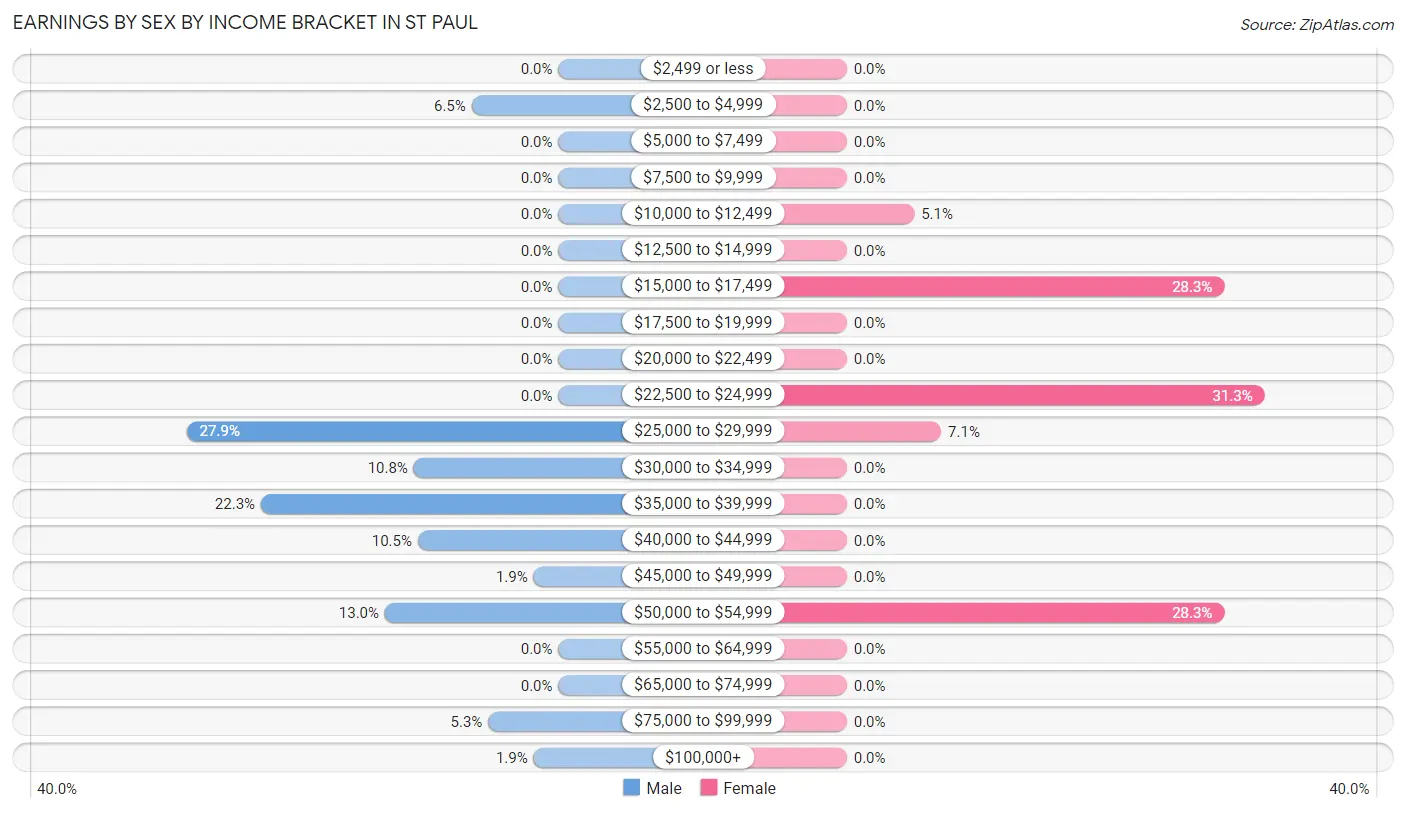
Earnings by Sex by Income Bracket in St Paul
The most common earnings brackets in St Paul are $25,000 to $29,999 for men (90 | 27.9%) and $22,500 to $24,999 for women (31 | 31.3%).
| Income | Male | Female |
| $2,499 or less | 0 (0.0%) | 0 (0.0%) |
| $2,500 to $4,999 | 21 (6.5%) | 0 (0.0%) |
| $5,000 to $7,499 | 0 (0.0%) | 0 (0.0%) |
| $7,500 to $9,999 | 0 (0.0%) | 0 (0.0%) |
| $10,000 to $12,499 | 0 (0.0%) | 5 (5.1%) |
| $12,500 to $14,999 | 0 (0.0%) | 0 (0.0%) |
| $15,000 to $17,499 | 0 (0.0%) | 28 (28.3%) |
| $17,500 to $19,999 | 0 (0.0%) | 0 (0.0%) |
| $20,000 to $22,499 | 0 (0.0%) | 0 (0.0%) |
| $22,500 to $24,999 | 0 (0.0%) | 31 (31.3%) |
| $25,000 to $29,999 | 90 (27.9%) | 7 (7.1%) |
| $30,000 to $34,999 | 35 (10.8%) | 0 (0.0%) |
| $35,000 to $39,999 | 72 (22.3%) | 0 (0.0%) |
| $40,000 to $44,999 | 34 (10.5%) | 0 (0.0%) |
| $45,000 to $49,999 | 6 (1.9%) | 0 (0.0%) |
| $50,000 to $54,999 | 42 (13.0%) | 28 (28.3%) |
| $55,000 to $64,999 | 0 (0.0%) | 0 (0.0%) |
| $65,000 to $74,999 | 0 (0.0%) | 0 (0.0%) |
| $75,000 to $99,999 | 17 (5.3%) | 0 (0.0%) |
| $100,000+ | 6 (1.9%) | 0 (0.0%) |
| Total | 323 (100.0%) | 99 (100.0%) |
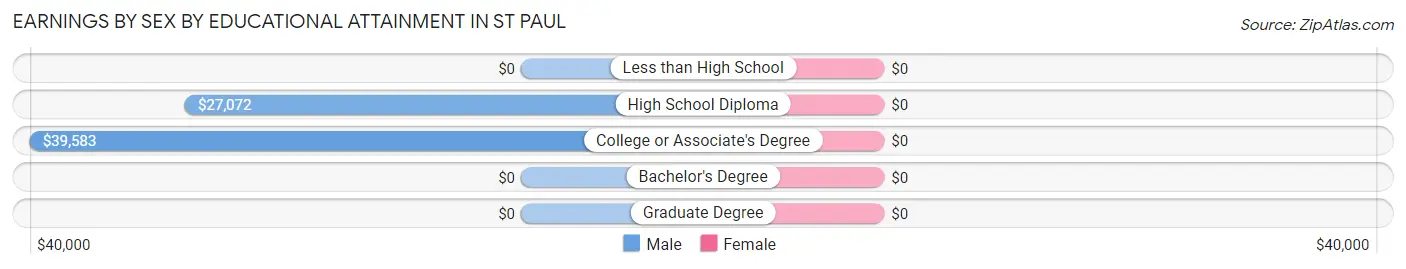
Earnings by Sex by Educational Attainment in St Paul
| Educational Attainment | Male Income | Female Income |
| Less than High School | - | - |
| High School Diploma | $27,072 | $0 |
| College or Associate's Degree | $39,583 | $0 |
| Bachelor's Degree | - | - |
| Graduate Degree | - | - |
| Total | $38,038 | $23,548 |
Family Income in St Paul
Family Income Brackets in St Paul
According to the St Paul family income data, there are 53 families falling into the $50,000 to $74,999 income range, which is the most common income bracket and makes up 28.8% of all families.
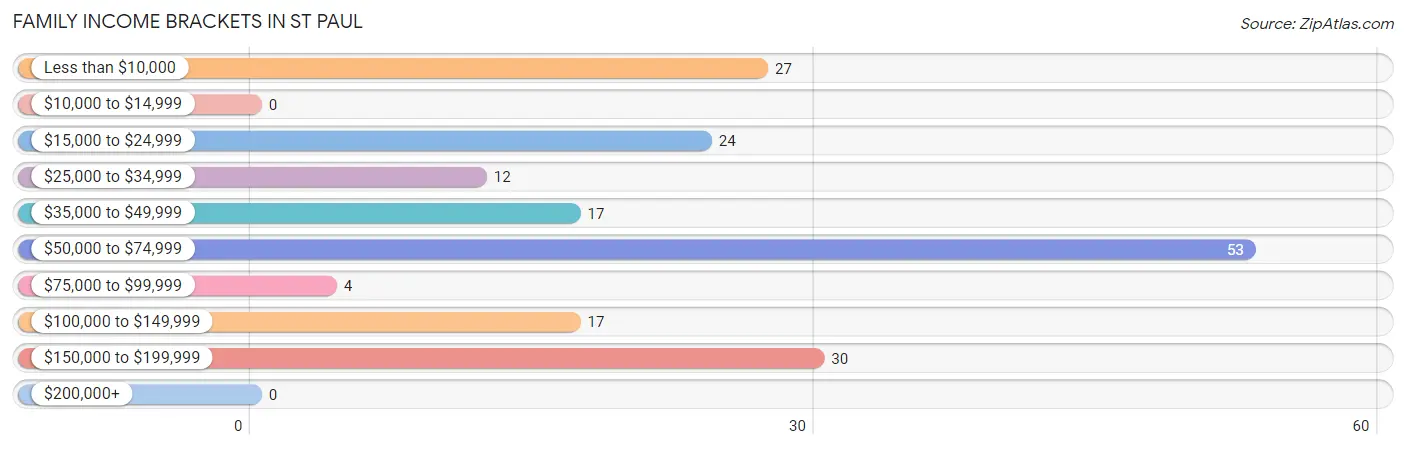
| Income Bracket | # Families | % Families |
| Less than $10,000 | 27 | 14.7% |
| $10,000 to $14,999 | 0 | 0.0% |
| $15,000 to $24,999 | 24 | 13.0% |
| $25,000 to $34,999 | 12 | 6.5% |
| $35,000 to $49,999 | 17 | 9.2% |
| $50,000 to $74,999 | 53 | 28.8% |
| $75,000 to $99,999 | 4 | 2.2% |
| $100,000 to $149,999 | 17 | 9.2% |
| $150,000 to $199,999 | 30 | 16.3% |
| $200,000+ | 0 | 0.0% |
Family Income by Famaliy Size in St Paul
2-person families (67 | 36.4%) account for the highest median family income in St Paul with $18,177 per family, while 2-person families (67 | 36.4%) have the highest median income of $9,088 per family member.
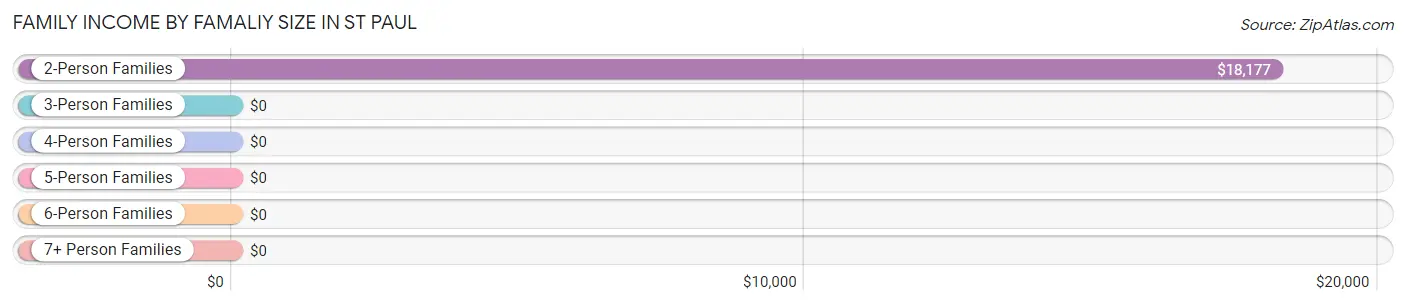
| Income Bracket | # Families | Median Income |
| 2-Person Families | 67 (36.4%) | $18,177 |
| 3-Person Families | 59 (32.1%) | $0 |
| 4-Person Families | 17 (9.2%) | $0 |
| 5-Person Families | 0 (0.0%) | $0 |
| 6-Person Families | 17 (9.2%) | $0 |
| 7+ Person Families | 24 (13.0%) | $0 |
| Total | 184 (100.0%) | $68,066 |
Family Income by Number of Earners in St Paul
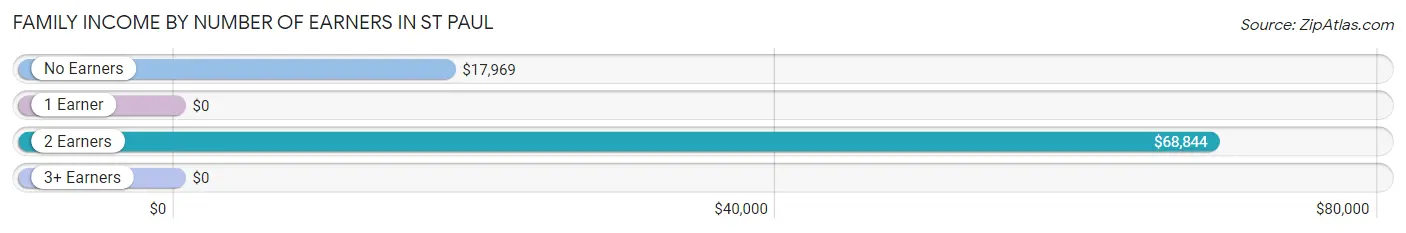
| Number of Earners | # Families | Median Income |
| No Earners | 63 (34.2%) | $17,969 |
| 1 Earner | 0 (0.0%) | $0 |
| 2 Earners | 91 (49.5%) | $68,844 |
| 3+ Earners | 30 (16.3%) | $0 |
| Total | 184 (100.0%) | $68,066 |
Household Income in St Paul
Household Income Brackets in St Paul
With 199 households falling in the category, the less than $10,000 income range is the most frequent in St Paul, accounting for 55.9% of all households.
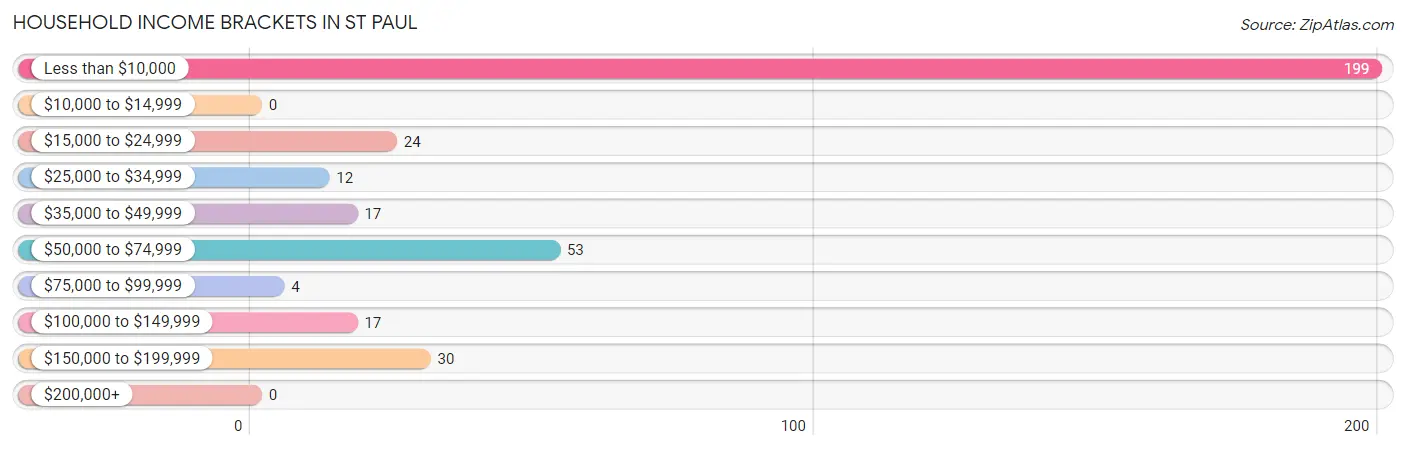
| Income Bracket | # Households | % Households |
| Less than $10,000 | 199 | 55.9% |
| $10,000 to $14,999 | 0 | 0.0% |
| $15,000 to $24,999 | 24 | 6.7% |
| $25,000 to $34,999 | 12 | 3.4% |
| $35,000 to $49,999 | 17 | 4.8% |
| $50,000 to $74,999 | 53 | 14.9% |
| $75,000 to $99,999 | 4 | 1.1% |
| $100,000 to $149,999 | 17 | 4.8% |
| $150,000 to $199,999 | 30 | 8.4% |
| $200,000+ | 0 | 0.0% |
Household Income by Householder Age in St Paul
The median household income in St Paul is $0, with the highest median household income of $68,656 found in the 45 to 64 years age bracket for the primary householder. A total of 77 households (21.6%) fall into this category.
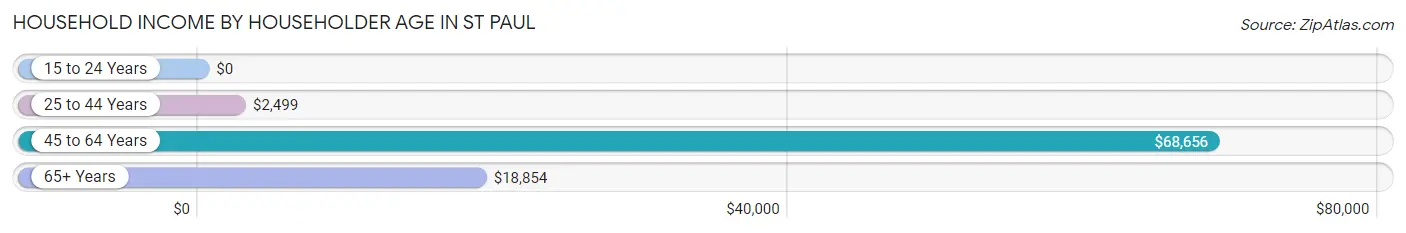
| Income Bracket | # Households | Median Income |
| 15 to 24 Years | 0 (0.0%) | $0 |
| 25 to 44 Years | 199 (55.9%) | $2,499 |
| 45 to 64 Years | 77 (21.6%) | $68,656 |
| 65+ Years | 80 (22.5%) | $18,854 |
| Total | 356 (100.0%) | $0 |
Poverty in St Paul
Income Below Poverty by Sex and Age in St Paul
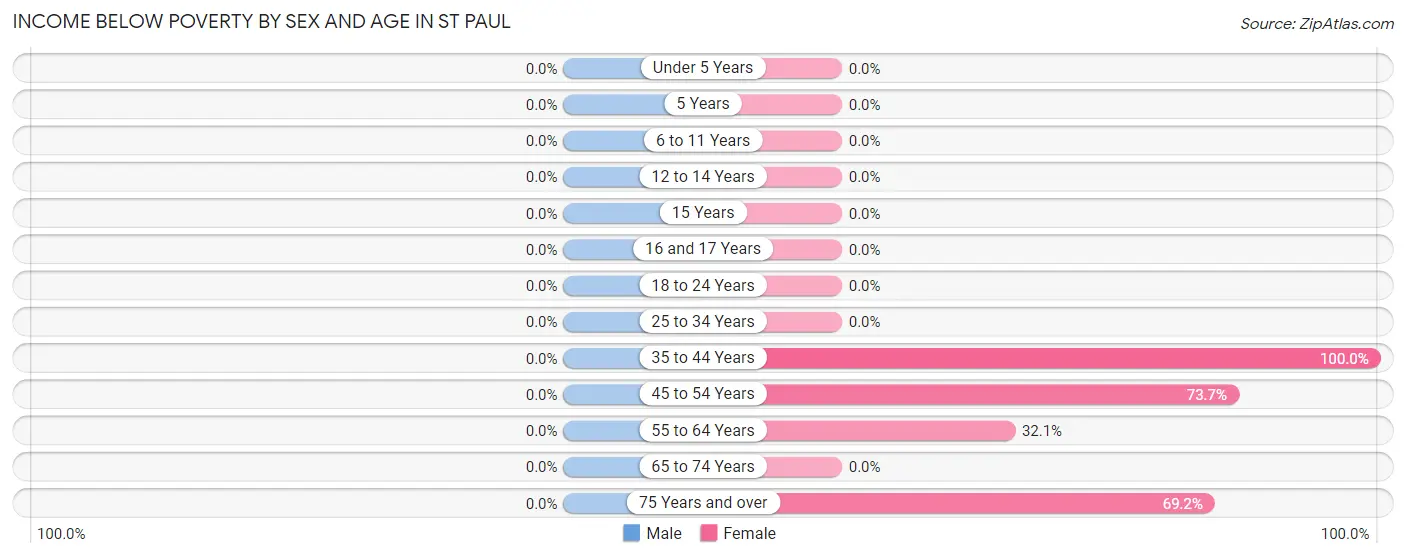
| Age Bracket | Male | Female |
| Under 5 Years | 0 (0.0%) | 0 (0.0%) |
| 5 Years | 0 (0.0%) | 0 (0.0%) |
| 6 to 11 Years | 0 (0.0%) | 0 (0.0%) |
| 12 to 14 Years | 0 (0.0%) | 0 (0.0%) |
| 15 Years | 0 (0.0%) | 0 (0.0%) |
| 16 and 17 Years | 0 (0.0%) | 0 (0.0%) |
| 18 to 24 Years | 0 (0.0%) | 0 (0.0%) |
| 25 to 34 Years | 0 (0.0%) | 0 (0.0%) |
| 35 to 44 Years | 0 (0.0%) | 158 (100.0%) |
| 45 to 54 Years | 0 (0.0%) | 14 (73.7%) |
| 55 to 64 Years | 0 (0.0%) | 27 (32.1%) |
| 65 to 74 Years | 0 (0.0%) | 0 (0.0%) |
| 75 Years and over | 0 (0.0%) | 27 (69.2%) |
| Total | 0 (0.0%) | 226 (46.1%) |
Income Above Poverty by Sex and Age in St Paul
According to the poverty statistics in St Paul, males aged under 5 years and females aged 6 to 11 years are the age groups that are most secure financially, with 100.0% of males and 100.0% of females in these age groups living above the poverty line.
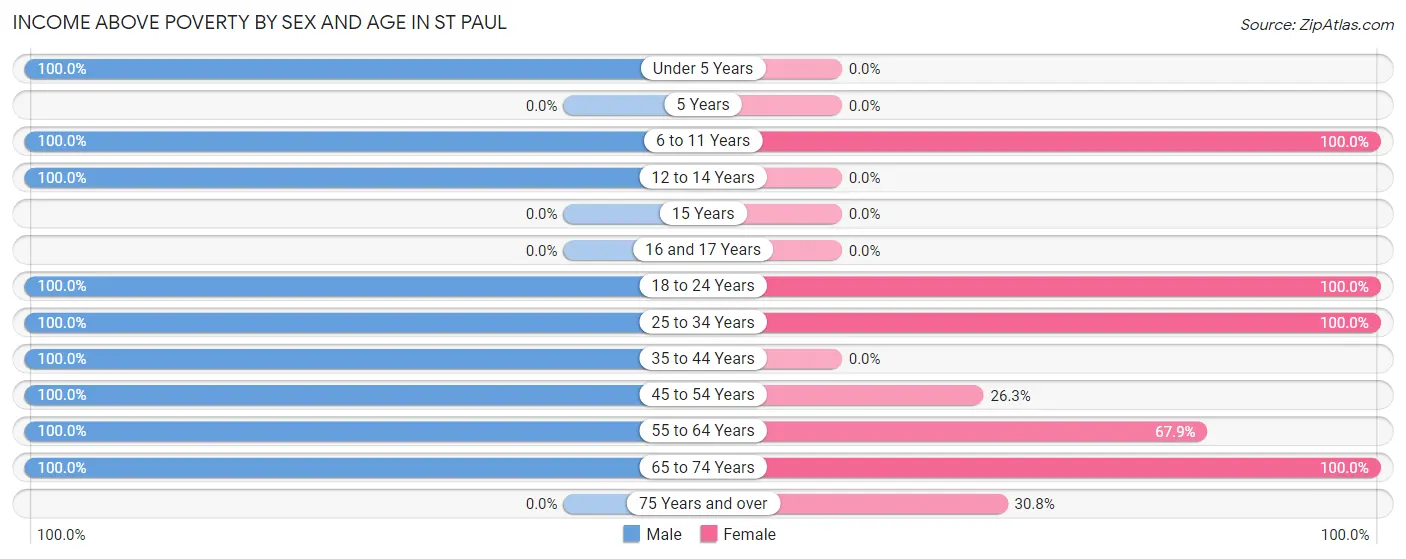
| Age Bracket | Male | Female |
| Under 5 Years | 89 (100.0%) | 0 (0.0%) |
| 5 Years | 0 (0.0%) | 0 (0.0%) |
| 6 to 11 Years | 79 (100.0%) | 60 (100.0%) |
| 12 to 14 Years | 36 (100.0%) | 0 (0.0%) |
| 15 Years | 0 (0.0%) | 0 (0.0%) |
| 16 and 17 Years | 0 (0.0%) | 0 (0.0%) |
| 18 to 24 Years | 21 (100.0%) | 7 (100.0%) |
| 25 to 34 Years | 132 (100.0%) | 83 (100.0%) |
| 35 to 44 Years | 35 (100.0%) | 0 (0.0%) |
| 45 to 54 Years | 27 (100.0%) | 5 (26.3%) |
| 55 to 64 Years | 145 (100.0%) | 57 (67.9%) |
| 65 to 74 Years | 48 (100.0%) | 40 (100.0%) |
| 75 Years and over | 0 (0.0%) | 12 (30.8%) |
| Total | 612 (100.0%) | 264 (53.9%) |
Income Below Poverty Among Married-Couple Families in St Paul
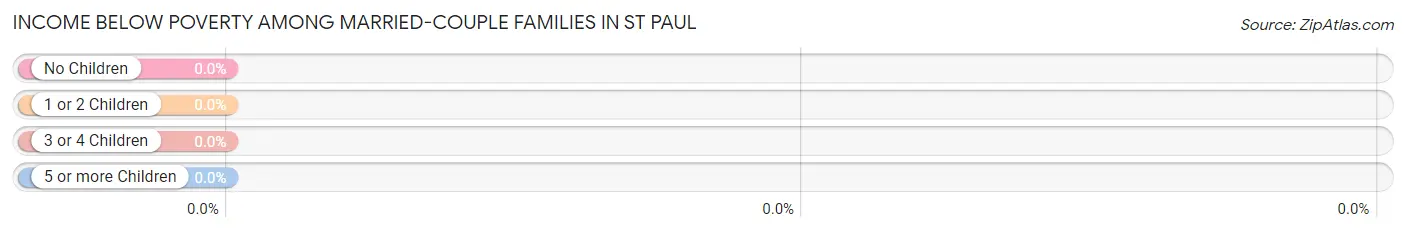
| Children | Above Poverty | Below Poverty |
| No Children | 39 (100.0%) | 0 (0.0%) |
| 1 or 2 Children | 0 (0.0%) | 0 (0.0%) |
| 3 or 4 Children | 41 (100.0%) | 0 (0.0%) |
| 5 or more Children | 0 (0.0%) | 0 (0.0%) |
| Total | 80 (100.0%) | 0 (0.0%) |
Income Below Poverty Among Single-Parent Households in St Paul
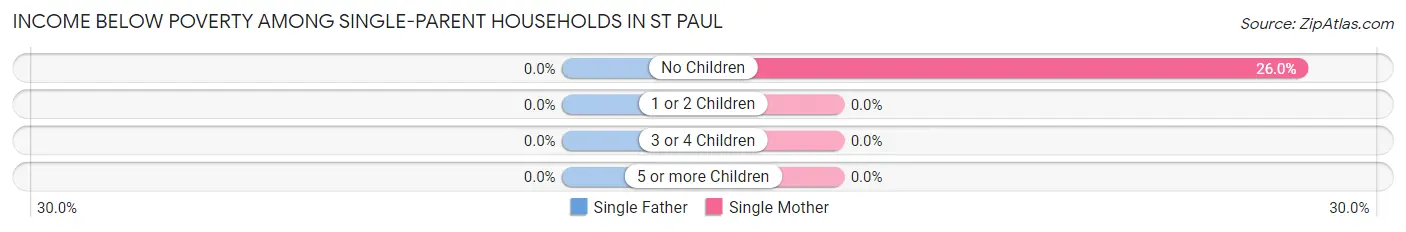
| Children | Single Father | Single Mother |
| No Children | 0 (0.0%) | 27 (26.0%) |
| 1 or 2 Children | 0 (0.0%) | 0 (0.0%) |
| 3 or 4 Children | 0 (0.0%) | 0 (0.0%) |
| 5 or more Children | 0 (0.0%) | 0 (0.0%) |
| Total | 0 (0.0%) | 27 (26.0%) |
Income Below Poverty Among Married-Couple vs Single-Parent Households in St Paul
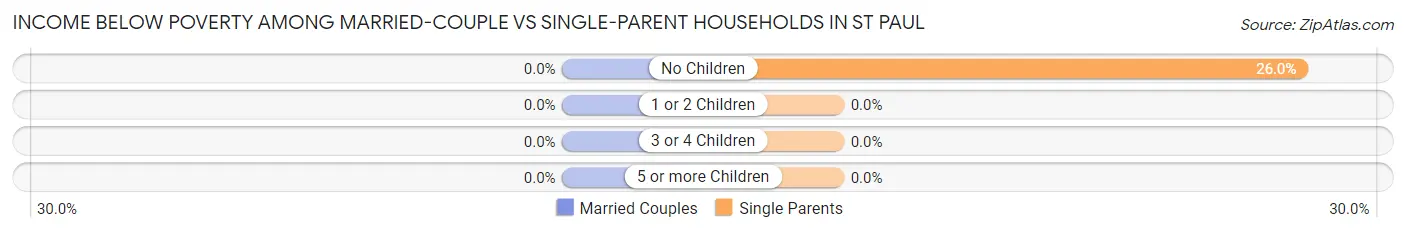
| Children | Married-Couple Families | Single-Parent Households |
| No Children | 0 (0.0%) | 27 (26.0%) |
| 1 or 2 Children | 0 (0.0%) | 0 (0.0%) |
| 3 or 4 Children | 0 (0.0%) | 0 (0.0%) |
| 5 or more Children | 0 (0.0%) | 0 (0.0%) |
| Total | 0 (0.0%) | 27 (26.0%) |
Race in St Paul
The most populous races in St Paul are White / Caucasian (830 | 75.3%), Hispanic or Latino (770 | 69.9%), and Some other Race (172 | 15.6%).
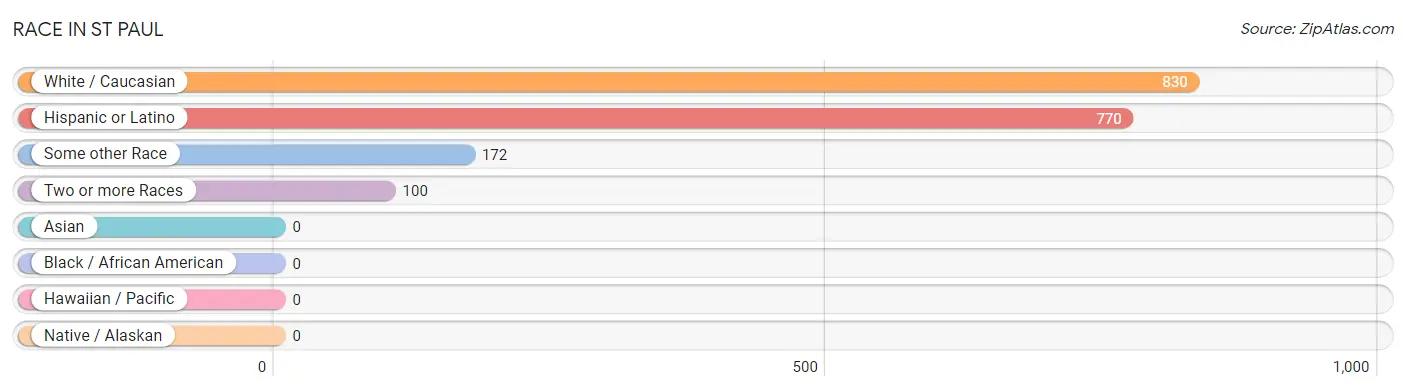
| Race | # Population | % Population |
| Asian | 0 | 0.0% |
| Black / African American | 0 | 0.0% |
| Hawaiian / Pacific | 0 | 0.0% |
| Hispanic or Latino | 770 | 69.9% |
| Native / Alaskan | 0 | 0.0% |
| White / Caucasian | 830 | 75.3% |
| Two or more Races | 100 | 9.1% |
| Some other Race | 172 | 15.6% |
| Total | 1,102 | 100.0% |
Ancestry in St Paul
The most populous ancestries reported in St Paul are Mexican (756 | 68.6%), and Portuguese (4 | 0.4%), together accounting for 69.0% of all St Paul residents.
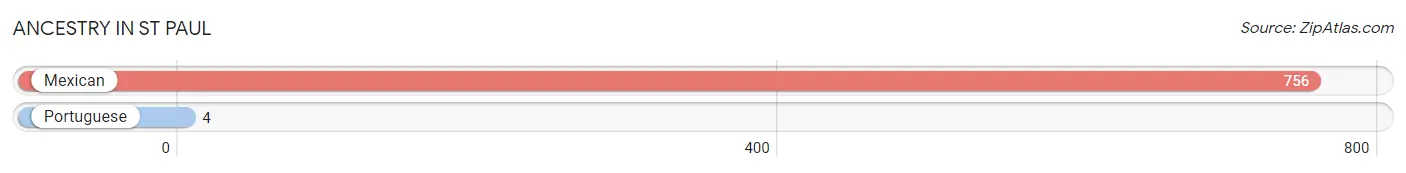
| Ancestry | # Population | % Population |
| Mexican | 756 | 68.6% |
| Portuguese | 4 | 0.4% | View All 2 Rows |
Immigrants in St Paul

| Immigration Origin | # Population | % Population | View All 0 Rows |
Sex and Age in St Paul
Sex and Age in St Paul
The most populous age groups in St Paul are 55 to 59 Years (145 | 23.7%) for men and 35 to 39 Years (158 | 32.2%) for women.
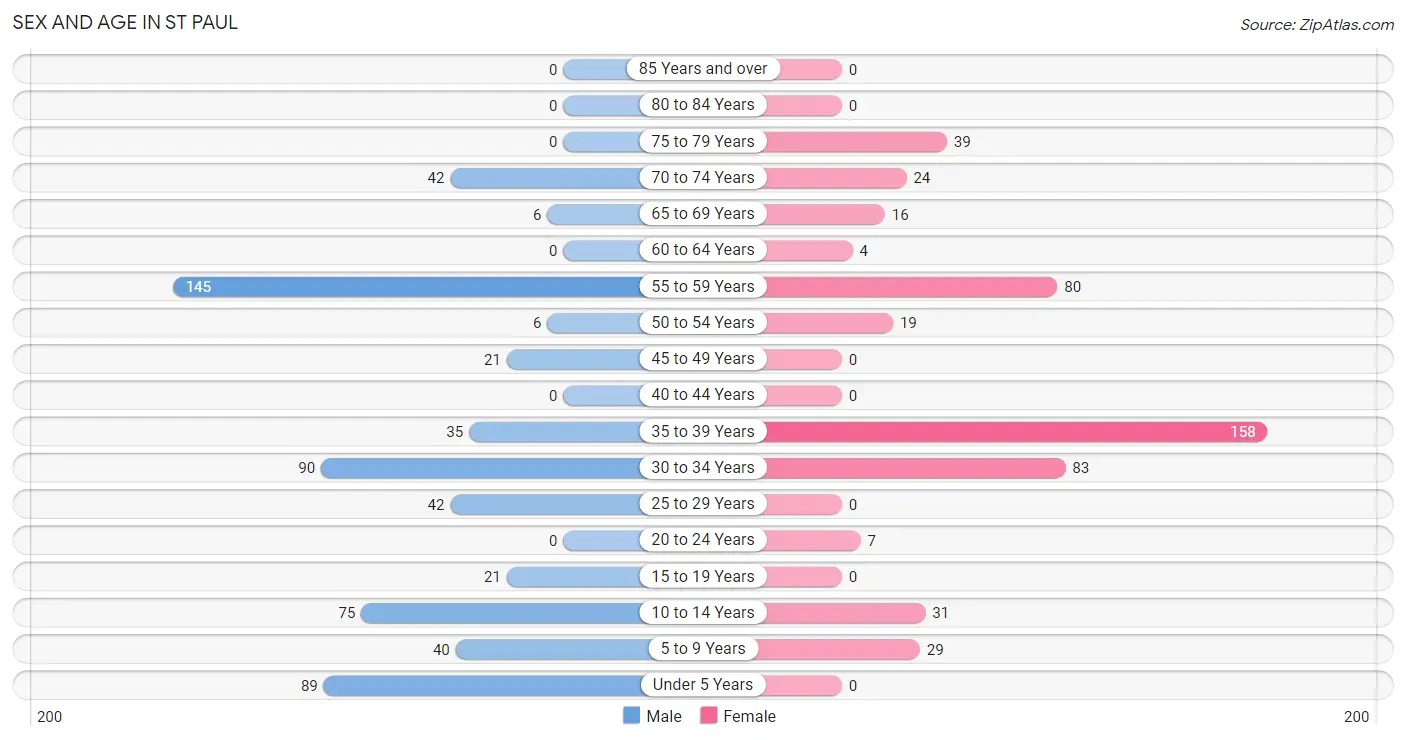
| Age Bracket | Male | Female |
| Under 5 Years | 89 (14.5%) | 0 (0.0%) |
| 5 to 9 Years | 40 (6.5%) | 29 (5.9%) |
| 10 to 14 Years | 75 (12.2%) | 31 (6.3%) |
| 15 to 19 Years | 21 (3.4%) | 0 (0.0%) |
| 20 to 24 Years | 0 (0.0%) | 7 (1.4%) |
| 25 to 29 Years | 42 (6.9%) | 0 (0.0%) |
| 30 to 34 Years | 90 (14.7%) | 83 (16.9%) |
| 35 to 39 Years | 35 (5.7%) | 158 (32.2%) |
| 40 to 44 Years | 0 (0.0%) | 0 (0.0%) |
| 45 to 49 Years | 21 (3.4%) | 0 (0.0%) |
| 50 to 54 Years | 6 (1.0%) | 19 (3.9%) |
| 55 to 59 Years | 145 (23.7%) | 80 (16.3%) |
| 60 to 64 Years | 0 (0.0%) | 4 (0.8%) |
| 65 to 69 Years | 6 (1.0%) | 16 (3.3%) |
| 70 to 74 Years | 42 (6.9%) | 24 (4.9%) |
| 75 to 79 Years | 0 (0.0%) | 39 (8.0%) |
| 80 to 84 Years | 0 (0.0%) | 0 (0.0%) |
| 85 Years and over | 0 (0.0%) | 0 (0.0%) |
| Total | 612 (100.0%) | 490 (100.0%) |
Families and Households in St Paul
Median Family Size in St Paul
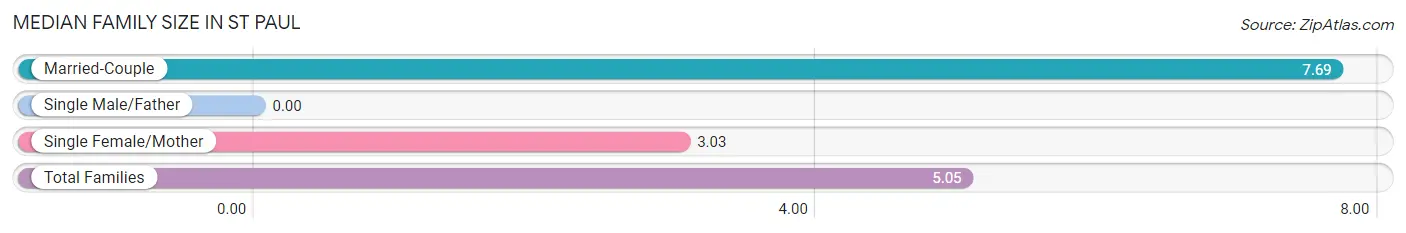
| Family Type | # Families | Family Size |
| Married-Couple | 80 (43.5%) | 7.69 |
| Single Male/Father | 0 (0.0%) | - |
| Single Female/Mother | 104 (56.5%) | 3.03 |
| Total Families | 184 (100.0%) | 5.05 |
Median Household Size in St Paul
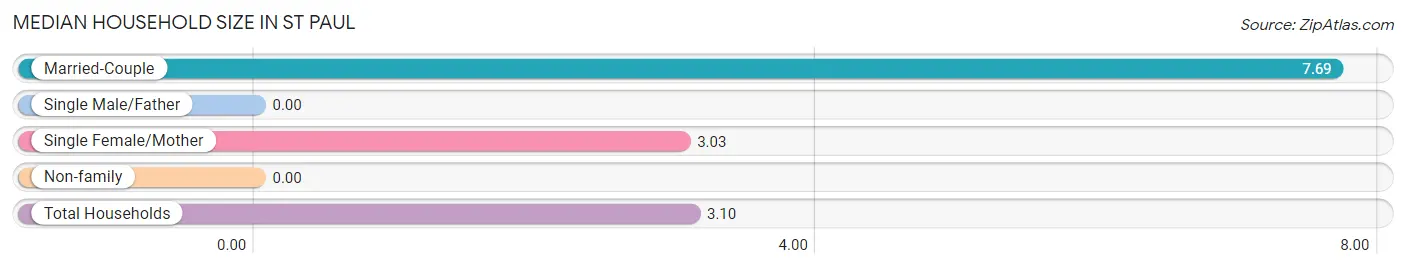
| Household Type | # Households | Household Size |
| Married-Couple | 80 (22.5%) | 7.69 |
| Single Male/Father | 0 (0.0%) | - |
| Single Female/Mother | 104 (29.2%) | 3.03 |
| Non-family | 172 (48.3%) | - |
| Total Households | 356 (100.0%) | 3.10 |
Household Size by Marriage Status in St Paul
Out of a total of 356 households in St Paul, 184 (51.7%) are family households, while 172 (48.3%) are nonfamily households. The most numerous type of family households are 2-person households, comprising 67, and the most common type of nonfamily households are 1-person households, comprising 172.
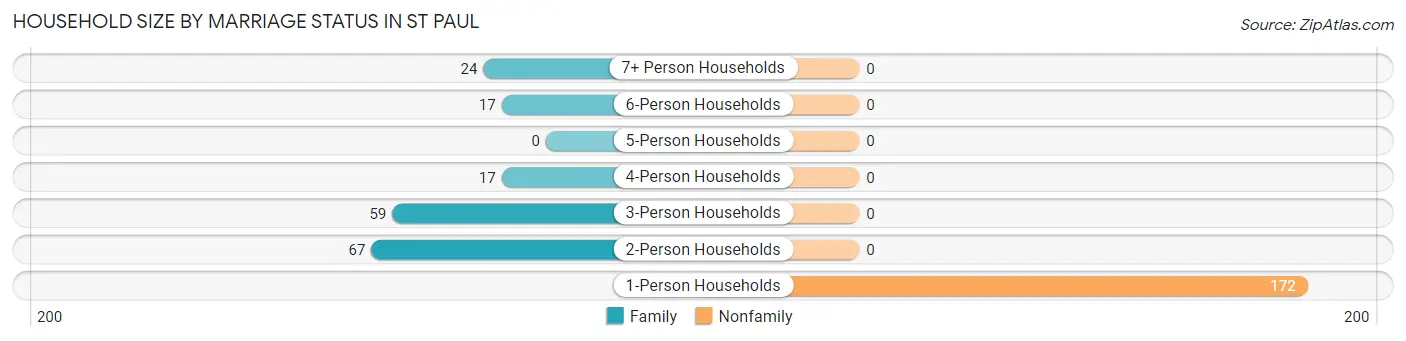
| Household Size | Family Households | Nonfamily Households |
| 1-Person Households | - | 172 (48.3%) |
| 2-Person Households | 67 (18.8%) | 0 (0.0%) |
| 3-Person Households | 59 (16.6%) | 0 (0.0%) |
| 4-Person Households | 17 (4.8%) | 0 (0.0%) |
| 5-Person Households | 0 (0.0%) | 0 (0.0%) |
| 6-Person Households | 17 (4.8%) | 0 (0.0%) |
| 7+ Person Households | 24 (6.7%) | 0 (0.0%) |
| Total | 184 (51.7%) | 172 (48.3%) |
Female Fertility in St Paul
Fertility by Age in St Paul
Average fertility rate in St Paul is 111.0 births per 1,000 women. Women in the age bracket of 20 to 34 years have the highest fertility rate with 311.0 births per 1,000 women. Women in the age bracket of 20 to 34 years acount for 100.0% of all women with births.
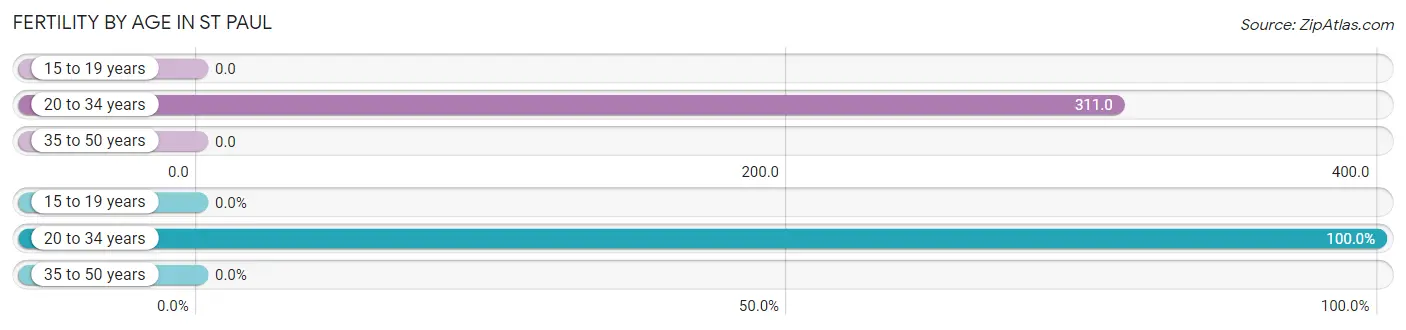
| Age Bracket | Women with Births | Births / 1,000 Women |
| 15 to 19 years | 0 (0.0%) | 0.0 |
| 20 to 34 years | 28 (100.0%) | 311.0 |
| 35 to 50 years | 0 (0.0%) | 0.0 |
| Total | 28 (100.0%) | 111.0 |
Fertility by Age by Marriage Status in St Paul
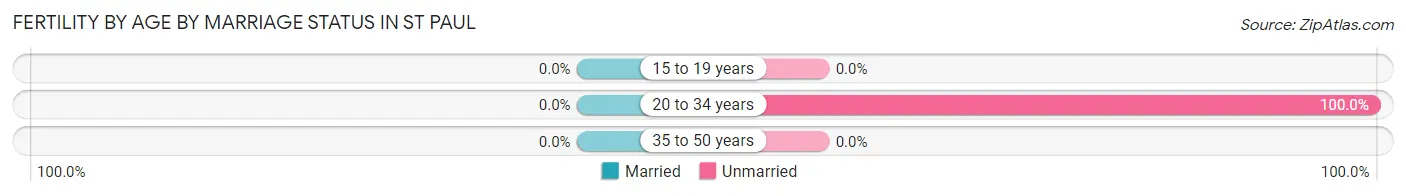
| Age Bracket | Married | Unmarried |
| 15 to 19 years | 0 (0.0%) | 0 (0.0%) |
| 20 to 34 years | 0 (0.0%) | 28 (100.0%) |
| 35 to 50 years | 0 (0.0%) | 0 (0.0%) |
| Total | 0 (0.0%) | 28 (100.0%) |
Fertility by Education in St Paul
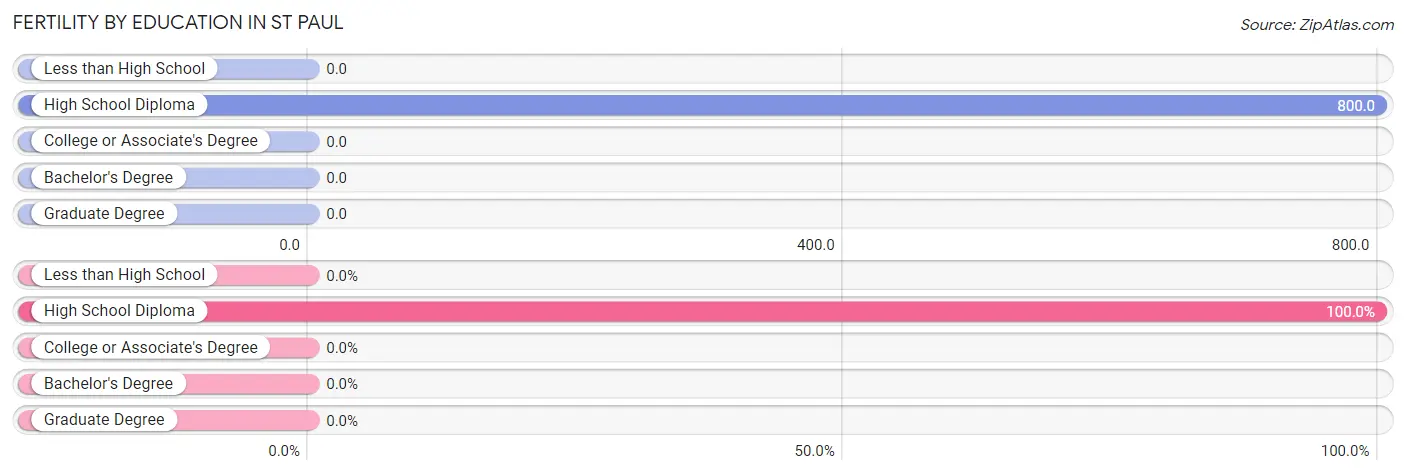
| Educational Attainment | Women with Births | Births / 1,000 Women |
| Less than High School | 0 (0.0%) | 0.0 |
| High School Diploma | 28 (100.0%) | 800.0 |
| College or Associate's Degree | 0 (0.0%) | 0.0 |
| Bachelor's Degree | 0 (0.0%) | 0.0 |
| Graduate Degree | 0 (0.0%) | 0.0 |
| Total | 28 (100.0%) | 111.0 |
Fertility by Education by Marriage Status in St Paul
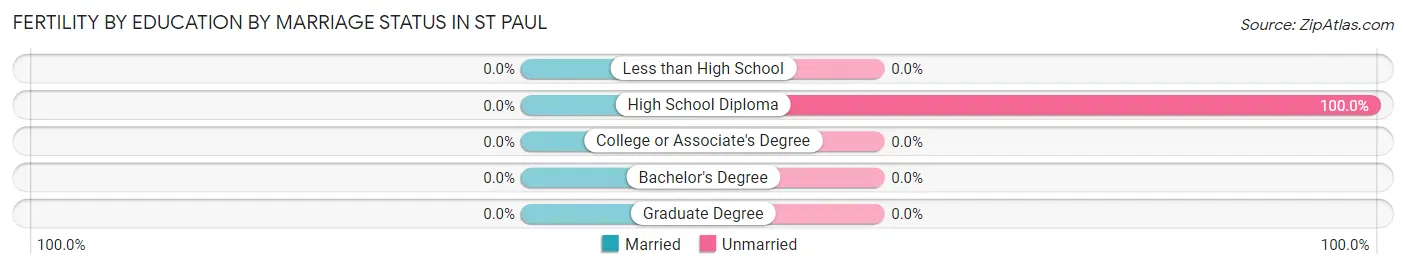
| Educational Attainment | Married | Unmarried |
| Less than High School | 0 (0.0%) | 0 (0.0%) |
| High School Diploma | 0 (0.0%) | 28 (100.0%) |
| College or Associate's Degree | 0 (0.0%) | 0 (0.0%) |
| Bachelor's Degree | 0 (0.0%) | 0 (0.0%) |
| Graduate Degree | 0 (0.0%) | 0 (0.0%) |
| Total | 0 (0.0%) | 28 (100.0%) |
Employment Characteristics in St Paul
Employment by Class of Employer in St Paul
Among the 377 employed individuals in St Paul, private company employees (341 | 90.4%), self-employed (not incorporated) (21 | 5.6%), and local government employees (15 | 4.0%) make up the most common classes of employment.
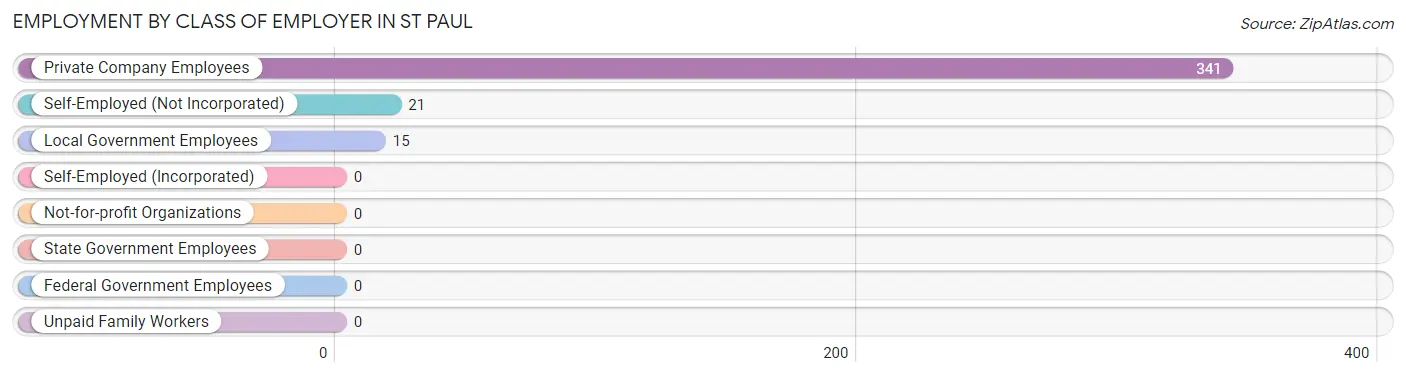
| Employer Class | # Employees | % Employees |
| Private Company Employees | 341 | 90.4% |
| Self-Employed (Incorporated) | 0 | 0.0% |
| Self-Employed (Not Incorporated) | 21 | 5.6% |
| Not-for-profit Organizations | 0 | 0.0% |
| Local Government Employees | 15 | 4.0% |
| State Government Employees | 0 | 0.0% |
| Federal Government Employees | 0 | 0.0% |
| Unpaid Family Workers | 0 | 0.0% |
| Total | 377 | 100.0% |
Employment Status by Age in St Paul
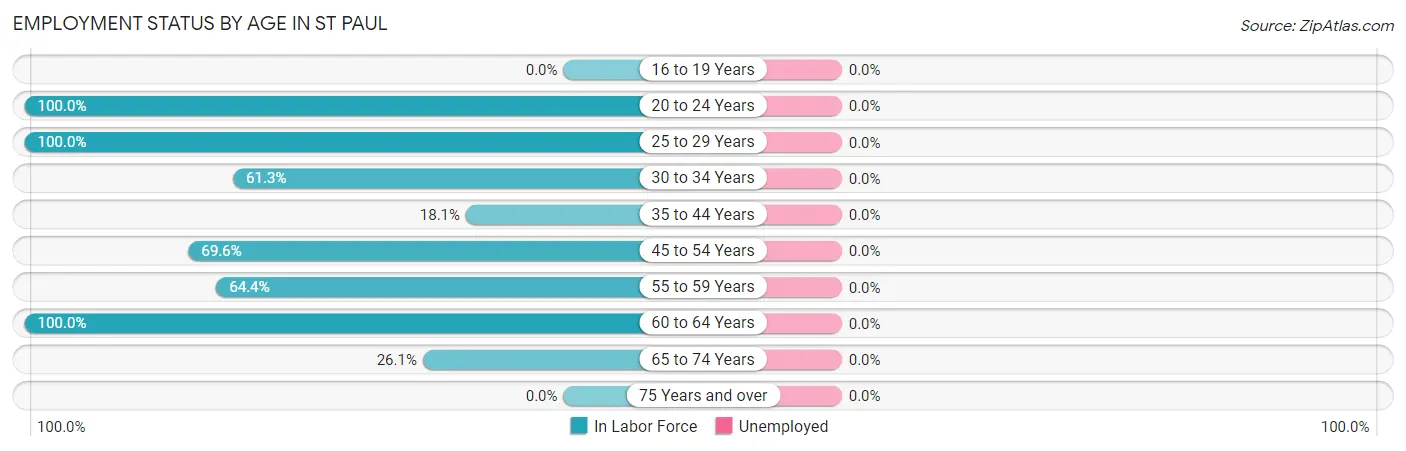
| Age Bracket | In Labor Force | Unemployed |
| 16 to 19 Years | 0 (0.0%) | 0 (0.0%) |
| 20 to 24 Years | 7 (100.0%) | 0 (0.0%) |
| 25 to 29 Years | 42 (100.0%) | 0 (0.0%) |
| 30 to 34 Years | 106 (61.3%) | 0 (0.0%) |
| 35 to 44 Years | 35 (18.1%) | 0 (0.0%) |
| 45 to 54 Years | 32 (69.6%) | 0 (0.0%) |
| 55 to 59 Years | 145 (64.4%) | 0 (0.0%) |
| 60 to 64 Years | 4 (100.0%) | 0 (0.0%) |
| 65 to 74 Years | 23 (26.1%) | 0 (0.0%) |
| 75 Years and over | 0 (0.0%) | 0 (0.0%) |
| Total | 394 (47.0%) | 0 (0.0%) |
Employment Status by Educational Attainment in St Paul
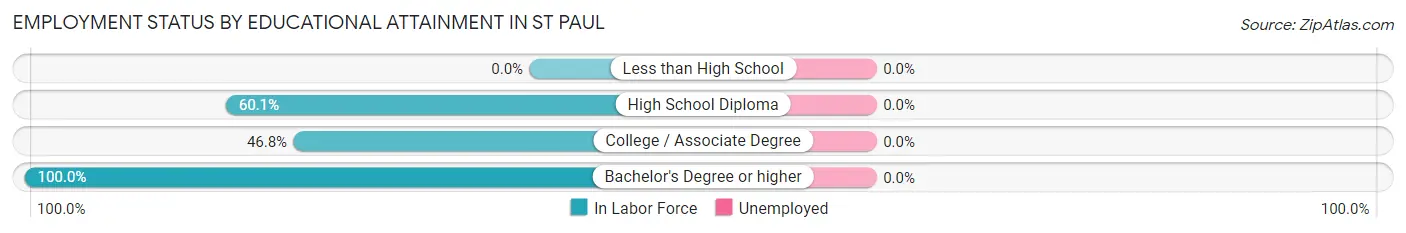
| Educational Attainment | In Labor Force | Unemployed |
| Less than High School | 0 (0.0%) | 0 (0.0%) |
| High School Diploma | 163 (60.1%) | 0 (0.0%) |
| College / Associate Degree | 173 (46.8%) | 0 (0.0%) |
| Bachelor's Degree or higher | 28 (100.0%) | 0 (0.0%) |
| Total | 364 (53.3%) | 0 (0.0%) |
Employment Occupations by Sex in St Paul
Management, Business, Science and Arts Occupations
The most common Management, Business, Science and Arts occupations in St Paul are Management (42 | 10.7%), Computers, Engineering & Science (10 | 2.5%), Computers & Mathematics (10 | 2.5%), Community & Social Service (5 | 1.3%), and Education Instruction & Library (5 | 1.3%).
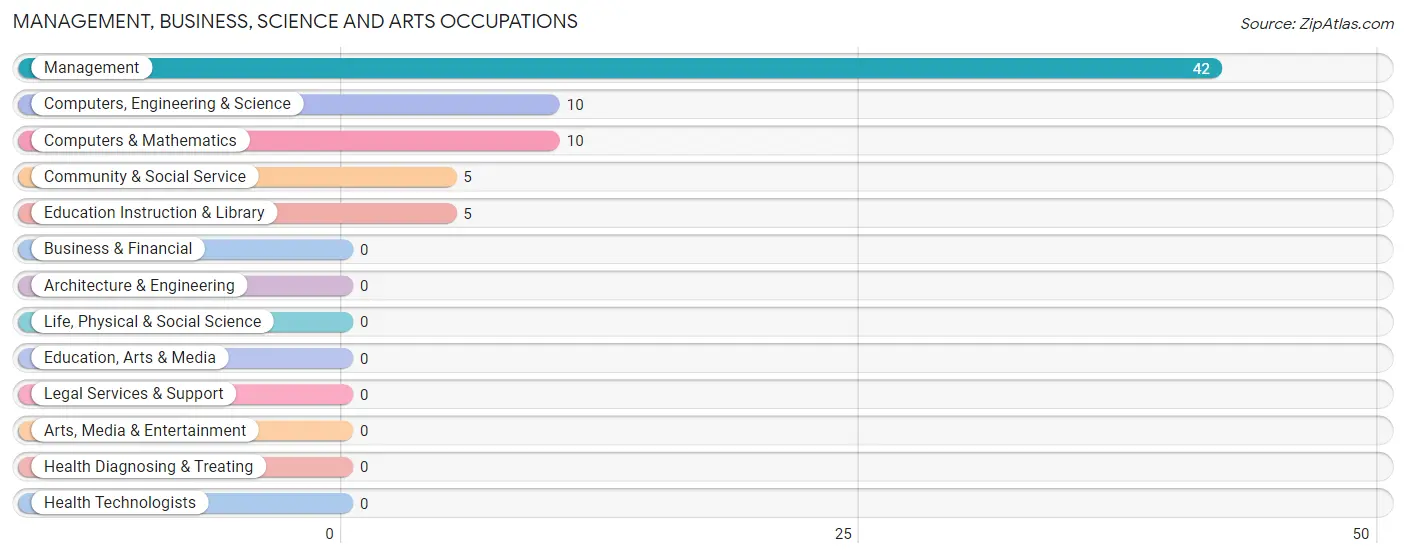
Management, Business, Science and Arts Occupations by Sex
Within the Management, Business, Science and Arts occupations in St Paul, the most male-oriented occupations are Management (100.0%), Computers, Engineering & Science (60.0%), and Computers & Mathematics (60.0%), while the most female-oriented occupations are Community & Social Service (100.0%), Education Instruction & Library (100.0%), and Computers, Engineering & Science (40.0%).
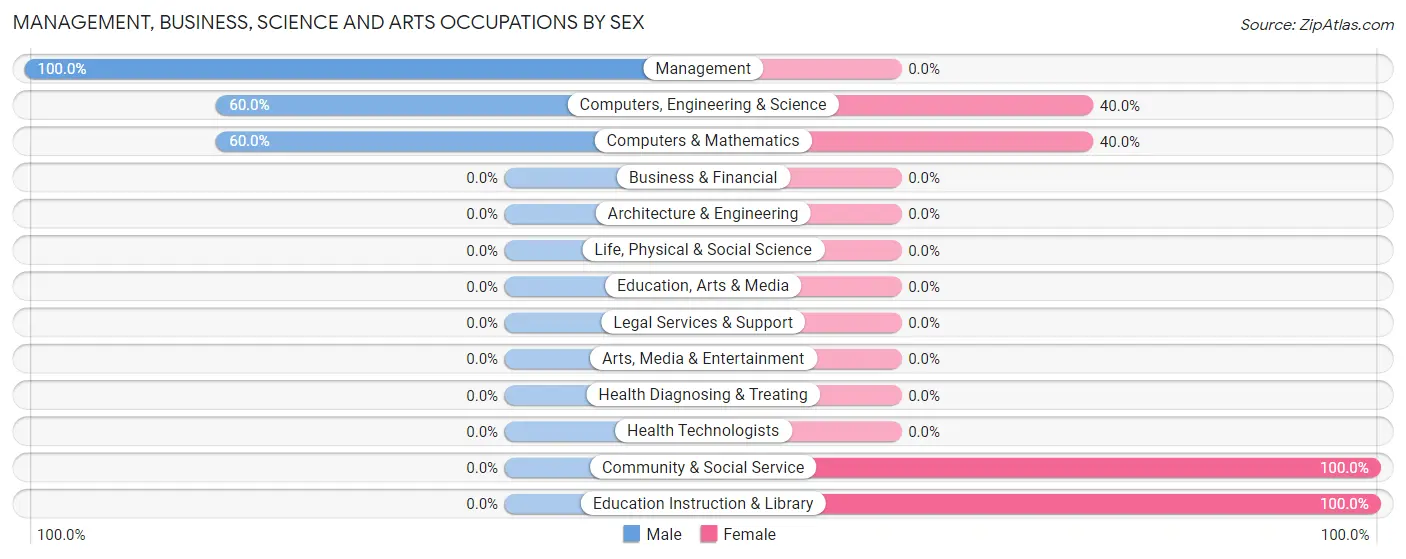
| Occupation | Male | Female |
| Management | 42 (100.0%) | 0 (0.0%) |
| Business & Financial | 0 (0.0%) | 0 (0.0%) |
| Computers, Engineering & Science | 6 (60.0%) | 4 (40.0%) |
| Computers & Mathematics | 6 (60.0%) | 4 (40.0%) |
| Architecture & Engineering | 0 (0.0%) | 0 (0.0%) |
| Life, Physical & Social Science | 0 (0.0%) | 0 (0.0%) |
| Community & Social Service | 0 (0.0%) | 5 (100.0%) |
| Education, Arts & Media | 0 (0.0%) | 0 (0.0%) |
| Legal Services & Support | 0 (0.0%) | 0 (0.0%) |
| Education Instruction & Library | 0 (0.0%) | 5 (100.0%) |
| Arts, Media & Entertainment | 0 (0.0%) | 0 (0.0%) |
| Health Diagnosing & Treating | 0 (0.0%) | 0 (0.0%) |
| Health Technologists | 0 (0.0%) | 0 (0.0%) |
| Total (Category) | 48 (84.2%) | 9 (15.8%) |
| Total (Overall) | 323 (82.0%) | 71 (18.0%) |
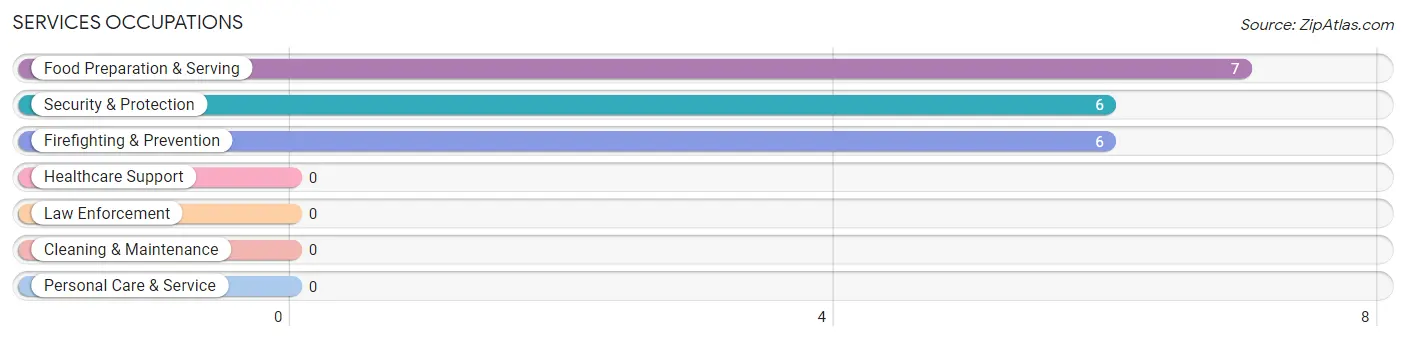
Services Occupations
The most common Services occupations in St Paul are Food Preparation & Serving (7 | 1.8%), Security & Protection (6 | 1.5%), and Firefighting & Prevention (6 | 1.5%).
Services Occupations by Sex
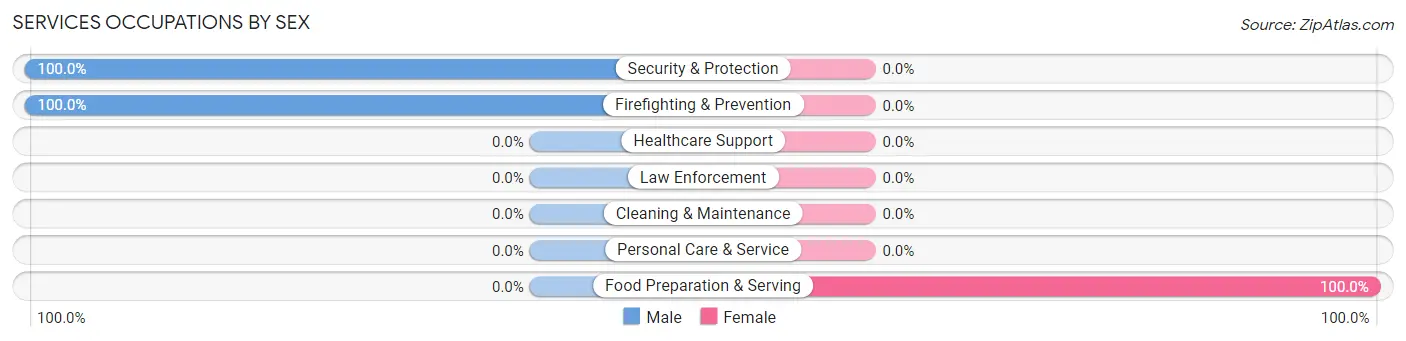
| Occupation | Male | Female |
| Healthcare Support | 0 (0.0%) | 0 (0.0%) |
| Security & Protection | 6 (100.0%) | 0 (0.0%) |
| Firefighting & Prevention | 6 (100.0%) | 0 (0.0%) |
| Law Enforcement | 0 (0.0%) | 0 (0.0%) |
| Food Preparation & Serving | 0 (0.0%) | 7 (100.0%) |
| Cleaning & Maintenance | 0 (0.0%) | 0 (0.0%) |
| Personal Care & Service | 0 (0.0%) | 0 (0.0%) |
| Total (Category) | 6 (46.2%) | 7 (53.8%) |
| Total (Overall) | 323 (82.0%) | 71 (18.0%) |
Sales and Office Occupations
The most common Sales and Office occupations in St Paul are , and Office & Administration (24 | 6.1%).
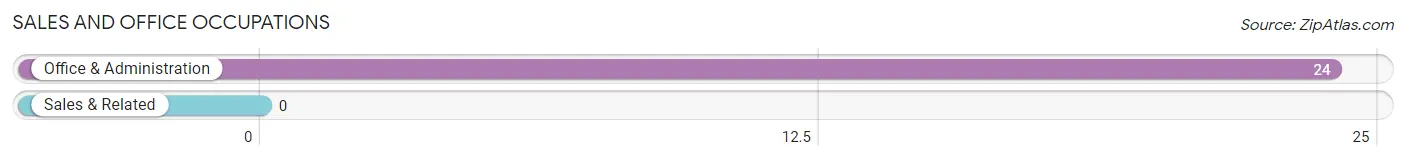
Sales and Office Occupations by Sex
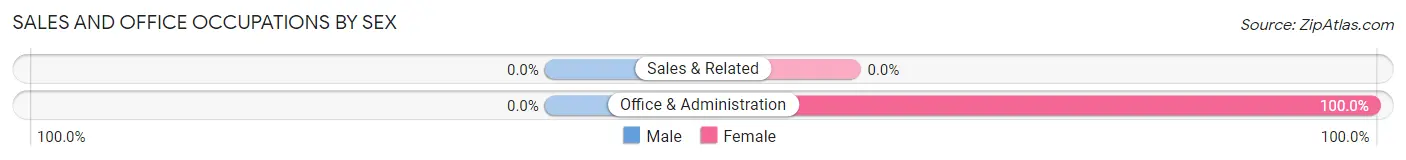
| Occupation | Male | Female |
| Sales & Related | 0 (0.0%) | 0 (0.0%) |
| Office & Administration | 0 (0.0%) | 24 (100.0%) |
| Total (Category) | 0 (0.0%) | 24 (100.0%) |
| Total (Overall) | 323 (82.0%) | 71 (18.0%) |
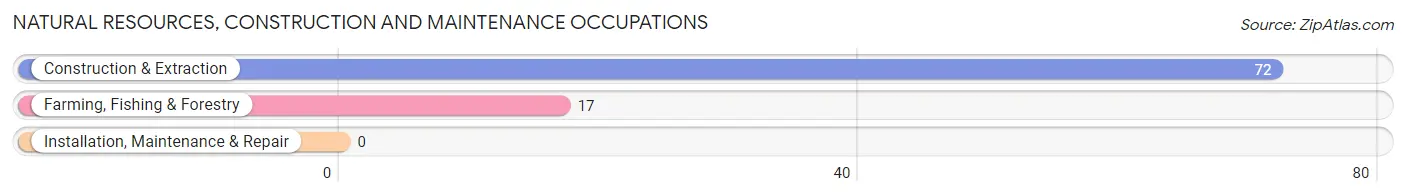
Natural Resources, Construction and Maintenance Occupations
The most common Natural Resources, Construction and Maintenance occupations in St Paul are Construction & Extraction (72 | 18.3%), and Farming, Fishing & Forestry (17 | 4.3%).
Natural Resources, Construction and Maintenance Occupations by Sex
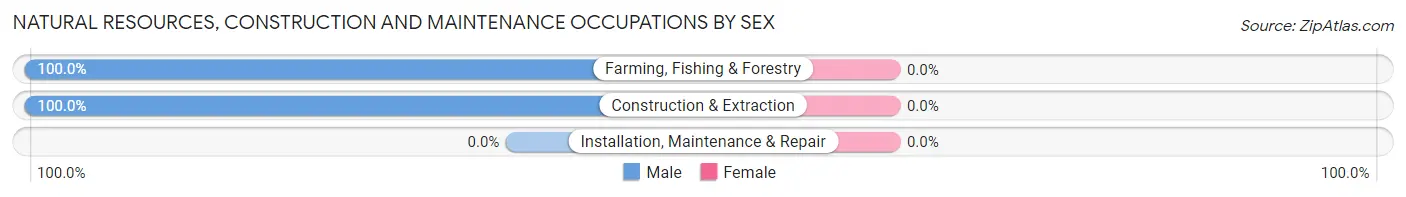
| Occupation | Male | Female |
| Farming, Fishing & Forestry | 17 (100.0%) | 0 (0.0%) |
| Construction & Extraction | 72 (100.0%) | 0 (0.0%) |
| Installation, Maintenance & Repair | 0 (0.0%) | 0 (0.0%) |
| Total (Category) | 89 (100.0%) | 0 (0.0%) |
| Total (Overall) | 323 (82.0%) | 71 (18.0%) |
Production, Transportation and Moving Occupations
The most common Production, Transportation and Moving occupations in St Paul are Material Moving (139 | 35.3%), and Production (72 | 18.3%).
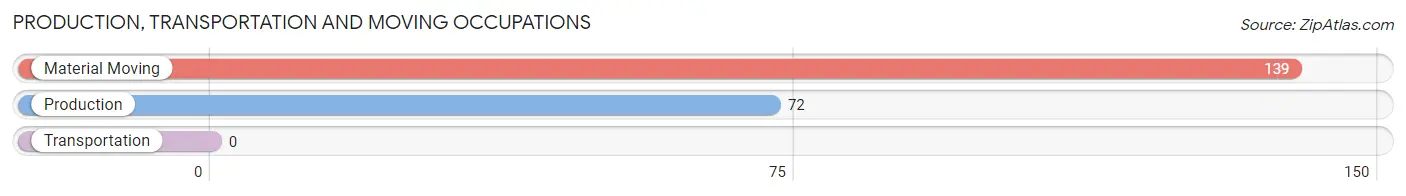
Production, Transportation and Moving Occupations by Sex
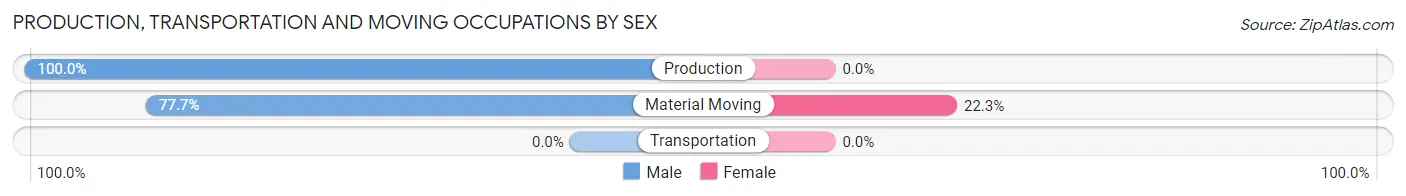
| Occupation | Male | Female |
| Production | 72 (100.0%) | 0 (0.0%) |
| Transportation | 0 (0.0%) | 0 (0.0%) |
| Material Moving | 108 (77.7%) | 31 (22.3%) |
| Total (Category) | 180 (85.3%) | 31 (14.7%) |
| Total (Overall) | 323 (82.0%) | 71 (18.0%) |
Employment Industries by Sex in St Paul
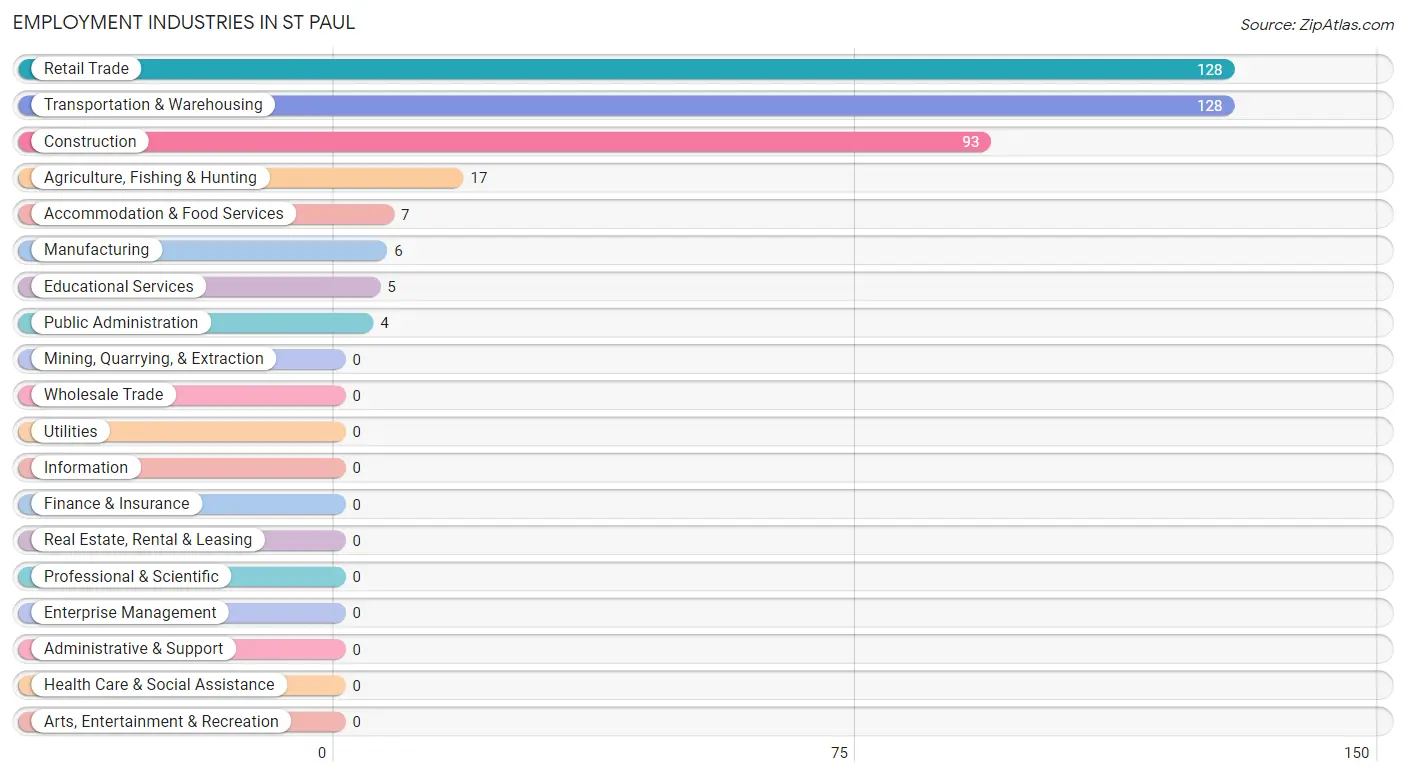
Employment Industries in St Paul
The major employment industries in St Paul include Retail Trade (128 | 32.5%), Transportation & Warehousing (128 | 32.5%), Construction (93 | 23.6%), Agriculture, Fishing & Hunting (17 | 4.3%), and Accommodation & Food Services (7 | 1.8%).
Employment Industries by Sex in St Paul
The St Paul industries that see more men than women are Agriculture, Fishing & Hunting (100.0%), Construction (100.0%), and Manufacturing (100.0%), whereas the industries that tend to have a higher number of women are Educational Services (100.0%), Accommodation & Food Services (100.0%), and Public Administration (100.0%).
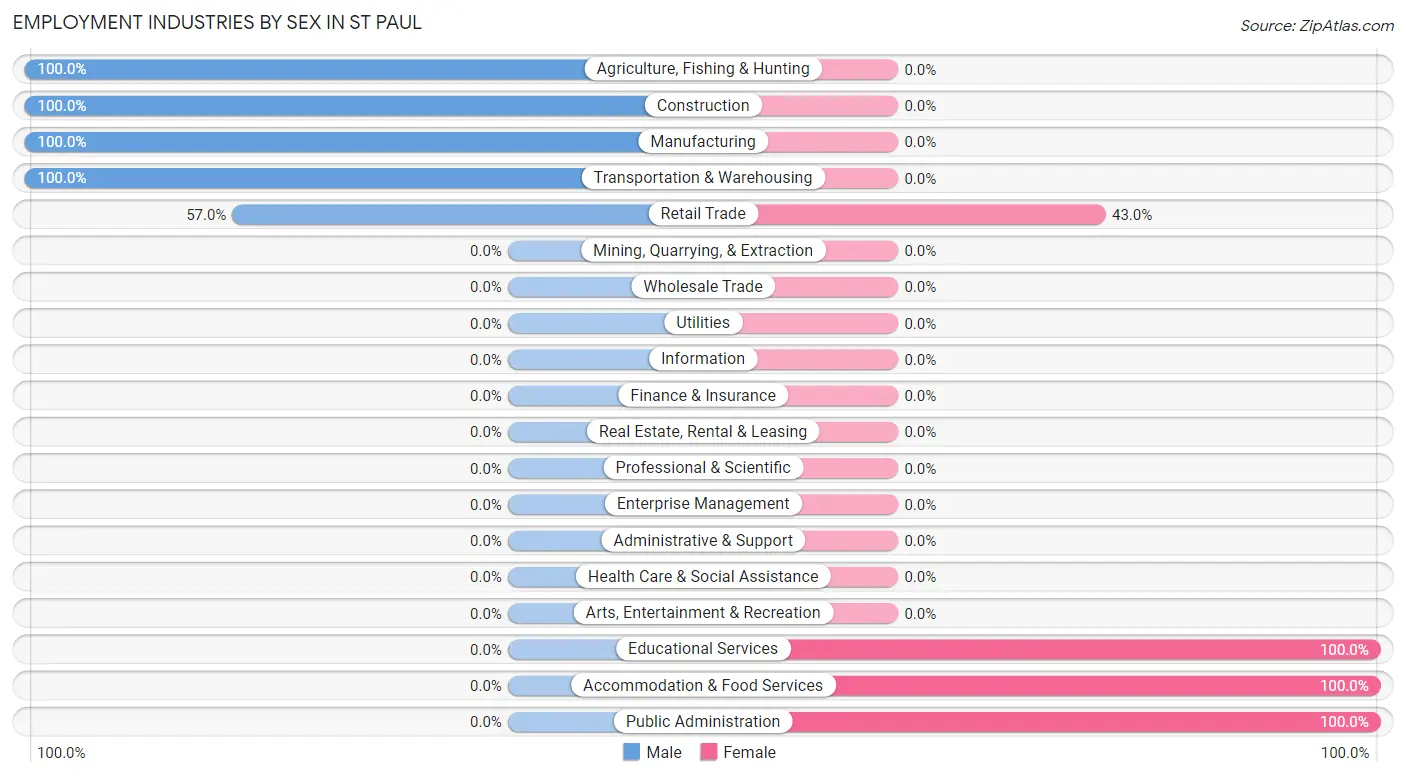
| Industry | Male | Female |
| Agriculture, Fishing & Hunting | 17 (100.0%) | 0 (0.0%) |
| Mining, Quarrying, & Extraction | 0 (0.0%) | 0 (0.0%) |
| Construction | 93 (100.0%) | 0 (0.0%) |
| Manufacturing | 6 (100.0%) | 0 (0.0%) |
| Wholesale Trade | 0 (0.0%) | 0 (0.0%) |
| Retail Trade | 73 (57.0%) | 55 (43.0%) |
| Transportation & Warehousing | 128 (100.0%) | 0 (0.0%) |
| Utilities | 0 (0.0%) | 0 (0.0%) |
| Information | 0 (0.0%) | 0 (0.0%) |
| Finance & Insurance | 0 (0.0%) | 0 (0.0%) |
| Real Estate, Rental & Leasing | 0 (0.0%) | 0 (0.0%) |
| Professional & Scientific | 0 (0.0%) | 0 (0.0%) |
| Enterprise Management | 0 (0.0%) | 0 (0.0%) |
| Administrative & Support | 0 (0.0%) | 0 (0.0%) |
| Educational Services | 0 (0.0%) | 5 (100.0%) |
| Health Care & Social Assistance | 0 (0.0%) | 0 (0.0%) |
| Arts, Entertainment & Recreation | 0 (0.0%) | 0 (0.0%) |
| Accommodation & Food Services | 0 (0.0%) | 7 (100.0%) |
| Public Administration | 0 (0.0%) | 4 (100.0%) |
| Total | 323 (82.0%) | 71 (18.0%) |
Education in St Paul
School Enrollment in St Paul
The most common levels of schooling among the 226 students in St Paul are middle school (106 | 46.9%), elementary school (69 | 30.5%), and nursery / preschool (30 | 13.3%).
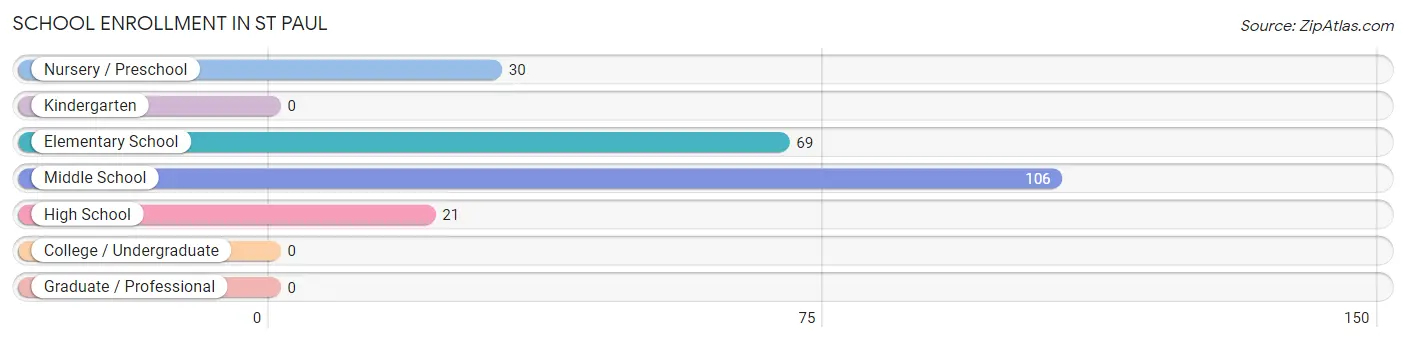
| School Level | # Students | % Students |
| Nursery / Preschool | 30 | 13.3% |
| Kindergarten | 0 | 0.0% |
| Elementary School | 69 | 30.5% |
| Middle School | 106 | 46.9% |
| High School | 21 | 9.3% |
| College / Undergraduate | 0 | 0.0% |
| Graduate / Professional | 0 | 0.0% |
| Total | 226 | 100.0% |
School Enrollment by Age by Funding Source in St Paul
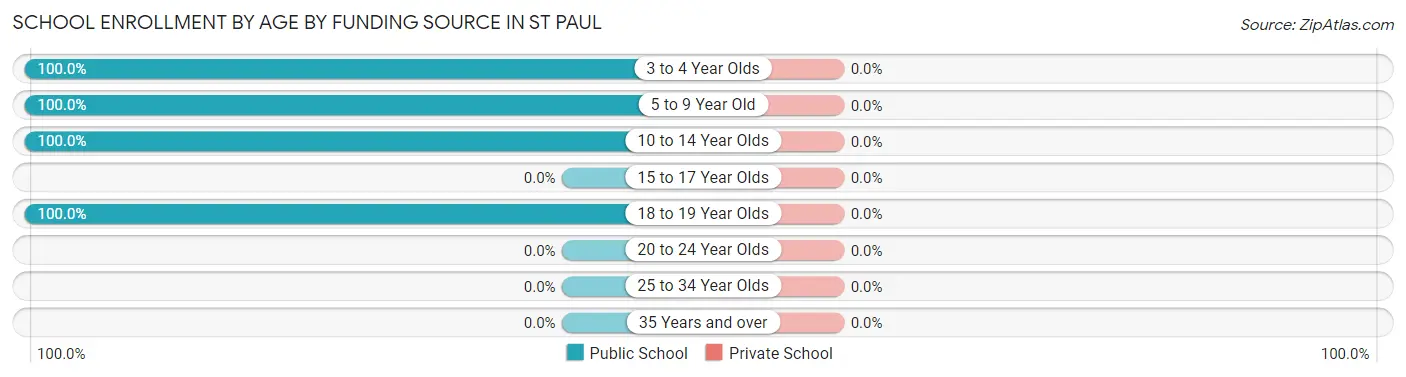
| Age Bracket | Public School | Private School |
| 3 to 4 Year Olds | 30 (100.0%) | 0 (0.0%) |
| 5 to 9 Year Old | 69 (100.0%) | 0 (0.0%) |
| 10 to 14 Year Olds | 106 (100.0%) | 0 (0.0%) |
| 15 to 17 Year Olds | 0 (0.0%) | 0 (0.0%) |
| 18 to 19 Year Olds | 21 (100.0%) | 0 (0.0%) |
| 20 to 24 Year Olds | 0 (0.0%) | 0 (0.0%) |
| 25 to 34 Year Olds | 0 (0.0%) | 0 (0.0%) |
| 35 Years and over | 0 (0.0%) | 0 (0.0%) |
| Total | 226 (100.0%) | 0 (0.0%) |
Educational Attainment by Field of Study in St Paul
Business (23 | 82.1%), and education (5 | 17.9%) are the most common fields of study among 28 individuals in St Paul who have obtained a bachelor's degree or higher.
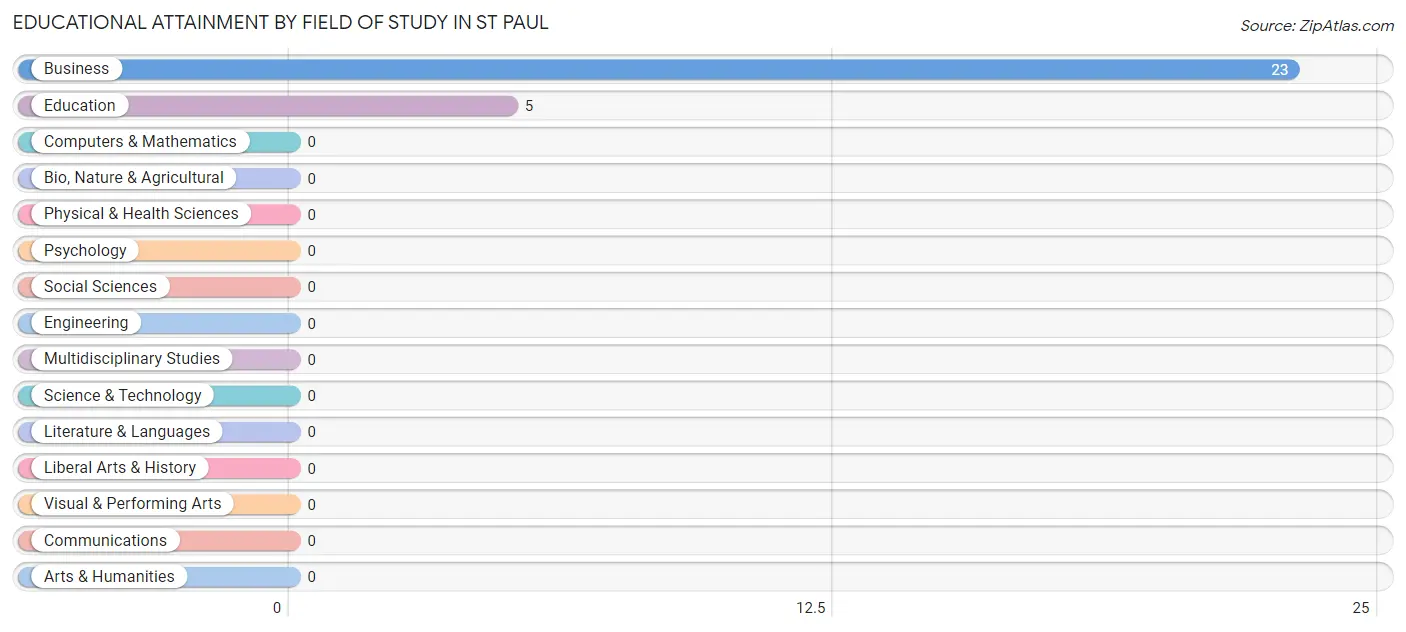
| Field of Study | # Graduates | % Graduates |
| Computers & Mathematics | 0 | 0.0% |
| Bio, Nature & Agricultural | 0 | 0.0% |
| Physical & Health Sciences | 0 | 0.0% |
| Psychology | 0 | 0.0% |
| Social Sciences | 0 | 0.0% |
| Engineering | 0 | 0.0% |
| Multidisciplinary Studies | 0 | 0.0% |
| Science & Technology | 0 | 0.0% |
| Business | 23 | 82.1% |
| Education | 5 | 17.9% |
| Literature & Languages | 0 | 0.0% |
| Liberal Arts & History | 0 | 0.0% |
| Visual & Performing Arts | 0 | 0.0% |
| Communications | 0 | 0.0% |
| Arts & Humanities | 0 | 0.0% |
| Total | 28 | 100.0% |
Transportation & Commute in St Paul
Vehicle Availability by Sex in St Paul
The most prevalent vehicle ownership categories in St Paul are males with 3 vehicles (172, accounting for 56.2%) and females with 3 vehicles (12, making up 242.2%).
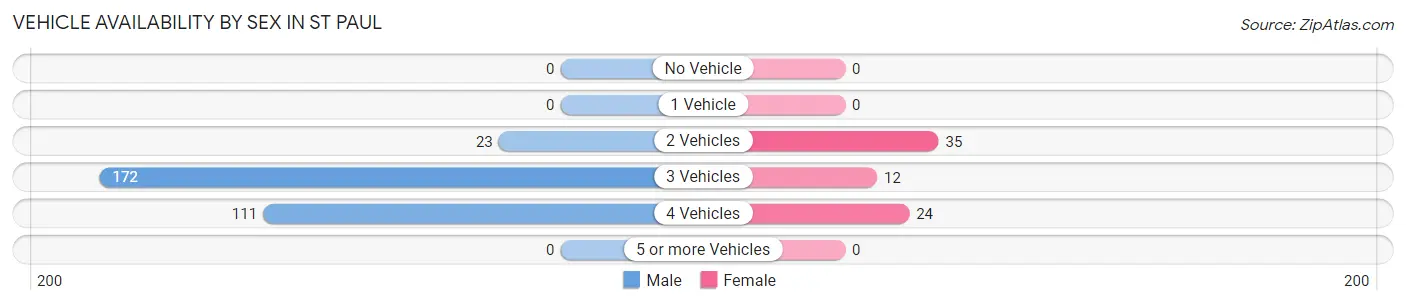
| Vehicles Available | Male | Female |
| No Vehicle | 0 (0.0%) | 0 (0.0%) |
| 1 Vehicle | 0 (0.0%) | 0 (0.0%) |
| 2 Vehicles | 23 (7.5%) | 35 (49.3%) |
| 3 Vehicles | 172 (56.2%) | 12 (16.9%) |
| 4 Vehicles | 111 (36.3%) | 24 (33.8%) |
| 5 or more Vehicles | 0 (0.0%) | 0 (0.0%) |
| Total | 306 (100.0%) | 71 (100.0%) |
Commute Time in St Paul
The most frequently occuring commute durations in St Paul are 30 to 34 minutes (204 commuters, 54.1%), 15 to 19 minutes (73 commuters, 19.4%), and 10 to 14 minutes (41 commuters, 10.9%).
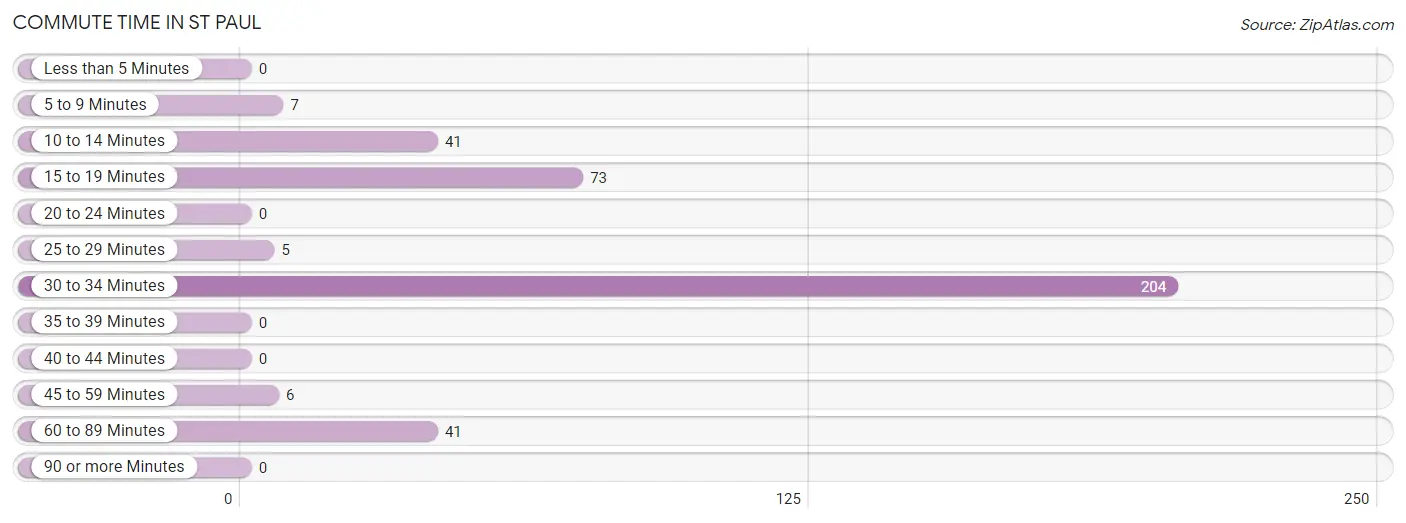
| Commute Time | # Commuters | % Commuters |
| Less than 5 Minutes | 0 | 0.0% |
| 5 to 9 Minutes | 7 | 1.9% |
| 10 to 14 Minutes | 41 | 10.9% |
| 15 to 19 Minutes | 73 | 19.4% |
| 20 to 24 Minutes | 0 | 0.0% |
| 25 to 29 Minutes | 5 | 1.3% |
| 30 to 34 Minutes | 204 | 54.1% |
| 35 to 39 Minutes | 0 | 0.0% |
| 40 to 44 Minutes | 0 | 0.0% |
| 45 to 59 Minutes | 6 | 1.6% |
| 60 to 89 Minutes | 41 | 10.9% |
| 90 or more Minutes | 0 | 0.0% |
Commute Time by Sex in St Paul
The most common commute times in St Paul are 30 to 34 minutes (204 commuters, 66.7%) for males and 10 to 14 minutes (35 commuters, 49.3%) for females.
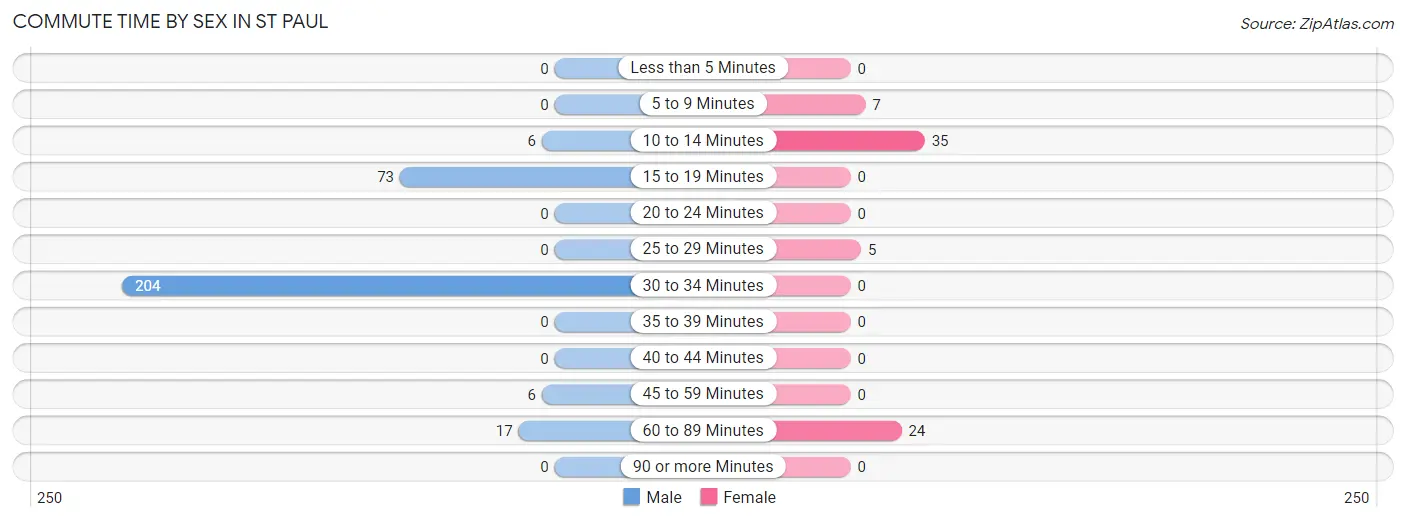
| Commute Time | Male | Female |
| Less than 5 Minutes | 0 (0.0%) | 0 (0.0%) |
| 5 to 9 Minutes | 0 (0.0%) | 7 (9.9%) |
| 10 to 14 Minutes | 6 (2.0%) | 35 (49.3%) |
| 15 to 19 Minutes | 73 (23.9%) | 0 (0.0%) |
| 20 to 24 Minutes | 0 (0.0%) | 0 (0.0%) |
| 25 to 29 Minutes | 0 (0.0%) | 5 (7.0%) |
| 30 to 34 Minutes | 204 (66.7%) | 0 (0.0%) |
| 35 to 39 Minutes | 0 (0.0%) | 0 (0.0%) |
| 40 to 44 Minutes | 0 (0.0%) | 0 (0.0%) |
| 45 to 59 Minutes | 6 (2.0%) | 0 (0.0%) |
| 60 to 89 Minutes | 17 (5.6%) | 24 (33.8%) |
| 90 or more Minutes | 0 (0.0%) | 0 (0.0%) |
Time of Departure to Work by Sex in St Paul
The most frequent times of departure to work in St Paul are 7:00 AM to 7:29 AM (117, 38.2%) for males and 7:00 AM to 7:29 AM (59, 83.1%) for females.
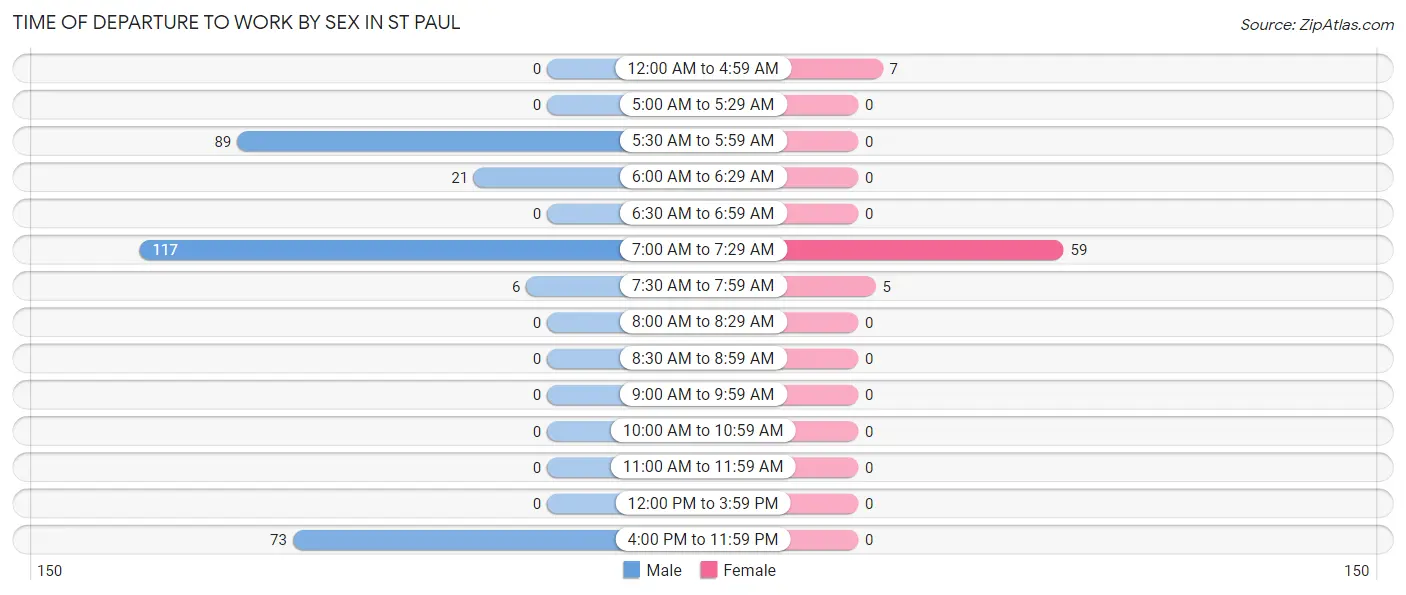
| Time of Departure | Male | Female |
| 12:00 AM to 4:59 AM | 0 (0.0%) | 7 (9.9%) |
| 5:00 AM to 5:29 AM | 0 (0.0%) | 0 (0.0%) |
| 5:30 AM to 5:59 AM | 89 (29.1%) | 0 (0.0%) |
| 6:00 AM to 6:29 AM | 21 (6.9%) | 0 (0.0%) |
| 6:30 AM to 6:59 AM | 0 (0.0%) | 0 (0.0%) |
| 7:00 AM to 7:29 AM | 117 (38.2%) | 59 (83.1%) |
| 7:30 AM to 7:59 AM | 6 (2.0%) | 5 (7.0%) |
| 8:00 AM to 8:29 AM | 0 (0.0%) | 0 (0.0%) |
| 8:30 AM to 8:59 AM | 0 (0.0%) | 0 (0.0%) |
| 9:00 AM to 9:59 AM | 0 (0.0%) | 0 (0.0%) |
| 10:00 AM to 10:59 AM | 0 (0.0%) | 0 (0.0%) |
| 11:00 AM to 11:59 AM | 0 (0.0%) | 0 (0.0%) |
| 12:00 PM to 3:59 PM | 0 (0.0%) | 0 (0.0%) |
| 4:00 PM to 11:59 PM | 73 (23.9%) | 0 (0.0%) |
| Total | 306 (100.0%) | 71 (100.0%) |
Housing Occupancy in St Paul
Occupancy by Ownership in St Paul
Of the total 314 dwellings in St Paul, owner-occupied units account for 294 (93.6%), while renter-occupied units make up 20 (6.4%).
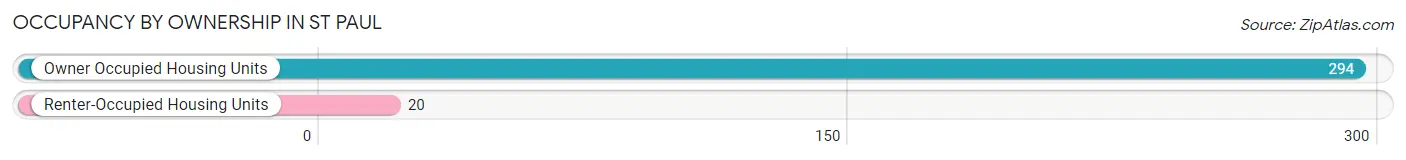
| Occupancy | # Housing Units | % Housing Units |
| Owner Occupied Housing Units | 294 | 93.6% |
| Renter-Occupied Housing Units | 20 | 6.4% |
| Total Occupied Housing Units | 314 | 100.0% |
Occupancy by Household Size in St Paul
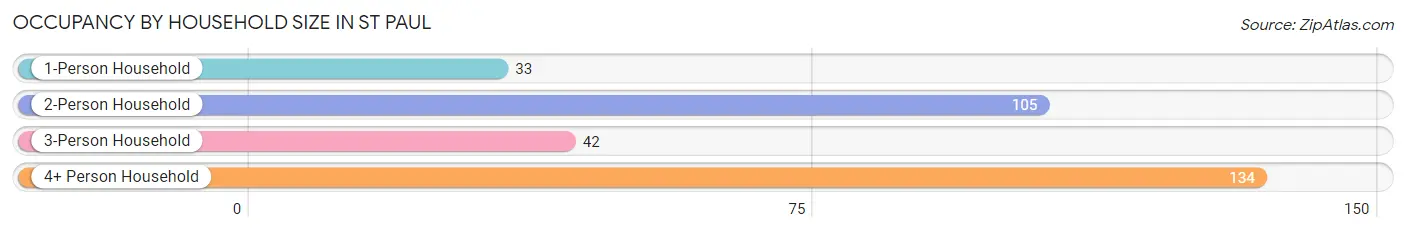
| Household Size | # Housing Units | % Housing Units |
| 1-Person Household | 33 | 10.5% |
| 2-Person Household | 105 | 33.4% |
| 3-Person Household | 42 | 13.4% |
| 4+ Person Household | 134 | 42.7% |
| Total Housing Units | 314 | 100.0% |
Occupancy by Ownership by Household Size in St Paul
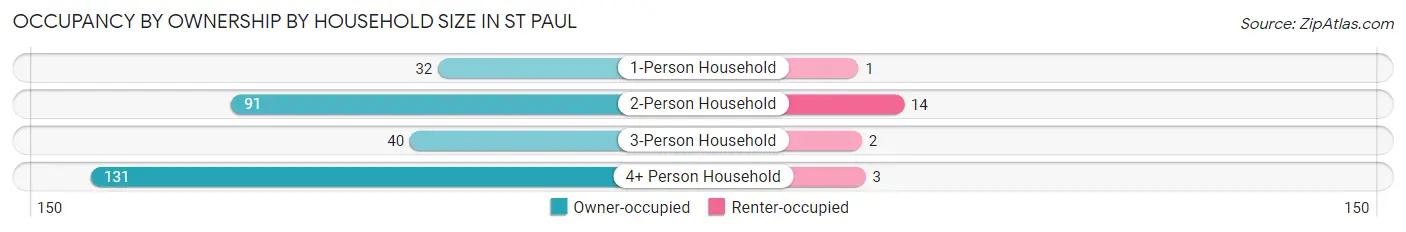
| Household Size | Owner-occupied | Renter-occupied |
| 1-Person Household | 32 (97.0%) | 1 (3.0%) |
| 2-Person Household | 91 (86.7%) | 14 (13.3%) |
| 3-Person Household | 40 (95.2%) | 2 (4.8%) |
| 4+ Person Household | 131 (97.8%) | 3 (2.2%) |
| Total Housing Units | 294 (93.6%) | 20 (6.4%) |
Occupancy by Educational Attainment in St Paul
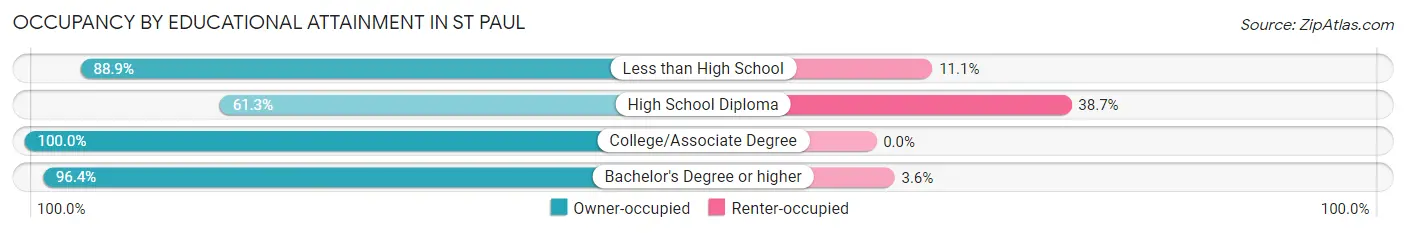
| Household Size | Owner-occupied | Renter-occupied |
| Less than High School | 16 (88.9%) | 2 (11.1%) |
| High School Diploma | 19 (61.3%) | 12 (38.7%) |
| College/Associate Degree | 100 (100.0%) | 0 (0.0%) |
| Bachelor's Degree or higher | 159 (96.4%) | 6 (3.6%) |
Occupancy by Age of Householder in St Paul
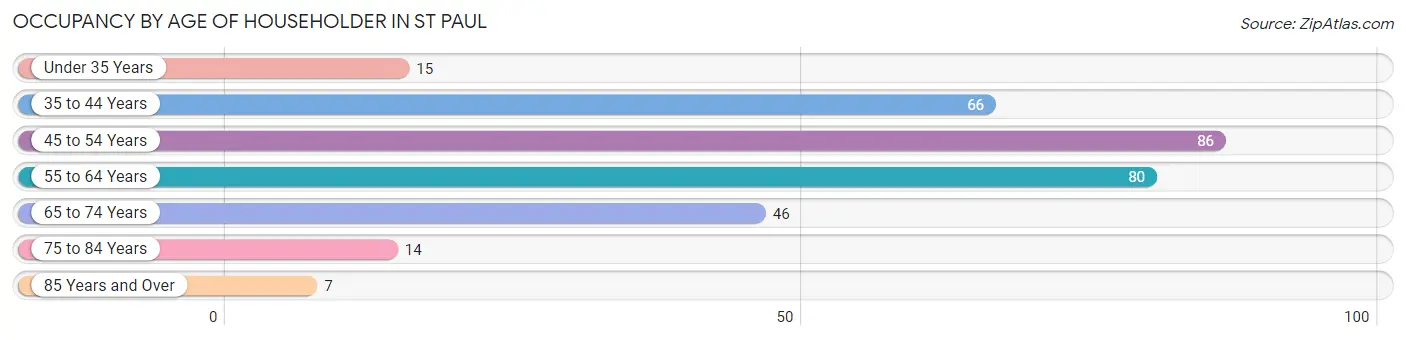
| Age Bracket | # Households | % Households |
| Under 35 Years | 15 | 4.8% |
| 35 to 44 Years | 66 | 21.0% |
| 45 to 54 Years | 86 | 27.4% |
| 55 to 64 Years | 80 | 25.5% |
| 65 to 74 Years | 46 | 14.6% |
| 75 to 84 Years | 14 | 4.5% |
| 85 Years and Over | 7 | 2.2% |
| Total | 314 | 100.0% |
Housing Finances in St Paul
Median Income by Occupancy in St Paul
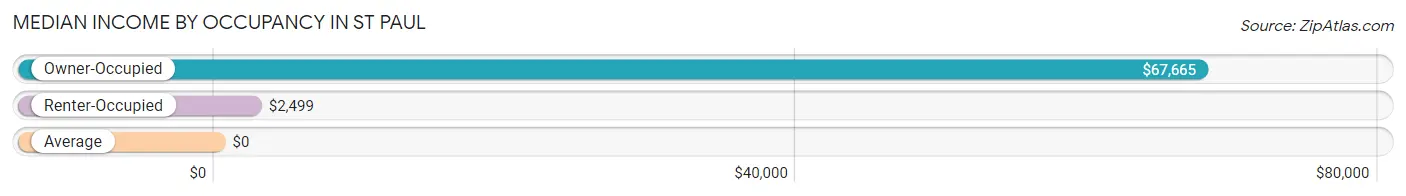
| Occupancy Type | # Households | Median Income |
| Owner-Occupied | 167 (46.9%) | $67,665 |
| Renter-Occupied | 189 (53.1%) | $2,499 |
| Average | 356 (100.0%) | $0 |
Occupancy by Householder Income Bracket in St Paul
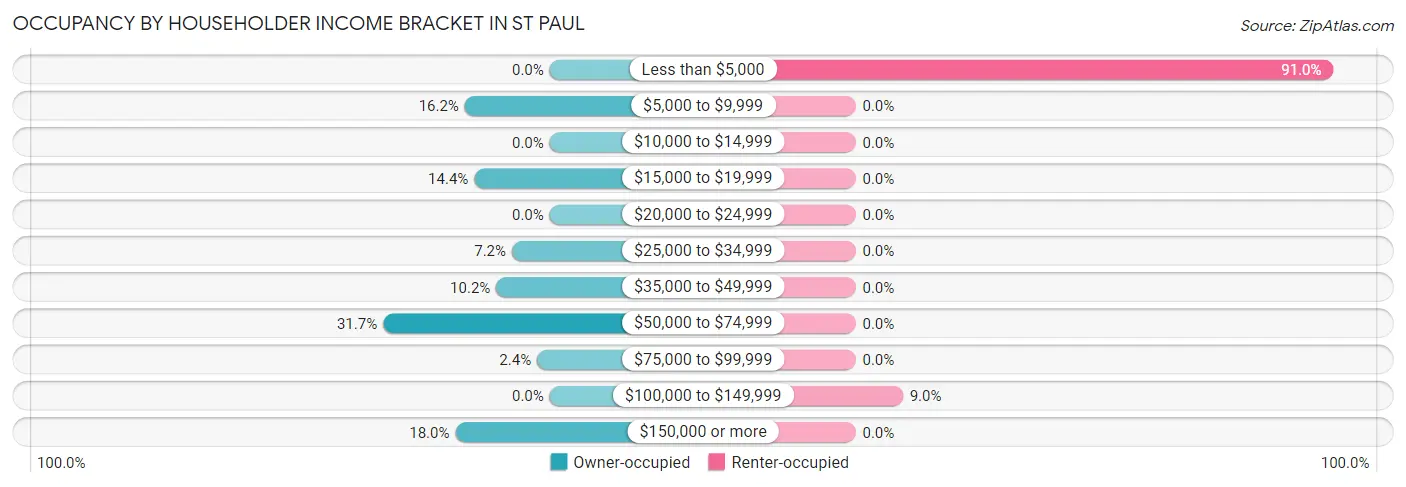
| Income Bracket | Owner-occupied | Renter-occupied |
| Less than $5,000 | 0 (0.0%) | 172 (91.0%) |
| $5,000 to $9,999 | 27 (16.2%) | 0 (0.0%) |
| $10,000 to $14,999 | 0 (0.0%) | 0 (0.0%) |
| $15,000 to $19,999 | 24 (14.4%) | 0 (0.0%) |
| $20,000 to $24,999 | 0 (0.0%) | 0 (0.0%) |
| $25,000 to $34,999 | 12 (7.2%) | 0 (0.0%) |
| $35,000 to $49,999 | 17 (10.2%) | 0 (0.0%) |
| $50,000 to $74,999 | 53 (31.7%) | 0 (0.0%) |
| $75,000 to $99,999 | 4 (2.4%) | 0 (0.0%) |
| $100,000 to $149,999 | 0 (0.0%) | 17 (9.0%) |
| $150,000 or more | 30 (18.0%) | 0 (0.0%) |
| Total | 167 (100.0%) | 189 (100.0%) |
Monthly Housing Cost Tiers in St Paul
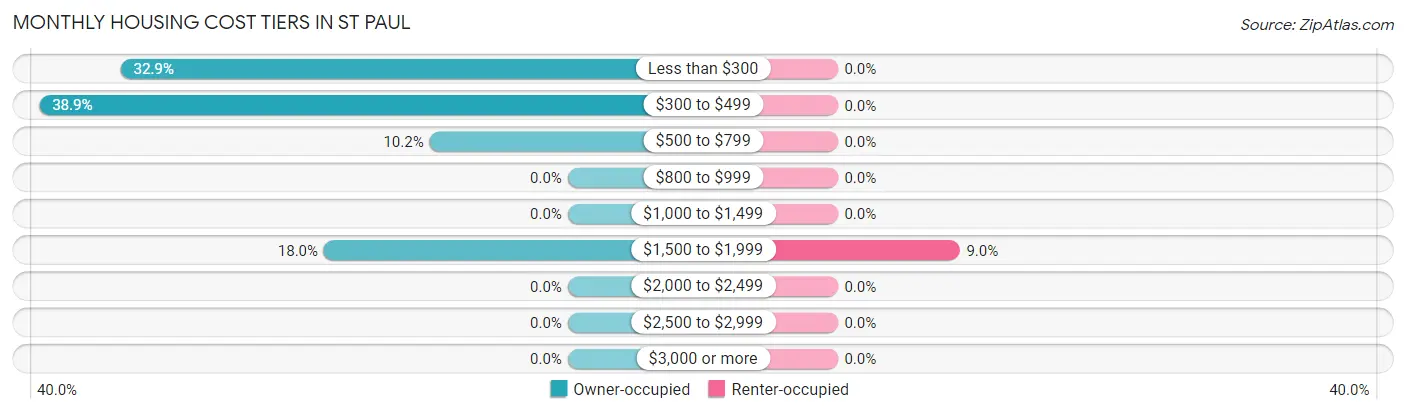
| Monthly Cost | Owner-occupied | Renter-occupied |
| Less than $300 | 55 (32.9%) | 0 (0.0%) |
| $300 to $499 | 65 (38.9%) | 0 (0.0%) |
| $500 to $799 | 17 (10.2%) | 0 (0.0%) |
| $800 to $999 | 0 (0.0%) | 0 (0.0%) |
| $1,000 to $1,499 | 0 (0.0%) | 0 (0.0%) |
| $1,500 to $1,999 | 30 (18.0%) | 17 (9.0%) |
| $2,000 to $2,499 | 0 (0.0%) | 0 (0.0%) |
| $2,500 to $2,999 | 0 (0.0%) | 0 (0.0%) |
| $3,000 or more | 0 (0.0%) | 0 (0.0%) |
| Total | 167 (100.0%) | 189 (100.0%) |
Physical Housing Characteristics in St Paul
Housing Structures in St Paul
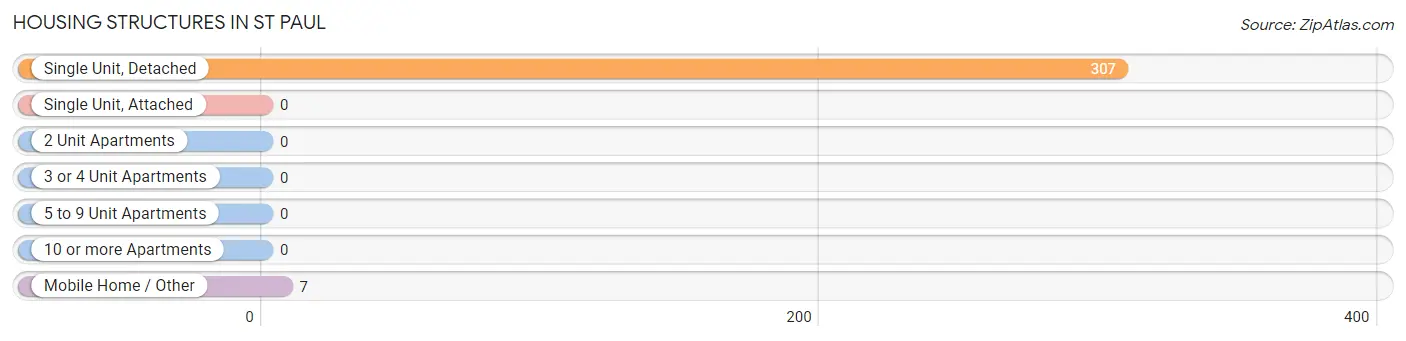
| Structure Type | # Housing Units | % Housing Units |
| Single Unit, Detached | 307 | 97.8% |
| Single Unit, Attached | 0 | 0.0% |
| 2 Unit Apartments | 0 | 0.0% |
| 3 or 4 Unit Apartments | 0 | 0.0% |
| 5 to 9 Unit Apartments | 0 | 0.0% |
| 10 or more Apartments | 0 | 0.0% |
| Mobile Home / Other | 7 | 2.2% |
| Total | 314 | 100.0% |
Housing Structures by Occupancy in St Paul
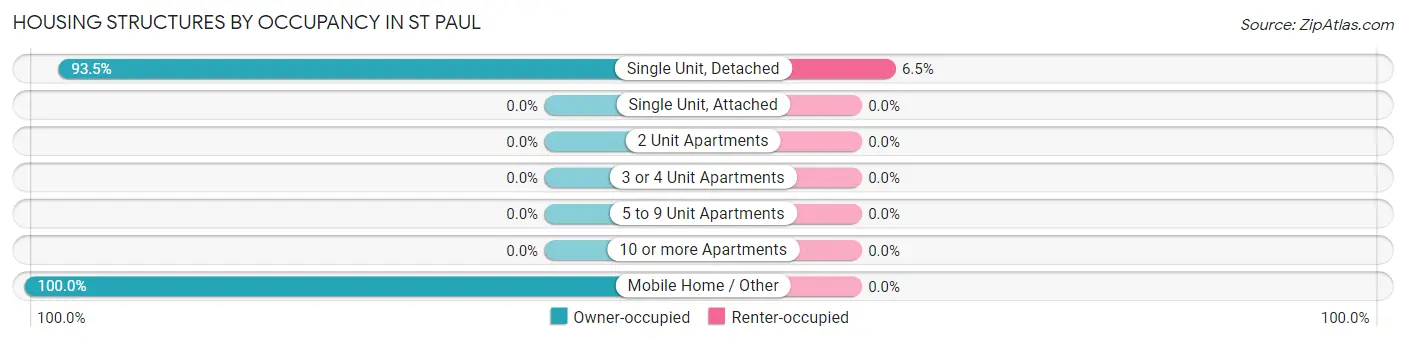
| Structure Type | Owner-occupied | Renter-occupied |
| Single Unit, Detached | 287 (93.5%) | 20 (6.5%) |
| Single Unit, Attached | 0 (0.0%) | 0 (0.0%) |
| 2 Unit Apartments | 0 (0.0%) | 0 (0.0%) |
| 3 or 4 Unit Apartments | 0 (0.0%) | 0 (0.0%) |
| 5 to 9 Unit Apartments | 0 (0.0%) | 0 (0.0%) |
| 10 or more Apartments | 0 (0.0%) | 0 (0.0%) |
| Mobile Home / Other | 7 (100.0%) | 0 (0.0%) |
| Total | 294 (93.6%) | 20 (6.4%) |
Housing Structures by Number of Rooms in St Paul
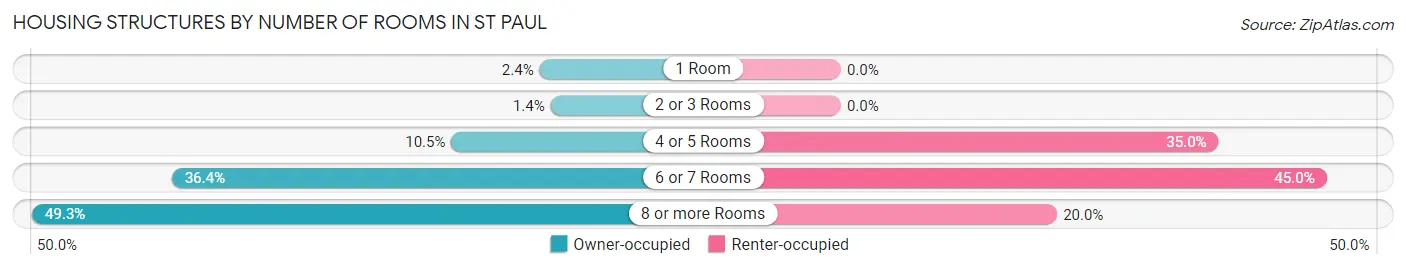
| Number of Rooms | Owner-occupied | Renter-occupied |
| 1 Room | 7 (2.4%) | 0 (0.0%) |
| 2 or 3 Rooms | 4 (1.4%) | 0 (0.0%) |
| 4 or 5 Rooms | 31 (10.5%) | 7 (35.0%) |
| 6 or 7 Rooms | 107 (36.4%) | 9 (45.0%) |
| 8 or more Rooms | 145 (49.3%) | 4 (20.0%) |
| Total | 294 (100.0%) | 20 (100.0%) |
Housing Structure by Heating Type in St Paul
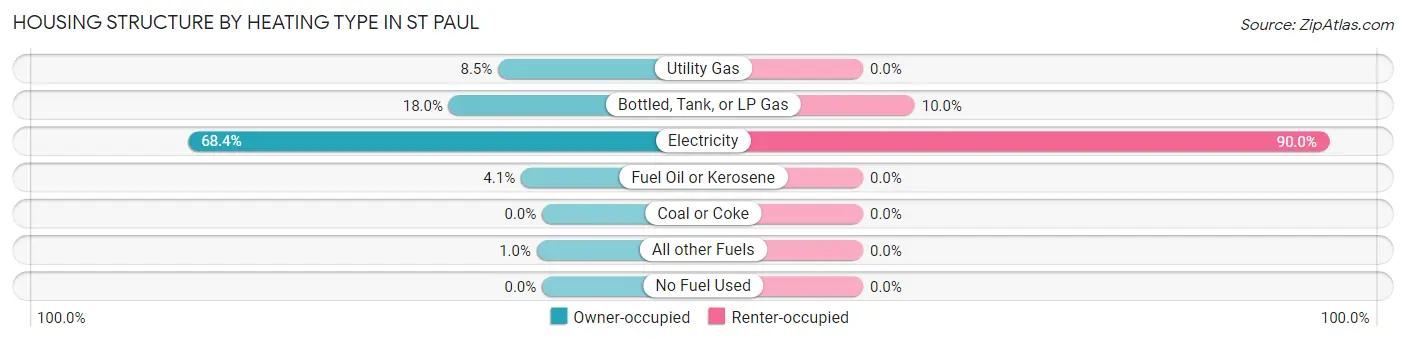
| Heating Type | Owner-occupied | Renter-occupied |
| Utility Gas | 25 (8.5%) | 0 (0.0%) |
| Bottled, Tank, or LP Gas | 53 (18.0%) | 2 (10.0%) |
| Electricity | 201 (68.4%) | 18 (90.0%) |
| Fuel Oil or Kerosene | 12 (4.1%) | 0 (0.0%) |
| Coal or Coke | 0 (0.0%) | 0 (0.0%) |
| All other Fuels | 3 (1.0%) | 0 (0.0%) |
| No Fuel Used | 0 (0.0%) | 0 (0.0%) |
| Total | 294 (100.0%) | 20 (100.0%) |
Household Vehicle Usage in St Paul
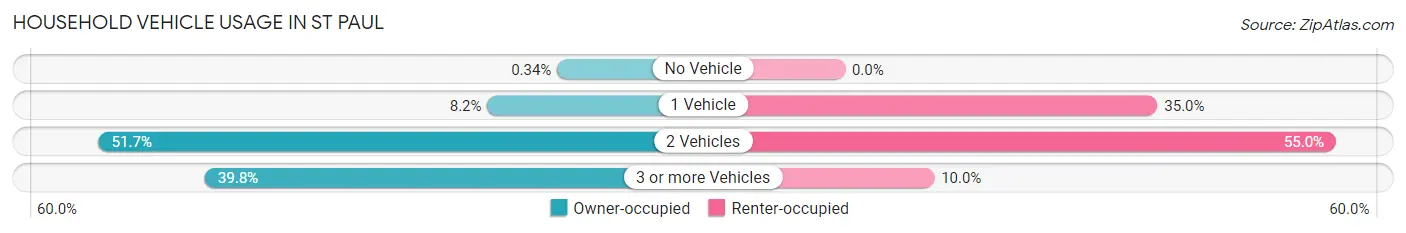
| Vehicles per Household | Owner-occupied | Renter-occupied |
| No Vehicle | 1 (0.3%) | 0 (0.0%) |
| 1 Vehicle | 24 (8.2%) | 7 (35.0%) |
| 2 Vehicles | 152 (51.7%) | 11 (55.0%) |
| 3 or more Vehicles | 117 (39.8%) | 2 (10.0%) |
| Total | 294 (100.0%) | 20 (100.0%) |
Real Estate & Mortgages in St Paul
Real Estate and Mortgage Overview in St Paul
| Characteristic | Without Mortgage | With Mortgage |
| Housing Units | 110 | 30 |
| Median Property Value | $393,300 | $0 |
| Median Household Income | $96,250 | $30 |
| Monthly Housing Costs | $1,130 | $0 |
| Real Estate Taxes | $6,635 | $0 |
Property Value by Mortgage Status in St Paul
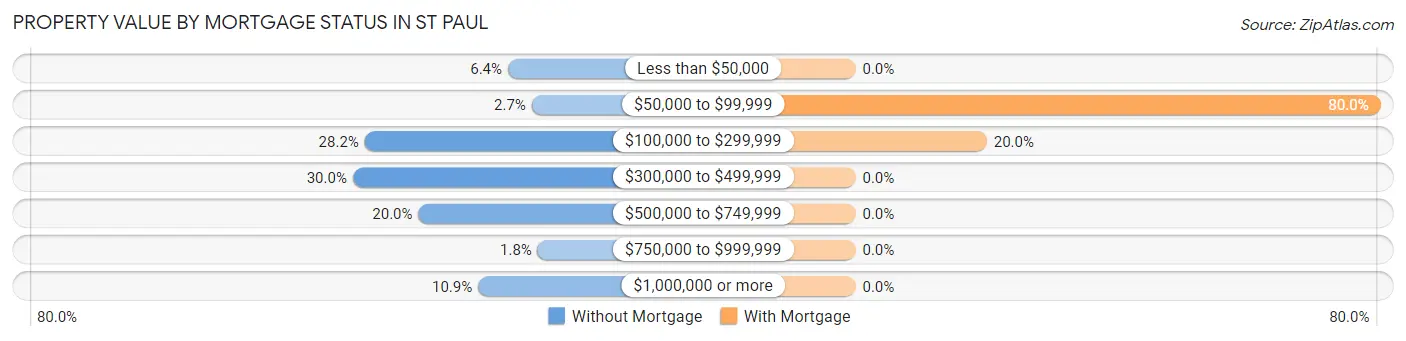
| Property Value | Without Mortgage | With Mortgage |
| Less than $50,000 | 7 (6.4%) | 0 (0.0%) |
| $50,000 to $99,999 | 3 (2.7%) | 24 (80.0%) |
| $100,000 to $299,999 | 31 (28.2%) | 6 (20.0%) |
| $300,000 to $499,999 | 33 (30.0%) | 0 (0.0%) |
| $500,000 to $749,999 | 22 (20.0%) | 0 (0.0%) |
| $750,000 to $999,999 | 2 (1.8%) | 0 (0.0%) |
| $1,000,000 or more | 12 (10.9%) | 0 (0.0%) |
| Total | 110 (100.0%) | 30 (100.0%) |
Household Income by Mortgage Status in St Paul
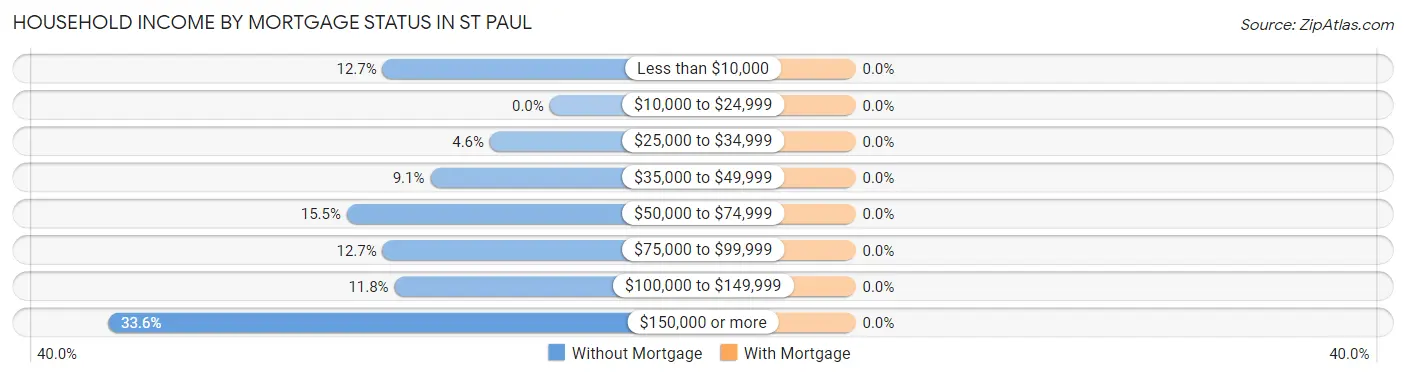
| Household Income | Without Mortgage | With Mortgage |
| Less than $10,000 | 14 (12.7%) | 0 (0.0%) |
| $10,000 to $24,999 | 0 (0.0%) | 0 (0.0%) |
| $25,000 to $34,999 | 5 (4.5%) | 0 (0.0%) |
| $35,000 to $49,999 | 10 (9.1%) | 0 (0.0%) |
| $50,000 to $74,999 | 17 (15.4%) | 0 (0.0%) |
| $75,000 to $99,999 | 14 (12.7%) | 0 (0.0%) |
| $100,000 to $149,999 | 13 (11.8%) | 0 (0.0%) |
| $150,000 or more | 37 (33.6%) | 0 (0.0%) |
| Total | 110 (100.0%) | 30 (100.0%) |
Property Value to Household Income Ratio in St Paul
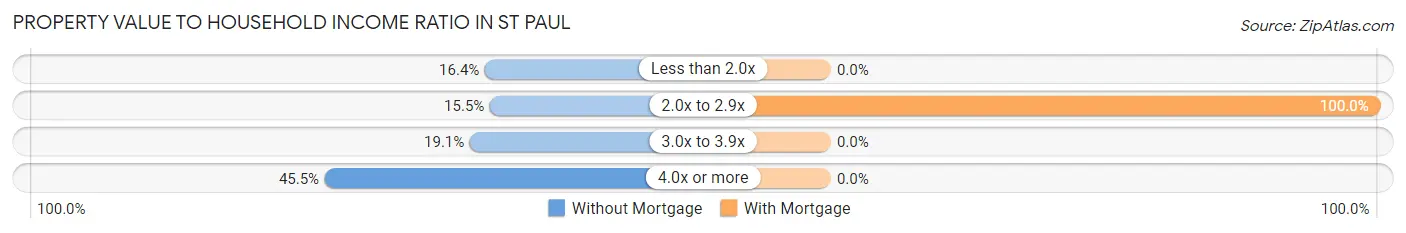
| Value-to-Income Ratio | Without Mortgage | With Mortgage |
| Less than 2.0x | 18 (16.4%) | 0 (0.0%) |
| 2.0x to 2.9x | 17 (15.4%) | 30 (100.0%) |
| 3.0x to 3.9x | 21 (19.1%) | 0 (0.0%) |
| 4.0x or more | 50 (45.5%) | 0 (0.0%) |
| Total | 110 (100.0%) | 30 (100.0%) |
Real Estate Taxes by Mortgage Status in St Paul
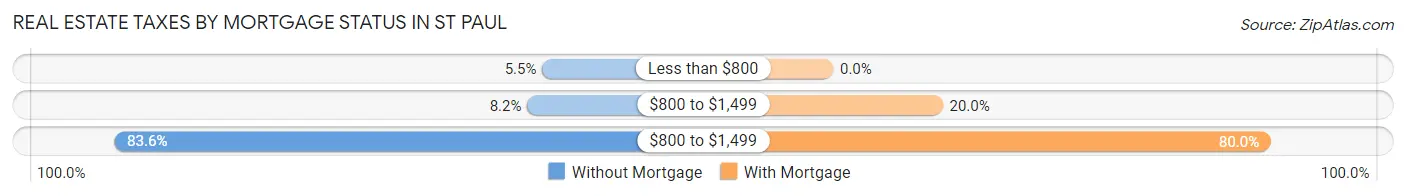
| Property Taxes | Without Mortgage | With Mortgage |
| Less than $800 | 6 (5.4%) | 0 (0.0%) |
| $800 to $1,499 | 9 (8.2%) | 6 (20.0%) |
| $800 to $1,499 | 92 (83.6%) | 24 (80.0%) |
| Total | 110 (100.0%) | 30 (100.0%) |
Health & Disability in St Paul
Health Insurance Coverage by Age in St Paul
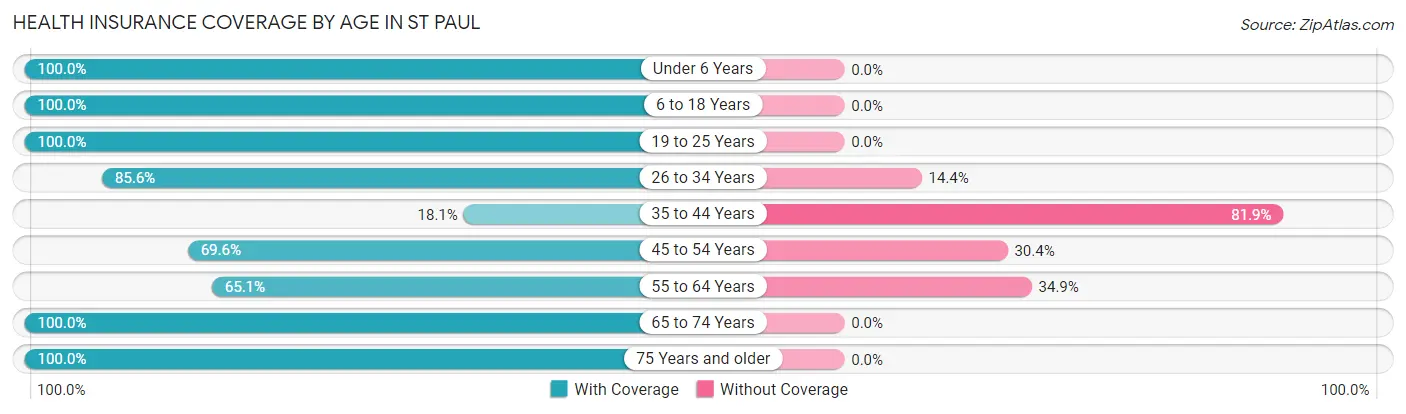
| Age Bracket | With Coverage | Without Coverage |
| Under 6 Years | 89 (100.0%) | 0 (0.0%) |
| 6 to 18 Years | 196 (100.0%) | 0 (0.0%) |
| 19 to 25 Years | 7 (100.0%) | 0 (0.0%) |
| 26 to 34 Years | 184 (85.6%) | 31 (14.4%) |
| 35 to 44 Years | 35 (18.1%) | 158 (81.9%) |
| 45 to 54 Years | 32 (69.6%) | 14 (30.4%) |
| 55 to 64 Years | 149 (65.1%) | 80 (34.9%) |
| 65 to 74 Years | 88 (100.0%) | 0 (0.0%) |
| 75 Years and older | 39 (100.0%) | 0 (0.0%) |
| Total | 819 (74.3%) | 283 (25.7%) |
Health Insurance Coverage by Citizenship Status in St Paul
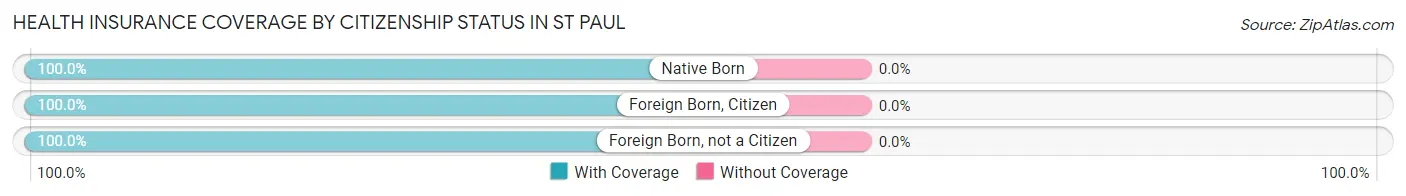
| Citizenship Status | With Coverage | Without Coverage |
| Native Born | 89 (100.0%) | 0 (0.0%) |
| Foreign Born, Citizen | 196 (100.0%) | 0 (0.0%) |
| Foreign Born, not a Citizen | 7 (100.0%) | 0 (0.0%) |
Health Insurance Coverage by Household Income in St Paul
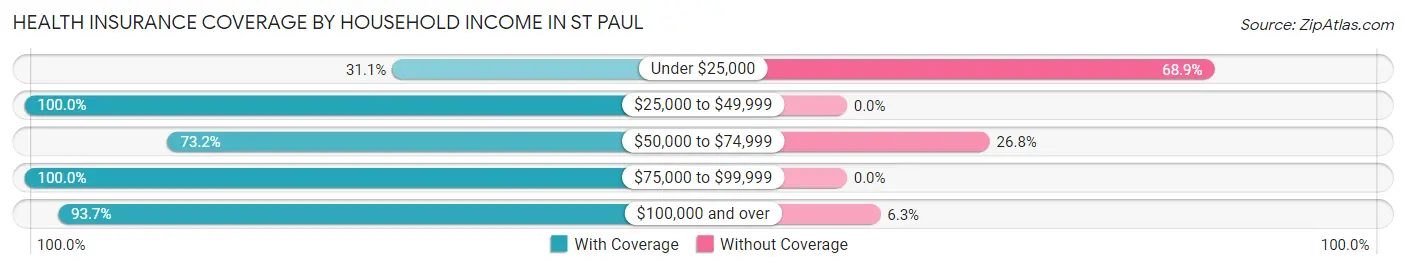
| Household Income | With Coverage | Without Coverage |
| Under $25,000 | 90 (31.1%) | 199 (68.9%) |
| $25,000 to $49,999 | 112 (100.0%) | 0 (0.0%) |
| $50,000 to $74,999 | 145 (73.2%) | 53 (26.8%) |
| $75,000 to $99,999 | 10 (100.0%) | 0 (0.0%) |
| $100,000 and over | 462 (93.7%) | 31 (6.3%) |
Public vs Private Health Insurance Coverage by Age in St Paul
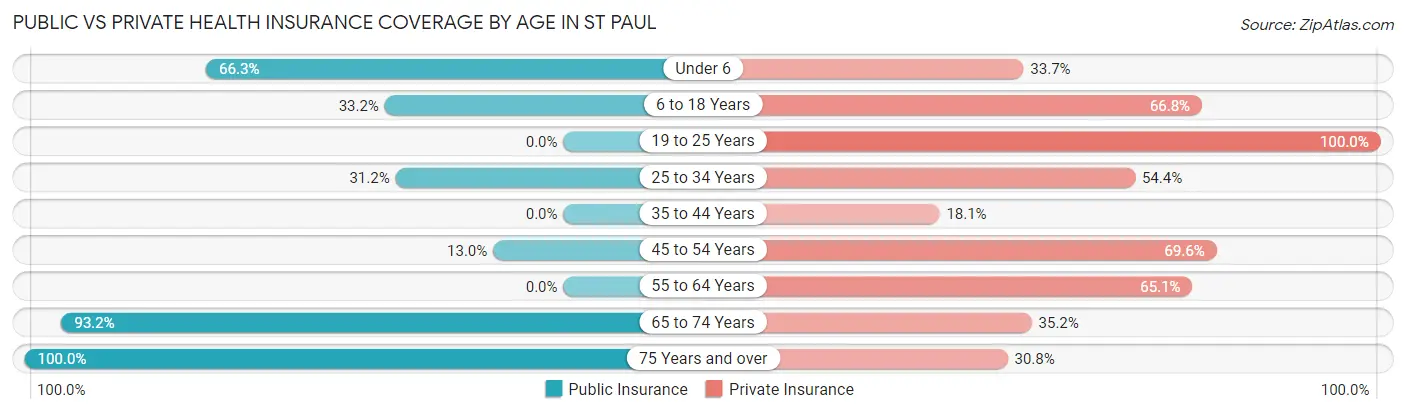
| Age Bracket | Public Insurance | Private Insurance |
| Under 6 | 59 (66.3%) | 30 (33.7%) |
| 6 to 18 Years | 65 (33.2%) | 131 (66.8%) |
| 19 to 25 Years | 0 (0.0%) | 7 (100.0%) |
| 25 to 34 Years | 67 (31.2%) | 117 (54.4%) |
| 35 to 44 Years | 0 (0.0%) | 35 (18.1%) |
| 45 to 54 Years | 6 (13.0%) | 32 (69.6%) |
| 55 to 64 Years | 0 (0.0%) | 149 (65.1%) |
| 65 to 74 Years | 82 (93.2%) | 31 (35.2%) |
| 75 Years and over | 39 (100.0%) | 12 (30.8%) |
| Total | 318 (28.9%) | 544 (49.4%) |
Disability Status by Sex by Age in St Paul
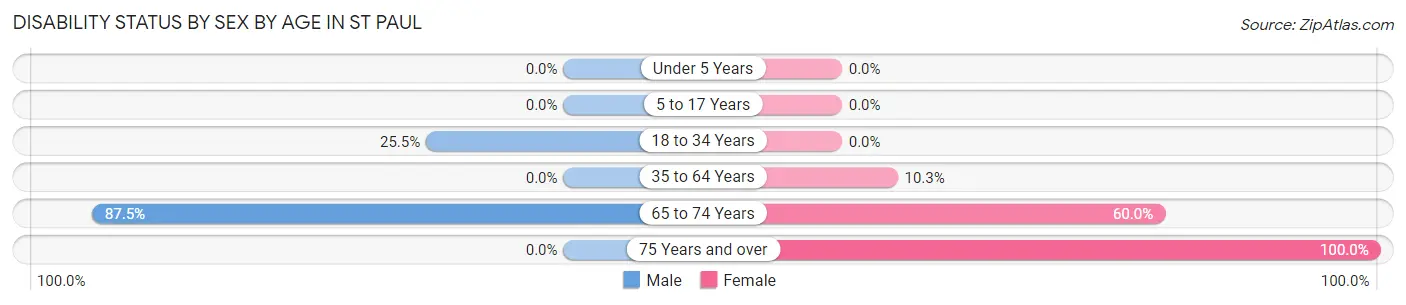
| Age Bracket | Male | Female |
| Under 5 Years | 0 (0.0%) | 0 (0.0%) |
| 5 to 17 Years | 0 (0.0%) | 0 (0.0%) |
| 18 to 34 Years | 39 (25.5%) | 0 (0.0%) |
| 35 to 64 Years | 0 (0.0%) | 27 (10.3%) |
| 65 to 74 Years | 42 (87.5%) | 24 (60.0%) |
| 75 Years and over | 0 (0.0%) | 39 (100.0%) |
Disability Class by Sex by Age in St Paul
Disability Class: Hearing Difficulty
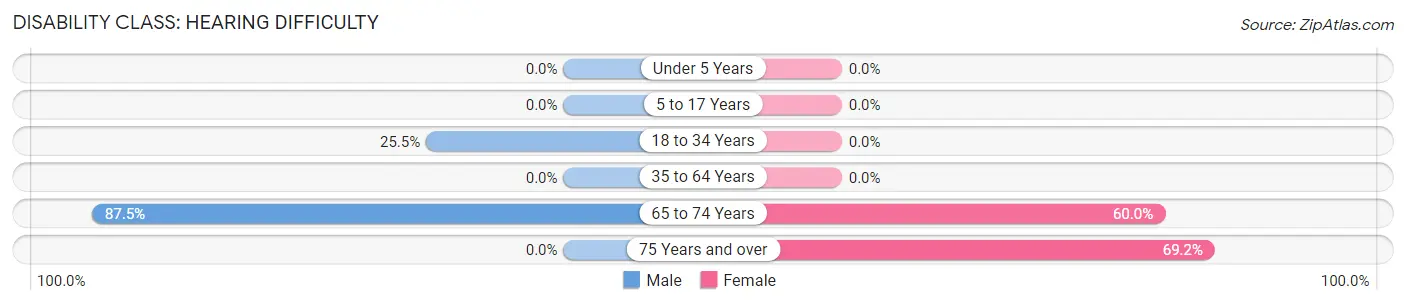
| Age Bracket | Male | Female |
| Under 5 Years | 0 (0.0%) | 0 (0.0%) |
| 5 to 17 Years | 0 (0.0%) | 0 (0.0%) |
| 18 to 34 Years | 39 (25.5%) | 0 (0.0%) |
| 35 to 64 Years | 0 (0.0%) | 0 (0.0%) |
| 65 to 74 Years | 42 (87.5%) | 24 (60.0%) |
| 75 Years and over | 0 (0.0%) | 27 (69.2%) |
Disability Class: Vision Difficulty
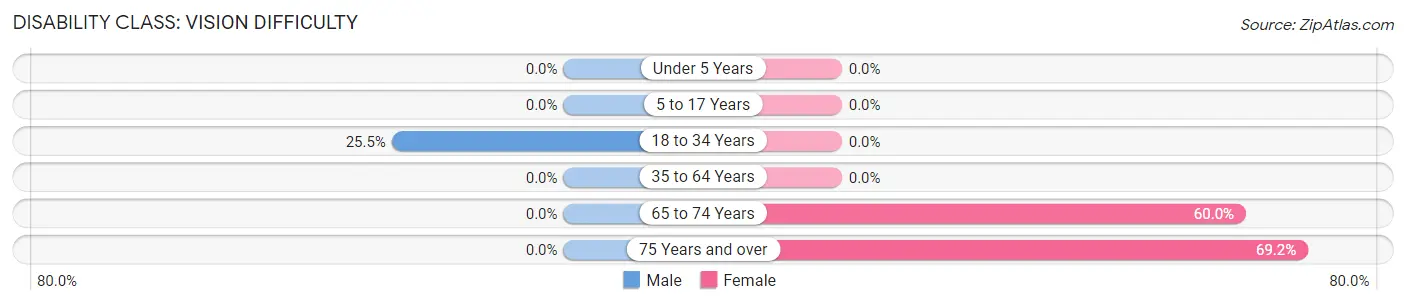
| Age Bracket | Male | Female |
| Under 5 Years | 0 (0.0%) | 0 (0.0%) |
| 5 to 17 Years | 0 (0.0%) | 0 (0.0%) |
| 18 to 34 Years | 39 (25.5%) | 0 (0.0%) |
| 35 to 64 Years | 0 (0.0%) | 0 (0.0%) |
| 65 to 74 Years | 0 (0.0%) | 24 (60.0%) |
| 75 Years and over | 0 (0.0%) | 27 (69.2%) |
Disability Class: Cognitive Difficulty
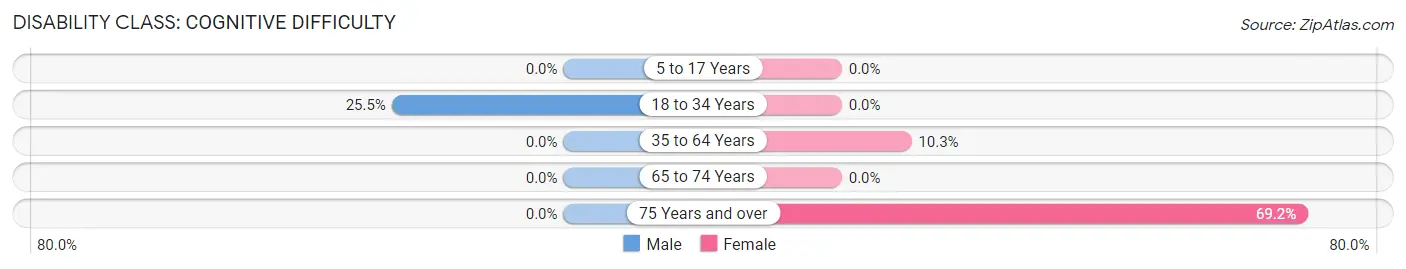
| Age Bracket | Male | Female |
| 5 to 17 Years | 0 (0.0%) | 0 (0.0%) |
| 18 to 34 Years | 39 (25.5%) | 0 (0.0%) |
| 35 to 64 Years | 0 (0.0%) | 27 (10.3%) |
| 65 to 74 Years | 0 (0.0%) | 0 (0.0%) |
| 75 Years and over | 0 (0.0%) | 27 (69.2%) |
Disability Class: Ambulatory Difficulty
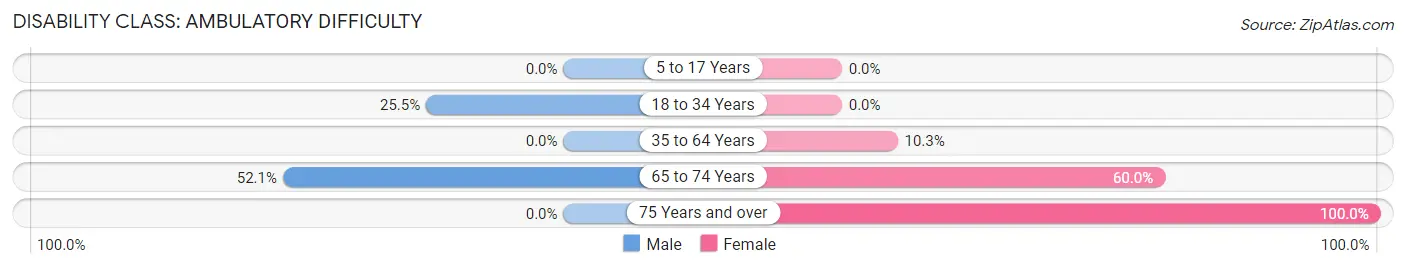
| Age Bracket | Male | Female |
| 5 to 17 Years | 0 (0.0%) | 0 (0.0%) |
| 18 to 34 Years | 39 (25.5%) | 0 (0.0%) |
| 35 to 64 Years | 0 (0.0%) | 27 (10.3%) |
| 65 to 74 Years | 25 (52.1%) | 24 (60.0%) |
| 75 Years and over | 0 (0.0%) | 39 (100.0%) |
Disability Class: Self-Care Difficulty
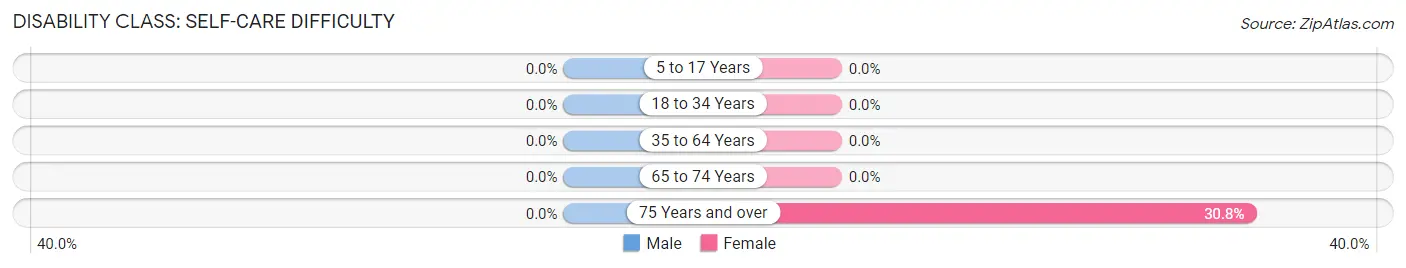
| Age Bracket | Male | Female |
| 5 to 17 Years | 0 (0.0%) | 0 (0.0%) |
| 18 to 34 Years | 0 (0.0%) | 0 (0.0%) |
| 35 to 64 Years | 0 (0.0%) | 0 (0.0%) |
| 65 to 74 Years | 0 (0.0%) | 0 (0.0%) |
| 75 Years and over | 0 (0.0%) | 12 (30.8%) |
Technology Access in St Paul
Computing Device Access in St Paul
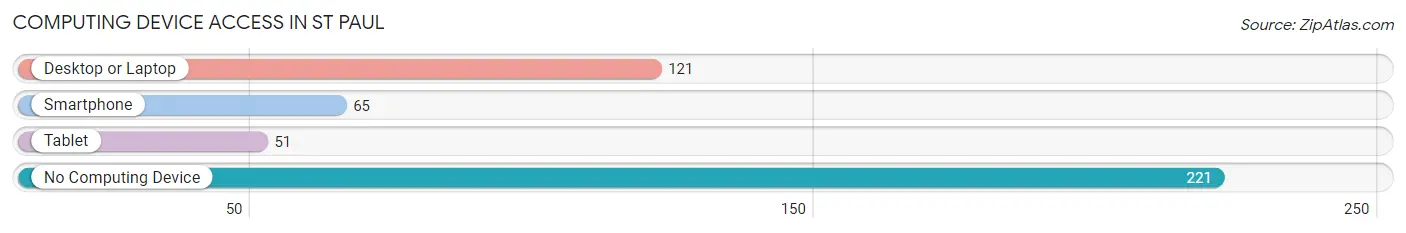
| Device Type | # Households | % Households |
| Desktop or Laptop | 121 | 34.0% |
| Smartphone | 65 | 18.3% |
| Tablet | 51 | 14.3% |
| No Computing Device | 221 | 62.1% |
| Total | 356 | 100.0% |
Internet Access in St Paul
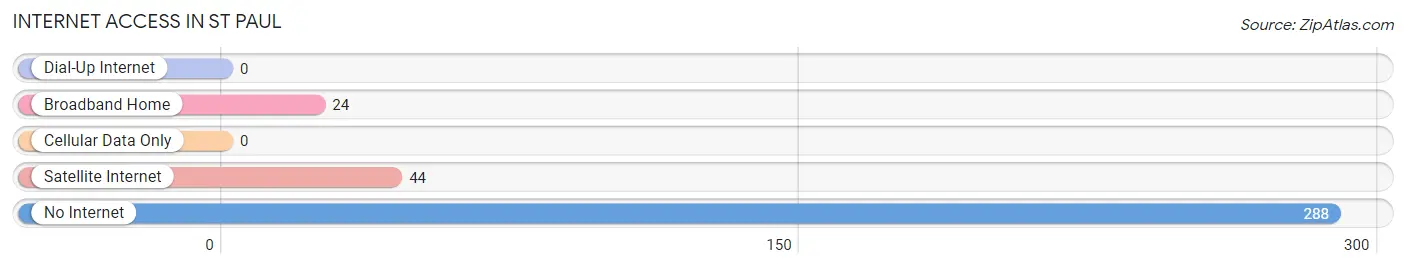
| Internet Type | # Households | % Households |
| Dial-Up Internet | 0 | 0.0% |
| Broadband Home | 24 | 6.7% |
| Cellular Data Only | 0 | 0.0% |
| Satellite Internet | 44 | 12.4% |
| No Internet | 288 | 80.9% |
| Total | 356 | 100.0% |
St Paul Summary
St. Paul is a small town located in the state of Texas, in the United States. It is situated in the county of Fannin, and is part of the Bonham Micropolitan Statistical Area. The town has a population of just over 500 people, and is located in the northeast corner of the state, near the Oklahoma border.
History
St. Paul was founded in 1873 by a group of settlers from the nearby town of Bonham. The town was named after the nearby St. Paul's Church, which was built in 1871. The town was originally a farming community, and the main crops grown were cotton, corn, and wheat. The town also had a small sawmill, which provided lumber for the local area.
In the early 1900s, St. Paul began to grow and develop. The town was incorporated in 1909, and the first mayor was elected in 1910. The town also had a post office, a bank, and a school. In the 1920s, the town began to experience a population boom, and the population grew to over 500 people.
Geography
St. Paul is located in the northeast corner of Texas, near the Oklahoma border. The town is situated in Fannin County, and is part of the Bonham Micropolitan Statistical Area. The town is located at the intersection of State Highway 78 and County Road 4. The town is surrounded by rolling hills and farmland, and is located about 25 miles from the nearest major city, Sherman.
The climate in St. Paul is generally mild, with hot summers and cold winters. The average temperature in the summer is around 90 degrees Fahrenheit, and the average temperature in the winter is around 40 degrees Fahrenheit. The town receives an average of 40 inches of rain per year.
Economy
The economy of St. Paul is largely based on agriculture. The town is surrounded by farmland, and the main crops grown are cotton, corn, and wheat. The town also has a small sawmill, which provides lumber for the local area.
In addition to agriculture, St. Paul also has a few small businesses. These include a grocery store, a hardware store, and a few restaurants. The town also has a post office, a bank, and a school.
Demographics
As of the 2010 census, the population of St. Paul was 514 people. The racial makeup of the town was 97.3% White, 0.6% African American, 0.2% Native American, 0.2% Asian, 0.4% from other races, and 1.3% from two or more races. The median household income was $37,500, and the median family income was $41,250.
St. Paul is a small, rural town with a close-knit community. The town is home to a variety of churches, and the town also has a volunteer fire department. The town is also home to a few small businesses, and the town is served by the Fannin County School District.
Common Questions
What is Per Capita Income in St Paul?
Per Capita income in St Paul is $15,815.
What is the Median Family Income in St Paul?
Median Family Income in St Paul is $68,066.
What is Income or Wage Gap in St Paul?
Income or Wage Gap in St Paul is 38.9%.
Women in St Paul earn 61.1 cents for every dollar earned by a man.
What is Inequality or Gini Index in St Paul?
Inequality or Gini Index in St Paul is 0.71.
What is the Total Population of St Paul?
Total Population of St Paul is 1,102.
What is the Total Male Population of St Paul?
Total Male Population of St Paul is 612.
What is the Total Female Population of St Paul?
Total Female Population of St Paul is 490.
What is the Ratio of Males per 100 Females in St Paul?
There are 124.90 Males per 100 Females in St Paul.
What is the Ratio of Females per 100 Males in St Paul?
There are 80.07 Females per 100 Males in St Paul.
What is the Median Population Age in St Paul?
Median Population Age in St Paul is 35.3 Years.
What is the Average Family Size in St Paul
Average Family Size in St Paul is 5.0 People.
What is the Average Household Size in St Paul
Average Household Size in St Paul is 3.1 People.
How Large is the Labor Force in St Paul?
There are 394 People in the Labor Forcein in St Paul.
What is the Percentage of People in the Labor Force in St Paul?
47.0% of People are in the Labor Force in St Paul.