Livingston, TX Map & Demographics
Livingston Map
Livingston Overview
$25,277
PER CAPITA INCOME
$50,697
AVG FAMILY INCOME
$47,952
AVG HOUSEHOLD INCOME
56.0%
WAGE / INCOME GAP [ % ]
44.0¢/ $1
WAGE / INCOME GAP [ $ ]
0.44
INEQUALITY / GINI INDEX
5,672
TOTAL POPULATION
2,787
MALE POPULATION
2,885
FEMALE POPULATION
96.60
MALES / 100 FEMALES
103.52
FEMALES / 100 MALES
36.9
MEDIAN AGE
3.0
AVG FAMILY SIZE
2.3
AVG HOUSEHOLD SIZE
2,744
LABOR FORCE [ PEOPLE ]
61.3%
PERCENT IN LABOR FORCE
6.5%
UNEMPLOYMENT RATE
Livingston Zip Codes
Livingston Area Codes
Income in Livingston
Income Overview in Livingston
Per Capita Income in Livingston is $25,277, while median incomes of families and households are $50,697 and $47,952 respectively.
| Characteristic | Number | Measure |
| Per Capita Income | 5,672 | $25,277 |
| Median Family Income | 1,448 | $50,697 |
| Mean Family Income | 1,448 | $64,363 |
| Median Household Income | 2,340 | $47,952 |
| Mean Household Income | 2,340 | $59,337 |
| Income Deficit | 1,448 | $0 |
| Wage / Income Gap (%) | 5,672 | 56.02% |
| Wage / Income Gap ($) | 5,672 | 43.98¢ per $1 |
| Gini / Inequality Index | 5,672 | 0.44 |
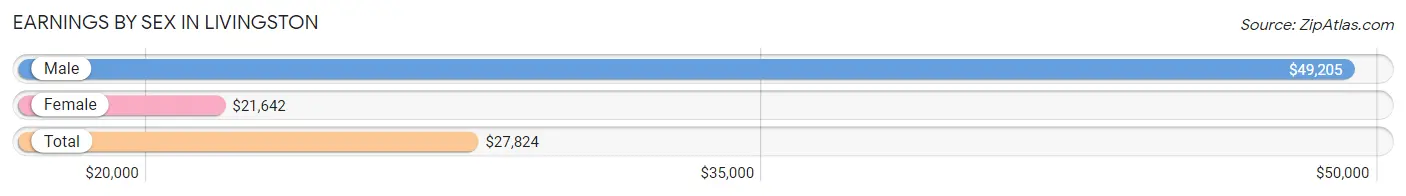
Earnings by Sex in Livingston
Average Earnings in Livingston are $27,824, $49,205 for men and $21,642 for women, a difference of 56.0%.
| Sex | Number | Average Earnings |
| Male | 1,478 (52.2%) | $49,205 |
| Female | 1,353 (47.8%) | $21,642 |
| Total | 2,831 (100.0%) | $27,824 |
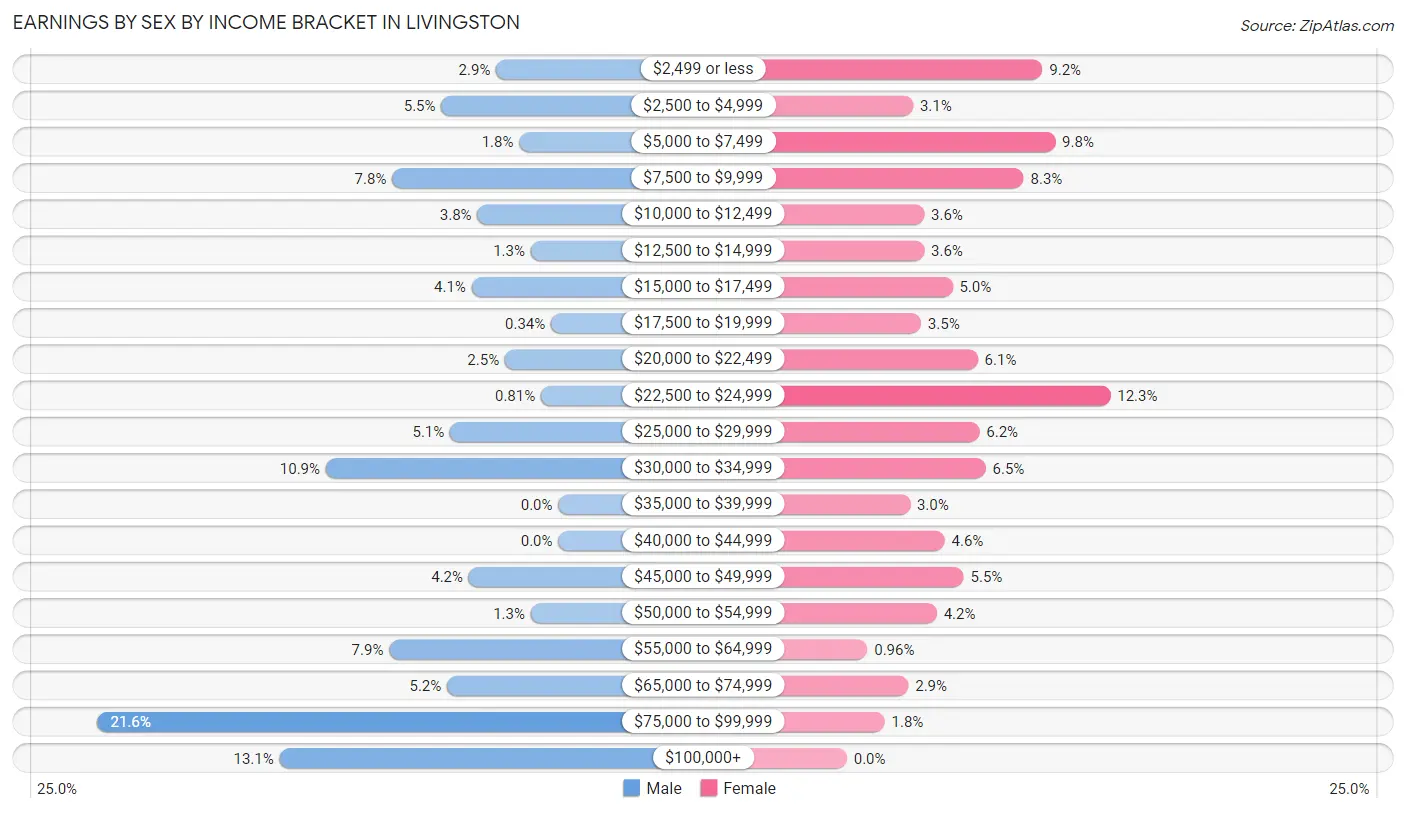
Earnings by Sex by Income Bracket in Livingston
The most common earnings brackets in Livingston are $75,000 to $99,999 for men (319 | 21.6%) and $22,500 to $24,999 for women (167 | 12.3%).
| Income | Male | Female |
| $2,499 or less | 43 (2.9%) | 124 (9.2%) |
| $2,500 to $4,999 | 81 (5.5%) | 42 (3.1%) |
| $5,000 to $7,499 | 27 (1.8%) | 132 (9.8%) |
| $7,500 to $9,999 | 115 (7.8%) | 112 (8.3%) |
| $10,000 to $12,499 | 56 (3.8%) | 49 (3.6%) |
| $12,500 to $14,999 | 19 (1.3%) | 49 (3.6%) |
| $15,000 to $17,499 | 60 (4.1%) | 67 (5.0%) |
| $17,500 to $19,999 | 5 (0.3%) | 47 (3.5%) |
| $20,000 to $22,499 | 37 (2.5%) | 83 (6.1%) |
| $22,500 to $24,999 | 12 (0.8%) | 167 (12.3%) |
| $25,000 to $29,999 | 75 (5.1%) | 84 (6.2%) |
| $30,000 to $34,999 | 161 (10.9%) | 88 (6.5%) |
| $35,000 to $39,999 | 0 (0.0%) | 40 (3.0%) |
| $40,000 to $44,999 | 0 (0.0%) | 62 (4.6%) |
| $45,000 to $49,999 | 62 (4.2%) | 74 (5.5%) |
| $50,000 to $54,999 | 19 (1.3%) | 57 (4.2%) |
| $55,000 to $64,999 | 117 (7.9%) | 13 (1.0%) |
| $65,000 to $74,999 | 77 (5.2%) | 39 (2.9%) |
| $75,000 to $99,999 | 319 (21.6%) | 24 (1.8%) |
| $100,000+ | 193 (13.1%) | 0 (0.0%) |
| Total | 1,478 (100.0%) | 1,353 (100.0%) |
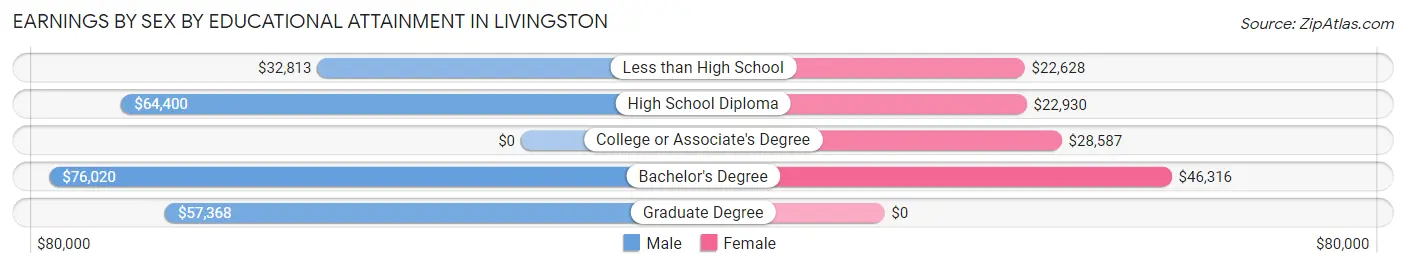
Earnings by Sex by Educational Attainment in Livingston
Average earnings in Livingston are $58,723 for men and $23,720 for women, a difference of 59.6%. Men with an educational attainment of bachelor's degree enjoy the highest average annual earnings of $76,020, while those with less than high school education earn the least with $32,813. Women with an educational attainment of bachelor's degree earn the most with the average annual earnings of $46,316, while those with less than high school education have the smallest earnings of $22,628.
| Educational Attainment | Male Income | Female Income |
| Less than High School | $32,813 | $22,628 |
| High School Diploma | $64,400 | $22,930 |
| College or Associate's Degree | - | - |
| Bachelor's Degree | $76,020 | $46,316 |
| Graduate Degree | $57,368 | $0 |
| Total | $58,723 | $23,720 |
Family Income in Livingston
Family Income Brackets in Livingston
According to the Livingston family income data, there are 266 families falling into the $50,000 to $74,999 income range, which is the most common income bracket and makes up 18.4% of all families. Conversely, the $10,000 to $14,999 income bracket is the least frequent group with only 26 families (1.8%) belonging to this category.
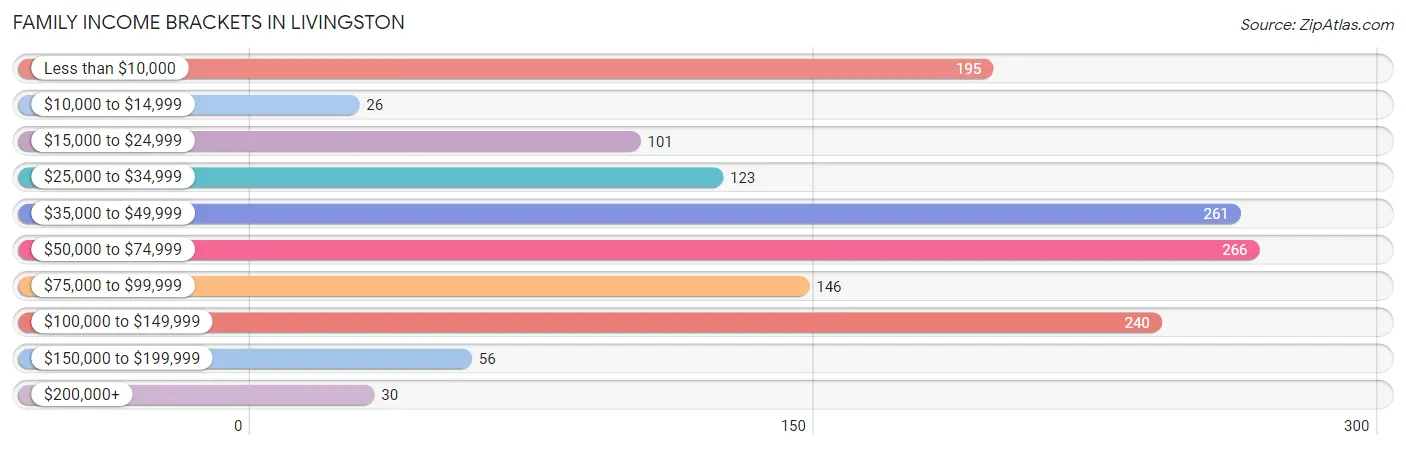
| Income Bracket | # Families | % Families |
| Less than $10,000 | 195 | 13.5% |
| $10,000 to $14,999 | 26 | 1.8% |
| $15,000 to $24,999 | 101 | 7.0% |
| $25,000 to $34,999 | 123 | 8.5% |
| $35,000 to $49,999 | 261 | 18.0% |
| $50,000 to $74,999 | 266 | 18.4% |
| $75,000 to $99,999 | 146 | 10.1% |
| $100,000 to $149,999 | 240 | 16.6% |
| $150,000 to $199,999 | 56 | 3.9% |
| $200,000+ | 30 | 2.1% |
Family Income by Famaliy Size in Livingston
3-person families (293 | 20.2%) account for the highest median family income in Livingston with $51,701 per family, while 2-person families (607 | 41.9%) have the highest median income of $21,771 per family member.
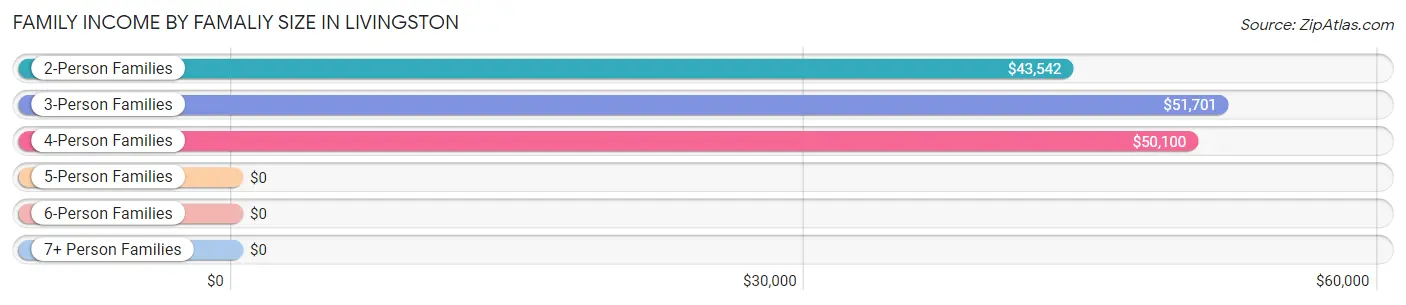
| Income Bracket | # Families | Median Income |
| 2-Person Families | 607 (41.9%) | $43,542 |
| 3-Person Families | 293 (20.2%) | $51,701 |
| 4-Person Families | 362 (25.0%) | $50,100 |
| 5-Person Families | 155 (10.7%) | $0 |
| 6-Person Families | 12 (0.8%) | $0 |
| 7+ Person Families | 19 (1.3%) | $0 |
| Total | 1,448 (100.0%) | $50,697 |
Family Income by Number of Earners in Livingston
The median family income in Livingston is $50,697, with families comprising 3+ earners (154) having the highest median family income of $122,841, while families with 1 earner (495) have the lowest median family income of $24,899, accounting for 10.6% and 34.2% of families, respectively.
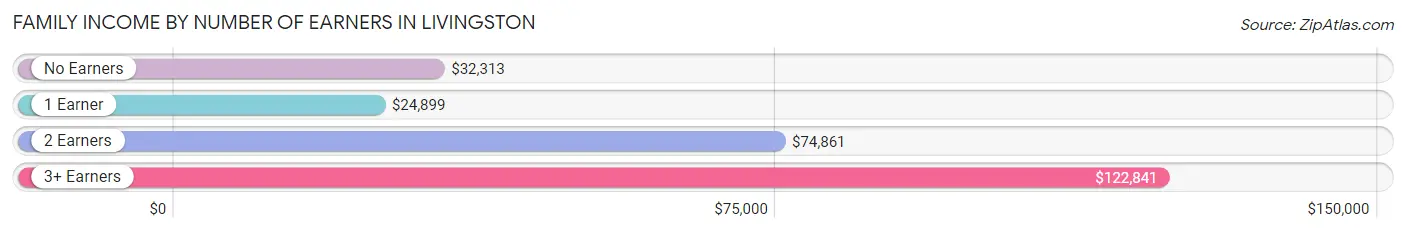
| Number of Earners | # Families | Median Income |
| No Earners | 229 (15.8%) | $32,313 |
| 1 Earner | 495 (34.2%) | $24,899 |
| 2 Earners | 570 (39.4%) | $74,861 |
| 3+ Earners | 154 (10.6%) | $122,841 |
| Total | 1,448 (100.0%) | $50,697 |
Household Income in Livingston
Household Income Brackets in Livingston
With 377 households falling in the category, the $35,000 to $49,999 income range is the most frequent in Livingston, accounting for 16.1% of all households. In contrast, only 42 households (1.8%) fall into the $200,000+ income bracket, making it the least populous group.
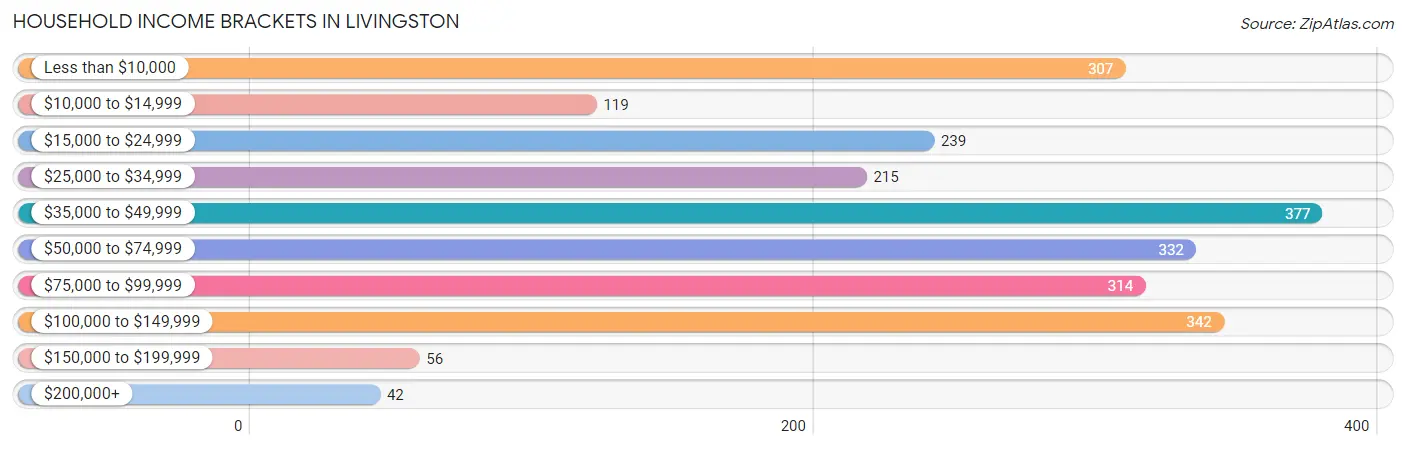
| Income Bracket | # Households | % Households |
| Less than $10,000 | 307 | 13.1% |
| $10,000 to $14,999 | 119 | 5.1% |
| $15,000 to $24,999 | 239 | 10.2% |
| $25,000 to $34,999 | 215 | 9.2% |
| $35,000 to $49,999 | 377 | 16.1% |
| $50,000 to $74,999 | 332 | 14.2% |
| $75,000 to $99,999 | 314 | 13.4% |
| $100,000 to $149,999 | 342 | 14.6% |
| $150,000 to $199,999 | 56 | 2.4% |
| $200,000+ | 42 | 1.8% |
Household Income by Householder Age in Livingston
The median household income in Livingston is $47,952, with the highest median household income of $78,224 found in the 25 to 44 years age bracket for the primary householder. A total of 865 households (37.0%) fall into this category. Meanwhile, the 15 to 24 years age bracket for the primary householder has the lowest median household income of $0, with 94 households (4.0%) in this group.
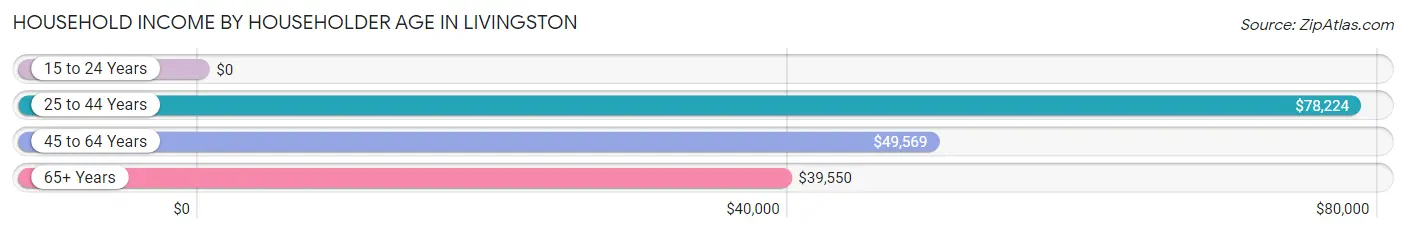
| Income Bracket | # Households | Median Income |
| 15 to 24 Years | 94 (4.0%) | $0 |
| 25 to 44 Years | 865 (37.0%) | $78,224 |
| 45 to 64 Years | 748 (32.0%) | $49,569 |
| 65+ Years | 633 (27.1%) | $39,550 |
| Total | 2,340 (100.0%) | $47,952 |
Poverty in Livingston
Income Below Poverty by Sex and Age in Livingston
With 17.5% poverty level for males and 25.6% for females among the residents of Livingston, 6 to 11 year old males and 18 to 24 year old females are the most vulnerable to poverty, with 100 males (48.3%) and 121 females (67.2%) in their respective age groups living below the poverty level.
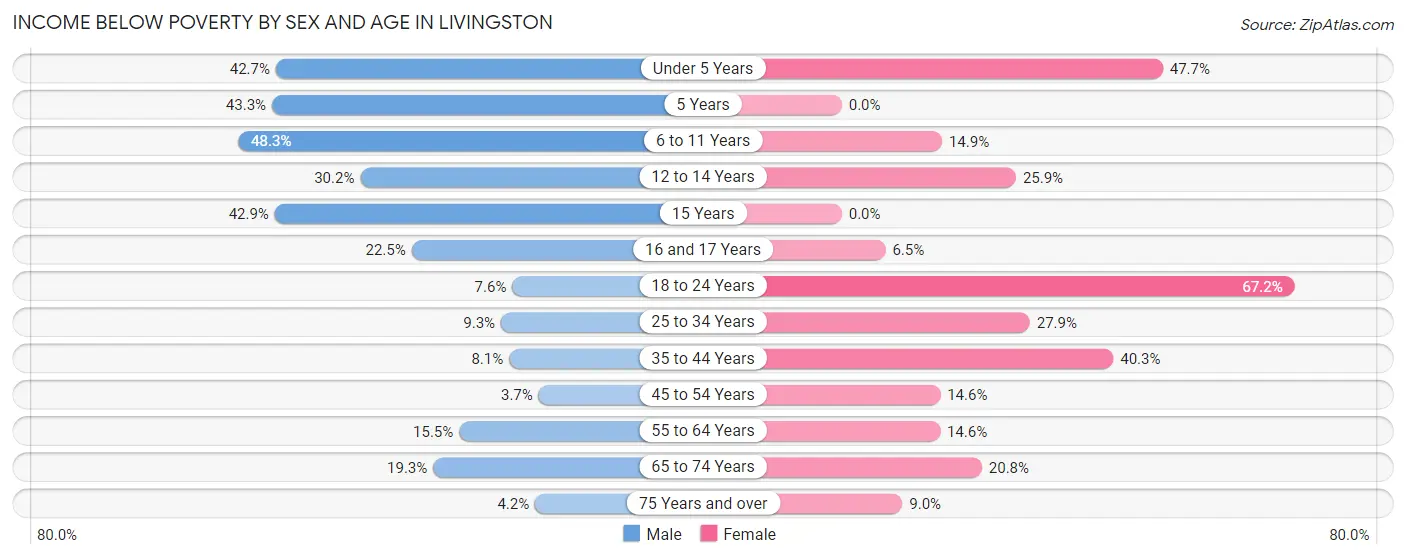
| Age Bracket | Male | Female |
| Under 5 Years | 38 (42.7%) | 123 (47.7%) |
| 5 Years | 29 (43.3%) | 0 (0.0%) |
| 6 to 11 Years | 100 (48.3%) | 25 (14.9%) |
| 12 to 14 Years | 38 (30.2%) | 45 (25.9%) |
| 15 Years | 39 (42.9%) | 0 (0.0%) |
| 16 and 17 Years | 16 (22.5%) | 10 (6.5%) |
| 18 to 24 Years | 17 (7.6%) | 121 (67.2%) |
| 25 to 34 Years | 46 (9.3%) | 110 (27.9%) |
| 35 to 44 Years | 22 (8.1%) | 102 (40.3%) |
| 45 to 54 Years | 11 (3.7%) | 50 (14.6%) |
| 55 to 64 Years | 39 (15.5%) | 63 (14.6%) |
| 65 to 74 Years | 53 (19.3%) | 52 (20.8%) |
| 75 Years and over | 5 (4.2%) | 17 (9.0%) |
| Total | 453 (17.5%) | 718 (25.6%) |
Income Above Poverty by Sex and Age in Livingston
According to the poverty statistics in Livingston, males aged 45 to 54 years and females aged 15 years are the age groups that are most secure financially, with 96.3% of males and 100.0% of females in these age groups living above the poverty line.
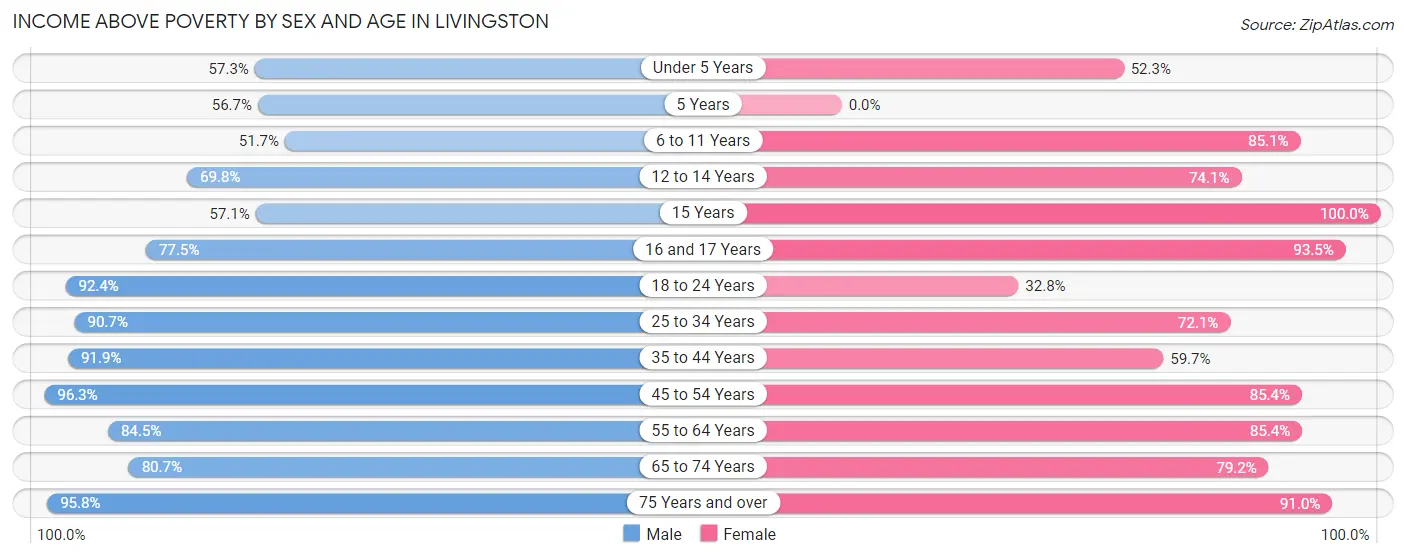
| Age Bracket | Male | Female |
| Under 5 Years | 51 (57.3%) | 135 (52.3%) |
| 5 Years | 38 (56.7%) | 0 (0.0%) |
| 6 to 11 Years | 107 (51.7%) | 143 (85.1%) |
| 12 to 14 Years | 88 (69.8%) | 129 (74.1%) |
| 15 Years | 52 (57.1%) | 15 (100.0%) |
| 16 and 17 Years | 55 (77.5%) | 144 (93.5%) |
| 18 to 24 Years | 207 (92.4%) | 59 (32.8%) |
| 25 to 34 Years | 450 (90.7%) | 284 (72.1%) |
| 35 to 44 Years | 251 (91.9%) | 151 (59.7%) |
| 45 to 54 Years | 289 (96.3%) | 292 (85.4%) |
| 55 to 64 Years | 213 (84.5%) | 369 (85.4%) |
| 65 to 74 Years | 221 (80.7%) | 198 (79.2%) |
| 75 Years and over | 114 (95.8%) | 172 (91.0%) |
| Total | 2,136 (82.5%) | 2,091 (74.4%) |
Income Below Poverty Among Married-Couple Families in Livingston
The poverty statistics for married-couple families in Livingston show that 7.8% or 56 of the total 721 families live below the poverty line. Families with 1 or 2 children have the highest poverty rate of 10.5%, comprising of 34 families. On the other hand, families with 3 or 4 children have the lowest poverty rate of 0.0%, which includes 0 families.
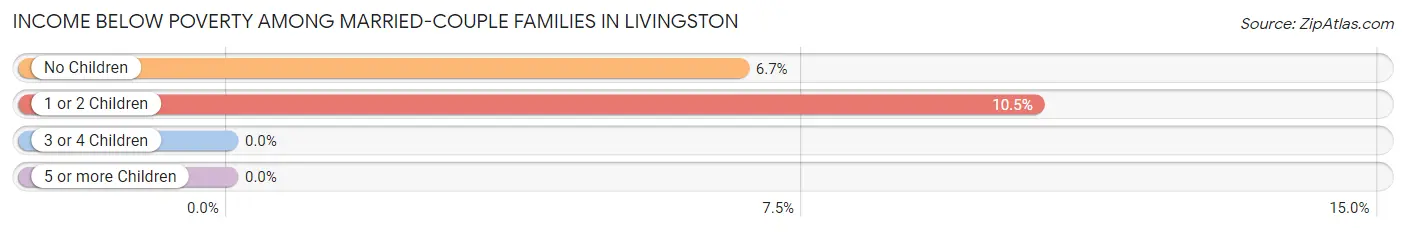
| Children | Above Poverty | Below Poverty |
| No Children | 308 (93.3%) | 22 (6.7%) |
| 1 or 2 Children | 289 (89.5%) | 34 (10.5%) |
| 3 or 4 Children | 49 (100.0%) | 0 (0.0%) |
| 5 or more Children | 19 (100.0%) | 0 (0.0%) |
| Total | 665 (92.2%) | 56 (7.8%) |
Income Below Poverty Among Single-Parent Households in Livingston
According to the poverty data in Livingston, 3.9% or 7 single-father households and 46.6% or 255 single-mother households are living below the poverty line. Among single-father households, those with 3 or 4 children have the highest poverty rate, with 7 households (100.0%) experiencing poverty. Likewise, among single-mother households, those with 3 or 4 children have the highest poverty rate, with 88 households (95.7%) falling below the poverty line.
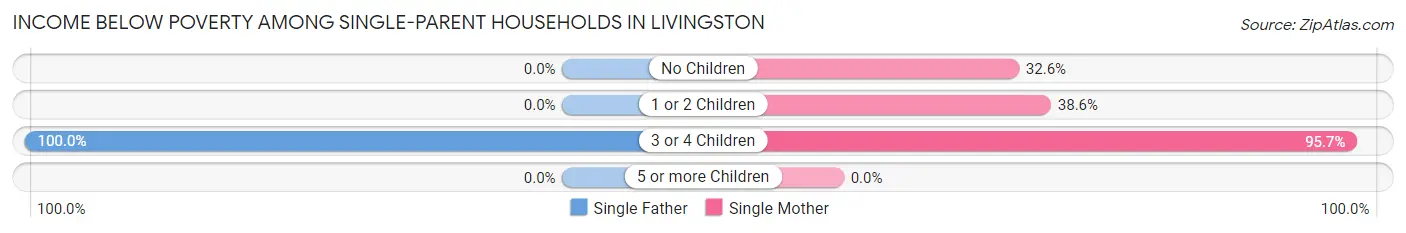
| Children | Single Father | Single Mother |
| No Children | 0 (0.0%) | 47 (32.6%) |
| 1 or 2 Children | 0 (0.0%) | 120 (38.6%) |
| 3 or 4 Children | 7 (100.0%) | 88 (95.7%) |
| 5 or more Children | 0 (0.0%) | 0 (0.0%) |
| Total | 7 (3.9%) | 255 (46.6%) |
Income Below Poverty Among Married-Couple vs Single-Parent Households in Livingston
The poverty data for Livingston shows that 56 of the married-couple family households (7.8%) and 262 of the single-parent households (36.0%) are living below the poverty level. Within the married-couple family households, those with 1 or 2 children have the highest poverty rate, with 34 households (10.5%) falling below the poverty line. Among the single-parent households, those with 3 or 4 children have the highest poverty rate, with 95 household (96.0%) living below poverty.
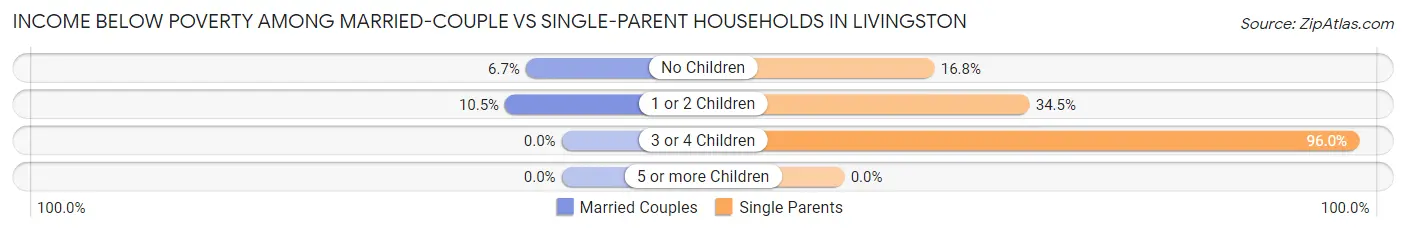
| Children | Married-Couple Families | Single-Parent Households |
| No Children | 22 (6.7%) | 47 (16.8%) |
| 1 or 2 Children | 34 (10.5%) | 120 (34.5%) |
| 3 or 4 Children | 0 (0.0%) | 95 (96.0%) |
| 5 or more Children | 0 (0.0%) | 0 (0.0%) |
| Total | 56 (7.8%) | 262 (36.0%) |
Race in Livingston
The most populous races in Livingston are White / Caucasian (3,531 | 62.3%), Hispanic or Latino (1,689 | 29.8%), and Black / African American (1,031 | 18.2%).
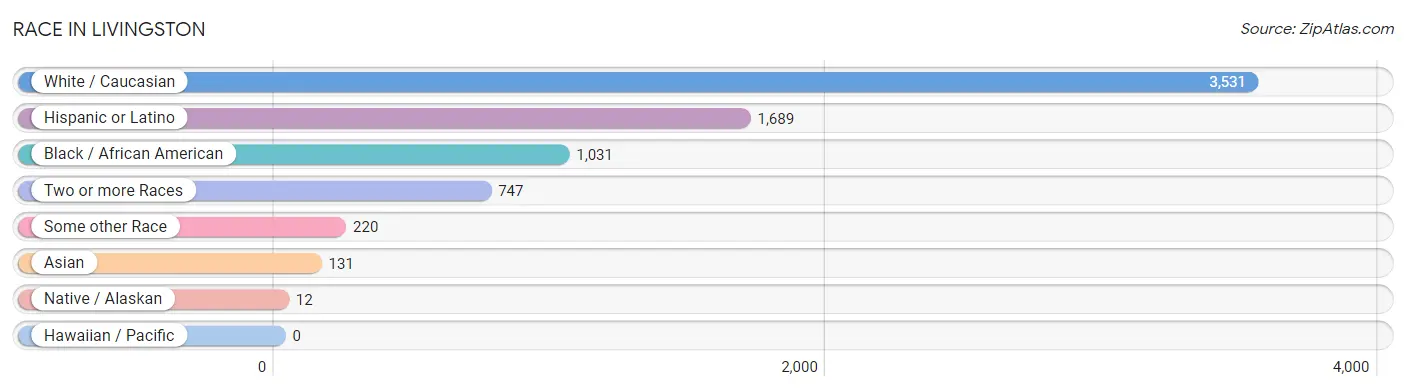
| Race | # Population | % Population |
| Asian | 131 | 2.3% |
| Black / African American | 1,031 | 18.2% |
| Hawaiian / Pacific | 0 | 0.0% |
| Hispanic or Latino | 1,689 | 29.8% |
| Native / Alaskan | 12 | 0.2% |
| White / Caucasian | 3,531 | 62.3% |
| Two or more Races | 747 | 13.2% |
| Some other Race | 220 | 3.9% |
| Total | 5,672 | 100.0% |
Ancestry in Livingston
The most populous ancestries reported in Livingston are Mexican (1,511 | 26.6%), American (519 | 9.1%), Irish (423 | 7.5%), German (365 | 6.4%), and English (291 | 5.1%), together accounting for 54.8% of all Livingston residents.
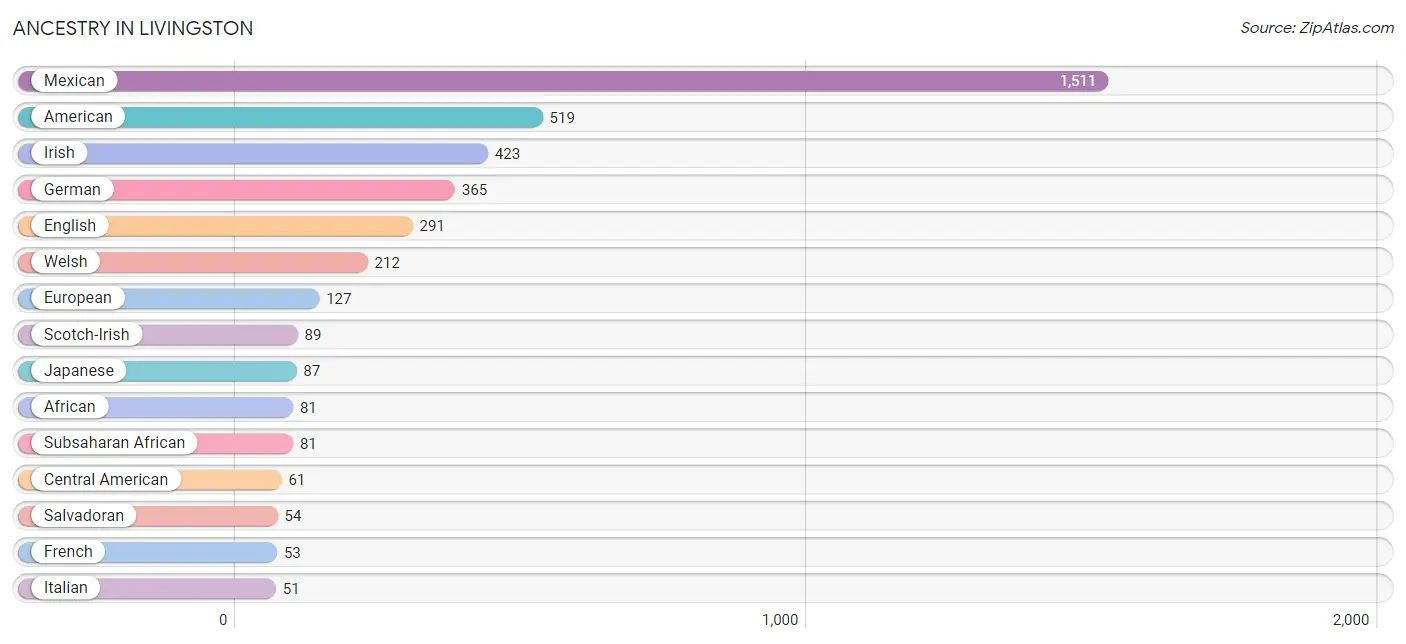
| Ancestry | # Population | % Population |
| African | 81 | 1.4% |
| American | 519 | 9.1% |
| Apache | 3 | 0.1% |
| Central American | 61 | 1.1% |
| Cherokee | 12 | 0.2% |
| Choctaw | 10 | 0.2% |
| Costa Rican | 7 | 0.1% |
| Cuban | 48 | 0.9% |
| Czechoslovakian | 6 | 0.1% |
| Danish | 38 | 0.7% |
| Dutch | 21 | 0.4% |
| English | 291 | 5.1% |
| European | 127 | 2.2% |
| Finnish | 4 | 0.1% |
| French | 53 | 0.9% |
| French Canadian | 46 | 0.8% |
| German | 365 | 6.4% |
| Greek | 10 | 0.2% |
| Indian (Asian) | 22 | 0.4% |
| Irish | 423 | 7.5% |
| Italian | 51 | 0.9% |
| Japanese | 87 | 1.5% |
| Korean | 44 | 0.8% |
| Mexican | 1,511 | 26.6% |
| Norwegian | 16 | 0.3% |
| Polish | 15 | 0.3% |
| Puerto Rican | 6 | 0.1% |
| Salvadoran | 54 | 0.9% |
| Scandinavian | 17 | 0.3% |
| Scotch-Irish | 89 | 1.6% |
| Scottish | 31 | 0.5% |
| South American | 49 | 0.9% |
| Subsaharan African | 81 | 1.4% |
| Venezuelan | 49 | 0.9% |
| Welsh | 212 | 3.7% | View All 35 Rows |
Immigrants in Livingston
The most numerous immigrant groups reported in Livingston came from Latin America (629 | 11.1%), Central America (544 | 9.6%), Mexico (483 | 8.5%), Caribbean (85 | 1.5%), and Dominican Republic (85 | 1.5%), together accounting for 32.2% of all Livingston residents.
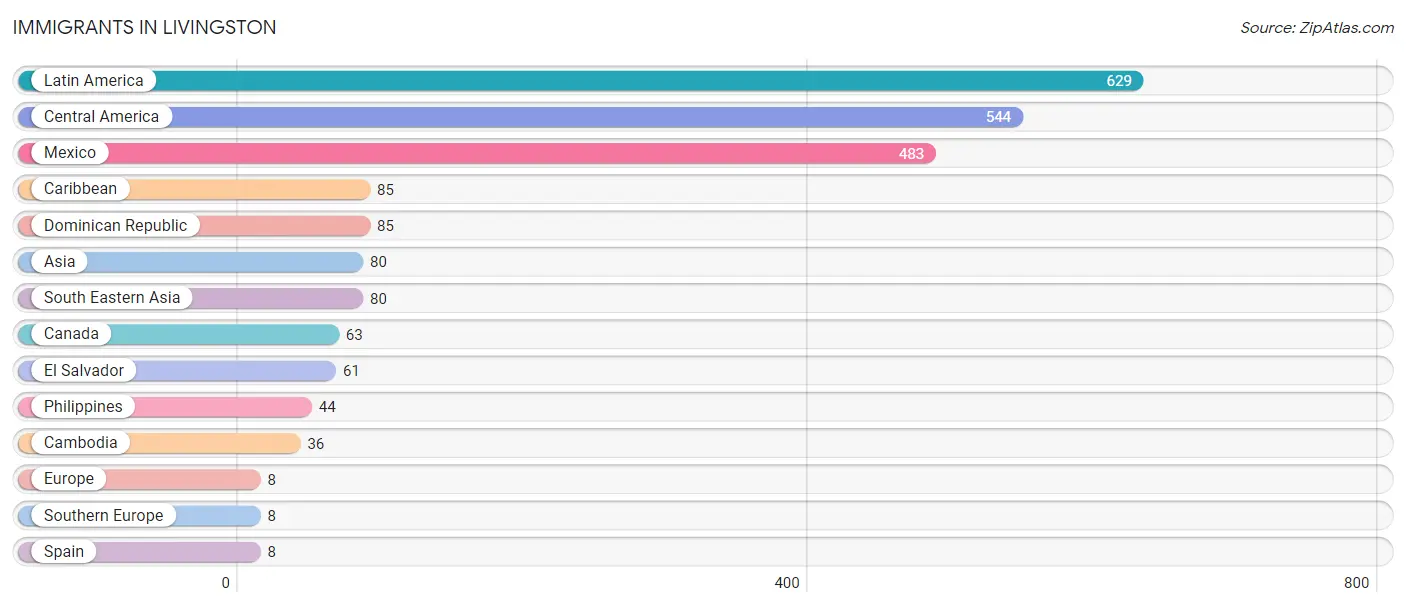
| Immigration Origin | # Population | % Population |
| Asia | 80 | 1.4% |
| Cambodia | 36 | 0.6% |
| Canada | 63 | 1.1% |
| Caribbean | 85 | 1.5% |
| Central America | 544 | 9.6% |
| Dominican Republic | 85 | 1.5% |
| El Salvador | 61 | 1.1% |
| Europe | 8 | 0.1% |
| Latin America | 629 | 11.1% |
| Mexico | 483 | 8.5% |
| Philippines | 44 | 0.8% |
| South Eastern Asia | 80 | 1.4% |
| Southern Europe | 8 | 0.1% |
| Spain | 8 | 0.1% | View All 14 Rows |
Sex and Age in Livingston
Sex and Age in Livingston
The most populous age groups in Livingston are 30 to 34 Years (307 | 11.0%) for men and 60 to 64 Years (297 | 10.3%) for women.
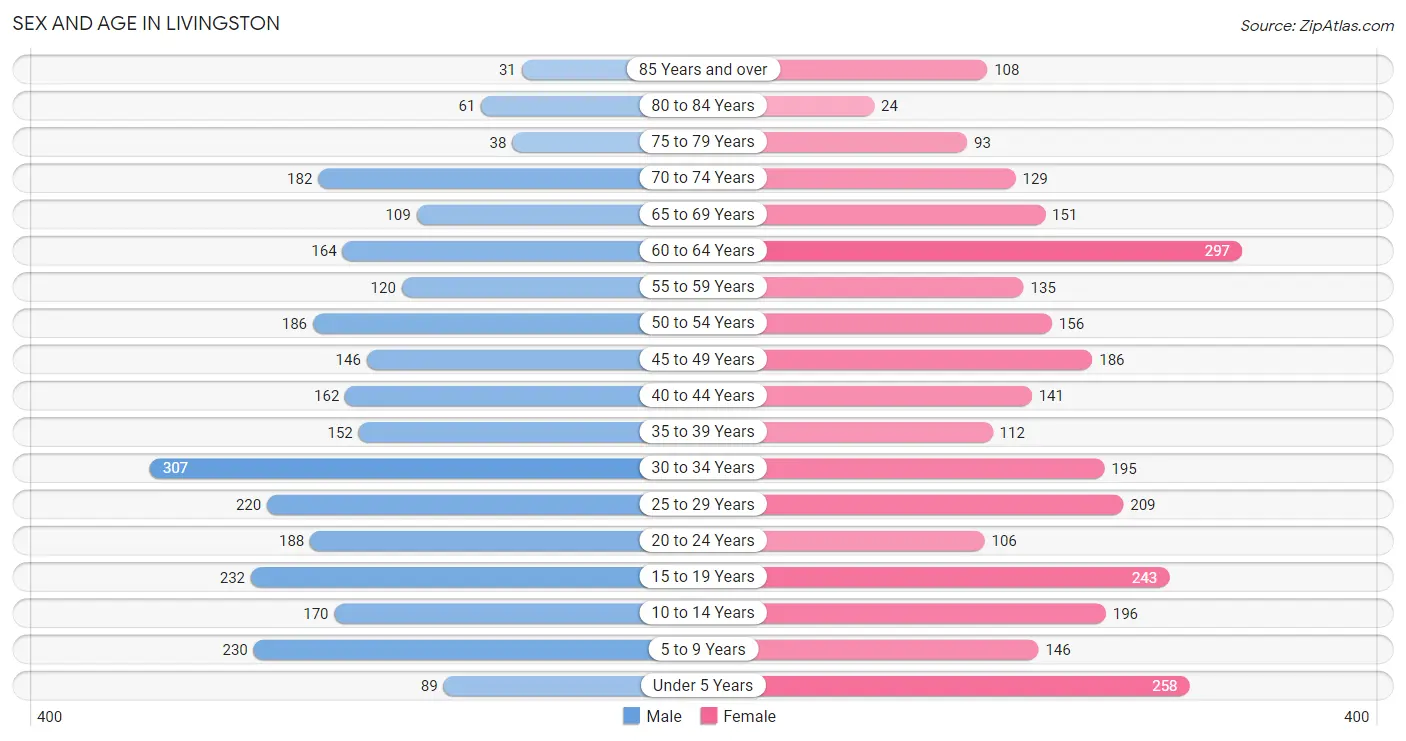
| Age Bracket | Male | Female |
| Under 5 Years | 89 (3.2%) | 258 (8.9%) |
| 5 to 9 Years | 230 (8.3%) | 146 (5.1%) |
| 10 to 14 Years | 170 (6.1%) | 196 (6.8%) |
| 15 to 19 Years | 232 (8.3%) | 243 (8.4%) |
| 20 to 24 Years | 188 (6.8%) | 106 (3.7%) |
| 25 to 29 Years | 220 (7.9%) | 209 (7.2%) |
| 30 to 34 Years | 307 (11.0%) | 195 (6.8%) |
| 35 to 39 Years | 152 (5.4%) | 112 (3.9%) |
| 40 to 44 Years | 162 (5.8%) | 141 (4.9%) |
| 45 to 49 Years | 146 (5.2%) | 186 (6.5%) |
| 50 to 54 Years | 186 (6.7%) | 156 (5.4%) |
| 55 to 59 Years | 120 (4.3%) | 135 (4.7%) |
| 60 to 64 Years | 164 (5.9%) | 297 (10.3%) |
| 65 to 69 Years | 109 (3.9%) | 151 (5.2%) |
| 70 to 74 Years | 182 (6.5%) | 129 (4.5%) |
| 75 to 79 Years | 38 (1.4%) | 93 (3.2%) |
| 80 to 84 Years | 61 (2.2%) | 24 (0.8%) |
| 85 Years and over | 31 (1.1%) | 108 (3.7%) |
| Total | 2,787 (100.0%) | 2,885 (100.0%) |
Families and Households in Livingston
Median Family Size in Livingston
The median family size in Livingston is 3.02 persons per family, with married-couple families (721 | 49.8%) accounting for the largest median family size of 3.47 persons per family. On the other hand, single male/father families (180 | 12.4%) represent the smallest median family size with 2.27 persons per family.
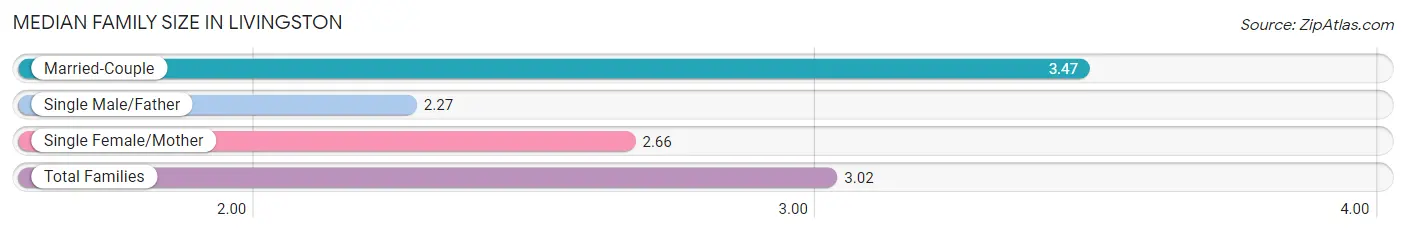
| Family Type | # Families | Family Size |
| Married-Couple | 721 (49.8%) | 3.47 |
| Single Male/Father | 180 (12.4%) | 2.27 |
| Single Female/Mother | 547 (37.8%) | 2.66 |
| Total Families | 1,448 (100.0%) | 3.02 |
Median Household Size in Livingston
The median household size in Livingston is 2.29 persons per household, with married-couple households (721 | 30.8%) accounting for the largest median household size of 3.5 persons per household. non-family households (892 | 38.1%) represent the smallest median household size with 1.04 persons per household.
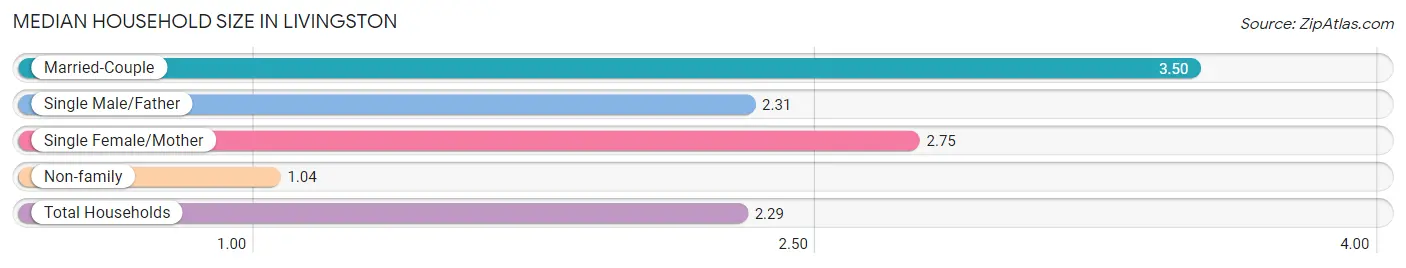
| Household Type | # Households | Household Size |
| Married-Couple | 721 (30.8%) | 3.50 |
| Single Male/Father | 180 (7.7%) | 2.31 |
| Single Female/Mother | 547 (23.4%) | 2.75 |
| Non-family | 892 (38.1%) | 1.04 |
| Total Households | 2,340 (100.0%) | 2.29 |
Household Size by Marriage Status in Livingston
Out of a total of 2,340 households in Livingston, 1,448 (61.9%) are family households, while 892 (38.1%) are nonfamily households. The most numerous type of family households are 2-person households, comprising 573, and the most common type of nonfamily households are 1-person households, comprising 838.
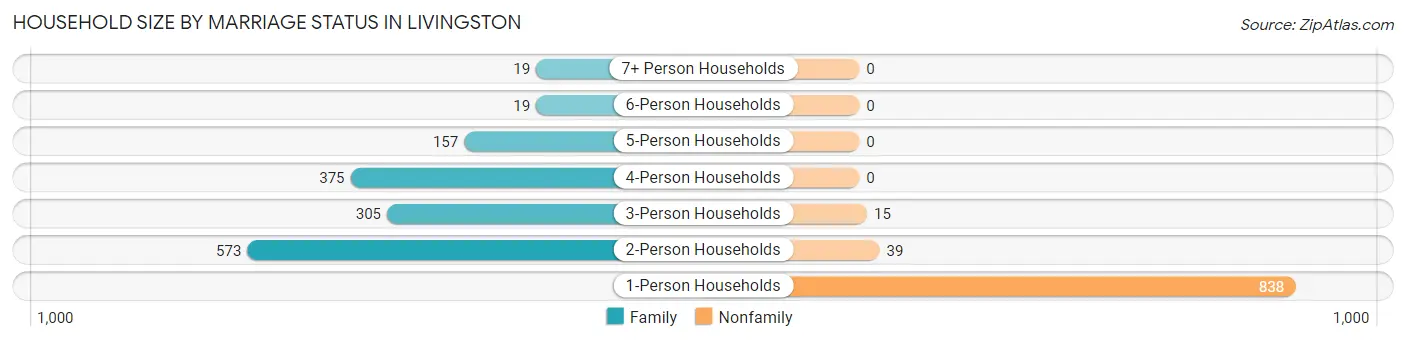
| Household Size | Family Households | Nonfamily Households |
| 1-Person Households | - | 838 (35.8%) |
| 2-Person Households | 573 (24.5%) | 39 (1.7%) |
| 3-Person Households | 305 (13.0%) | 15 (0.6%) |
| 4-Person Households | 375 (16.0%) | 0 (0.0%) |
| 5-Person Households | 157 (6.7%) | 0 (0.0%) |
| 6-Person Households | 19 (0.8%) | 0 (0.0%) |
| 7+ Person Households | 19 (0.8%) | 0 (0.0%) |
| Total | 1,448 (61.9%) | 892 (38.1%) |
Female Fertility in Livingston
Fertility by Age in Livingston
Average fertility rate in Livingston is 110.0 births per 1,000 women. Women in the age bracket of 20 to 34 years have the highest fertility rate with 243.0 births per 1,000 women. Women in the age bracket of 20 to 34 years acount for 92.5% of all women with births.
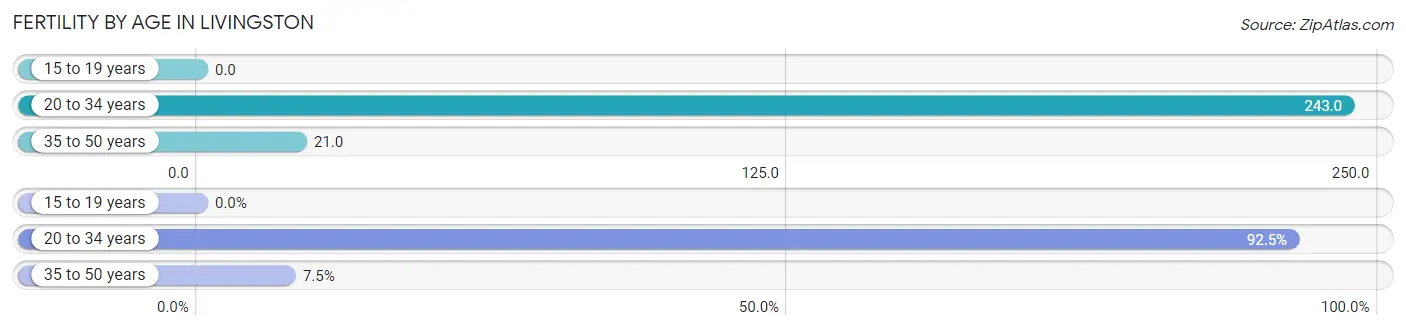
| Age Bracket | Women with Births | Births / 1,000 Women |
| 15 to 19 years | 0 (0.0%) | 0.0 |
| 20 to 34 years | 124 (92.5%) | 243.0 |
| 35 to 50 years | 10 (7.5%) | 21.0 |
| Total | 134 (100.0%) | 110.0 |
Fertility by Age by Marriage Status in Livingston
40.3% of women with births (134) in Livingston are married. The highest percentage of unmarried women with births falls into 35 to 50 years age bracket with 100.0% of them unmarried at the time of birth, while the lowest percentage of unmarried women with births belong to 20 to 34 years age bracket with 56.5% of them unmarried.
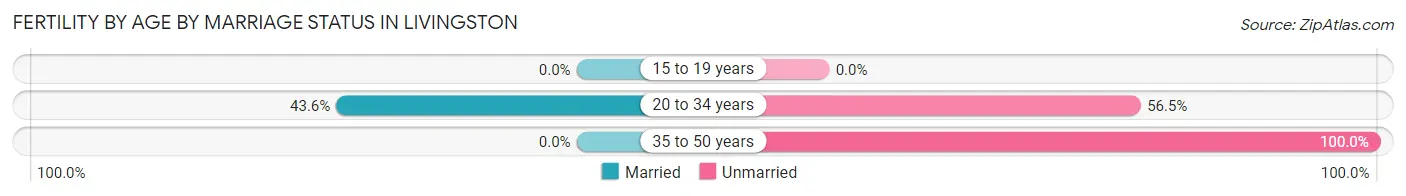
| Age Bracket | Married | Unmarried |
| 15 to 19 years | 0 (0.0%) | 0 (0.0%) |
| 20 to 34 years | 54 (43.5%) | 70 (56.5%) |
| 35 to 50 years | 0 (0.0%) | 10 (100.0%) |
| Total | 54 (40.3%) | 80 (59.7%) |
Fertility by Education in Livingston
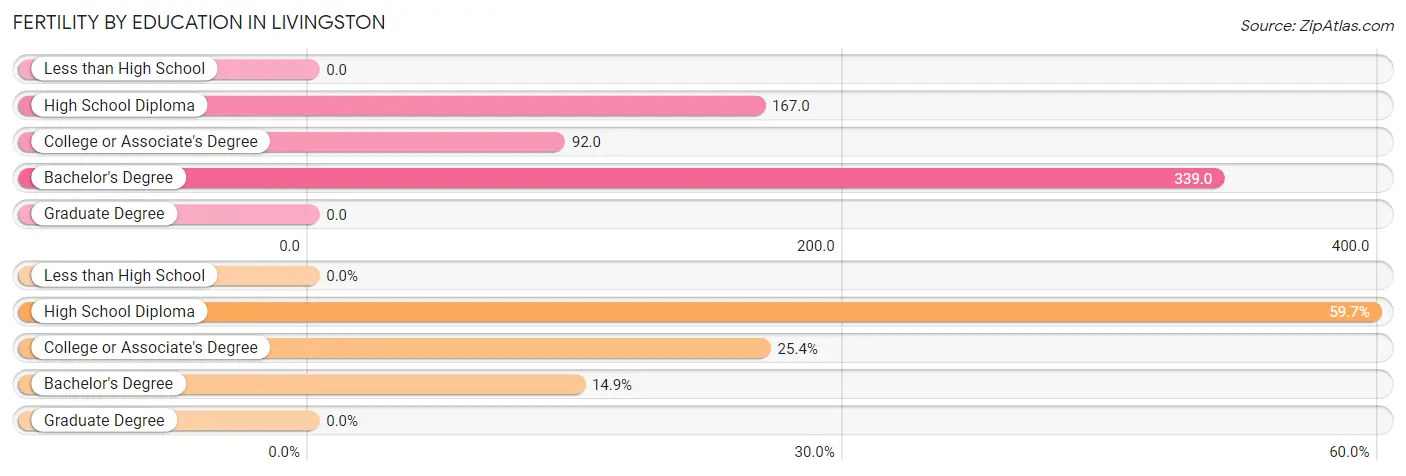
| Educational Attainment | Women with Births | Births / 1,000 Women |
| Less than High School | 0 (0.0%) | 0.0 |
| High School Diploma | 80 (59.7%) | 167.0 |
| College or Associate's Degree | 34 (25.4%) | 92.0 |
| Bachelor's Degree | 20 (14.9%) | 339.0 |
| Graduate Degree | 0 (0.0%) | 0.0 |
| Total | 134 (100.0%) | 110.0 |
Fertility by Education by Marriage Status in Livingston
59.7% of women with births in Livingston are unmarried. Women with the educational attainment of college or associate's degree are most likely to be married with 100.0% of them married at childbirth, while women with the educational attainment of high school diploma are least likely to be married with 100.0% of them unmarried at childbirth.
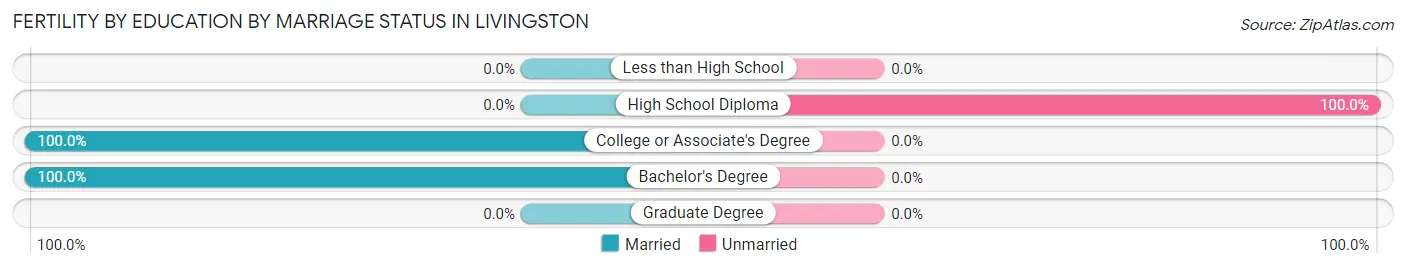
| Educational Attainment | Married | Unmarried |
| Less than High School | 0 (0.0%) | 0 (0.0%) |
| High School Diploma | 0 (0.0%) | 80 (100.0%) |
| College or Associate's Degree | 34 (100.0%) | 0 (0.0%) |
| Bachelor's Degree | 20 (100.0%) | 0 (0.0%) |
| Graduate Degree | 0 (0.0%) | 0 (0.0%) |
| Total | 54 (40.3%) | 80 (59.7%) |
Employment Characteristics in Livingston
Employment by Class of Employer in Livingston
Among the 2,518 employed individuals in Livingston, private company employees (1,621 | 64.4%), state government employees (260 | 10.3%), and self-employed (not incorporated) (209 | 8.3%) make up the most common classes of employment.
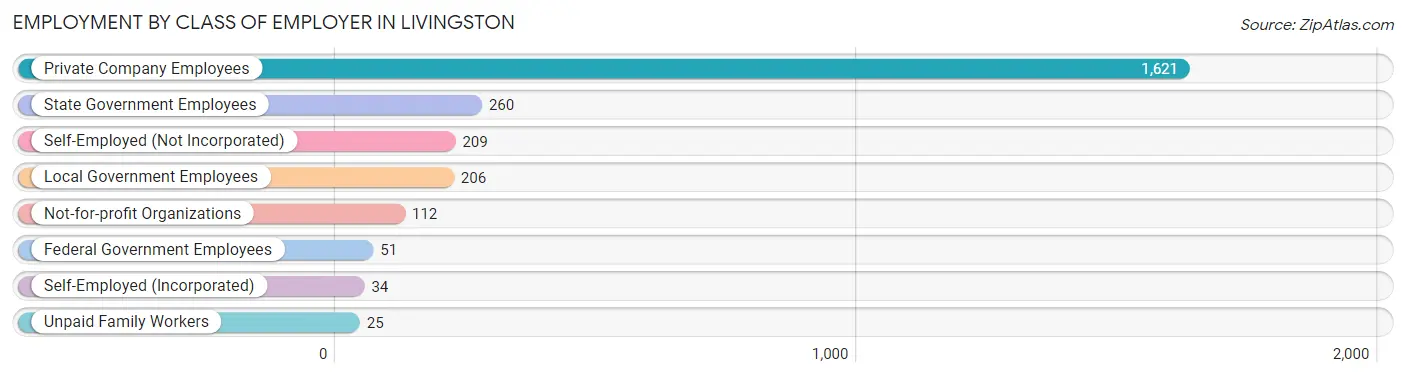
| Employer Class | # Employees | % Employees |
| Private Company Employees | 1,621 | 64.4% |
| Self-Employed (Incorporated) | 34 | 1.3% |
| Self-Employed (Not Incorporated) | 209 | 8.3% |
| Not-for-profit Organizations | 112 | 4.4% |
| Local Government Employees | 206 | 8.2% |
| State Government Employees | 260 | 10.3% |
| Federal Government Employees | 51 | 2.0% |
| Unpaid Family Workers | 25 | 1.0% |
| Total | 2,518 | 100.0% |
Employment Status by Age in Livingston
According to the labor force statistics for Livingston, out of the total population over 16 years of age (4,477), 61.3% or 2,744 individuals are in the labor force, with 6.5% or 178 of them unemployed. The age group with the highest labor force participation rate is 25 to 29 years, with 86.0% or 369 individuals in the labor force. Within the labor force, the 16 to 19 years age range has the highest percentage of unemployed individuals, with 57.9% or 121 of them being unemployed.
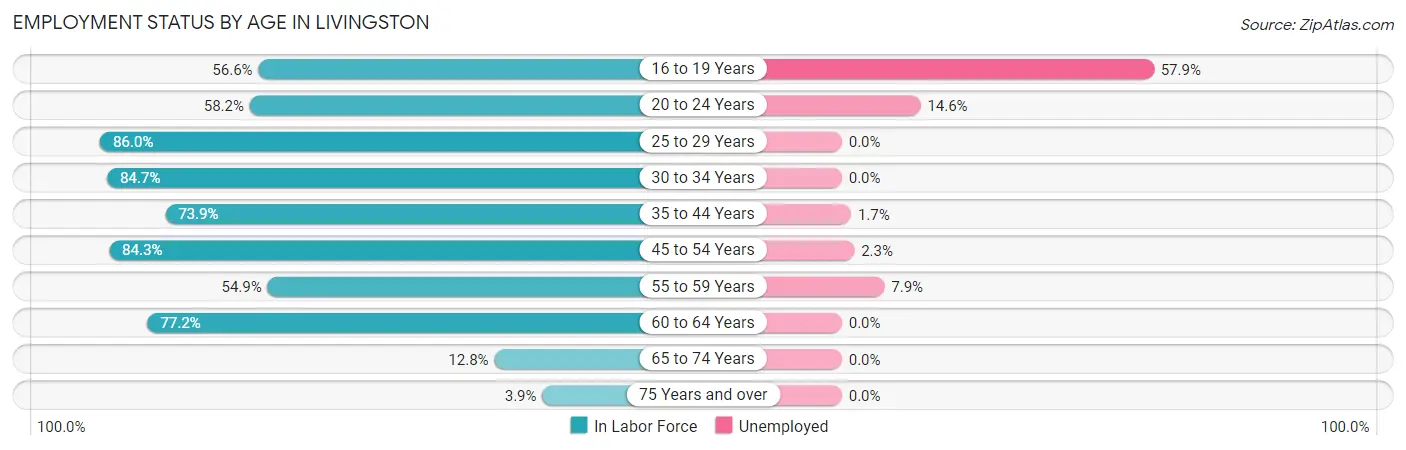
| Age Bracket | In Labor Force | Unemployed |
| 16 to 19 Years | 209 (56.6%) | 121 (57.9%) |
| 20 to 24 Years | 171 (58.2%) | 25 (14.6%) |
| 25 to 29 Years | 369 (86.0%) | 0 (0.0%) |
| 30 to 34 Years | 425 (84.7%) | 0 (0.0%) |
| 35 to 44 Years | 419 (73.9%) | 7 (1.7%) |
| 45 to 54 Years | 568 (84.3%) | 13 (2.3%) |
| 55 to 59 Years | 140 (54.9%) | 11 (7.9%) |
| 60 to 64 Years | 356 (77.2%) | 0 (0.0%) |
| 65 to 74 Years | 73 (12.8%) | 0 (0.0%) |
| 75 Years and over | 14 (3.9%) | 0 (0.0%) |
| Total | 2,744 (61.3%) | 178 (6.5%) |
Employment Status by Educational Attainment in Livingston
According to labor force statistics for Livingston, 78.8% of individuals (2,276) out of the total population between 25 and 64 years of age (2,888) are in the labor force, with 1.4% or 32 of them being unemployed. The group with the highest labor force participation rate are those with the educational attainment of less than high school, with 88.7% or 440 individuals in the labor force. Within the labor force, individuals with college / associate degree education have the highest percentage of unemployment, with 4.7% or 24 of them being unemployed.
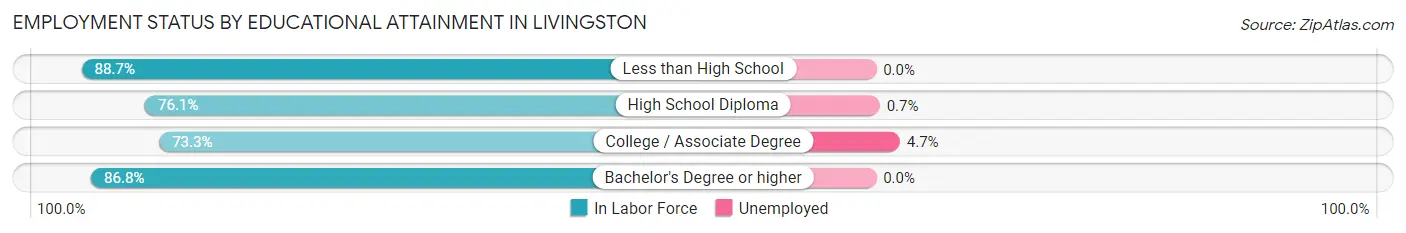
| Educational Attainment | In Labor Force | Unemployed |
| Less than High School | 440 (88.7%) | 0 (0.0%) |
| High School Diploma | 1,041 (76.1%) | 10 (0.7%) |
| College / Associate Degree | 506 (73.3%) | 32 (4.7%) |
| Bachelor's Degree or higher | 290 (86.8%) | 0 (0.0%) |
| Total | 2,276 (78.8%) | 40 (1.4%) |
Employment Occupations by Sex in Livingston
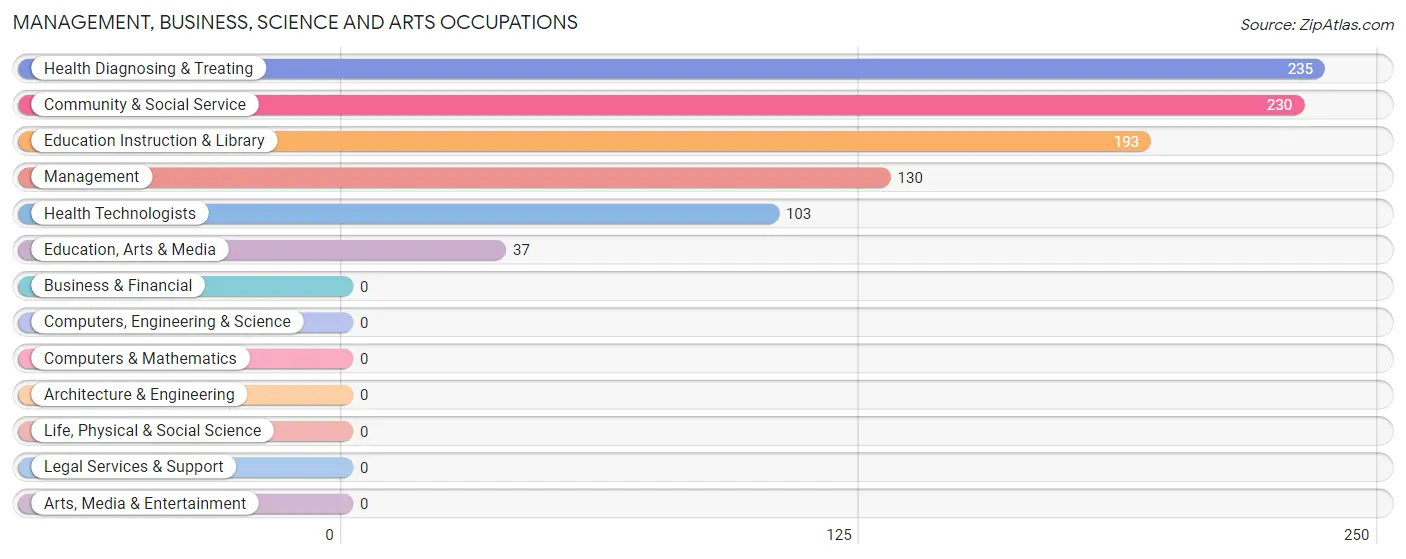
Management, Business, Science and Arts Occupations
The most common Management, Business, Science and Arts occupations in Livingston are Health Diagnosing & Treating (235 | 9.1%), Community & Social Service (230 | 9.0%), Education Instruction & Library (193 | 7.5%), Management (130 | 5.1%), and Health Technologists (103 | 4.0%).
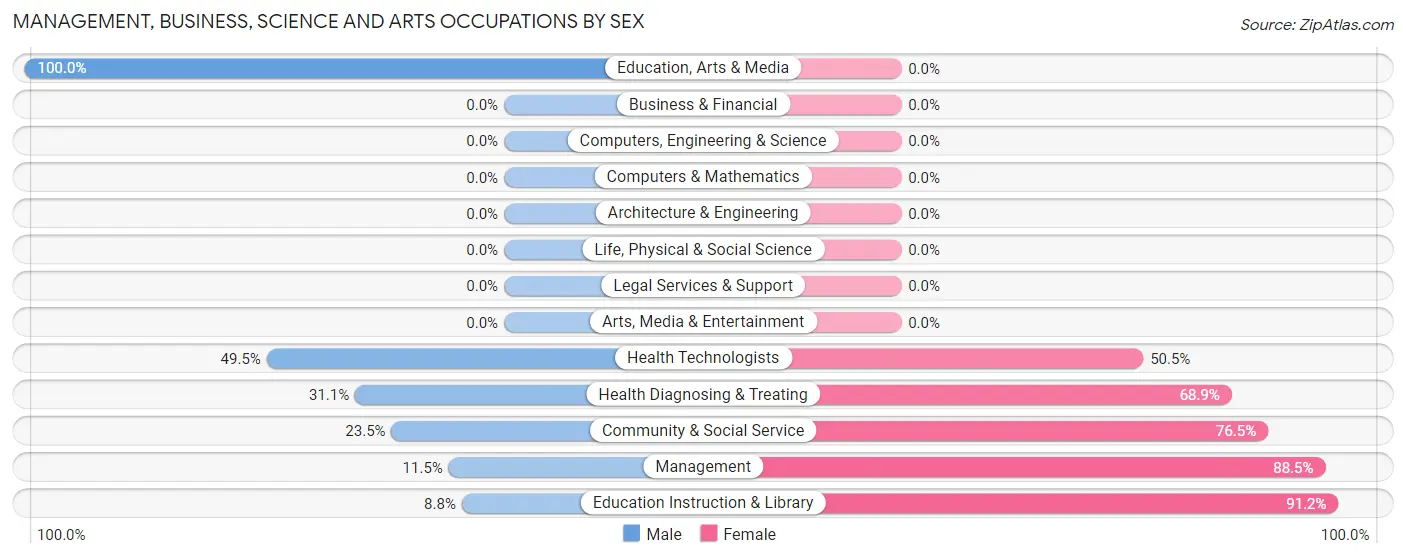
Management, Business, Science and Arts Occupations by Sex
Within the Management, Business, Science and Arts occupations in Livingston, the most male-oriented occupations are Education, Arts & Media (100.0%), Health Technologists (49.5%), and Health Diagnosing & Treating (31.1%), while the most female-oriented occupations are Education Instruction & Library (91.2%), Management (88.5%), and Community & Social Service (76.5%).
| Occupation | Male | Female |
| Management | 15 (11.5%) | 115 (88.5%) |
| Business & Financial | 0 (0.0%) | 0 (0.0%) |
| Computers, Engineering & Science | 0 (0.0%) | 0 (0.0%) |
| Computers & Mathematics | 0 (0.0%) | 0 (0.0%) |
| Architecture & Engineering | 0 (0.0%) | 0 (0.0%) |
| Life, Physical & Social Science | 0 (0.0%) | 0 (0.0%) |
| Community & Social Service | 54 (23.5%) | 176 (76.5%) |
| Education, Arts & Media | 37 (100.0%) | 0 (0.0%) |
| Legal Services & Support | 0 (0.0%) | 0 (0.0%) |
| Education Instruction & Library | 17 (8.8%) | 176 (91.2%) |
| Arts, Media & Entertainment | 0 (0.0%) | 0 (0.0%) |
| Health Diagnosing & Treating | 73 (31.1%) | 162 (68.9%) |
| Health Technologists | 51 (49.5%) | 52 (50.5%) |
| Total (Category) | 142 (23.9%) | 453 (76.1%) |
| Total (Overall) | 1,364 (53.1%) | 1,203 (46.9%) |
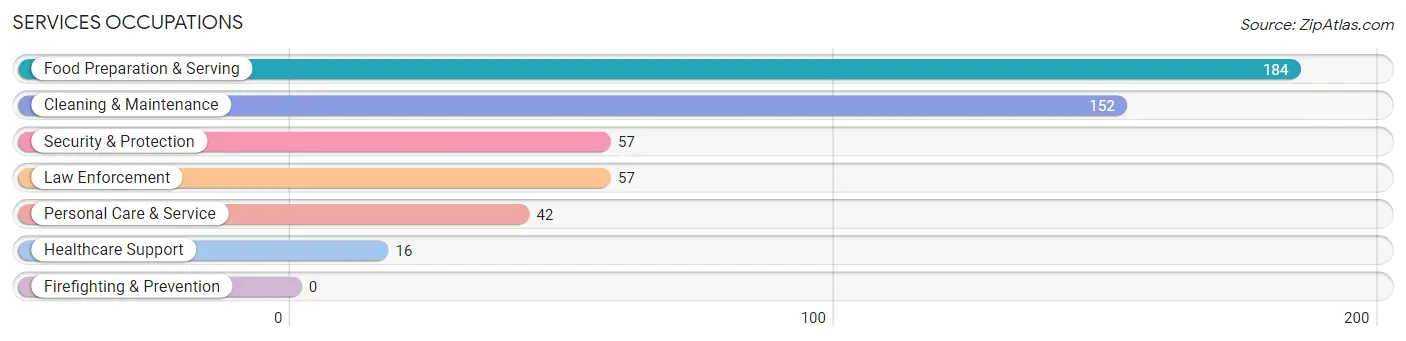
Services Occupations
The most common Services occupations in Livingston are Food Preparation & Serving (184 | 7.2%), Cleaning & Maintenance (152 | 5.9%), Security & Protection (57 | 2.2%), Law Enforcement (57 | 2.2%), and Personal Care & Service (42 | 1.6%).
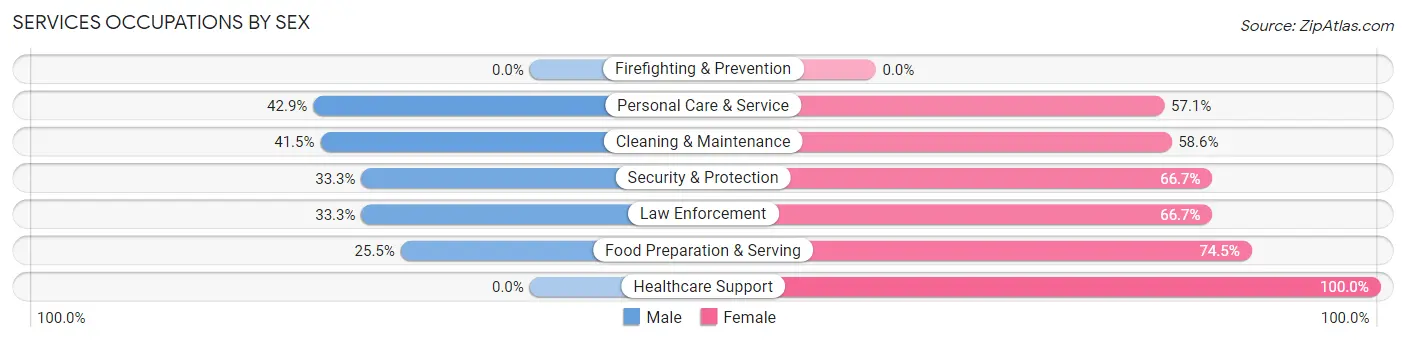
Services Occupations by Sex
Within the Services occupations in Livingston, the most male-oriented occupations are Personal Care & Service (42.9%), Cleaning & Maintenance (41.4%), and Security & Protection (33.3%), while the most female-oriented occupations are Healthcare Support (100.0%), Food Preparation & Serving (74.5%), and Security & Protection (66.7%).
| Occupation | Male | Female |
| Healthcare Support | 0 (0.0%) | 16 (100.0%) |
| Security & Protection | 19 (33.3%) | 38 (66.7%) |
| Firefighting & Prevention | 0 (0.0%) | 0 (0.0%) |
| Law Enforcement | 19 (33.3%) | 38 (66.7%) |
| Food Preparation & Serving | 47 (25.5%) | 137 (74.5%) |
| Cleaning & Maintenance | 63 (41.4%) | 89 (58.6%) |
| Personal Care & Service | 18 (42.9%) | 24 (57.1%) |
| Total (Category) | 147 (32.6%) | 304 (67.4%) |
| Total (Overall) | 1,364 (53.1%) | 1,203 (46.9%) |
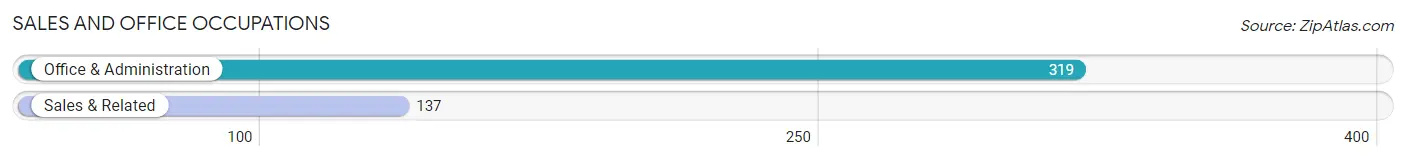
Sales and Office Occupations
The most common Sales and Office occupations in Livingston are Office & Administration (319 | 12.4%), and Sales & Related (137 | 5.3%).
Sales and Office Occupations by Sex
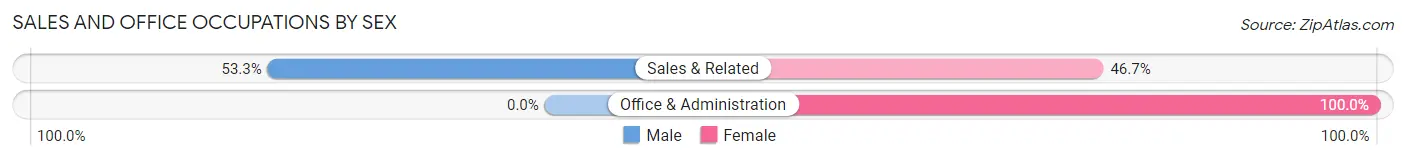
| Occupation | Male | Female |
| Sales & Related | 73 (53.3%) | 64 (46.7%) |
| Office & Administration | 0 (0.0%) | 319 (100.0%) |
| Total (Category) | 73 (16.0%) | 383 (84.0%) |
| Total (Overall) | 1,364 (53.1%) | 1,203 (46.9%) |
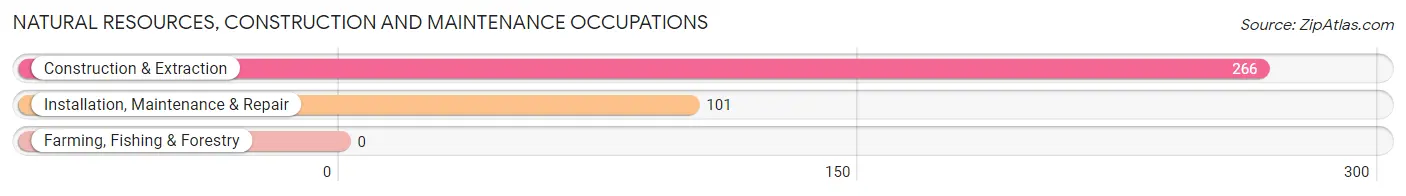
Natural Resources, Construction and Maintenance Occupations
The most common Natural Resources, Construction and Maintenance occupations in Livingston are Construction & Extraction (266 | 10.4%), and Installation, Maintenance & Repair (101 | 3.9%).
Natural Resources, Construction and Maintenance Occupations by Sex
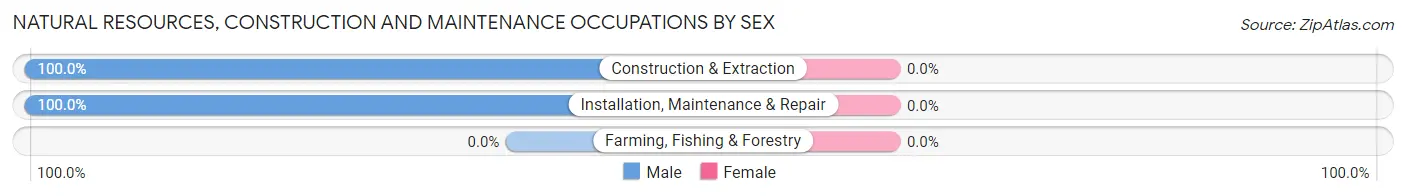
| Occupation | Male | Female |
| Farming, Fishing & Forestry | 0 (0.0%) | 0 (0.0%) |
| Construction & Extraction | 266 (100.0%) | 0 (0.0%) |
| Installation, Maintenance & Repair | 101 (100.0%) | 0 (0.0%) |
| Total (Category) | 367 (100.0%) | 0 (0.0%) |
| Total (Overall) | 1,364 (53.1%) | 1,203 (46.9%) |
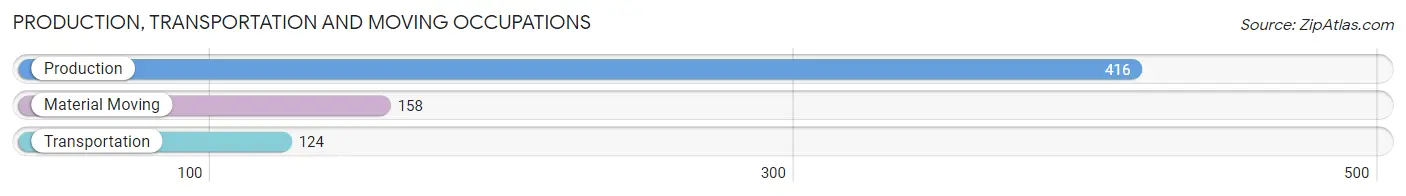
Production, Transportation and Moving Occupations
The most common Production, Transportation and Moving occupations in Livingston are Production (416 | 16.2%), Material Moving (158 | 6.2%), and Transportation (124 | 4.8%).
Production, Transportation and Moving Occupations by Sex
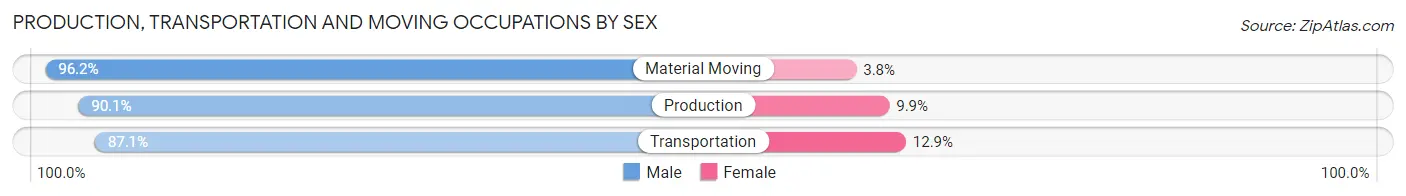
| Occupation | Male | Female |
| Production | 375 (90.1%) | 41 (9.9%) |
| Transportation | 108 (87.1%) | 16 (12.9%) |
| Material Moving | 152 (96.2%) | 6 (3.8%) |
| Total (Category) | 635 (91.0%) | 63 (9.0%) |
| Total (Overall) | 1,364 (53.1%) | 1,203 (46.9%) |
Employment Industries by Sex in Livingston
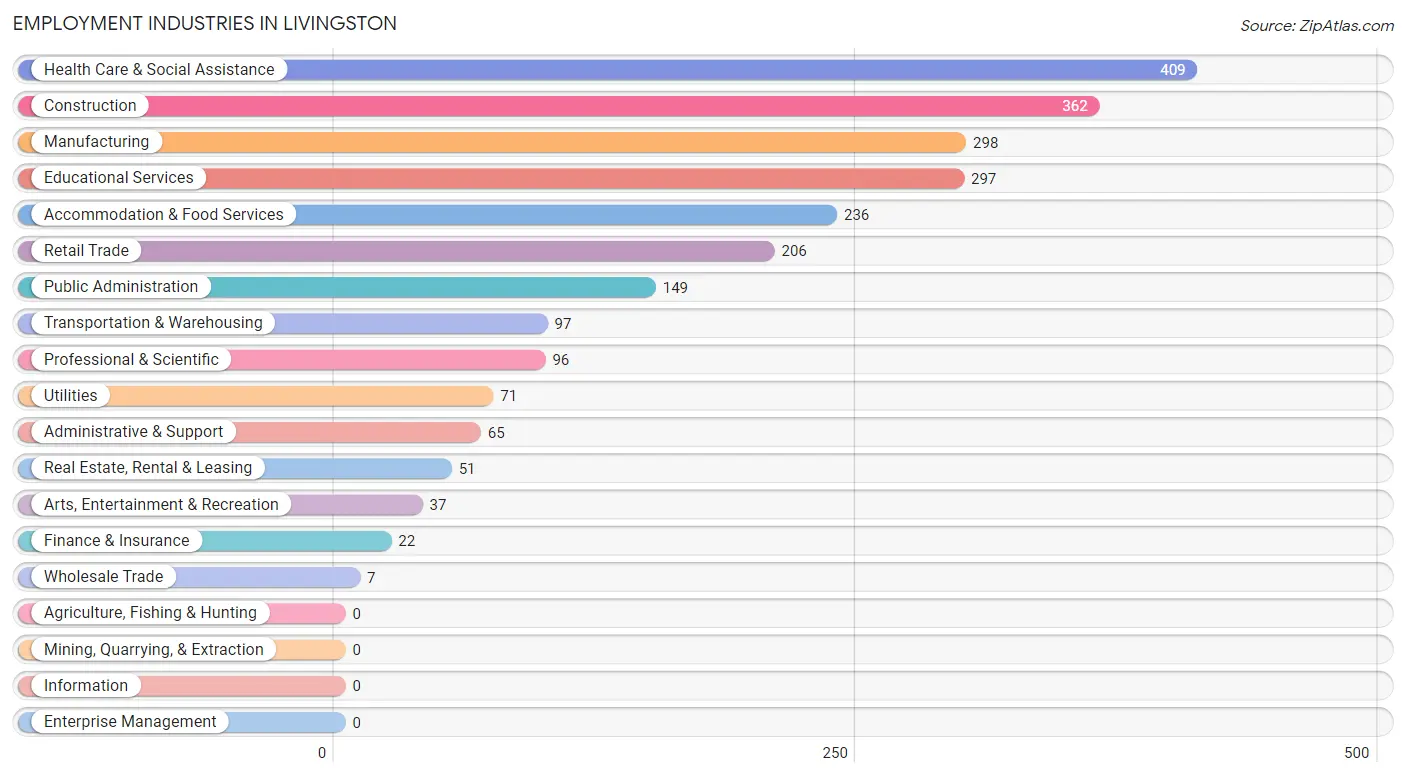
Employment Industries in Livingston
The major employment industries in Livingston include Health Care & Social Assistance (409 | 15.9%), Construction (362 | 14.1%), Manufacturing (298 | 11.6%), Educational Services (297 | 11.6%), and Accommodation & Food Services (236 | 9.2%).
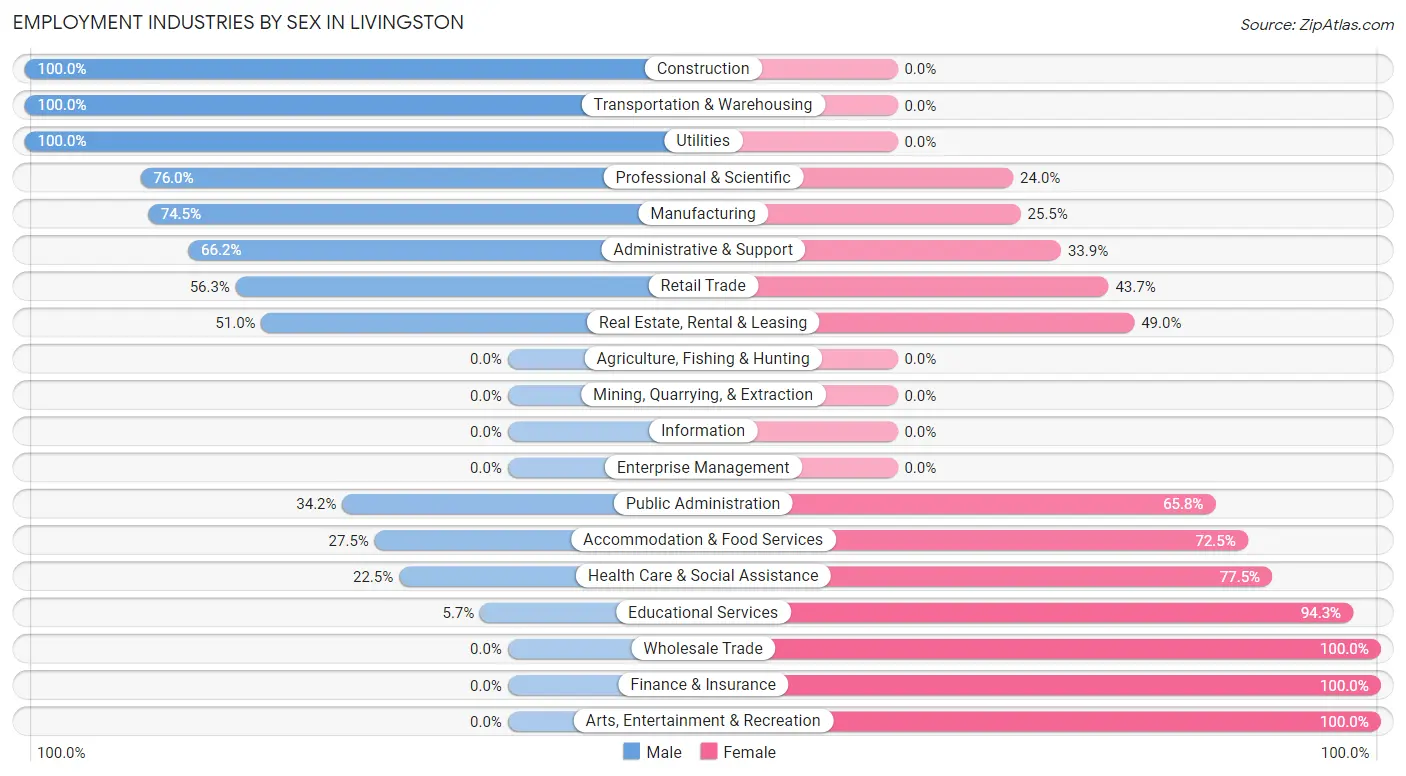
Employment Industries by Sex in Livingston
The Livingston industries that see more men than women are Construction (100.0%), Transportation & Warehousing (100.0%), and Utilities (100.0%), whereas the industries that tend to have a higher number of women are Wholesale Trade (100.0%), Finance & Insurance (100.0%), and Arts, Entertainment & Recreation (100.0%).
| Industry | Male | Female |
| Agriculture, Fishing & Hunting | 0 (0.0%) | 0 (0.0%) |
| Mining, Quarrying, & Extraction | 0 (0.0%) | 0 (0.0%) |
| Construction | 362 (100.0%) | 0 (0.0%) |
| Manufacturing | 222 (74.5%) | 76 (25.5%) |
| Wholesale Trade | 0 (0.0%) | 7 (100.0%) |
| Retail Trade | 116 (56.3%) | 90 (43.7%) |
| Transportation & Warehousing | 97 (100.0%) | 0 (0.0%) |
| Utilities | 71 (100.0%) | 0 (0.0%) |
| Information | 0 (0.0%) | 0 (0.0%) |
| Finance & Insurance | 0 (0.0%) | 22 (100.0%) |
| Real Estate, Rental & Leasing | 26 (51.0%) | 25 (49.0%) |
| Professional & Scientific | 73 (76.0%) | 23 (24.0%) |
| Enterprise Management | 0 (0.0%) | 0 (0.0%) |
| Administrative & Support | 43 (66.1%) | 22 (33.9%) |
| Educational Services | 17 (5.7%) | 280 (94.3%) |
| Health Care & Social Assistance | 92 (22.5%) | 317 (77.5%) |
| Arts, Entertainment & Recreation | 0 (0.0%) | 37 (100.0%) |
| Accommodation & Food Services | 65 (27.5%) | 171 (72.5%) |
| Public Administration | 51 (34.2%) | 98 (65.8%) |
| Total | 1,364 (53.1%) | 1,203 (46.9%) |
Education in Livingston
School Enrollment in Livingston
The most common levels of schooling among the 1,382 students in Livingston are high school (438 | 31.7%), elementary school (268 | 19.4%), and middle school (242 | 17.5%).
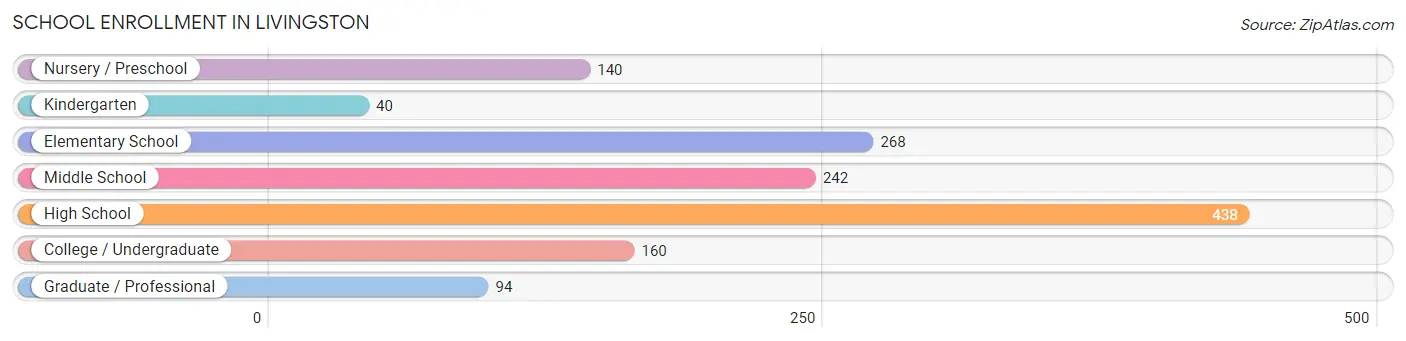
| School Level | # Students | % Students |
| Nursery / Preschool | 140 | 10.1% |
| Kindergarten | 40 | 2.9% |
| Elementary School | 268 | 19.4% |
| Middle School | 242 | 17.5% |
| High School | 438 | 31.7% |
| College / Undergraduate | 160 | 11.6% |
| Graduate / Professional | 94 | 6.8% |
| Total | 1,382 | 100.0% |
School Enrollment by Age by Funding Source in Livingston
Out of a total of 1,382 students who are enrolled in schools in Livingston, 111 (8.0%) attend a private institution, while the remaining 1,271 (92.0%) are enrolled in public schools. The age group of 25 to 34 year olds has the highest likelihood of being enrolled in private schools, with 26 (44.8% in the age bracket) enrolled. Conversely, the age group of 10 to 14 year olds has the lowest likelihood of being enrolled in a private school, with 328 (100.0% in the age bracket) attending a public institution.
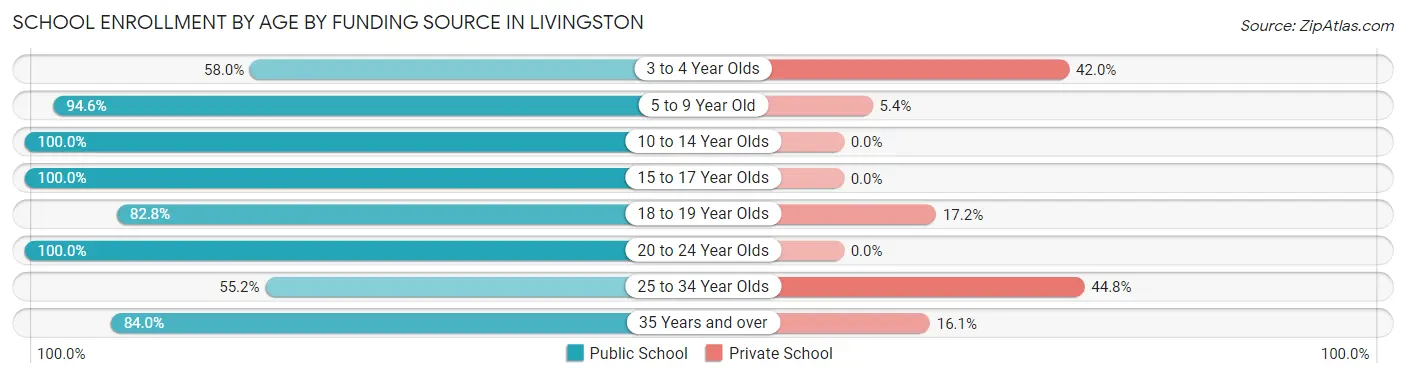
| Age Bracket | Public School | Private School |
| 3 to 4 Year Olds | 58 (58.0%) | 42 (42.0%) |
| 5 to 9 Year Old | 318 (94.6%) | 18 (5.4%) |
| 10 to 14 Year Olds | 328 (100.0%) | 0 (0.0%) |
| 15 to 17 Year Olds | 311 (100.0%) | 0 (0.0%) |
| 18 to 19 Year Olds | 53 (82.8%) | 11 (17.2%) |
| 20 to 24 Year Olds | 104 (100.0%) | 0 (0.0%) |
| 25 to 34 Year Olds | 32 (55.2%) | 26 (44.8%) |
| 35 Years and over | 68 (84.0%) | 13 (16.1%) |
| Total | 1,271 (92.0%) | 111 (8.0%) |
Educational Attainment by Field of Study in Livingston
Education (161 | 28.9%), business (89 | 16.0%), science & technology (75 | 13.5%), arts & humanities (50 | 9.0%), and social sciences (41 | 7.4%) are the most common fields of study among 557 individuals in Livingston who have obtained a bachelor's degree or higher.
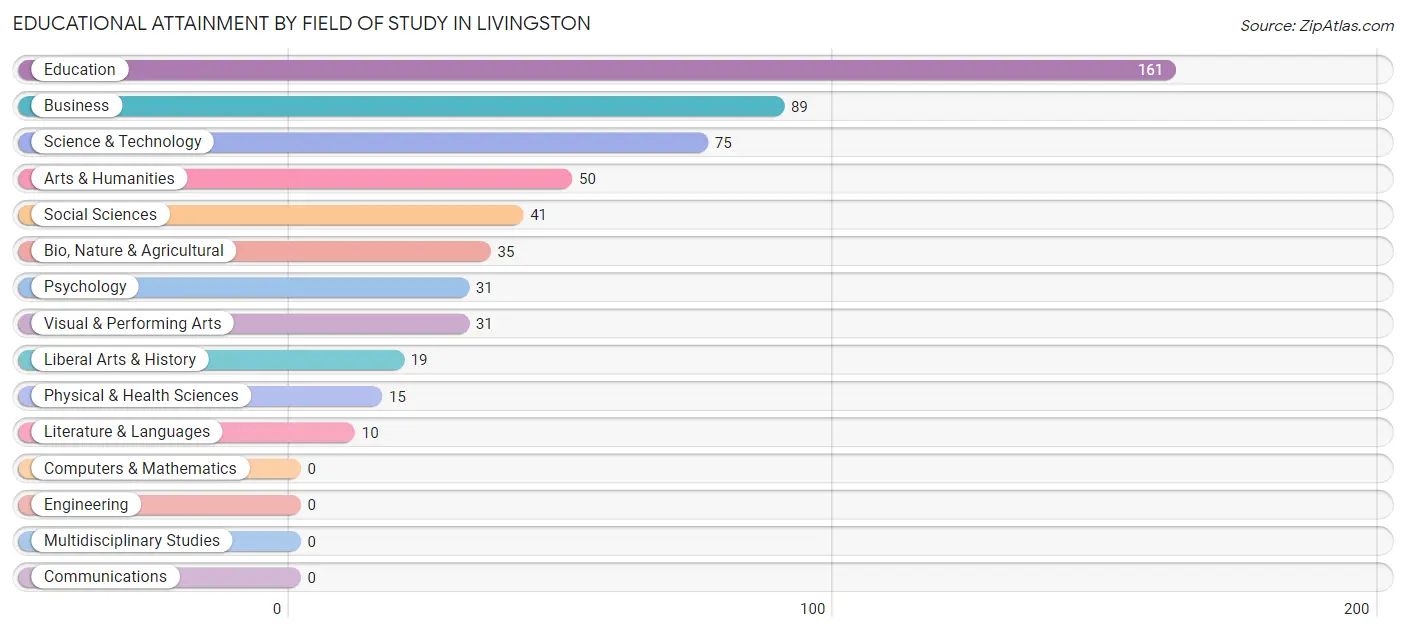
| Field of Study | # Graduates | % Graduates |
| Computers & Mathematics | 0 | 0.0% |
| Bio, Nature & Agricultural | 35 | 6.3% |
| Physical & Health Sciences | 15 | 2.7% |
| Psychology | 31 | 5.6% |
| Social Sciences | 41 | 7.4% |
| Engineering | 0 | 0.0% |
| Multidisciplinary Studies | 0 | 0.0% |
| Science & Technology | 75 | 13.5% |
| Business | 89 | 16.0% |
| Education | 161 | 28.9% |
| Literature & Languages | 10 | 1.8% |
| Liberal Arts & History | 19 | 3.4% |
| Visual & Performing Arts | 31 | 5.6% |
| Communications | 0 | 0.0% |
| Arts & Humanities | 50 | 9.0% |
| Total | 557 | 100.0% |
Transportation & Commute in Livingston
Vehicle Availability by Sex in Livingston
The most prevalent vehicle ownership categories in Livingston are males with 1 vehicle (491, accounting for 36.6%) and females with 1 vehicle (336, making up 41.8%).
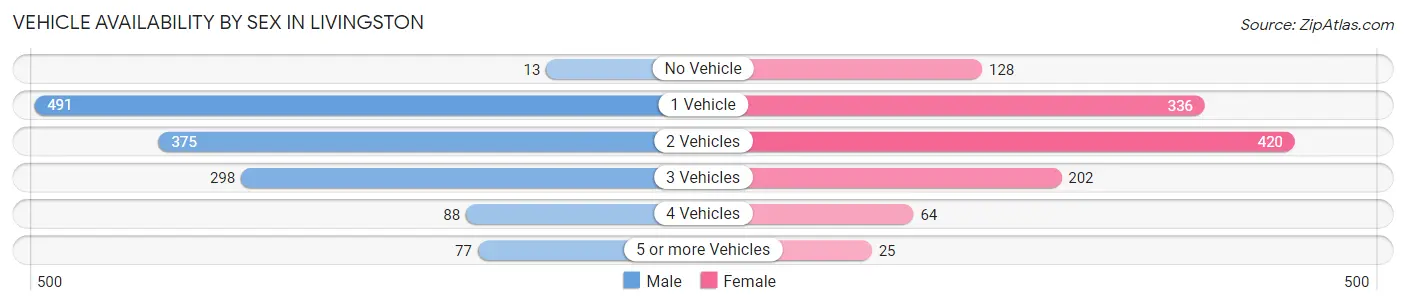
| Vehicles Available | Male | Female |
| No Vehicle | 13 (1.0%) | 128 (10.9%) |
| 1 Vehicle | 491 (36.6%) | 336 (28.6%) |
| 2 Vehicles | 375 (27.9%) | 420 (35.7%) |
| 3 Vehicles | 298 (22.2%) | 202 (17.2%) |
| 4 Vehicles | 88 (6.6%) | 64 (5.4%) |
| 5 or more Vehicles | 77 (5.7%) | 25 (2.1%) |
| Total | 1,342 (100.0%) | 1,175 (100.0%) |
Commute Time in Livingston
The most frequently occuring commute durations in Livingston are 10 to 14 minutes (673 commuters, 27.0%), 5 to 9 minutes (511 commuters, 20.5%), and 15 to 19 minutes (305 commuters, 12.2%).
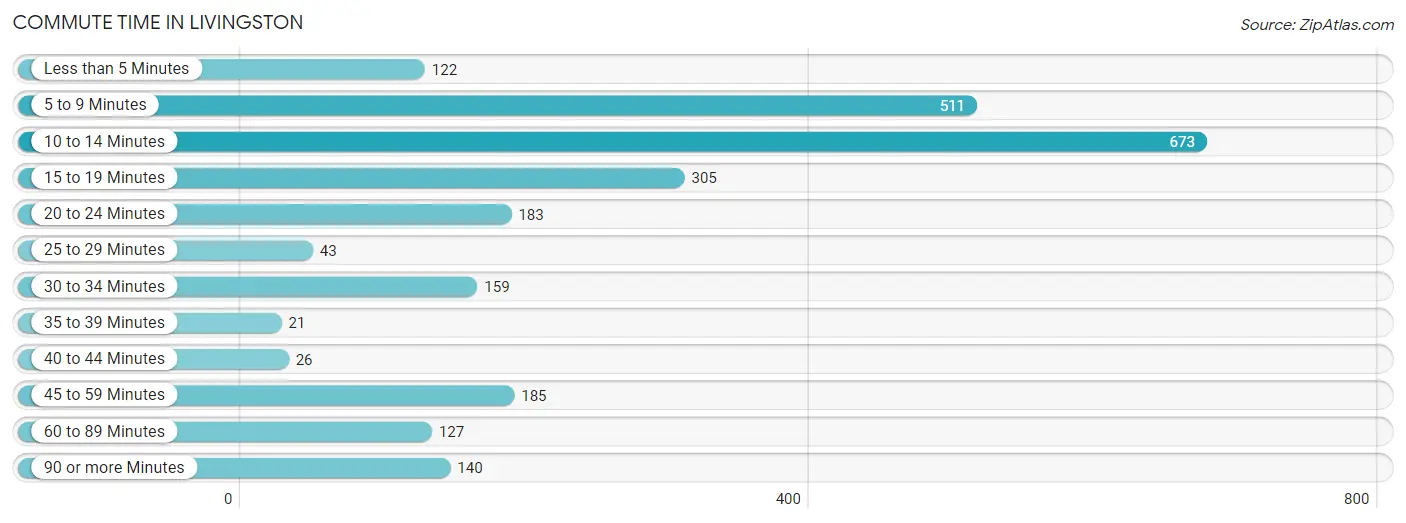
| Commute Time | # Commuters | % Commuters |
| Less than 5 Minutes | 122 | 4.9% |
| 5 to 9 Minutes | 511 | 20.5% |
| 10 to 14 Minutes | 673 | 27.0% |
| 15 to 19 Minutes | 305 | 12.2% |
| 20 to 24 Minutes | 183 | 7.3% |
| 25 to 29 Minutes | 43 | 1.7% |
| 30 to 34 Minutes | 159 | 6.4% |
| 35 to 39 Minutes | 21 | 0.8% |
| 40 to 44 Minutes | 26 | 1.0% |
| 45 to 59 Minutes | 185 | 7.4% |
| 60 to 89 Minutes | 127 | 5.1% |
| 90 or more Minutes | 140 | 5.6% |
Commute Time by Sex in Livingston
The most common commute times in Livingston are 10 to 14 minutes (428 commuters, 31.9%) for males and 15 to 19 minutes (291 commuters, 25.3%) for females.
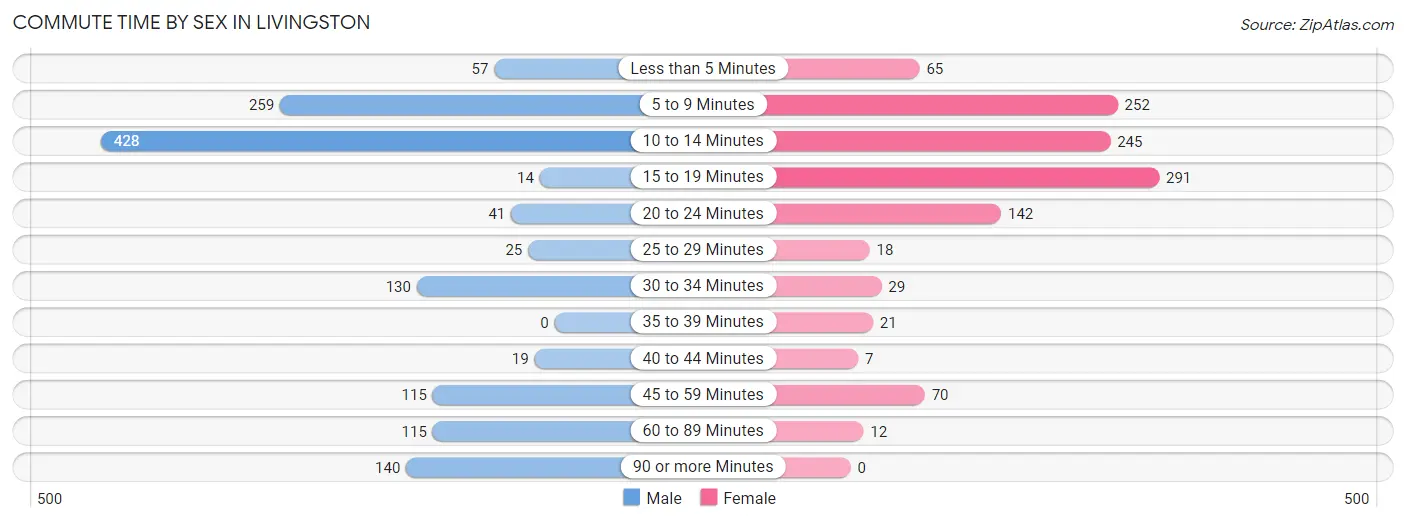
| Commute Time | Male | Female |
| Less than 5 Minutes | 57 (4.2%) | 65 (5.6%) |
| 5 to 9 Minutes | 259 (19.3%) | 252 (21.9%) |
| 10 to 14 Minutes | 428 (31.9%) | 245 (21.3%) |
| 15 to 19 Minutes | 14 (1.0%) | 291 (25.3%) |
| 20 to 24 Minutes | 41 (3.0%) | 142 (12.3%) |
| 25 to 29 Minutes | 25 (1.9%) | 18 (1.6%) |
| 30 to 34 Minutes | 130 (9.7%) | 29 (2.5%) |
| 35 to 39 Minutes | 0 (0.0%) | 21 (1.8%) |
| 40 to 44 Minutes | 19 (1.4%) | 7 (0.6%) |
| 45 to 59 Minutes | 115 (8.6%) | 70 (6.1%) |
| 60 to 89 Minutes | 115 (8.6%) | 12 (1.0%) |
| 90 or more Minutes | 140 (10.4%) | 0 (0.0%) |
Time of Departure to Work by Sex in Livingston
The most frequent times of departure to work in Livingston are 12:00 AM to 4:59 AM (234, 17.4%) for males and 7:00 AM to 7:29 AM (241, 20.9%) for females.
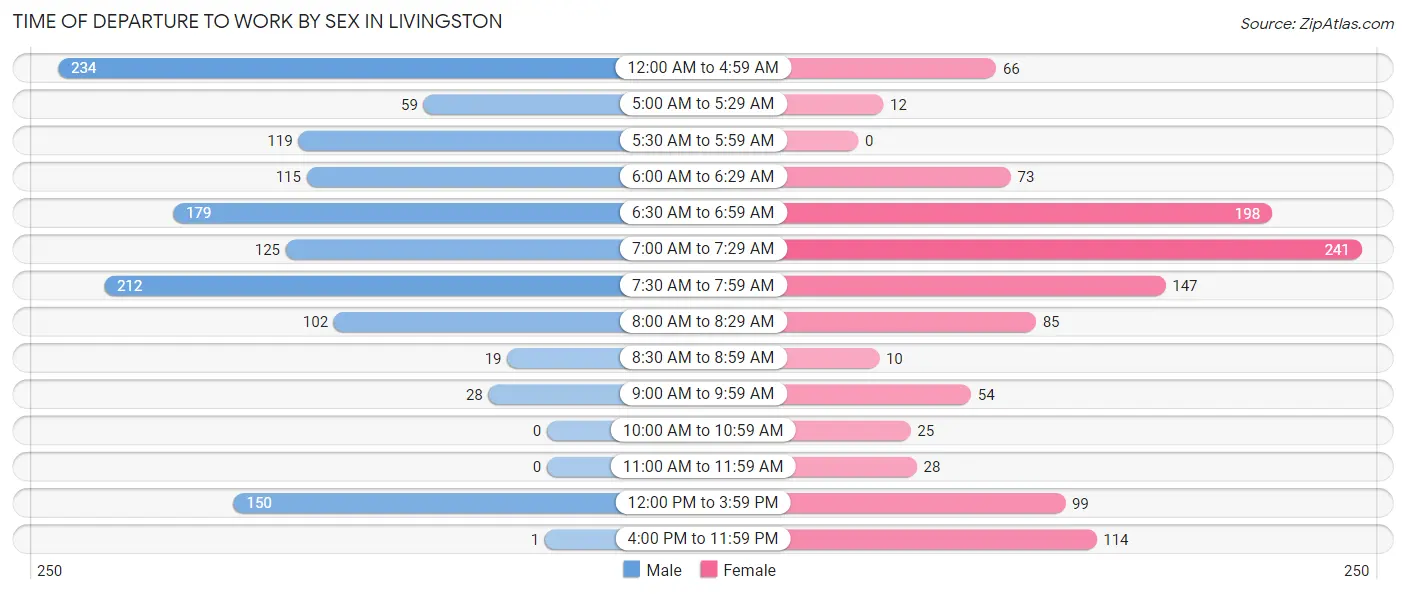
| Time of Departure | Male | Female |
| 12:00 AM to 4:59 AM | 234 (17.4%) | 66 (5.7%) |
| 5:00 AM to 5:29 AM | 59 (4.4%) | 12 (1.0%) |
| 5:30 AM to 5:59 AM | 119 (8.9%) | 0 (0.0%) |
| 6:00 AM to 6:29 AM | 115 (8.6%) | 73 (6.3%) |
| 6:30 AM to 6:59 AM | 179 (13.3%) | 198 (17.2%) |
| 7:00 AM to 7:29 AM | 125 (9.3%) | 241 (20.9%) |
| 7:30 AM to 7:59 AM | 212 (15.8%) | 147 (12.8%) |
| 8:00 AM to 8:29 AM | 102 (7.6%) | 85 (7.4%) |
| 8:30 AM to 8:59 AM | 19 (1.4%) | 10 (0.9%) |
| 9:00 AM to 9:59 AM | 28 (2.1%) | 54 (4.7%) |
| 10:00 AM to 10:59 AM | 0 (0.0%) | 25 (2.2%) |
| 11:00 AM to 11:59 AM | 0 (0.0%) | 28 (2.4%) |
| 12:00 PM to 3:59 PM | 150 (11.2%) | 99 (8.6%) |
| 4:00 PM to 11:59 PM | 1 (0.1%) | 114 (9.9%) |
| Total | 1,343 (100.0%) | 1,152 (100.0%) |
Housing Occupancy in Livingston
Occupancy by Ownership in Livingston
Of the total 2,340 dwellings in Livingston, owner-occupied units account for 1,215 (51.9%), while renter-occupied units make up 1,125 (48.1%).
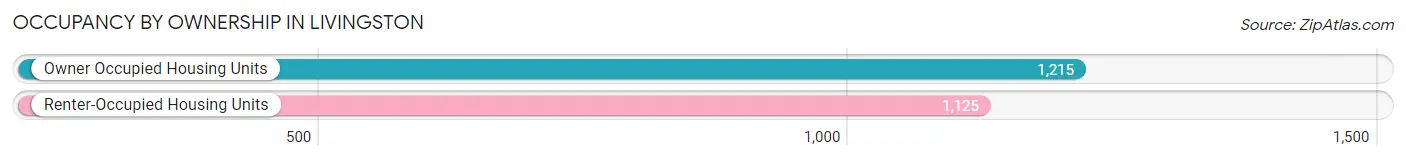
| Occupancy | # Housing Units | % Housing Units |
| Owner Occupied Housing Units | 1,215 | 51.9% |
| Renter-Occupied Housing Units | 1,125 | 48.1% |
| Total Occupied Housing Units | 2,340 | 100.0% |
Occupancy by Household Size in Livingston
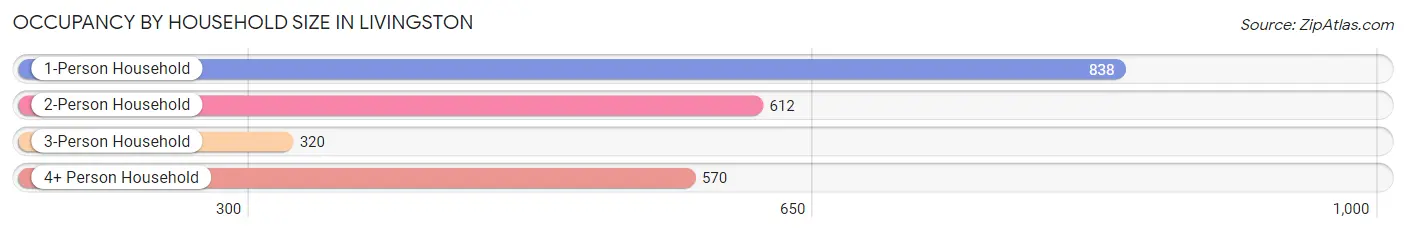
| Household Size | # Housing Units | % Housing Units |
| 1-Person Household | 838 | 35.8% |
| 2-Person Household | 612 | 26.2% |
| 3-Person Household | 320 | 13.7% |
| 4+ Person Household | 570 | 24.4% |
| Total Housing Units | 2,340 | 100.0% |
Occupancy by Ownership by Household Size in Livingston
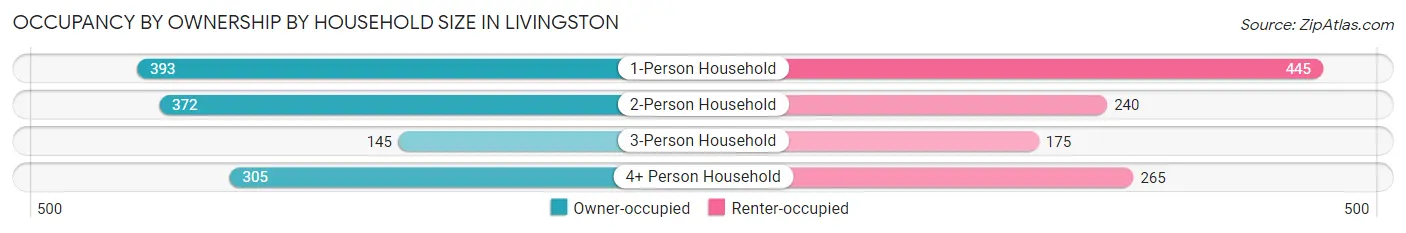
| Household Size | Owner-occupied | Renter-occupied |
| 1-Person Household | 393 (46.9%) | 445 (53.1%) |
| 2-Person Household | 372 (60.8%) | 240 (39.2%) |
| 3-Person Household | 145 (45.3%) | 175 (54.7%) |
| 4+ Person Household | 305 (53.5%) | 265 (46.5%) |
| Total Housing Units | 1,215 (51.9%) | 1,125 (48.1%) |
Occupancy by Educational Attainment in Livingston
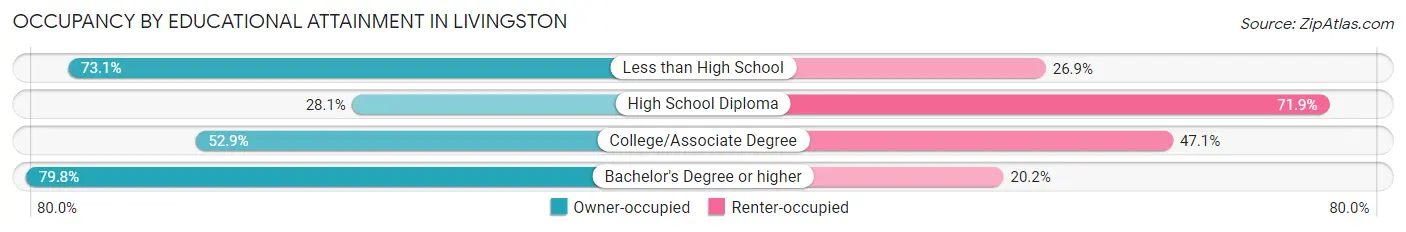
| Household Size | Owner-occupied | Renter-occupied |
| Less than High School | 315 (73.1%) | 116 (26.9%) |
| High School Diploma | 241 (28.1%) | 616 (71.9%) |
| College/Associate Degree | 355 (52.9%) | 316 (47.1%) |
| Bachelor's Degree or higher | 304 (79.8%) | 77 (20.2%) |
Occupancy by Age of Householder in Livingston
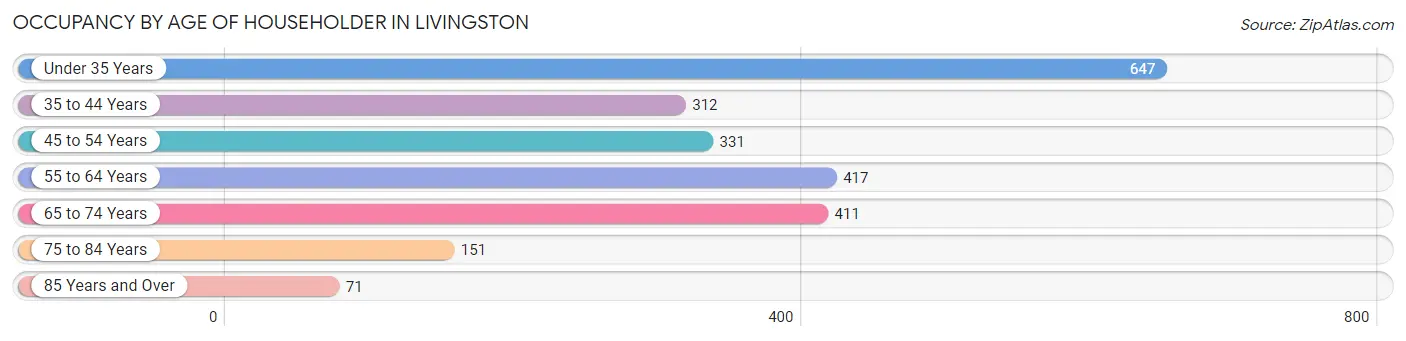
| Age Bracket | # Households | % Households |
| Under 35 Years | 647 | 27.7% |
| 35 to 44 Years | 312 | 13.3% |
| 45 to 54 Years | 331 | 14.1% |
| 55 to 64 Years | 417 | 17.8% |
| 65 to 74 Years | 411 | 17.6% |
| 75 to 84 Years | 151 | 6.5% |
| 85 Years and Over | 71 | 3.0% |
| Total | 2,340 | 100.0% |
Housing Finances in Livingston
Median Income by Occupancy in Livingston
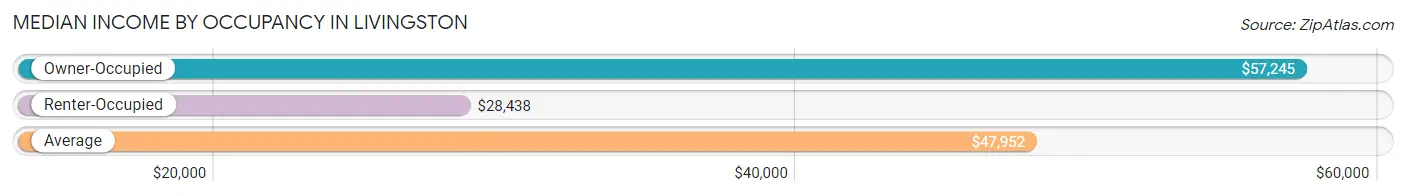
| Occupancy Type | # Households | Median Income |
| Owner-Occupied | 1,215 (51.9%) | $57,245 |
| Renter-Occupied | 1,125 (48.1%) | $28,438 |
| Average | 2,340 (100.0%) | $47,952 |
Occupancy by Householder Income Bracket in Livingston
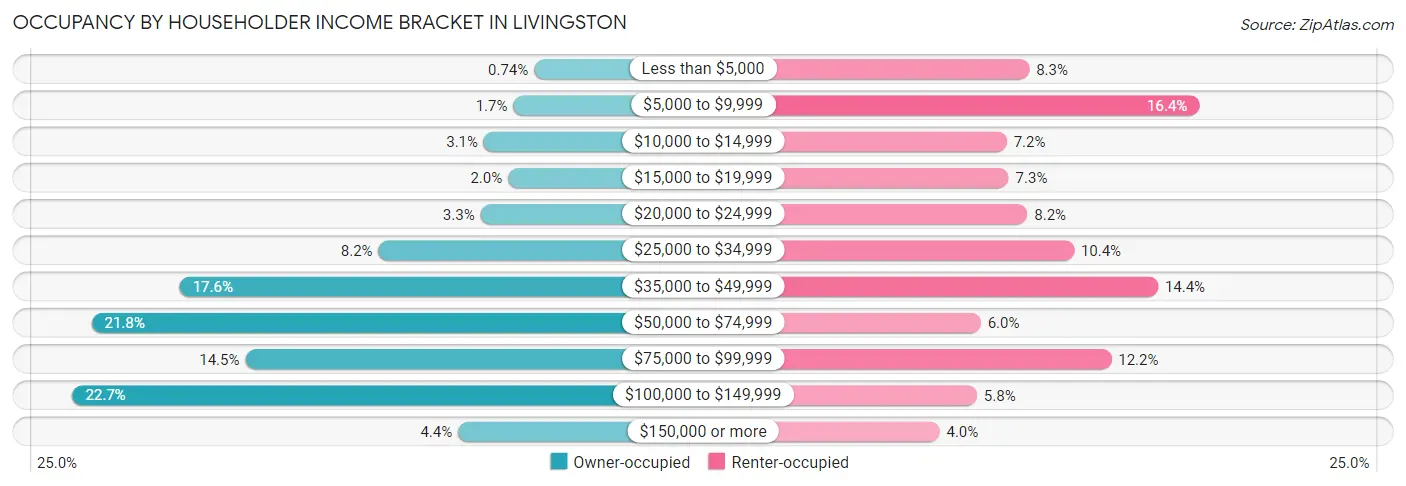
| Income Bracket | Owner-occupied | Renter-occupied |
| Less than $5,000 | 9 (0.7%) | 93 (8.3%) |
| $5,000 to $9,999 | 21 (1.7%) | 184 (16.4%) |
| $10,000 to $14,999 | 38 (3.1%) | 81 (7.2%) |
| $15,000 to $19,999 | 24 (2.0%) | 82 (7.3%) |
| $20,000 to $24,999 | 40 (3.3%) | 92 (8.2%) |
| $25,000 to $34,999 | 99 (8.2%) | 117 (10.4%) |
| $35,000 to $49,999 | 214 (17.6%) | 162 (14.4%) |
| $50,000 to $74,999 | 265 (21.8%) | 67 (6.0%) |
| $75,000 to $99,999 | 176 (14.5%) | 137 (12.2%) |
| $100,000 to $149,999 | 276 (22.7%) | 65 (5.8%) |
| $150,000 or more | 53 (4.4%) | 45 (4.0%) |
| Total | 1,215 (100.0%) | 1,125 (100.0%) |
Monthly Housing Cost Tiers in Livingston
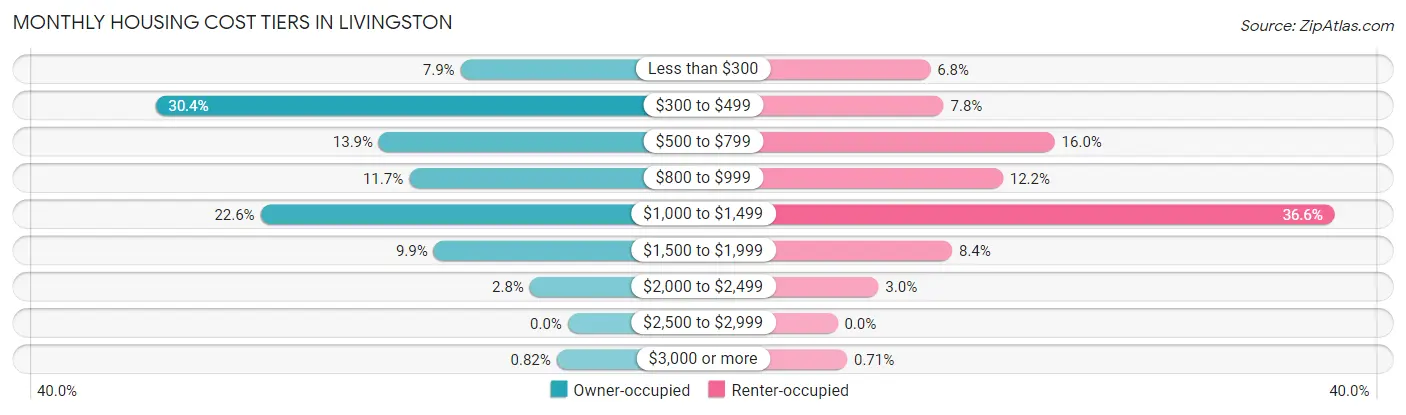
| Monthly Cost | Owner-occupied | Renter-occupied |
| Less than $300 | 96 (7.9%) | 77 (6.8%) |
| $300 to $499 | 369 (30.4%) | 88 (7.8%) |
| $500 to $799 | 169 (13.9%) | 180 (16.0%) |
| $800 to $999 | 142 (11.7%) | 137 (12.2%) |
| $1,000 to $1,499 | 275 (22.6%) | 412 (36.6%) |
| $1,500 to $1,999 | 120 (9.9%) | 95 (8.4%) |
| $2,000 to $2,499 | 34 (2.8%) | 34 (3.0%) |
| $2,500 to $2,999 | 0 (0.0%) | 0 (0.0%) |
| $3,000 or more | 10 (0.8%) | 8 (0.7%) |
| Total | 1,215 (100.0%) | 1,125 (100.0%) |
Physical Housing Characteristics in Livingston
Housing Structures in Livingston
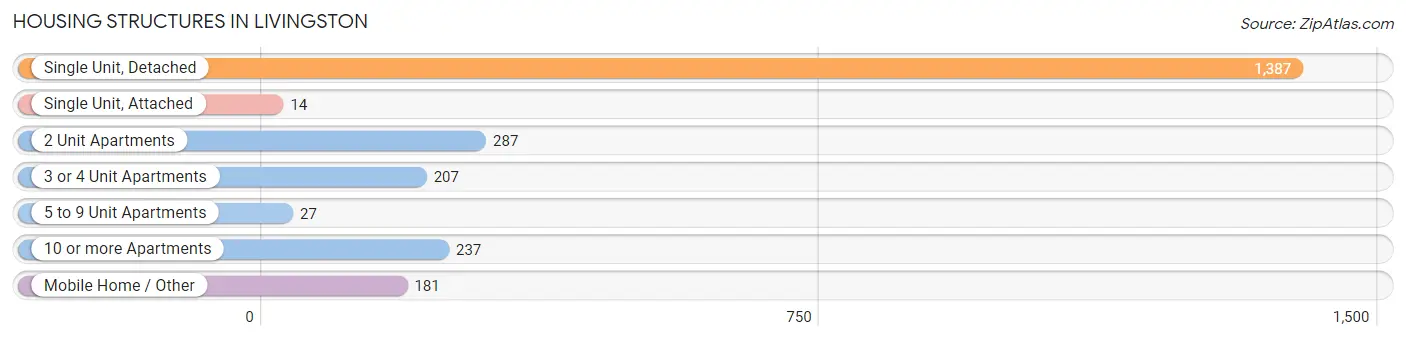
| Structure Type | # Housing Units | % Housing Units |
| Single Unit, Detached | 1,387 | 59.3% |
| Single Unit, Attached | 14 | 0.6% |
| 2 Unit Apartments | 287 | 12.3% |
| 3 or 4 Unit Apartments | 207 | 8.8% |
| 5 to 9 Unit Apartments | 27 | 1.1% |
| 10 or more Apartments | 237 | 10.1% |
| Mobile Home / Other | 181 | 7.7% |
| Total | 2,340 | 100.0% |
Housing Structures by Occupancy in Livingston
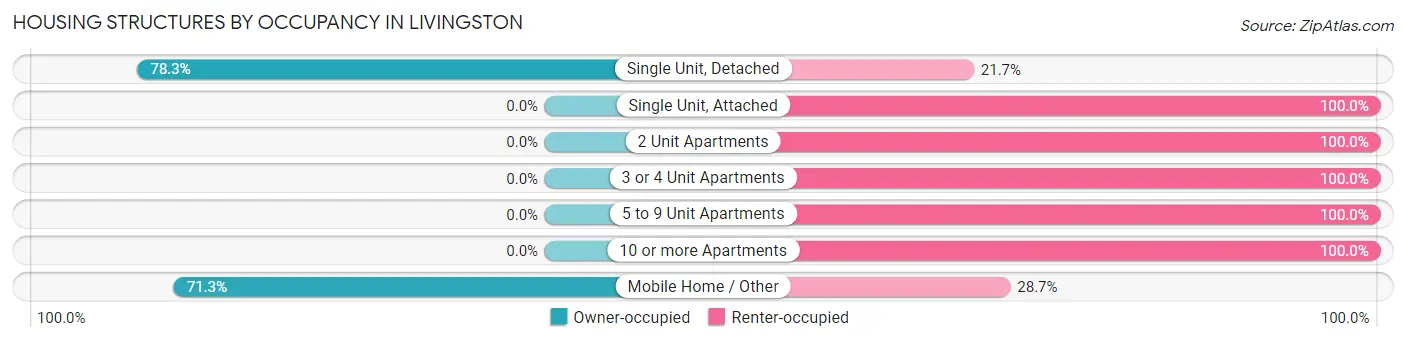
| Structure Type | Owner-occupied | Renter-occupied |
| Single Unit, Detached | 1,086 (78.3%) | 301 (21.7%) |
| Single Unit, Attached | 0 (0.0%) | 14 (100.0%) |
| 2 Unit Apartments | 0 (0.0%) | 287 (100.0%) |
| 3 or 4 Unit Apartments | 0 (0.0%) | 207 (100.0%) |
| 5 to 9 Unit Apartments | 0 (0.0%) | 27 (100.0%) |
| 10 or more Apartments | 0 (0.0%) | 237 (100.0%) |
| Mobile Home / Other | 129 (71.3%) | 52 (28.7%) |
| Total | 1,215 (51.9%) | 1,125 (48.1%) |
Housing Structures by Number of Rooms in Livingston
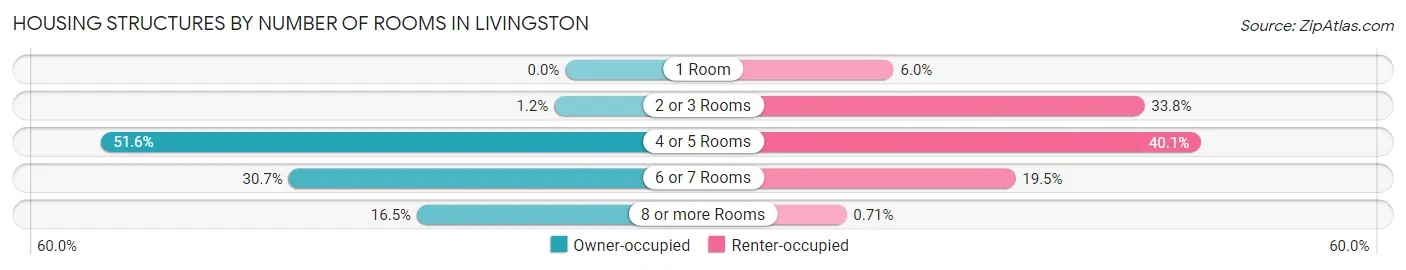
| Number of Rooms | Owner-occupied | Renter-occupied |
| 1 Room | 0 (0.0%) | 67 (6.0%) |
| 2 or 3 Rooms | 15 (1.2%) | 380 (33.8%) |
| 4 or 5 Rooms | 627 (51.6%) | 451 (40.1%) |
| 6 or 7 Rooms | 373 (30.7%) | 219 (19.5%) |
| 8 or more Rooms | 200 (16.5%) | 8 (0.7%) |
| Total | 1,215 (100.0%) | 1,125 (100.0%) |
Housing Structure by Heating Type in Livingston
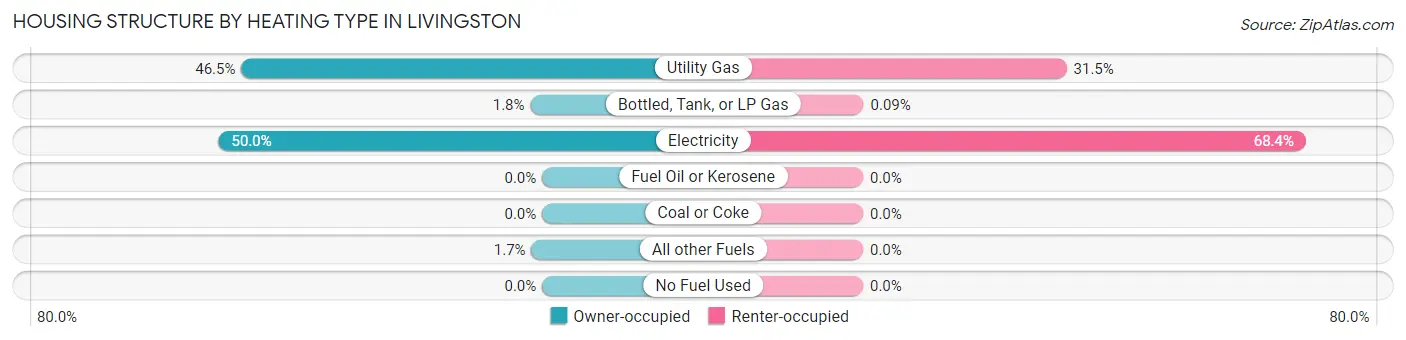
| Heating Type | Owner-occupied | Renter-occupied |
| Utility Gas | 565 (46.5%) | 354 (31.5%) |
| Bottled, Tank, or LP Gas | 22 (1.8%) | 1 (0.1%) |
| Electricity | 608 (50.0%) | 770 (68.4%) |
| Fuel Oil or Kerosene | 0 (0.0%) | 0 (0.0%) |
| Coal or Coke | 0 (0.0%) | 0 (0.0%) |
| All other Fuels | 20 (1.7%) | 0 (0.0%) |
| No Fuel Used | 0 (0.0%) | 0 (0.0%) |
| Total | 1,215 (100.0%) | 1,125 (100.0%) |
Household Vehicle Usage in Livingston
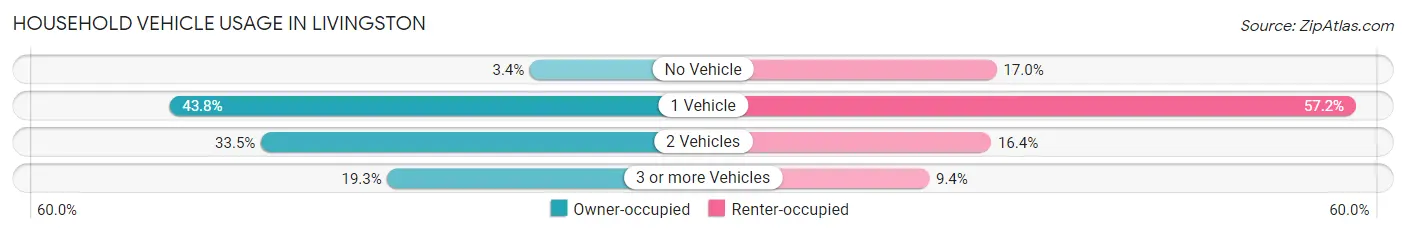
| Vehicles per Household | Owner-occupied | Renter-occupied |
| No Vehicle | 41 (3.4%) | 191 (17.0%) |
| 1 Vehicle | 532 (43.8%) | 644 (57.2%) |
| 2 Vehicles | 407 (33.5%) | 184 (16.4%) |
| 3 or more Vehicles | 235 (19.3%) | 106 (9.4%) |
| Total | 1,215 (100.0%) | 1,125 (100.0%) |
Real Estate & Mortgages in Livingston
Real Estate and Mortgage Overview in Livingston
| Characteristic | Without Mortgage | With Mortgage |
| Housing Units | 701 | 514 |
| Median Property Value | $114,300 | $175,900 |
| Median Household Income | $52,150 | $31 |
| Monthly Housing Costs | $452 | $10 |
| Real Estate Taxes | $977 | $18 |
Property Value by Mortgage Status in Livingston
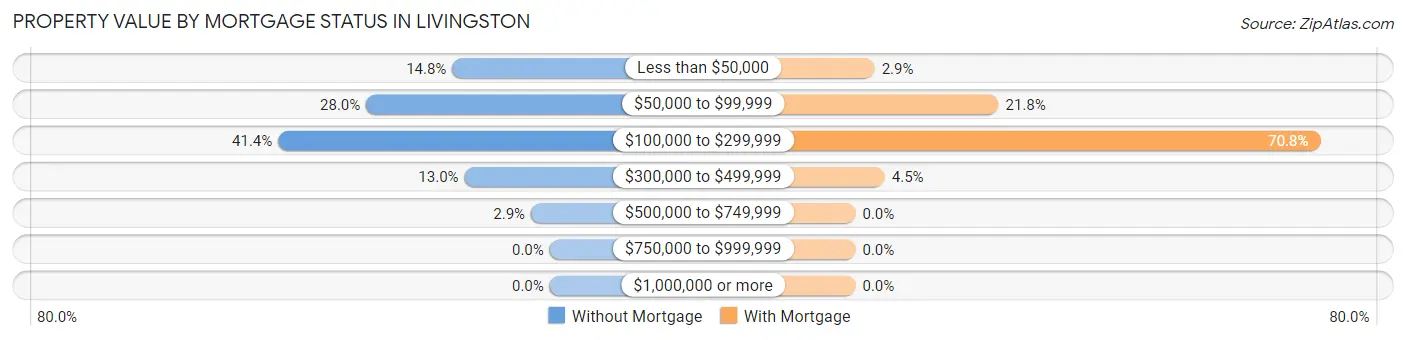
| Property Value | Without Mortgage | With Mortgage |
| Less than $50,000 | 104 (14.8%) | 15 (2.9%) |
| $50,000 to $99,999 | 196 (28.0%) | 112 (21.8%) |
| $100,000 to $299,999 | 290 (41.4%) | 364 (70.8%) |
| $300,000 to $499,999 | 91 (13.0%) | 23 (4.5%) |
| $500,000 to $749,999 | 20 (2.9%) | 0 (0.0%) |
| $750,000 to $999,999 | 0 (0.0%) | 0 (0.0%) |
| $1,000,000 or more | 0 (0.0%) | 0 (0.0%) |
| Total | 701 (100.0%) | 514 (100.0%) |
Household Income by Mortgage Status in Livingston
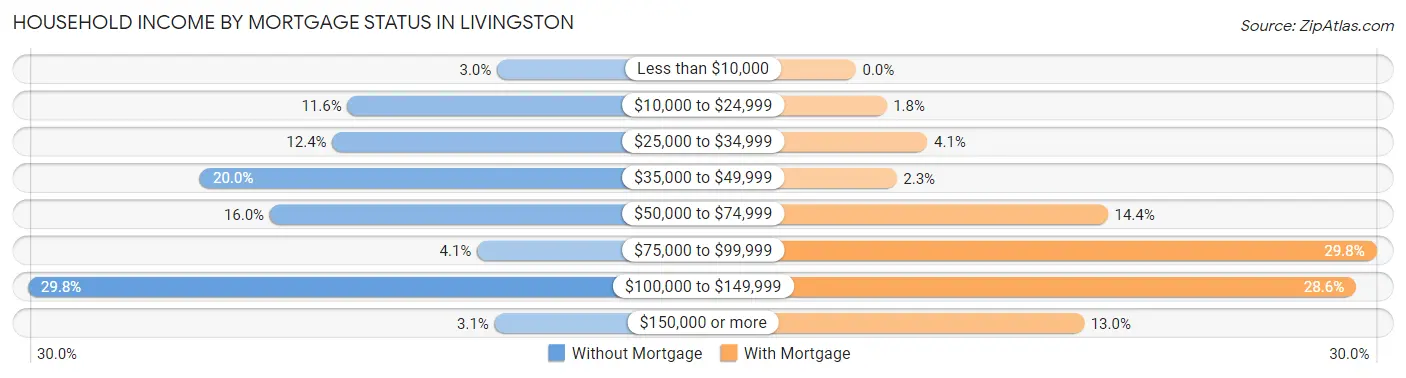
| Household Income | Without Mortgage | With Mortgage |
| Less than $10,000 | 21 (3.0%) | 0 (0.0%) |
| $10,000 to $24,999 | 81 (11.6%) | 9 (1.8%) |
| $25,000 to $34,999 | 87 (12.4%) | 21 (4.1%) |
| $35,000 to $49,999 | 140 (20.0%) | 12 (2.3%) |
| $50,000 to $74,999 | 112 (16.0%) | 74 (14.4%) |
| $75,000 to $99,999 | 29 (4.1%) | 153 (29.8%) |
| $100,000 to $149,999 | 209 (29.8%) | 147 (28.6%) |
| $150,000 or more | 22 (3.1%) | 67 (13.0%) |
| Total | 701 (100.0%) | 514 (100.0%) |
Property Value to Household Income Ratio in Livingston
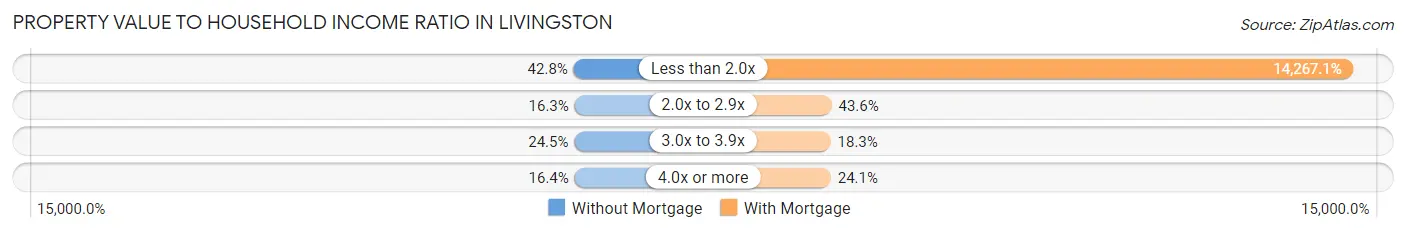
| Value-to-Income Ratio | Without Mortgage | With Mortgage |
| Less than 2.0x | 300 (42.8%) | 73,333 (14,267.1%) |
| 2.0x to 2.9x | 114 (16.3%) | 224 (43.6%) |
| 3.0x to 3.9x | 172 (24.5%) | 94 (18.3%) |
| 4.0x or more | 115 (16.4%) | 124 (24.1%) |
| Total | 701 (100.0%) | 514 (100.0%) |
Real Estate Taxes by Mortgage Status in Livingston
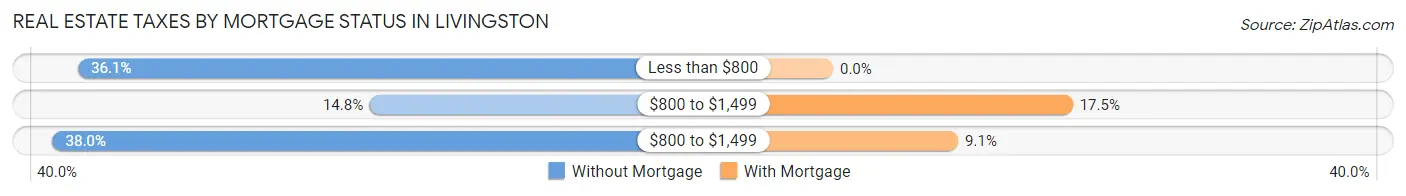
| Property Taxes | Without Mortgage | With Mortgage |
| Less than $800 | 253 (36.1%) | 0 (0.0%) |
| $800 to $1,499 | 104 (14.8%) | 90 (17.5%) |
| $800 to $1,499 | 266 (38.0%) | 47 (9.1%) |
| Total | 701 (100.0%) | 514 (100.0%) |
Health & Disability in Livingston
Health Insurance Coverage by Age in Livingston
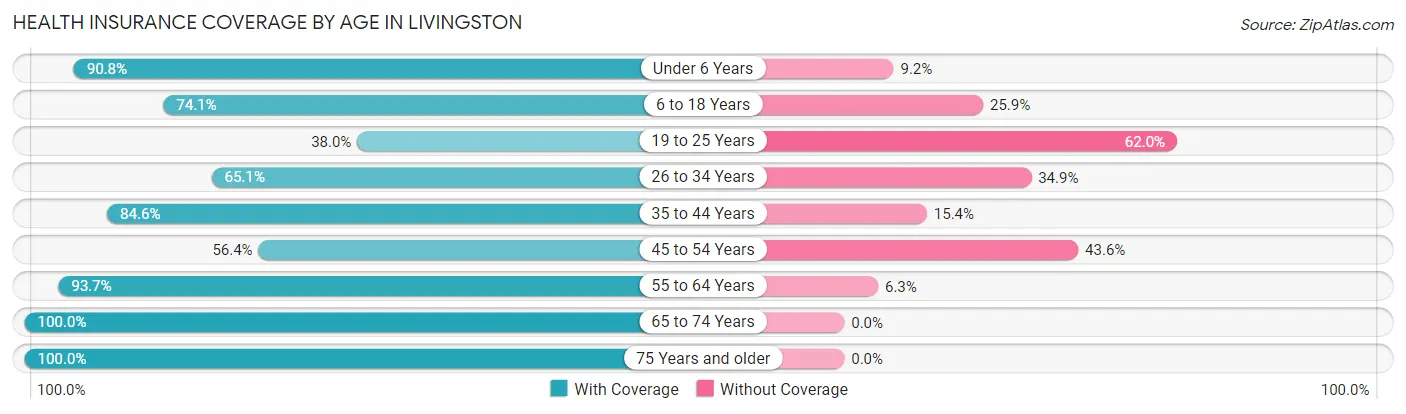
| Age Bracket | With Coverage | Without Coverage |
| Under 6 Years | 376 (90.8%) | 38 (9.2%) |
| 6 to 18 Years | 802 (74.1%) | 280 (25.9%) |
| 19 to 25 Years | 139 (38.0%) | 227 (62.0%) |
| 26 to 34 Years | 555 (65.1%) | 297 (34.9%) |
| 35 to 44 Years | 445 (84.6%) | 81 (15.4%) |
| 45 to 54 Years | 362 (56.4%) | 280 (43.6%) |
| 55 to 64 Years | 641 (93.7%) | 43 (6.3%) |
| 65 to 74 Years | 524 (100.0%) | 0 (0.0%) |
| 75 Years and older | 308 (100.0%) | 0 (0.0%) |
| Total | 4,152 (76.9%) | 1,246 (23.1%) |
Health Insurance Coverage by Citizenship Status in Livingston
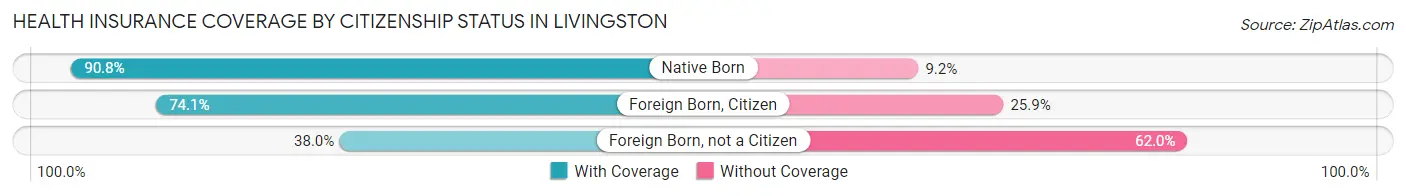
| Citizenship Status | With Coverage | Without Coverage |
| Native Born | 376 (90.8%) | 38 (9.2%) |
| Foreign Born, Citizen | 802 (74.1%) | 280 (25.9%) |
| Foreign Born, not a Citizen | 139 (38.0%) | 227 (62.0%) |
Health Insurance Coverage by Household Income in Livingston
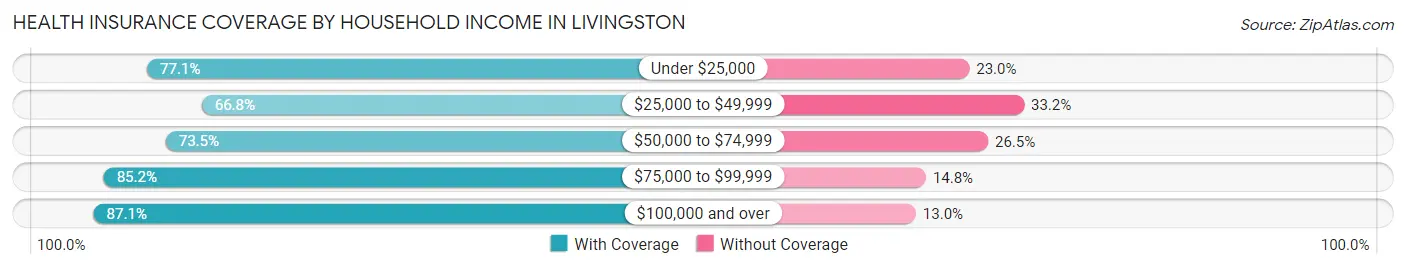
| Household Income | With Coverage | Without Coverage |
| Under $25,000 | 883 (77.0%) | 263 (23.0%) |
| $25,000 to $49,999 | 877 (66.8%) | 436 (33.2%) |
| $50,000 to $74,999 | 792 (73.5%) | 285 (26.5%) |
| $75,000 to $99,999 | 586 (85.2%) | 102 (14.8%) |
| $100,000 and over | 995 (87.1%) | 148 (13.0%) |
Public vs Private Health Insurance Coverage by Age in Livingston
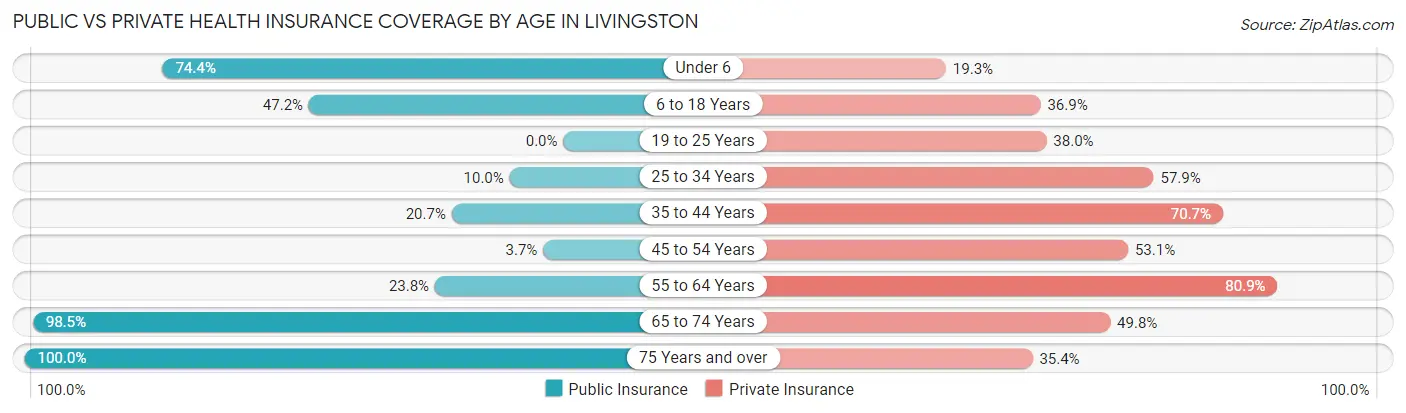
| Age Bracket | Public Insurance | Private Insurance |
| Under 6 | 308 (74.4%) | 80 (19.3%) |
| 6 to 18 Years | 511 (47.2%) | 399 (36.9%) |
| 19 to 25 Years | 0 (0.0%) | 139 (38.0%) |
| 25 to 34 Years | 85 (10.0%) | 493 (57.9%) |
| 35 to 44 Years | 109 (20.7%) | 372 (70.7%) |
| 45 to 54 Years | 24 (3.7%) | 341 (53.1%) |
| 55 to 64 Years | 163 (23.8%) | 553 (80.8%) |
| 65 to 74 Years | 516 (98.5%) | 261 (49.8%) |
| 75 Years and over | 308 (100.0%) | 109 (35.4%) |
| Total | 2,024 (37.5%) | 2,747 (50.9%) |
Disability Status by Sex by Age in Livingston
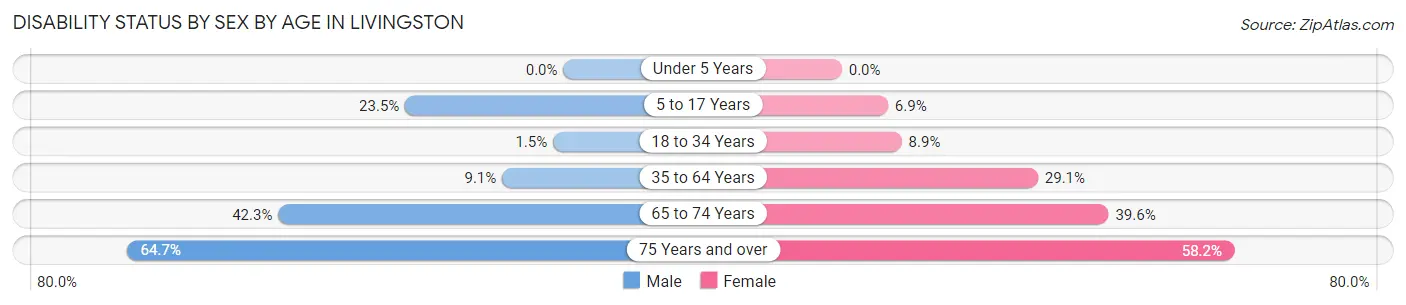
| Age Bracket | Male | Female |
| Under 5 Years | 0 (0.0%) | 0 (0.0%) |
| 5 to 17 Years | 132 (23.5%) | 35 (6.9%) |
| 18 to 34 Years | 11 (1.5%) | 51 (8.9%) |
| 35 to 64 Years | 75 (9.1%) | 299 (29.1%) |
| 65 to 74 Years | 116 (42.3%) | 99 (39.6%) |
| 75 Years and over | 77 (64.7%) | 110 (58.2%) |
Disability Class by Sex by Age in Livingston
Disability Class: Hearing Difficulty
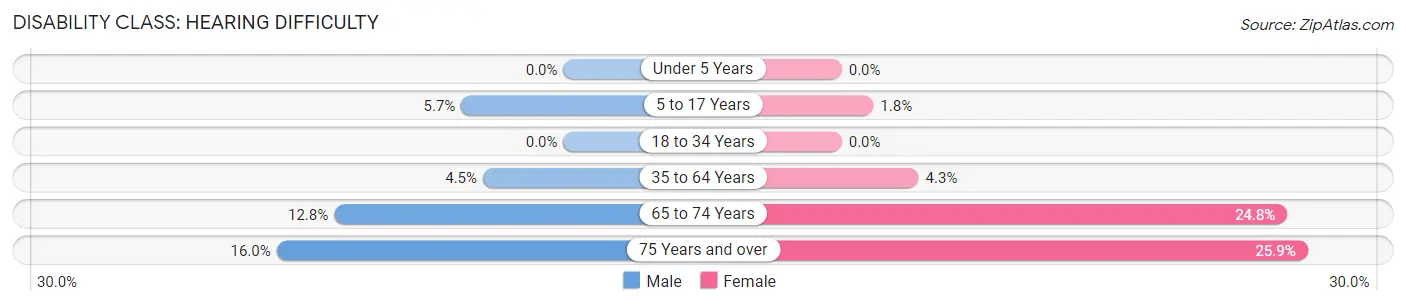
| Age Bracket | Male | Female |
| Under 5 Years | 0 (0.0%) | 0 (0.0%) |
| 5 to 17 Years | 32 (5.7%) | 9 (1.8%) |
| 18 to 34 Years | 0 (0.0%) | 0 (0.0%) |
| 35 to 64 Years | 37 (4.5%) | 44 (4.3%) |
| 65 to 74 Years | 35 (12.8%) | 62 (24.8%) |
| 75 Years and over | 19 (16.0%) | 49 (25.9%) |
Disability Class: Vision Difficulty
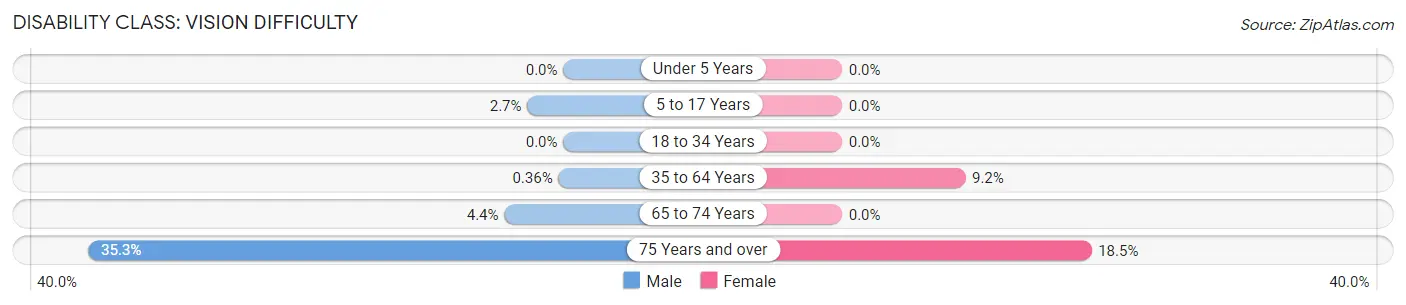
| Age Bracket | Male | Female |
| Under 5 Years | 0 (0.0%) | 0 (0.0%) |
| 5 to 17 Years | 15 (2.7%) | 0 (0.0%) |
| 18 to 34 Years | 0 (0.0%) | 0 (0.0%) |
| 35 to 64 Years | 3 (0.4%) | 94 (9.1%) |
| 65 to 74 Years | 12 (4.4%) | 0 (0.0%) |
| 75 Years and over | 42 (35.3%) | 35 (18.5%) |
Disability Class: Cognitive Difficulty
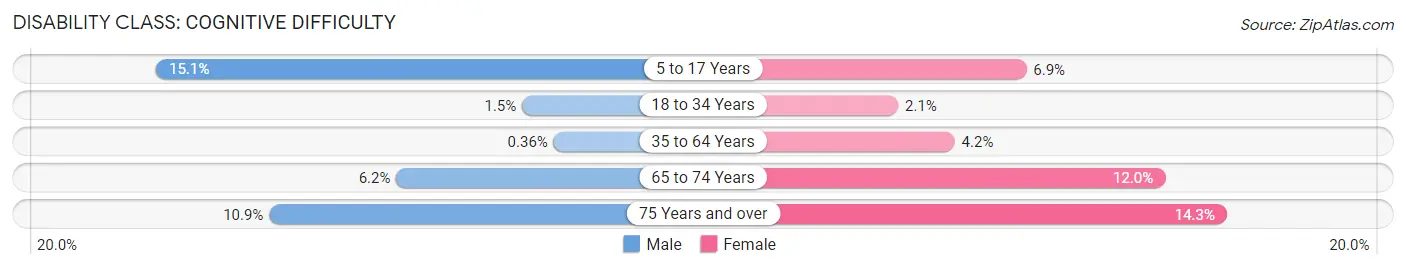
| Age Bracket | Male | Female |
| 5 to 17 Years | 85 (15.1%) | 35 (6.9%) |
| 18 to 34 Years | 11 (1.5%) | 12 (2.1%) |
| 35 to 64 Years | 3 (0.4%) | 43 (4.2%) |
| 65 to 74 Years | 17 (6.2%) | 30 (12.0%) |
| 75 Years and over | 13 (10.9%) | 27 (14.3%) |
Disability Class: Ambulatory Difficulty
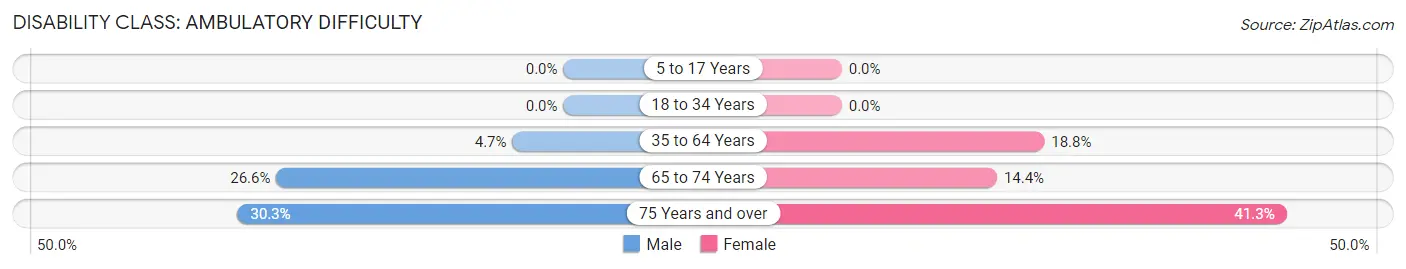
| Age Bracket | Male | Female |
| 5 to 17 Years | 0 (0.0%) | 0 (0.0%) |
| 18 to 34 Years | 0 (0.0%) | 0 (0.0%) |
| 35 to 64 Years | 39 (4.7%) | 193 (18.8%) |
| 65 to 74 Years | 73 (26.6%) | 36 (14.4%) |
| 75 Years and over | 36 (30.2%) | 78 (41.3%) |
Disability Class: Self-Care Difficulty
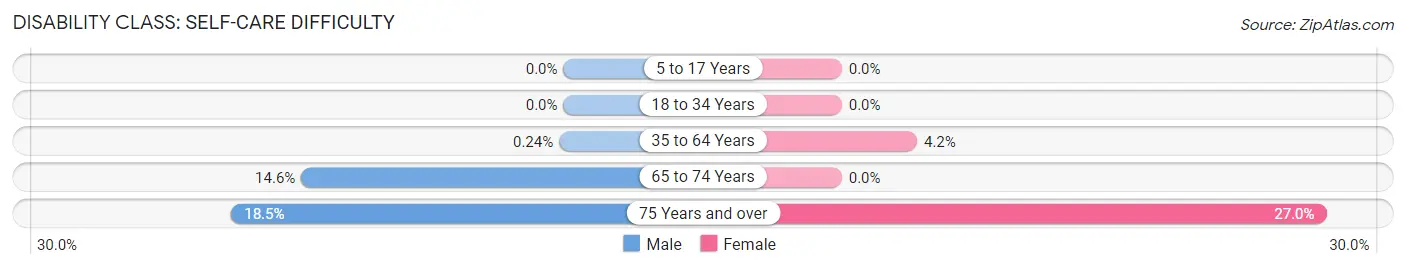
| Age Bracket | Male | Female |
| 5 to 17 Years | 0 (0.0%) | 0 (0.0%) |
| 18 to 34 Years | 0 (0.0%) | 0 (0.0%) |
| 35 to 64 Years | 2 (0.2%) | 43 (4.2%) |
| 65 to 74 Years | 40 (14.6%) | 0 (0.0%) |
| 75 Years and over | 22 (18.5%) | 51 (27.0%) |
Technology Access in Livingston
Computing Device Access in Livingston
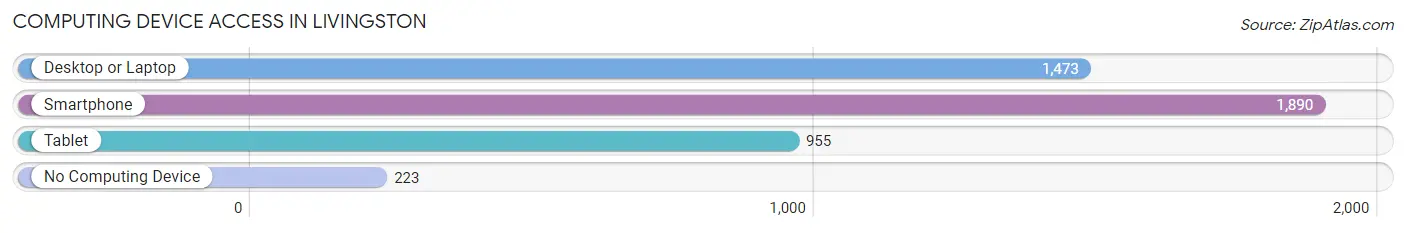
| Device Type | # Households | % Households |
| Desktop or Laptop | 1,473 | 62.9% |
| Smartphone | 1,890 | 80.8% |
| Tablet | 955 | 40.8% |
| No Computing Device | 223 | 9.5% |
| Total | 2,340 | 100.0% |
Internet Access in Livingston
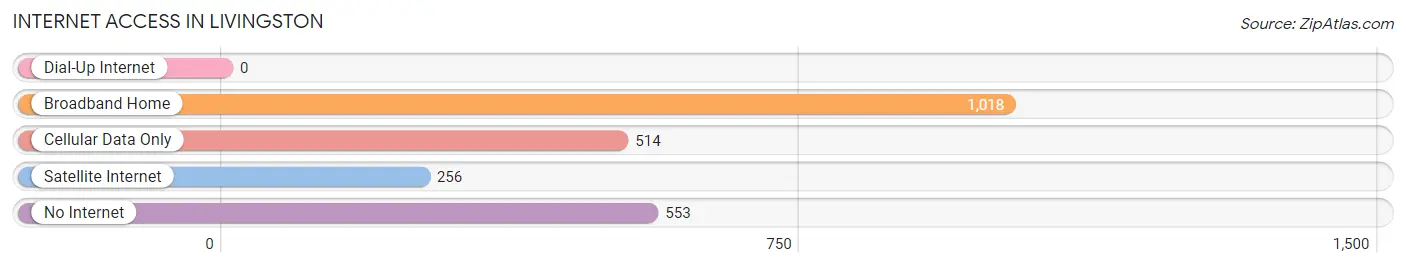
| Internet Type | # Households | % Households |
| Dial-Up Internet | 0 | 0.0% |
| Broadband Home | 1,018 | 43.5% |
| Cellular Data Only | 514 | 22.0% |
| Satellite Internet | 256 | 10.9% |
| No Internet | 553 | 23.6% |
| Total | 2,340 | 100.0% |
Livingston Summary
Livingston, Texas is a small city located in Polk County, Texas, United States. It is the county seat of Polk County and is located approximately 75 miles north of Houston. The city has a population of approximately 5,335 people as of the 2010 census.
History
Livingston was founded in 1835 by William H. Livingston, a veteran of the Texas Revolution. The city was named after him and was originally known as Springfield. The city was incorporated in 1846 and was the first county seat of Polk County. The city was a major trading center for the area and was home to several businesses, including a cotton gin, a sawmill, and a gristmill.
In the late 19th century, the city was a major stop on the Houston and Great Northern Railroad. The railroad brought in many new settlers and businesses to the area, and the city grew rapidly. By the early 20th century, the city had become a major center for the lumber industry.
Geography
Livingston is located in the Piney Woods region of East Texas. The city is situated on the banks of the Trinity River and is surrounded by pine forests. The city has a total area of 4.3 square miles, all of which is land.
The climate in Livingston is humid subtropical, with hot summers and mild winters. The average annual temperature is 68 degrees Fahrenheit, and the average annual precipitation is 45 inches.
Economy
Livingston’s economy is largely based on the lumber industry. The city is home to several lumber mills, and the surrounding area is home to many timber farms. The city is also home to several manufacturing companies, including a paper mill and a plastics factory.
The city is also home to several retail stores, restaurants, and other businesses. The city is also home to a hospital, a community college, and a public library.
Demographics
As of the 2010 census, the population of Livingston was 5,335. The racial makeup of the city was 79.3% White, 15.2% African American, 0.7% Native American, 0.5% Asian, 0.1% Pacific Islander, 2.2% from other races, and 2.1% from two or more races. Hispanic or Latino of any race were 6.3% of the population.
The median income for a household in the city was $30,938, and the median income for a family was $37,917. The per capita income for the city was $17,845. About 17.3% of families and 20.7% of the population were below the poverty line, including 28.3% of those under age 18 and 14.2% of those age 65 or over.
Livingston is a small city with a rich history and a diverse economy. The city is home to many businesses and is a major center for the lumber industry. The city has a diverse population and is a great place to live and work.
Common Questions
What is Per Capita Income in Livingston?
Per Capita income in Livingston is $25,277.
What is the Median Family Income in Livingston?
Median Family Income in Livingston is $50,697.
What is the Median Household income in Livingston?
Median Household Income in Livingston is $47,952.
What is Income or Wage Gap in Livingston?
Income or Wage Gap in Livingston is 56.0%.
Women in Livingston earn 44.0 cents for every dollar earned by a man.
What is Inequality or Gini Index in Livingston?
Inequality or Gini Index in Livingston is 0.44.
What is the Total Population of Livingston?
Total Population of Livingston is 5,672.
What is the Total Male Population of Livingston?
Total Male Population of Livingston is 2,787.
What is the Total Female Population of Livingston?
Total Female Population of Livingston is 2,885.
What is the Ratio of Males per 100 Females in Livingston?
There are 96.60 Males per 100 Females in Livingston.
What is the Ratio of Females per 100 Males in Livingston?
There are 103.52 Females per 100 Males in Livingston.
What is the Median Population Age in Livingston?
Median Population Age in Livingston is 36.9 Years.
What is the Average Family Size in Livingston
Average Family Size in Livingston is 3.0 People.
What is the Average Household Size in Livingston
Average Household Size in Livingston is 2.3 People.
How Large is the Labor Force in Livingston?
There are 2,744 People in the Labor Forcein in Livingston.
What is the Percentage of People in the Labor Force in Livingston?
61.3% of People are in the Labor Force in Livingston.
What is the Unemployment Rate in Livingston?
Unemployment Rate in Livingston is 6.5%.