Rotan, TX Map & Demographics
Rotan Map
Rotan Overview
$26,370
PER CAPITA INCOME
$51,607
AVG FAMILY INCOME
$39,861
AVG HOUSEHOLD INCOME
40.1%
WAGE / INCOME GAP [ % ]
59.9¢/ $1
WAGE / INCOME GAP [ $ ]
0.46
INEQUALITY / GINI INDEX
1,270
TOTAL POPULATION
602
MALE POPULATION
668
FEMALE POPULATION
90.12
MALES / 100 FEMALES
110.96
FEMALES / 100 MALES
39.0
MEDIAN AGE
3.1
AVG FAMILY SIZE
2.5
AVG HOUSEHOLD SIZE
629
LABOR FORCE [ PEOPLE ]
62.4%
PERCENT IN LABOR FORCE
4.1%
UNEMPLOYMENT RATE
Rotan Zip Codes
Rotan Area Codes
Income in Rotan
Income Overview in Rotan
Per Capita Income in Rotan is $26,370, while median incomes of families and households are $51,607 and $39,861 respectively.
| Characteristic | Number | Measure |
| Per Capita Income | 1,270 | $26,370 |
| Median Family Income | 327 | $51,607 |
| Mean Family Income | 327 | $65,501 |
| Median Household Income | 503 | $39,861 |
| Mean Household Income | 503 | $56,695 |
| Income Deficit | 327 | $0 |
| Wage / Income Gap (%) | 1,270 | 40.06% |
| Wage / Income Gap ($) | 1,270 | 59.94¢ per $1 |
| Gini / Inequality Index | 1,270 | 0.46 |
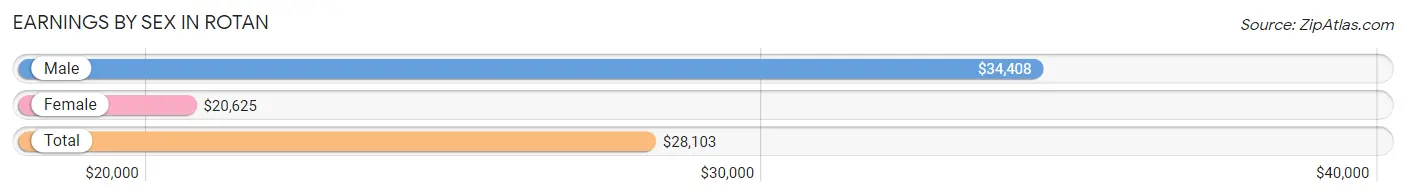
Earnings by Sex in Rotan
Average Earnings in Rotan are $28,103, $34,408 for men and $20,625 for women, a difference of 40.1%.
| Sex | Number | Average Earnings |
| Male | 399 (59.7%) | $34,408 |
| Female | 269 (40.3%) | $20,625 |
| Total | 668 (100.0%) | $28,103 |
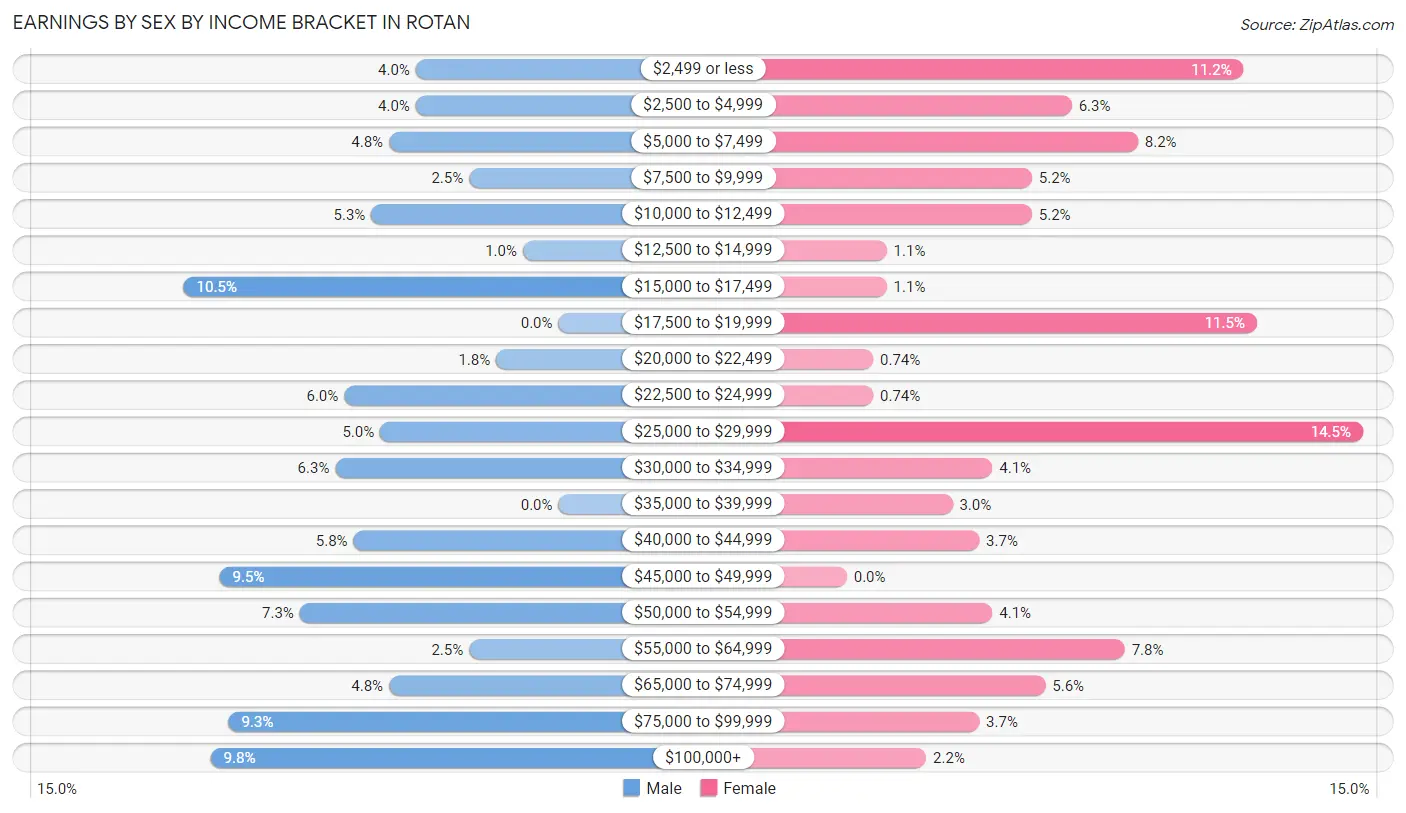
Earnings by Sex by Income Bracket in Rotan
The most common earnings brackets in Rotan are $15,000 to $17,499 for men (42 | 10.5%) and $25,000 to $29,999 for women (39 | 14.5%).
| Income | Male | Female |
| $2,499 or less | 16 (4.0%) | 30 (11.2%) |
| $2,500 to $4,999 | 16 (4.0%) | 17 (6.3%) |
| $5,000 to $7,499 | 19 (4.8%) | 22 (8.2%) |
| $7,500 to $9,999 | 10 (2.5%) | 14 (5.2%) |
| $10,000 to $12,499 | 21 (5.3%) | 14 (5.2%) |
| $12,500 to $14,999 | 4 (1.0%) | 3 (1.1%) |
| $15,000 to $17,499 | 42 (10.5%) | 3 (1.1%) |
| $17,500 to $19,999 | 0 (0.0%) | 31 (11.5%) |
| $20,000 to $22,499 | 7 (1.8%) | 2 (0.7%) |
| $22,500 to $24,999 | 24 (6.0%) | 2 (0.7%) |
| $25,000 to $29,999 | 20 (5.0%) | 39 (14.5%) |
| $30,000 to $34,999 | 25 (6.3%) | 11 (4.1%) |
| $35,000 to $39,999 | 0 (0.0%) | 8 (3.0%) |
| $40,000 to $44,999 | 23 (5.8%) | 10 (3.7%) |
| $45,000 to $49,999 | 38 (9.5%) | 0 (0.0%) |
| $50,000 to $54,999 | 29 (7.3%) | 11 (4.1%) |
| $55,000 to $64,999 | 10 (2.5%) | 21 (7.8%) |
| $65,000 to $74,999 | 19 (4.8%) | 15 (5.6%) |
| $75,000 to $99,999 | 37 (9.3%) | 10 (3.7%) |
| $100,000+ | 39 (9.8%) | 6 (2.2%) |
| Total | 399 (100.0%) | 269 (100.0%) |
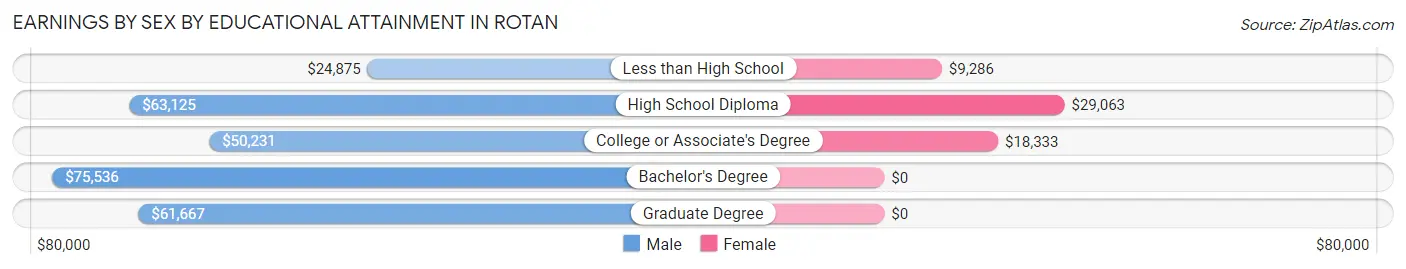
Earnings by Sex by Educational Attainment in Rotan
Average earnings in Rotan are $43,750 for men and $19,919 for women, a difference of 54.5%. Men with an educational attainment of bachelor's degree enjoy the highest average annual earnings of $75,536, while those with less than high school education earn the least with $24,875. Women with an educational attainment of high school diploma earn the most with the average annual earnings of $29,063, while those with less than high school education have the smallest earnings of $9,286.
| Educational Attainment | Male Income | Female Income |
| Less than High School | $24,875 | $9,286 |
| High School Diploma | $63,125 | $29,063 |
| College or Associate's Degree | $50,231 | $18,333 |
| Bachelor's Degree | $75,536 | $0 |
| Graduate Degree | $61,667 | $0 |
| Total | $43,750 | $19,919 |
Family Income in Rotan
Family Income Brackets in Rotan
According to the Rotan family income data, there are 53 families falling into the $50,000 to $74,999 income range, which is the most common income bracket and makes up 16.2% of all families. Conversely, the $10,000 to $14,999 income bracket is the least frequent group with only 7 families (2.1%) belonging to this category.
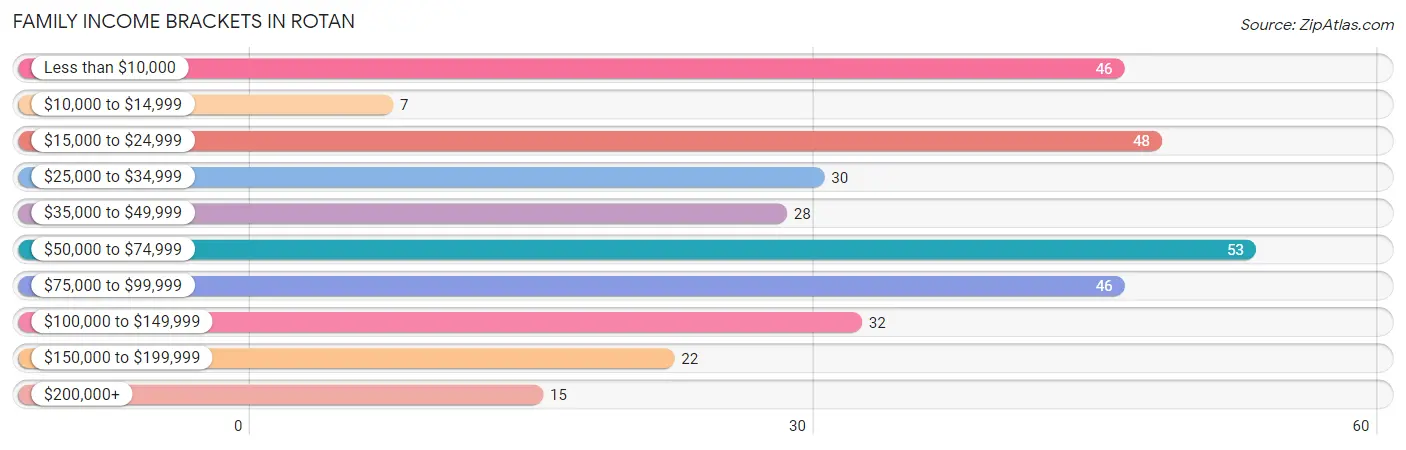
| Income Bracket | # Families | % Families |
| Less than $10,000 | 46 | 14.1% |
| $10,000 to $14,999 | 7 | 2.1% |
| $15,000 to $24,999 | 48 | 14.7% |
| $25,000 to $34,999 | 30 | 9.2% |
| $35,000 to $49,999 | 28 | 8.6% |
| $50,000 to $74,999 | 53 | 16.2% |
| $75,000 to $99,999 | 46 | 14.1% |
| $100,000 to $149,999 | 32 | 9.8% |
| $150,000 to $199,999 | 22 | 6.7% |
| $200,000+ | 15 | 4.6% |
Family Income by Famaliy Size in Rotan
4-person families (28 | 8.6%) account for the highest median family income in Rotan with $86,875 per family, while 2-person families (189 | 57.8%) have the highest median income of $24,375 per family member.
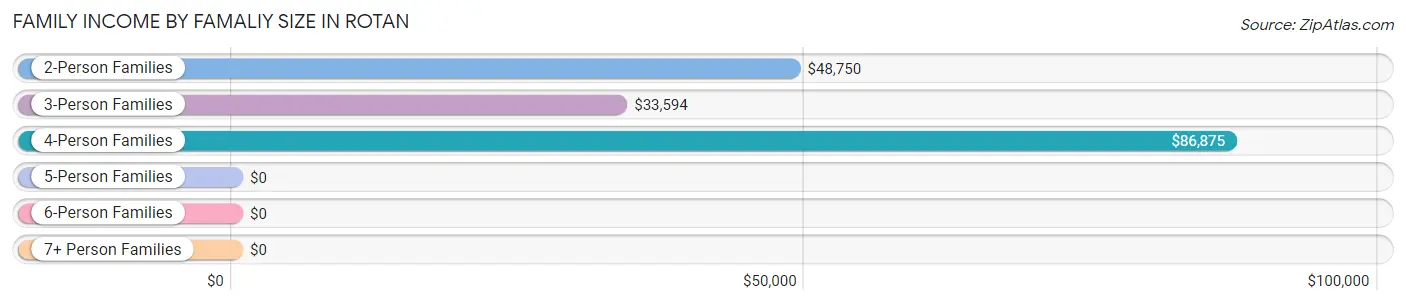
| Income Bracket | # Families | Median Income |
| 2-Person Families | 189 (57.8%) | $48,750 |
| 3-Person Families | 65 (19.9%) | $33,594 |
| 4-Person Families | 28 (8.6%) | $86,875 |
| 5-Person Families | 41 (12.5%) | $0 |
| 6-Person Families | 3 (0.9%) | $0 |
| 7+ Person Families | 1 (0.3%) | $0 |
| Total | 327 (100.0%) | $51,607 |
Family Income by Number of Earners in Rotan
The median family income in Rotan is $51,607, with families comprising 3+ earners (10) having the highest median family income of $178,333, while families with 1 earner (153) have the lowest median family income of $26,250, accounting for 3.1% and 46.8% of families, respectively.
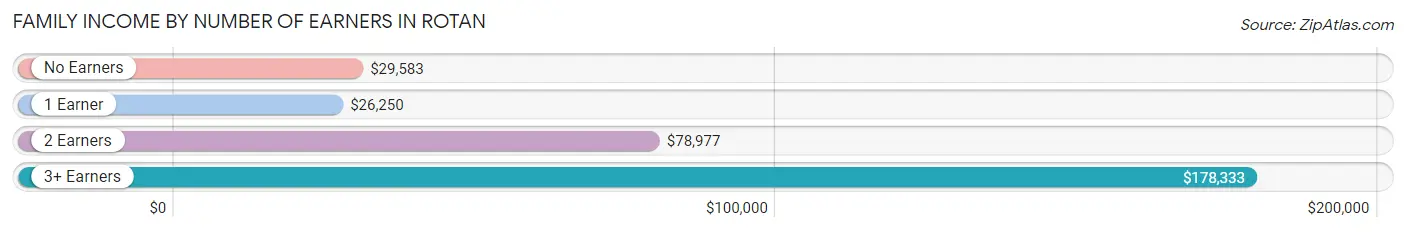
| Number of Earners | # Families | Median Income |
| No Earners | 43 (13.2%) | $29,583 |
| 1 Earner | 153 (46.8%) | $26,250 |
| 2 Earners | 121 (37.0%) | $78,977 |
| 3+ Earners | 10 (3.1%) | $178,333 |
| Total | 327 (100.0%) | $51,607 |
Household Income in Rotan
Household Income Brackets in Rotan
With 84 households falling in the category, the $25,000 to $34,999 income range is the most frequent in Rotan, accounting for 16.7% of all households. In contrast, only 15 households (3.0%) fall into the $200,000+ income bracket, making it the least populous group.
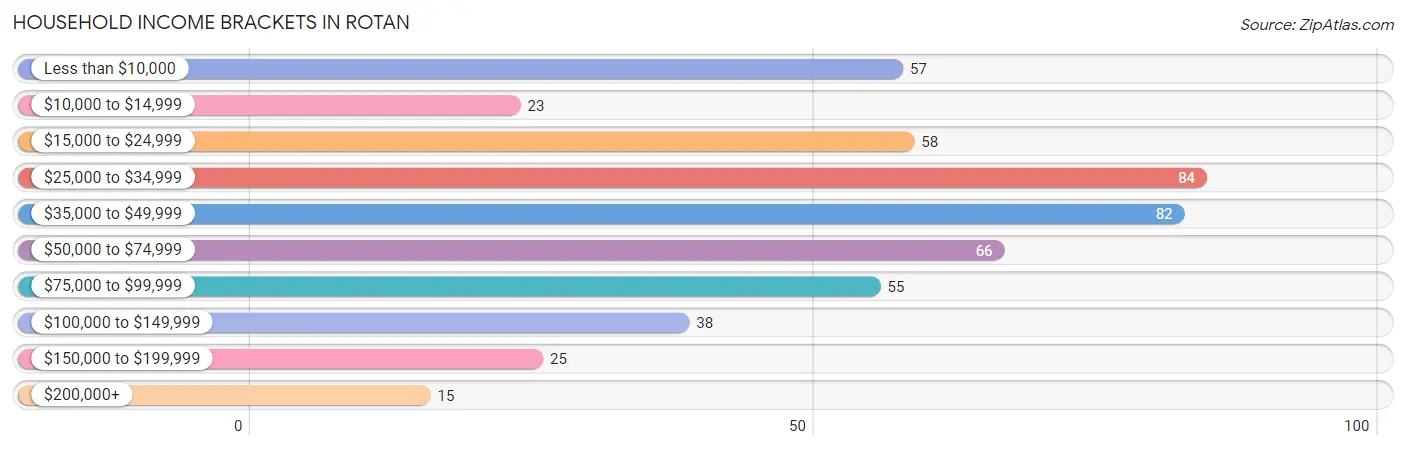
| Income Bracket | # Households | % Households |
| Less than $10,000 | 57 | 11.3% |
| $10,000 to $14,999 | 23 | 4.6% |
| $15,000 to $24,999 | 58 | 11.5% |
| $25,000 to $34,999 | 84 | 16.7% |
| $35,000 to $49,999 | 82 | 16.3% |
| $50,000 to $74,999 | 66 | 13.1% |
| $75,000 to $99,999 | 55 | 10.9% |
| $100,000 to $149,999 | 38 | 7.6% |
| $150,000 to $199,999 | 25 | 5.0% |
| $200,000+ | 15 | 3.0% |
Household Income by Householder Age in Rotan
The median household income in Rotan is $39,861, with the highest median household income of $48,125 found in the 45 to 64 years age bracket for the primary householder. A total of 168 households (33.4%) fall into this category. Meanwhile, the 15 to 24 years age bracket for the primary householder has the lowest median household income of $0, with 12 households (2.4%) in this group.
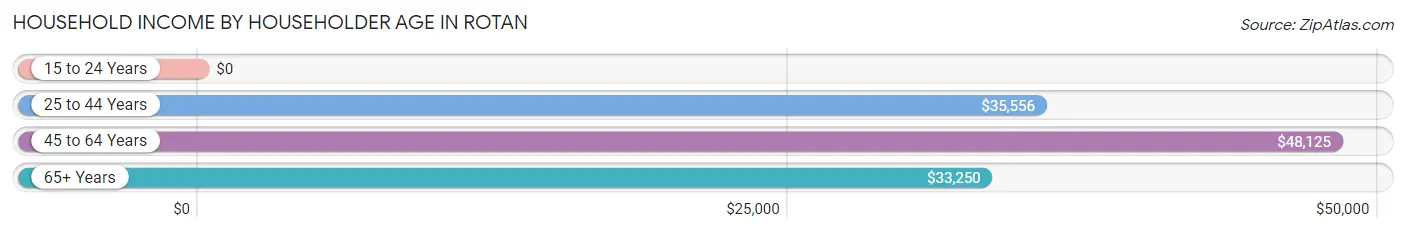
| Income Bracket | # Households | Median Income |
| 15 to 24 Years | 12 (2.4%) | $0 |
| 25 to 44 Years | 154 (30.6%) | $35,556 |
| 45 to 64 Years | 168 (33.4%) | $48,125 |
| 65+ Years | 169 (33.6%) | $33,250 |
| Total | 503 (100.0%) | $39,861 |
Poverty in Rotan
Income Below Poverty by Sex and Age in Rotan
With 21.4% poverty level for males and 26.3% for females among the residents of Rotan, 12 to 14 year old males and 35 to 44 year old females are the most vulnerable to poverty, with 11 males (91.7%) and 32 females (47.8%) in their respective age groups living below the poverty level.
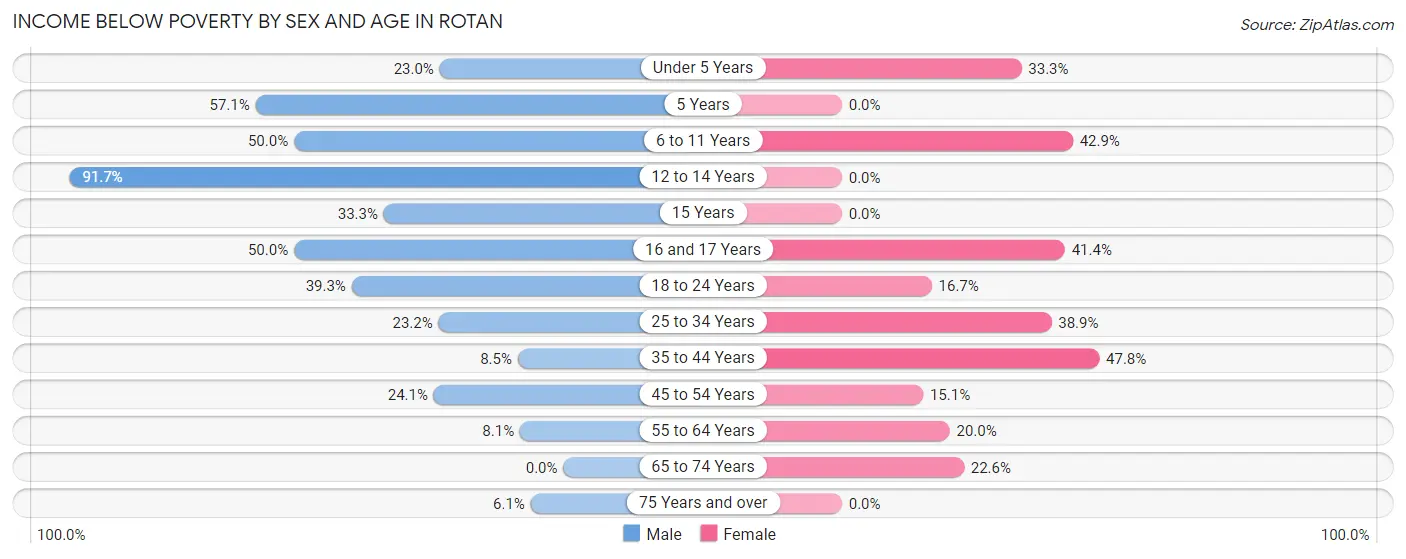
| Age Bracket | Male | Female |
| Under 5 Years | 14 (23.0%) | 8 (33.3%) |
| 5 Years | 4 (57.1%) | 0 (0.0%) |
| 6 to 11 Years | 18 (50.0%) | 27 (42.9%) |
| 12 to 14 Years | 11 (91.7%) | 0 (0.0%) |
| 15 Years | 3 (33.3%) | 0 (0.0%) |
| 16 and 17 Years | 3 (50.0%) | 12 (41.4%) |
| 18 to 24 Years | 22 (39.3%) | 4 (16.7%) |
| 25 to 34 Years | 19 (23.2%) | 42 (38.9%) |
| 35 to 44 Years | 6 (8.5%) | 32 (47.8%) |
| 45 to 54 Years | 19 (24.0%) | 11 (15.1%) |
| 55 to 64 Years | 7 (8.1%) | 12 (20.0%) |
| 65 to 74 Years | 0 (0.0%) | 24 (22.6%) |
| 75 Years and over | 2 (6.1%) | 0 (0.0%) |
| Total | 128 (21.4%) | 172 (26.3%) |
Income Above Poverty by Sex and Age in Rotan
According to the poverty statistics in Rotan, males aged 65 to 74 years and females aged 12 to 14 years are the age groups that are most secure financially, with 100.0% of males and 100.0% of females in these age groups living above the poverty line.
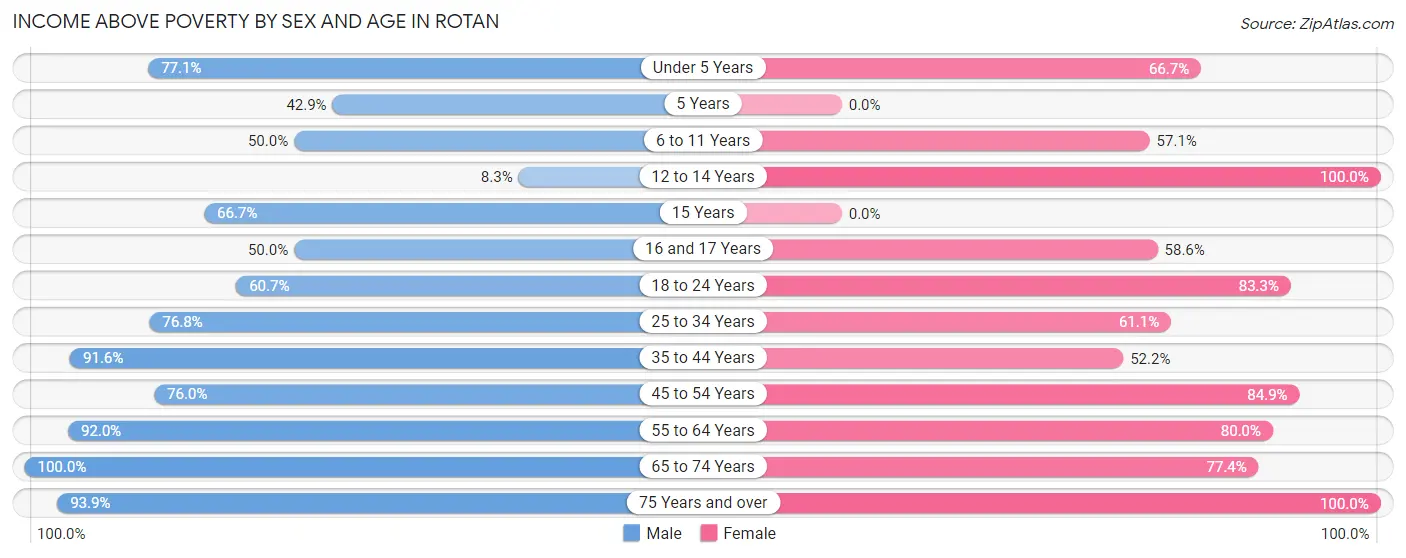
| Age Bracket | Male | Female |
| Under 5 Years | 47 (77.0%) | 16 (66.7%) |
| 5 Years | 3 (42.9%) | 0 (0.0%) |
| 6 to 11 Years | 18 (50.0%) | 36 (57.1%) |
| 12 to 14 Years | 1 (8.3%) | 32 (100.0%) |
| 15 Years | 6 (66.7%) | 0 (0.0%) |
| 16 and 17 Years | 3 (50.0%) | 17 (58.6%) |
| 18 to 24 Years | 34 (60.7%) | 20 (83.3%) |
| 25 to 34 Years | 63 (76.8%) | 66 (61.1%) |
| 35 to 44 Years | 65 (91.5%) | 35 (52.2%) |
| 45 to 54 Years | 60 (75.9%) | 62 (84.9%) |
| 55 to 64 Years | 80 (91.9%) | 48 (80.0%) |
| 65 to 74 Years | 58 (100.0%) | 82 (77.4%) |
| 75 Years and over | 31 (93.9%) | 69 (100.0%) |
| Total | 469 (78.6%) | 483 (73.7%) |
Income Below Poverty Among Married-Couple Families in Rotan
The poverty statistics for married-couple families in Rotan show that 7.8% or 17 of the total 219 families live below the poverty line. Families with 1 or 2 children have the highest poverty rate of 23.8%, comprising of 10 families. On the other hand, families with 3 or 4 children have the lowest poverty rate of 0.0%, which includes 0 families.
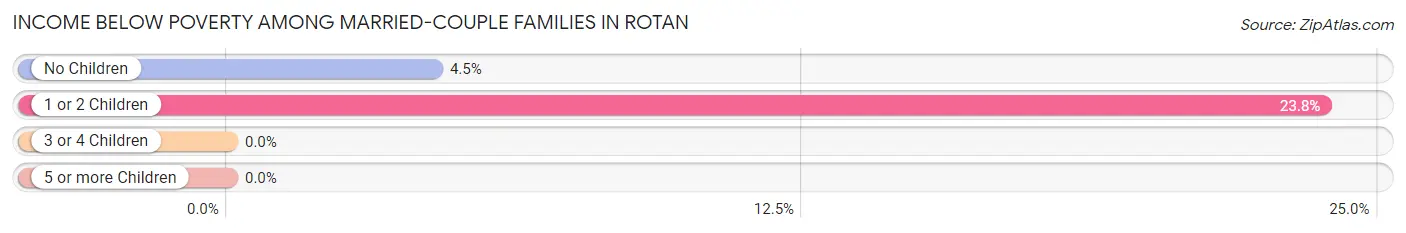
| Children | Above Poverty | Below Poverty |
| No Children | 150 (95.5%) | 7 (4.5%) |
| 1 or 2 Children | 32 (76.2%) | 10 (23.8%) |
| 3 or 4 Children | 19 (100.0%) | 0 (0.0%) |
| 5 or more Children | 1 (100.0%) | 0 (0.0%) |
| Total | 202 (92.2%) | 17 (7.8%) |
Income Below Poverty Among Single-Parent Households in Rotan
According to the poverty data in Rotan, 38.9% or 7 single-father households and 63.3% or 57 single-mother households are living below the poverty line. Among single-father households, those with 1 or 2 children have the highest poverty rate, with 7 households (70.0%) experiencing poverty. Likewise, among single-mother households, those with 3 or 4 children have the highest poverty rate, with 19 households (100.0%) falling below the poverty line.
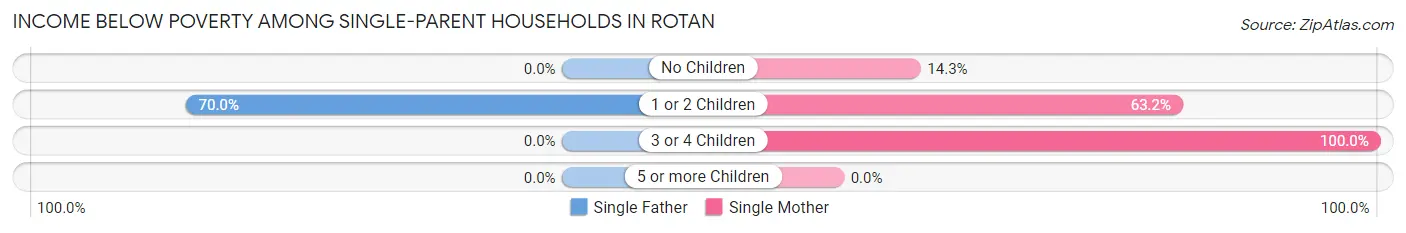
| Children | Single Father | Single Mother |
| No Children | 0 (0.0%) | 2 (14.3%) |
| 1 or 2 Children | 7 (70.0%) | 36 (63.2%) |
| 3 or 4 Children | 0 (0.0%) | 19 (100.0%) |
| 5 or more Children | 0 (0.0%) | 0 (0.0%) |
| Total | 7 (38.9%) | 57 (63.3%) |
Income Below Poverty Among Married-Couple vs Single-Parent Households in Rotan
The poverty data for Rotan shows that 17 of the married-couple family households (7.8%) and 64 of the single-parent households (59.3%) are living below the poverty level. Within the married-couple family households, those with 1 or 2 children have the highest poverty rate, with 10 households (23.8%) falling below the poverty line. Among the single-parent households, those with 3 or 4 children have the highest poverty rate, with 19 household (70.4%) living below poverty.
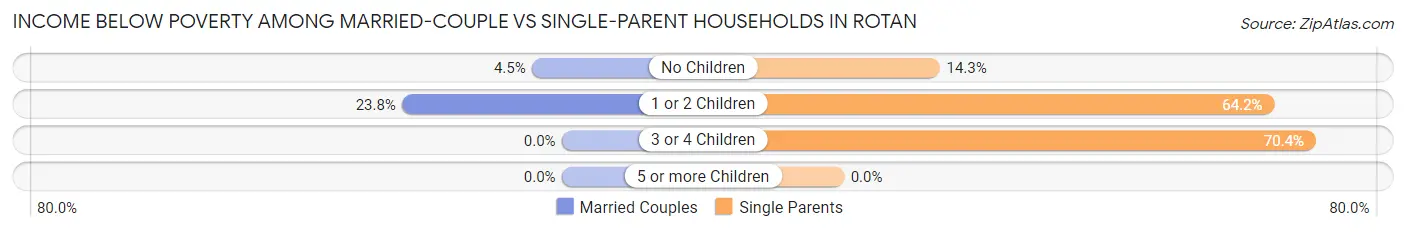
| Children | Married-Couple Families | Single-Parent Households |
| No Children | 7 (4.5%) | 2 (14.3%) |
| 1 or 2 Children | 10 (23.8%) | 43 (64.2%) |
| 3 or 4 Children | 0 (0.0%) | 19 (70.4%) |
| 5 or more Children | 0 (0.0%) | 0 (0.0%) |
| Total | 17 (7.8%) | 64 (59.3%) |
Race in Rotan
The most populous races in Rotan are White / Caucasian (724 | 57.0%), Hispanic or Latino (683 | 53.8%), and Two or more Races (341 | 26.9%).
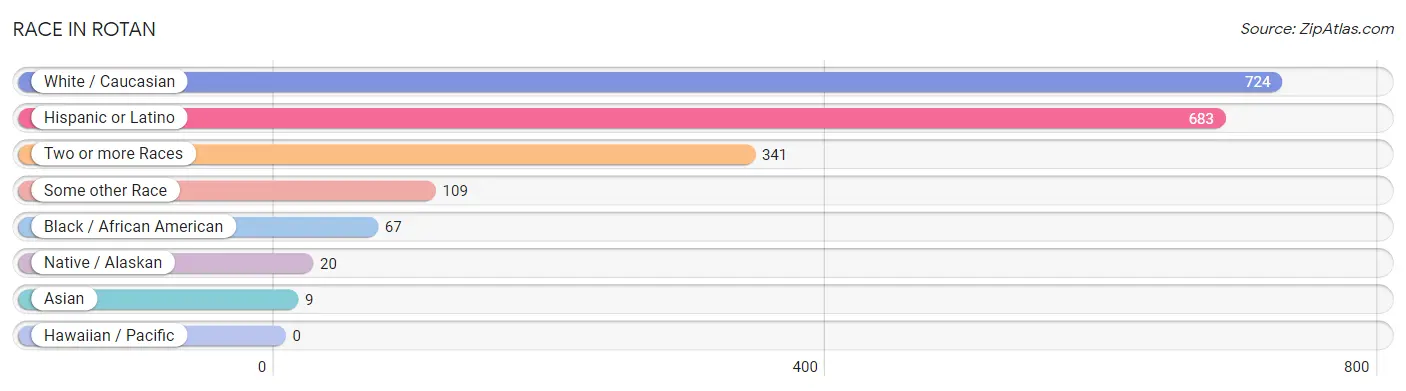
| Race | # Population | % Population |
| Asian | 9 | 0.7% |
| Black / African American | 67 | 5.3% |
| Hawaiian / Pacific | 0 | 0.0% |
| Hispanic or Latino | 683 | 53.8% |
| Native / Alaskan | 20 | 1.6% |
| White / Caucasian | 724 | 57.0% |
| Two or more Races | 341 | 26.9% |
| Some other Race | 109 | 8.6% |
| Total | 1,270 | 100.0% |
Ancestry in Rotan
The most populous ancestries reported in Rotan are Mexican (671 | 52.8%), English (111 | 8.7%), American (58 | 4.6%), Irish (50 | 3.9%), and German (44 | 3.5%), together accounting for 73.5% of all Rotan residents.
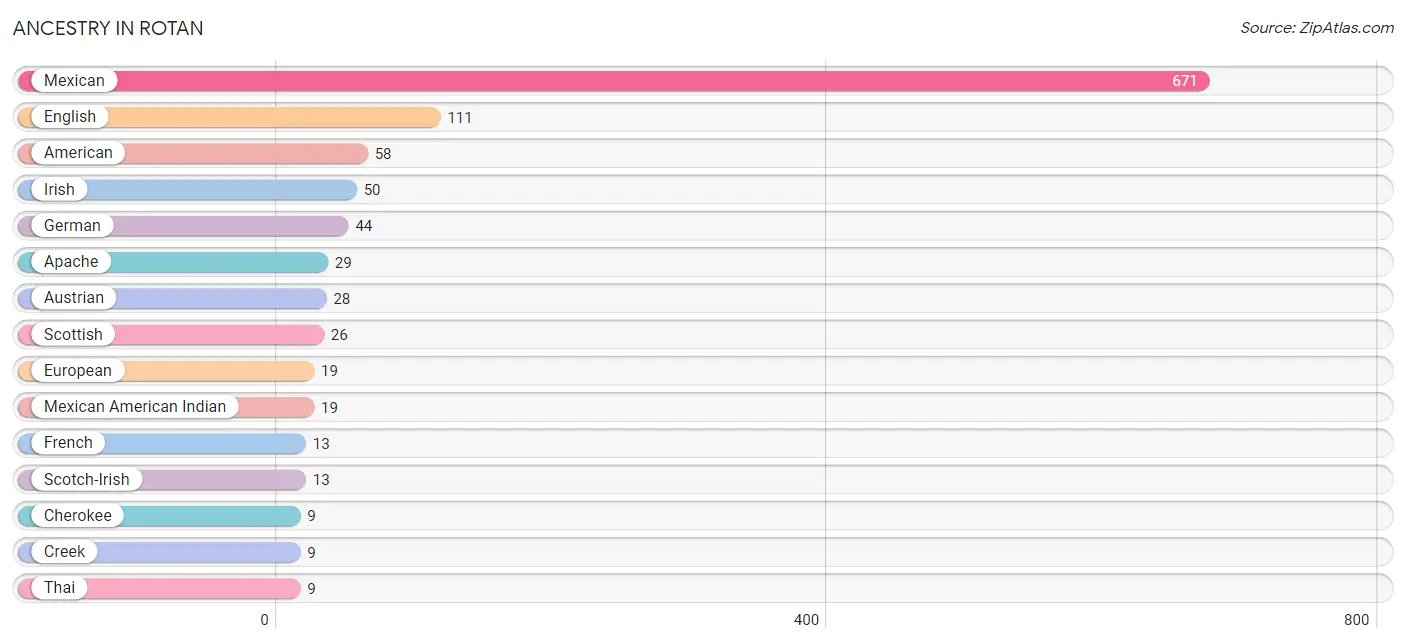
| Ancestry | # Population | % Population |
| African | 6 | 0.5% |
| American | 58 | 4.6% |
| Apache | 29 | 2.3% |
| Austrian | 28 | 2.2% |
| British | 3 | 0.2% |
| Cherokee | 9 | 0.7% |
| Creek | 9 | 0.7% |
| Dutch | 2 | 0.2% |
| English | 111 | 8.7% |
| European | 19 | 1.5% |
| French | 13 | 1.0% |
| German | 44 | 3.5% |
| Irish | 50 | 3.9% |
| Italian | 5 | 0.4% |
| Mexican | 671 | 52.8% |
| Mexican American Indian | 19 | 1.5% |
| Puerto Rican | 1 | 0.1% |
| Scotch-Irish | 13 | 1.0% |
| Scottish | 26 | 2.1% |
| Sioux | 2 | 0.2% |
| Spanish | 3 | 0.2% |
| Subsaharan African | 6 | 0.5% |
| Thai | 9 | 0.7% |
| Welsh | 3 | 0.2% |
| Yaqui | 1 | 0.1% | View All 25 Rows |
Immigrants in Rotan
The most numerous immigrant groups reported in Rotan came from Central America (49 | 3.9%), Latin America (49 | 3.9%), Mexico (49 | 3.9%), Asia (9 | 0.7%), and India (9 | 0.7%), together accounting for 13.0% of all Rotan residents.
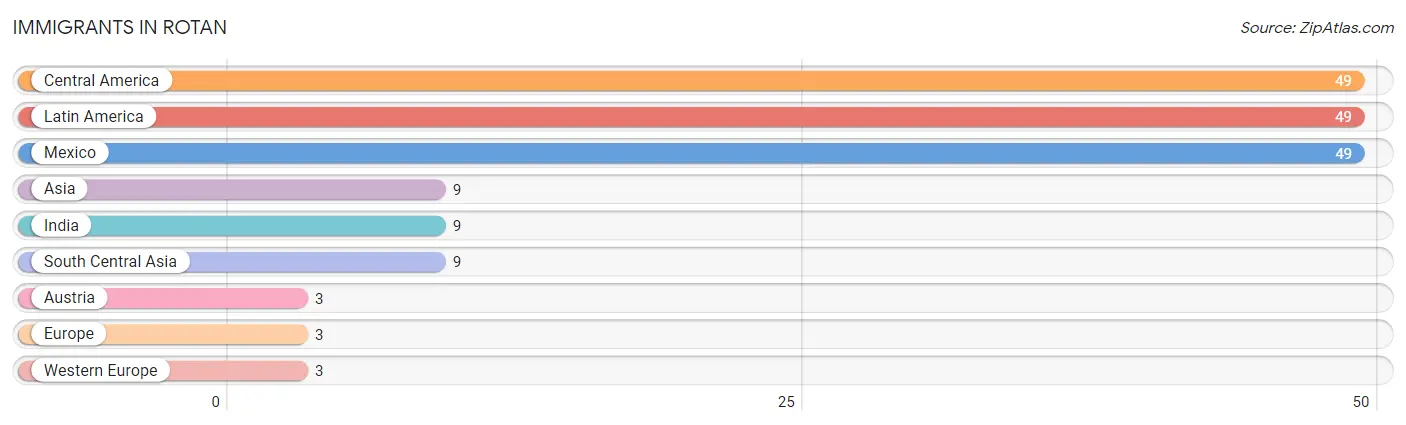
| Immigration Origin | # Population | % Population |
| Asia | 9 | 0.7% |
| Austria | 3 | 0.2% |
| Central America | 49 | 3.9% |
| Europe | 3 | 0.2% |
| India | 9 | 0.7% |
| Latin America | 49 | 3.9% |
| Mexico | 49 | 3.9% |
| South Central Asia | 9 | 0.7% |
| Western Europe | 3 | 0.2% | View All 9 Rows |
Sex and Age in Rotan
Sex and Age in Rotan
The most populous age groups in Rotan are Under 5 Years (61 | 10.1%) for men and 25 to 29 Years (63 | 9.4%) for women.
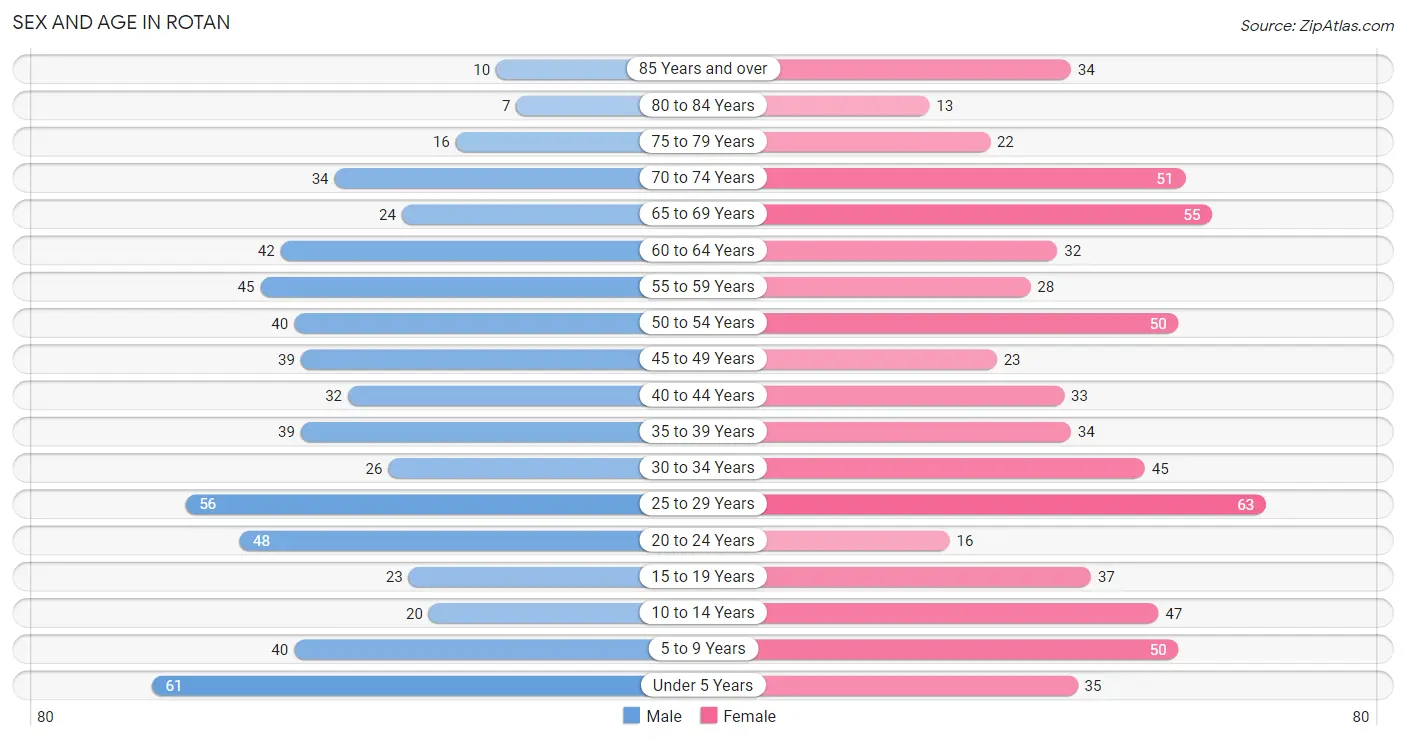
| Age Bracket | Male | Female |
| Under 5 Years | 61 (10.1%) | 35 (5.2%) |
| 5 to 9 Years | 40 (6.6%) | 50 (7.5%) |
| 10 to 14 Years | 20 (3.3%) | 47 (7.0%) |
| 15 to 19 Years | 23 (3.8%) | 37 (5.5%) |
| 20 to 24 Years | 48 (8.0%) | 16 (2.4%) |
| 25 to 29 Years | 56 (9.3%) | 63 (9.4%) |
| 30 to 34 Years | 26 (4.3%) | 45 (6.7%) |
| 35 to 39 Years | 39 (6.5%) | 34 (5.1%) |
| 40 to 44 Years | 32 (5.3%) | 33 (4.9%) |
| 45 to 49 Years | 39 (6.5%) | 23 (3.4%) |
| 50 to 54 Years | 40 (6.6%) | 50 (7.5%) |
| 55 to 59 Years | 45 (7.5%) | 28 (4.2%) |
| 60 to 64 Years | 42 (7.0%) | 32 (4.8%) |
| 65 to 69 Years | 24 (4.0%) | 55 (8.2%) |
| 70 to 74 Years | 34 (5.7%) | 51 (7.6%) |
| 75 to 79 Years | 16 (2.7%) | 22 (3.3%) |
| 80 to 84 Years | 7 (1.2%) | 13 (1.9%) |
| 85 Years and over | 10 (1.7%) | 34 (5.1%) |
| Total | 602 (100.0%) | 668 (100.0%) |
Families and Households in Rotan
Median Family Size in Rotan
The median family size in Rotan is 3.06 persons per family, with married-couple families (219 | 67.0%) accounting for the largest median family size of 3.17 persons per family. On the other hand, single male/father families (18 | 5.5%) represent the smallest median family size with 2.83 persons per family.
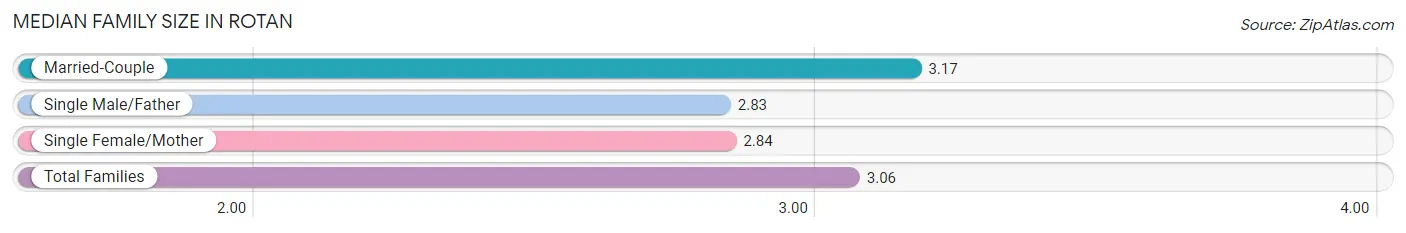
| Family Type | # Families | Family Size |
| Married-Couple | 219 (67.0%) | 3.17 |
| Single Male/Father | 18 (5.5%) | 2.83 |
| Single Female/Mother | 90 (27.5%) | 2.84 |
| Total Families | 327 (100.0%) | 3.06 |
Median Household Size in Rotan
The median household size in Rotan is 2.49 persons per household, with single female/mother households (90 | 17.9%) accounting for the largest median household size of 3.29 persons per household. non-family households (176 | 35.0%) represent the smallest median household size with 1.11 persons per household.
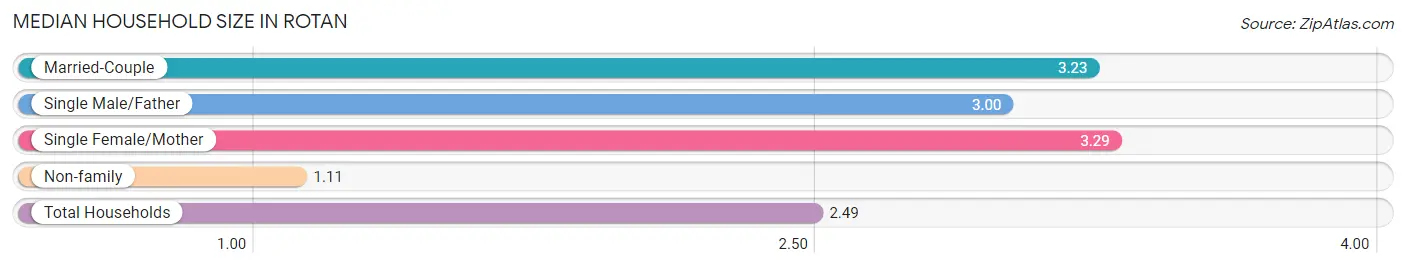
| Household Type | # Households | Household Size |
| Married-Couple | 219 (43.5%) | 3.23 |
| Single Male/Father | 18 (3.6%) | 3.00 |
| Single Female/Mother | 90 (17.9%) | 3.29 |
| Non-family | 176 (35.0%) | 1.11 |
| Total Households | 503 (100.0%) | 2.49 |
Household Size by Marriage Status in Rotan
Out of a total of 503 households in Rotan, 327 (65.0%) are family households, while 176 (35.0%) are nonfamily households. The most numerous type of family households are 2-person households, comprising 158, and the most common type of nonfamily households are 1-person households, comprising 161.
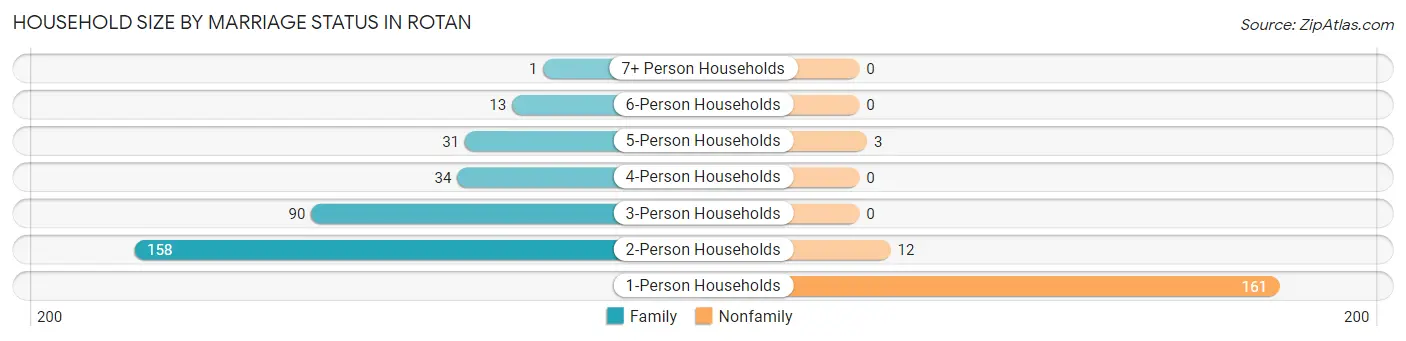
| Household Size | Family Households | Nonfamily Households |
| 1-Person Households | - | 161 (32.0%) |
| 2-Person Households | 158 (31.4%) | 12 (2.4%) |
| 3-Person Households | 90 (17.9%) | 0 (0.0%) |
| 4-Person Households | 34 (6.8%) | 0 (0.0%) |
| 5-Person Households | 31 (6.2%) | 3 (0.6%) |
| 6-Person Households | 13 (2.6%) | 0 (0.0%) |
| 7+ Person Households | 1 (0.2%) | 0 (0.0%) |
| Total | 327 (65.0%) | 176 (35.0%) |
Female Fertility in Rotan
Fertility by Age in Rotan
Average fertility rate in Rotan is 28.0 births per 1,000 women. Women in the age bracket of 20 to 34 years have the highest fertility rate with 56.0 births per 1,000 women. Women in the age bracket of 20 to 34 years acount for 100.0% of all women with births.
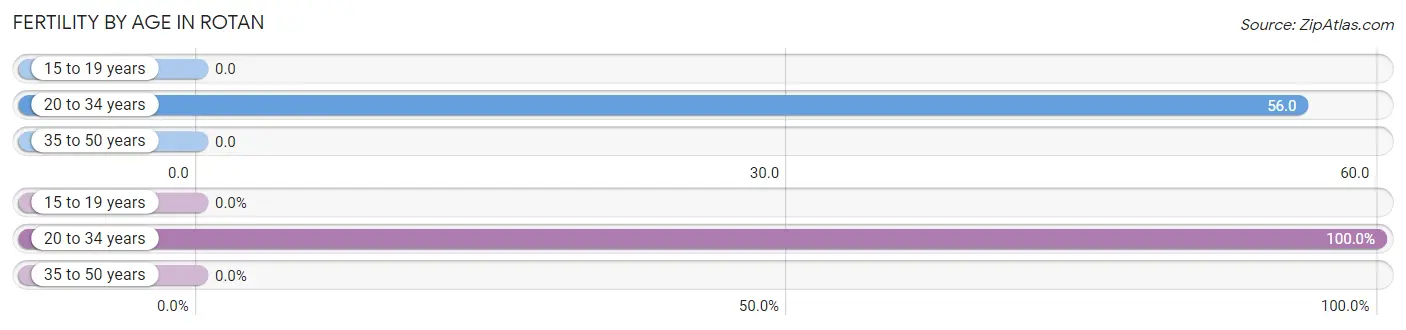
| Age Bracket | Women with Births | Births / 1,000 Women |
| 15 to 19 years | 0 (0.0%) | 0.0 |
| 20 to 34 years | 7 (100.0%) | 56.0 |
| 35 to 50 years | 0 (0.0%) | 0.0 |
| Total | 7 (100.0%) | 28.0 |
Fertility by Age by Marriage Status in Rotan
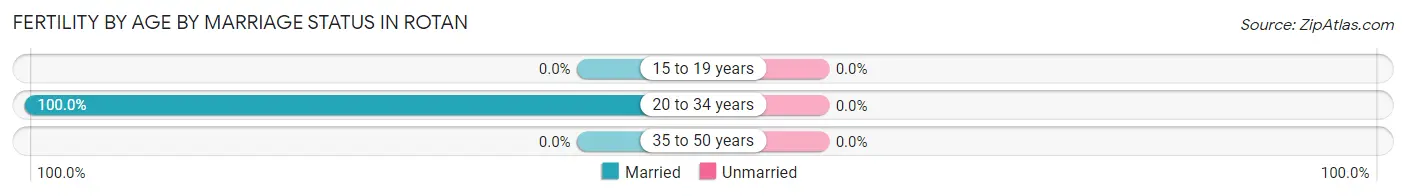
| Age Bracket | Married | Unmarried |
| 15 to 19 years | 0 (0.0%) | 0 (0.0%) |
| 20 to 34 years | 7 (100.0%) | 0 (0.0%) |
| 35 to 50 years | 0 (0.0%) | 0 (0.0%) |
| Total | 7 (100.0%) | 0 (0.0%) |
Fertility by Education in Rotan
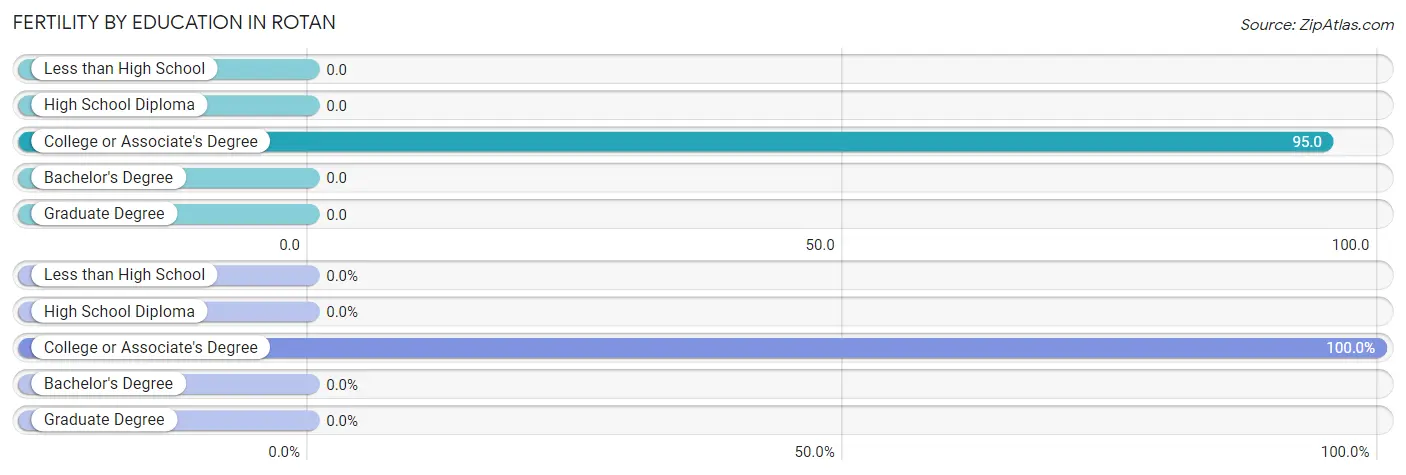
| Educational Attainment | Women with Births | Births / 1,000 Women |
| Less than High School | 0 (0.0%) | 0.0 |
| High School Diploma | 0 (0.0%) | 0.0 |
| College or Associate's Degree | 7 (100.0%) | 95.0 |
| Bachelor's Degree | 0 (0.0%) | 0.0 |
| Graduate Degree | 0 (0.0%) | 0.0 |
| Total | 7 (100.0%) | 28.0 |
Fertility by Education by Marriage Status in Rotan
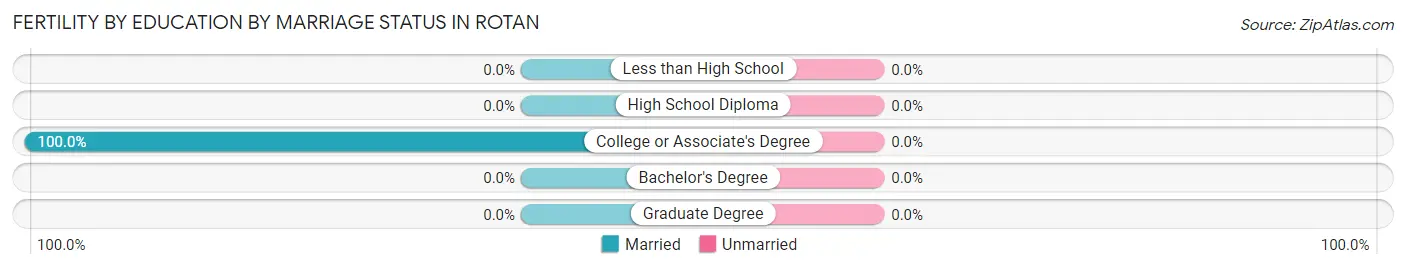
| Educational Attainment | Married | Unmarried |
| Less than High School | 0 (0.0%) | 0 (0.0%) |
| High School Diploma | 0 (0.0%) | 0 (0.0%) |
| College or Associate's Degree | 7 (100.0%) | 0 (0.0%) |
| Bachelor's Degree | 0 (0.0%) | 0 (0.0%) |
| Graduate Degree | 0 (0.0%) | 0 (0.0%) |
| Total | 7 (100.0%) | 0 (0.0%) |
Employment Characteristics in Rotan
Employment by Class of Employer in Rotan
Among the 594 employed individuals in Rotan, private company employees (393 | 66.2%), local government employees (84 | 14.1%), and self-employed (not incorporated) (79 | 13.3%) make up the most common classes of employment.
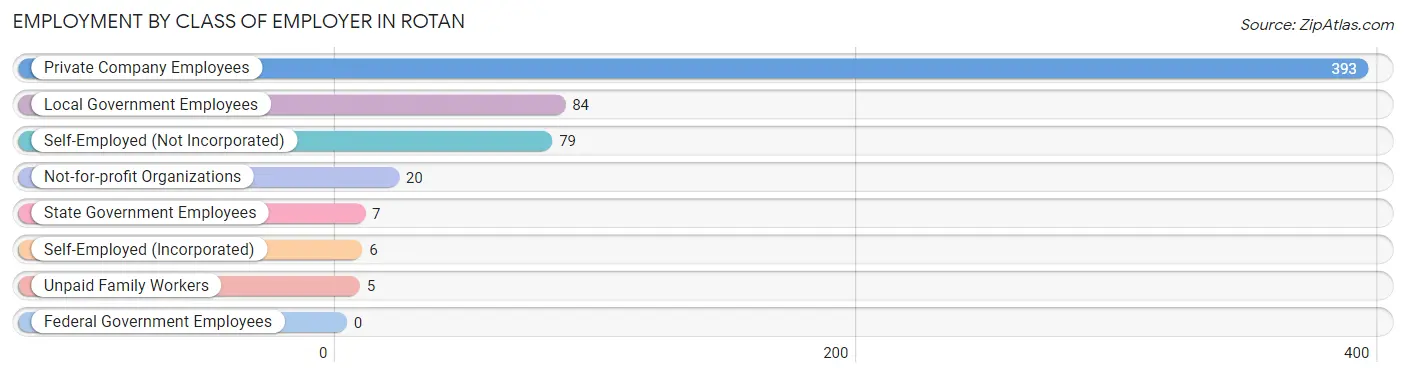
| Employer Class | # Employees | % Employees |
| Private Company Employees | 393 | 66.2% |
| Self-Employed (Incorporated) | 6 | 1.0% |
| Self-Employed (Not Incorporated) | 79 | 13.3% |
| Not-for-profit Organizations | 20 | 3.4% |
| Local Government Employees | 84 | 14.1% |
| State Government Employees | 7 | 1.2% |
| Federal Government Employees | 0 | 0.0% |
| Unpaid Family Workers | 5 | 0.8% |
| Total | 594 | 100.0% |
Employment Status by Age in Rotan
According to the labor force statistics for Rotan, out of the total population over 16 years of age (1,008), 62.4% or 629 individuals are in the labor force, with 4.1% or 26 of them unemployed. The age group with the highest labor force participation rate is 20 to 24 years, with 100.0% or 64 individuals in the labor force. Within the labor force, the 16 to 19 years age range has the highest percentage of unemployed individuals, with 100.0% or 8 of them being unemployed.
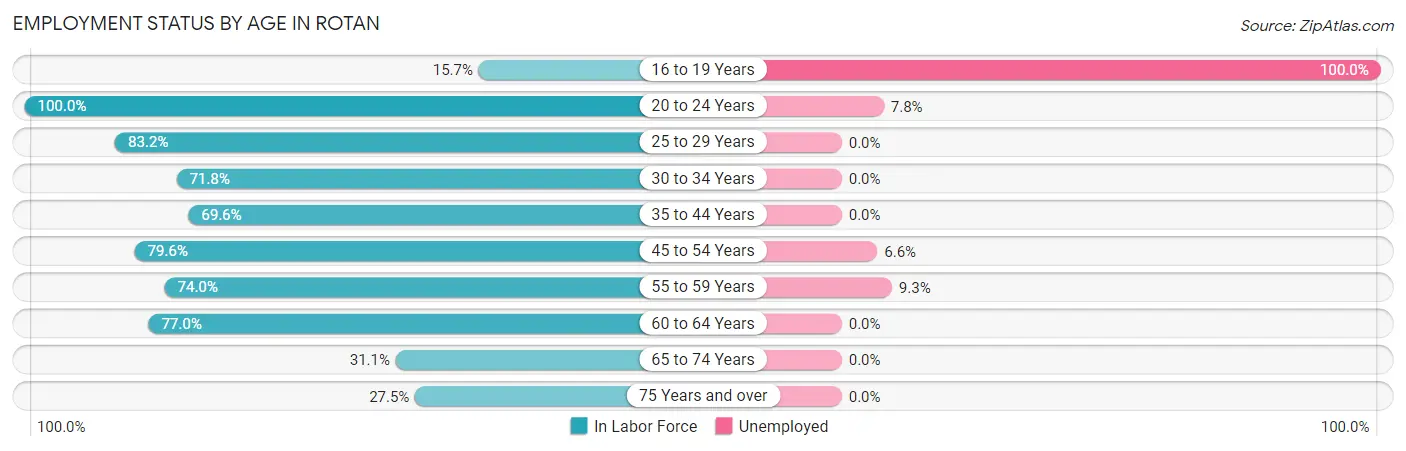
| Age Bracket | In Labor Force | Unemployed |
| 16 to 19 Years | 8 (15.7%) | 8 (100.0%) |
| 20 to 24 Years | 64 (100.0%) | 5 (7.8%) |
| 25 to 29 Years | 99 (83.2%) | 0 (0.0%) |
| 30 to 34 Years | 51 (71.8%) | 0 (0.0%) |
| 35 to 44 Years | 96 (69.6%) | 0 (0.0%) |
| 45 to 54 Years | 121 (79.6%) | 8 (6.6%) |
| 55 to 59 Years | 54 (74.0%) | 5 (9.3%) |
| 60 to 64 Years | 57 (77.0%) | 0 (0.0%) |
| 65 to 74 Years | 51 (31.1%) | 0 (0.0%) |
| 75 Years and over | 28 (27.5%) | 0 (0.0%) |
| Total | 629 (62.4%) | 26 (4.1%) |
Employment Status by Educational Attainment in Rotan
According to labor force statistics for Rotan, 76.2% of individuals (478) out of the total population between 25 and 64 years of age (627) are in the labor force, with 2.7% or 13 of them being unemployed. The group with the highest labor force participation rate are those with the educational attainment of bachelor's degree or higher, with 82.1% or 69 individuals in the labor force. Within the labor force, individuals with bachelor's degree or higher education have the highest percentage of unemployment, with 7.2% or 5 of them being unemployed.
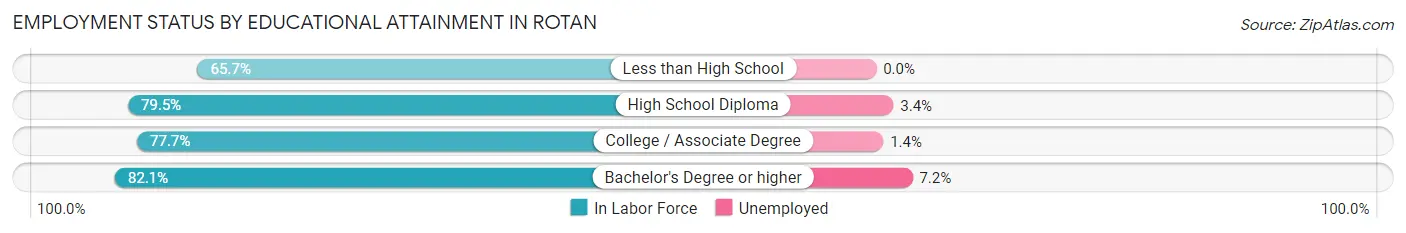
| Educational Attainment | In Labor Force | Unemployed |
| Less than High School | 92 (65.7%) | 0 (0.0%) |
| High School Diploma | 178 (79.5%) | 8 (3.4%) |
| College / Associate Degree | 139 (77.7%) | 3 (1.4%) |
| Bachelor's Degree or higher | 69 (82.1%) | 6 (7.2%) |
| Total | 478 (76.2%) | 17 (2.7%) |
Employment Occupations by Sex in Rotan
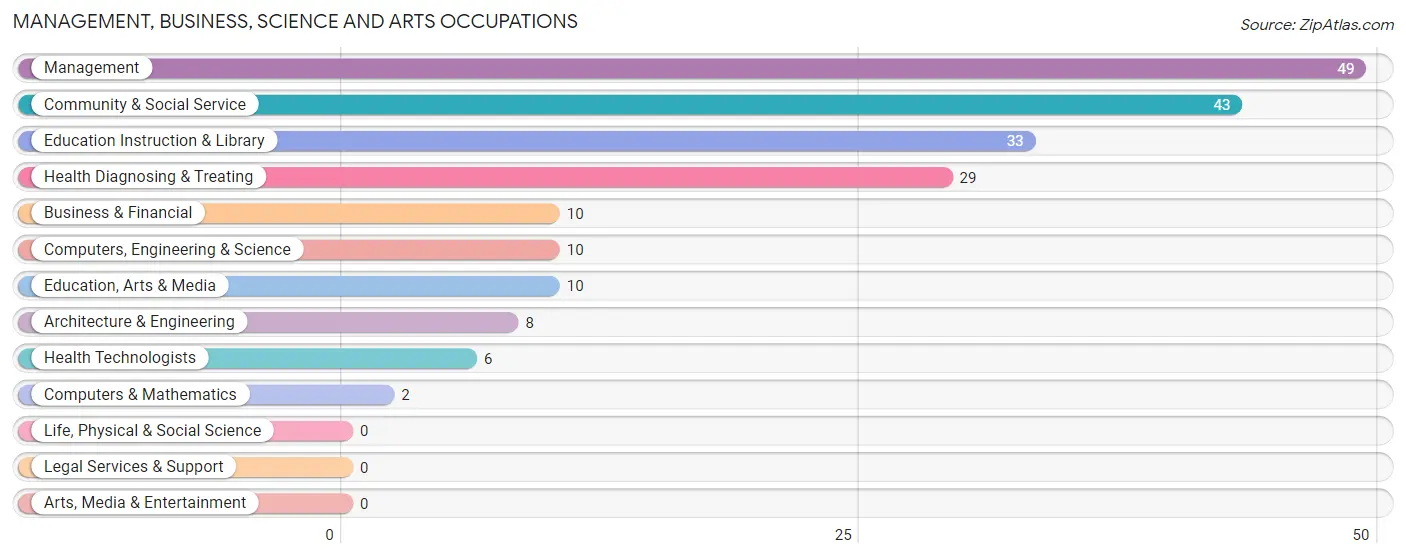
Management, Business, Science and Arts Occupations
The most common Management, Business, Science and Arts occupations in Rotan are Management (49 | 8.1%), Community & Social Service (43 | 7.1%), Education Instruction & Library (33 | 5.5%), Health Diagnosing & Treating (29 | 4.8%), and Business & Financial (10 | 1.7%).
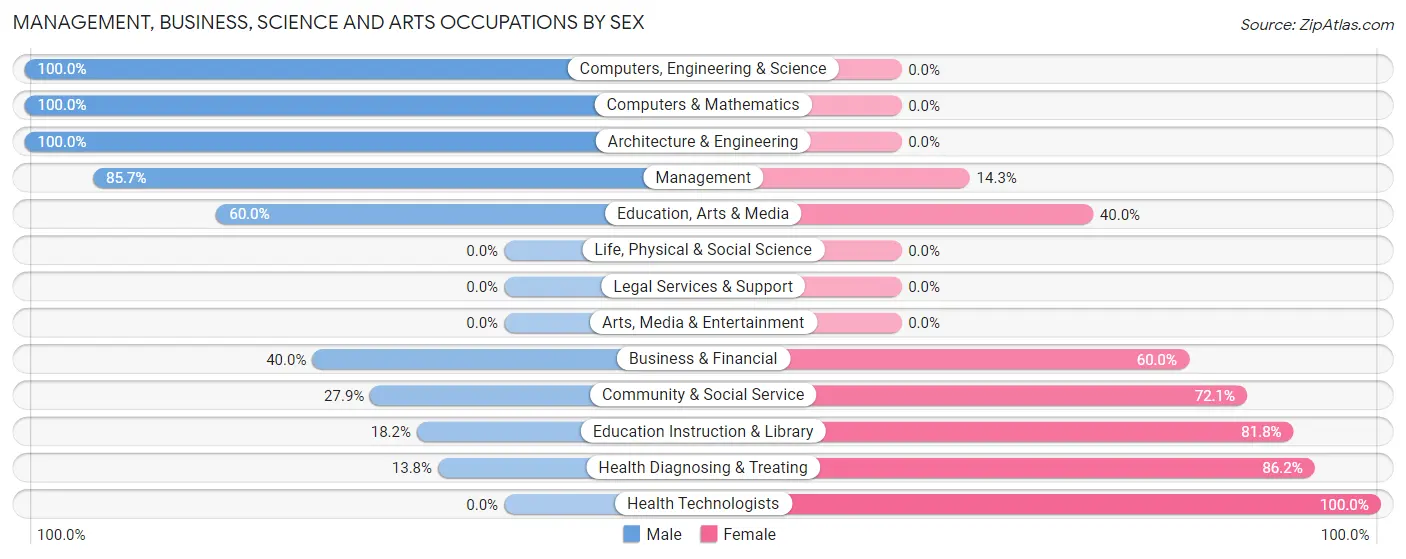
Management, Business, Science and Arts Occupations by Sex
Within the Management, Business, Science and Arts occupations in Rotan, the most male-oriented occupations are Computers, Engineering & Science (100.0%), Computers & Mathematics (100.0%), and Architecture & Engineering (100.0%), while the most female-oriented occupations are Health Technologists (100.0%), Health Diagnosing & Treating (86.2%), and Education Instruction & Library (81.8%).
| Occupation | Male | Female |
| Management | 42 (85.7%) | 7 (14.3%) |
| Business & Financial | 4 (40.0%) | 6 (60.0%) |
| Computers, Engineering & Science | 10 (100.0%) | 0 (0.0%) |
| Computers & Mathematics | 2 (100.0%) | 0 (0.0%) |
| Architecture & Engineering | 8 (100.0%) | 0 (0.0%) |
| Life, Physical & Social Science | 0 (0.0%) | 0 (0.0%) |
| Community & Social Service | 12 (27.9%) | 31 (72.1%) |
| Education, Arts & Media | 6 (60.0%) | 4 (40.0%) |
| Legal Services & Support | 0 (0.0%) | 0 (0.0%) |
| Education Instruction & Library | 6 (18.2%) | 27 (81.8%) |
| Arts, Media & Entertainment | 0 (0.0%) | 0 (0.0%) |
| Health Diagnosing & Treating | 4 (13.8%) | 25 (86.2%) |
| Health Technologists | 0 (0.0%) | 6 (100.0%) |
| Total (Category) | 72 (51.1%) | 69 (48.9%) |
| Total (Overall) | 381 (63.2%) | 222 (36.8%) |
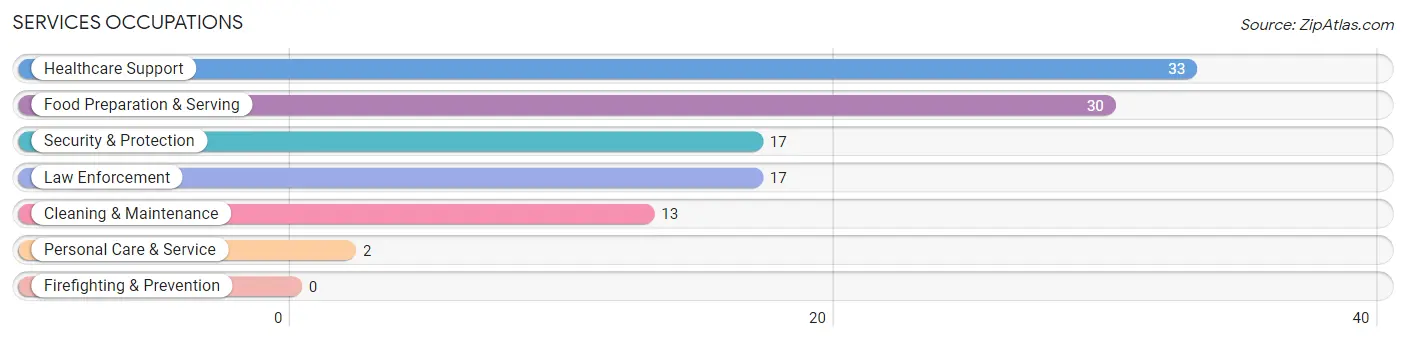
Services Occupations
The most common Services occupations in Rotan are Healthcare Support (33 | 5.5%), Food Preparation & Serving (30 | 5.0%), Security & Protection (17 | 2.8%), Law Enforcement (17 | 2.8%), and Cleaning & Maintenance (13 | 2.2%).
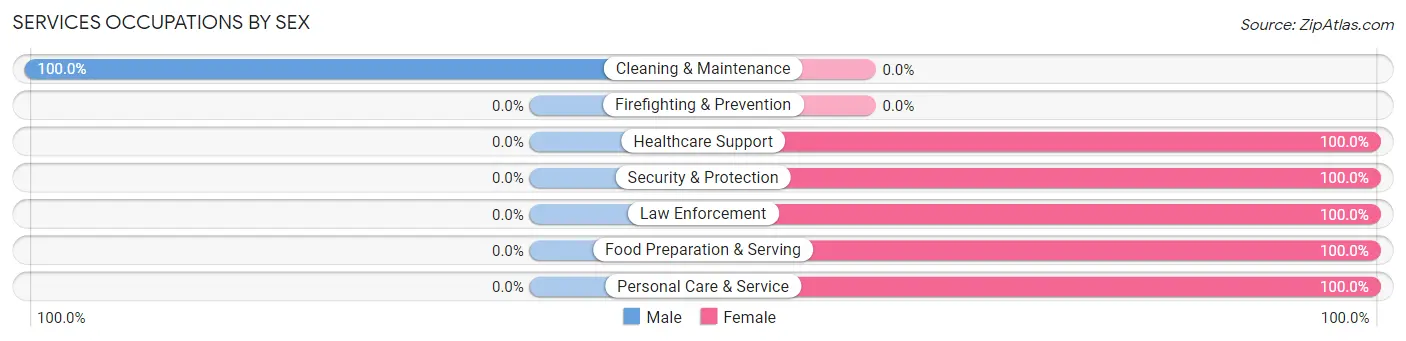
Services Occupations by Sex
| Occupation | Male | Female |
| Healthcare Support | 0 (0.0%) | 33 (100.0%) |
| Security & Protection | 0 (0.0%) | 17 (100.0%) |
| Firefighting & Prevention | 0 (0.0%) | 0 (0.0%) |
| Law Enforcement | 0 (0.0%) | 17 (100.0%) |
| Food Preparation & Serving | 0 (0.0%) | 30 (100.0%) |
| Cleaning & Maintenance | 13 (100.0%) | 0 (0.0%) |
| Personal Care & Service | 0 (0.0%) | 2 (100.0%) |
| Total (Category) | 13 (13.7%) | 82 (86.3%) |
| Total (Overall) | 381 (63.2%) | 222 (36.8%) |
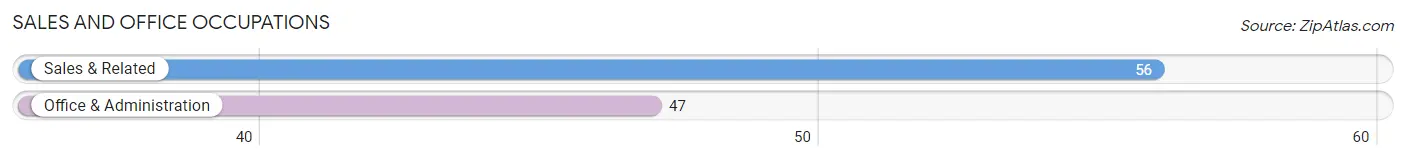
Sales and Office Occupations
The most common Sales and Office occupations in Rotan are Sales & Related (56 | 9.3%), and Office & Administration (47 | 7.8%).
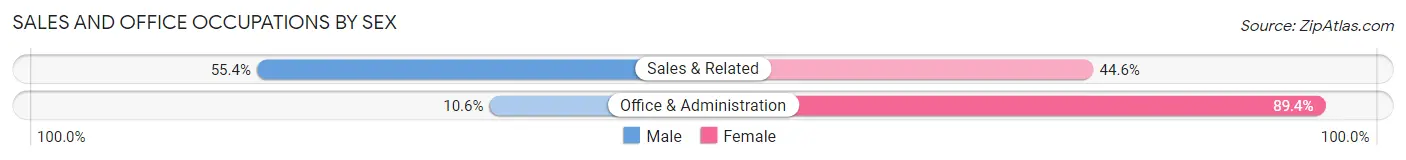
Sales and Office Occupations by Sex
| Occupation | Male | Female |
| Sales & Related | 31 (55.4%) | 25 (44.6%) |
| Office & Administration | 5 (10.6%) | 42 (89.4%) |
| Total (Category) | 36 (34.9%) | 67 (65.0%) |
| Total (Overall) | 381 (63.2%) | 222 (36.8%) |
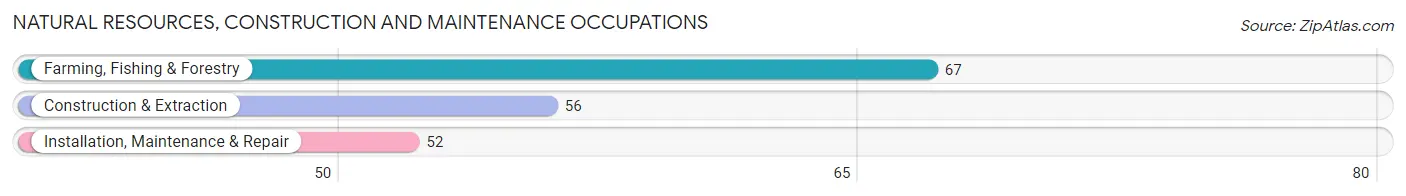
Natural Resources, Construction and Maintenance Occupations
The most common Natural Resources, Construction and Maintenance occupations in Rotan are Farming, Fishing & Forestry (67 | 11.1%), Construction & Extraction (56 | 9.3%), and Installation, Maintenance & Repair (52 | 8.6%).
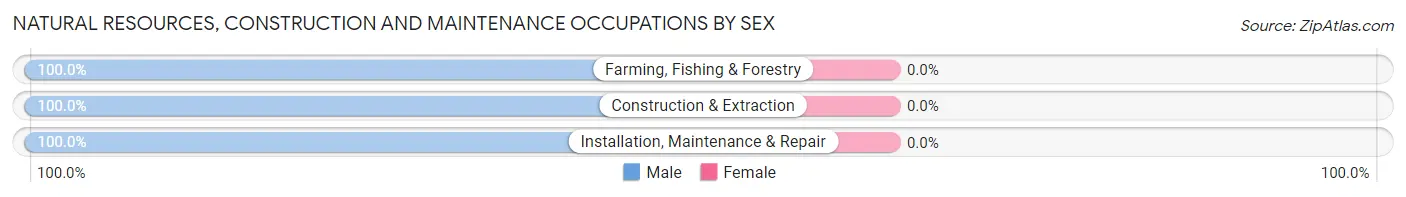
Natural Resources, Construction and Maintenance Occupations by Sex
| Occupation | Male | Female |
| Farming, Fishing & Forestry | 67 (100.0%) | 0 (0.0%) |
| Construction & Extraction | 56 (100.0%) | 0 (0.0%) |
| Installation, Maintenance & Repair | 52 (100.0%) | 0 (0.0%) |
| Total (Category) | 175 (100.0%) | 0 (0.0%) |
| Total (Overall) | 381 (63.2%) | 222 (36.8%) |
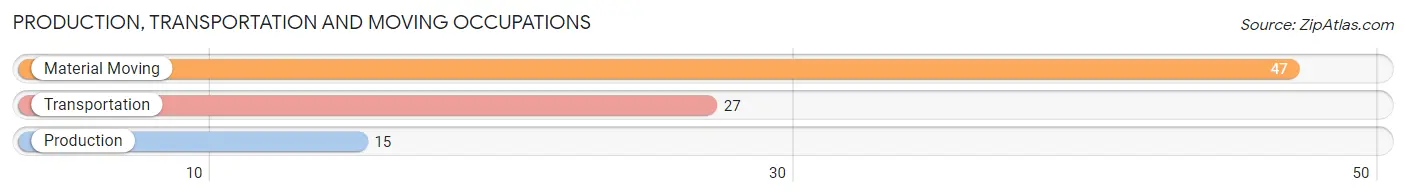
Production, Transportation and Moving Occupations
The most common Production, Transportation and Moving occupations in Rotan are Material Moving (47 | 7.8%), Transportation (27 | 4.5%), and Production (15 | 2.5%).
Production, Transportation and Moving Occupations by Sex
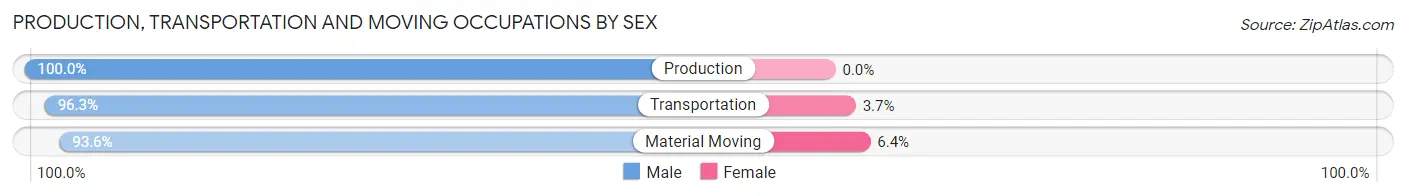
| Occupation | Male | Female |
| Production | 15 (100.0%) | 0 (0.0%) |
| Transportation | 26 (96.3%) | 1 (3.7%) |
| Material Moving | 44 (93.6%) | 3 (6.4%) |
| Total (Category) | 85 (95.5%) | 4 (4.5%) |
| Total (Overall) | 381 (63.2%) | 222 (36.8%) |
Employment Industries by Sex in Rotan
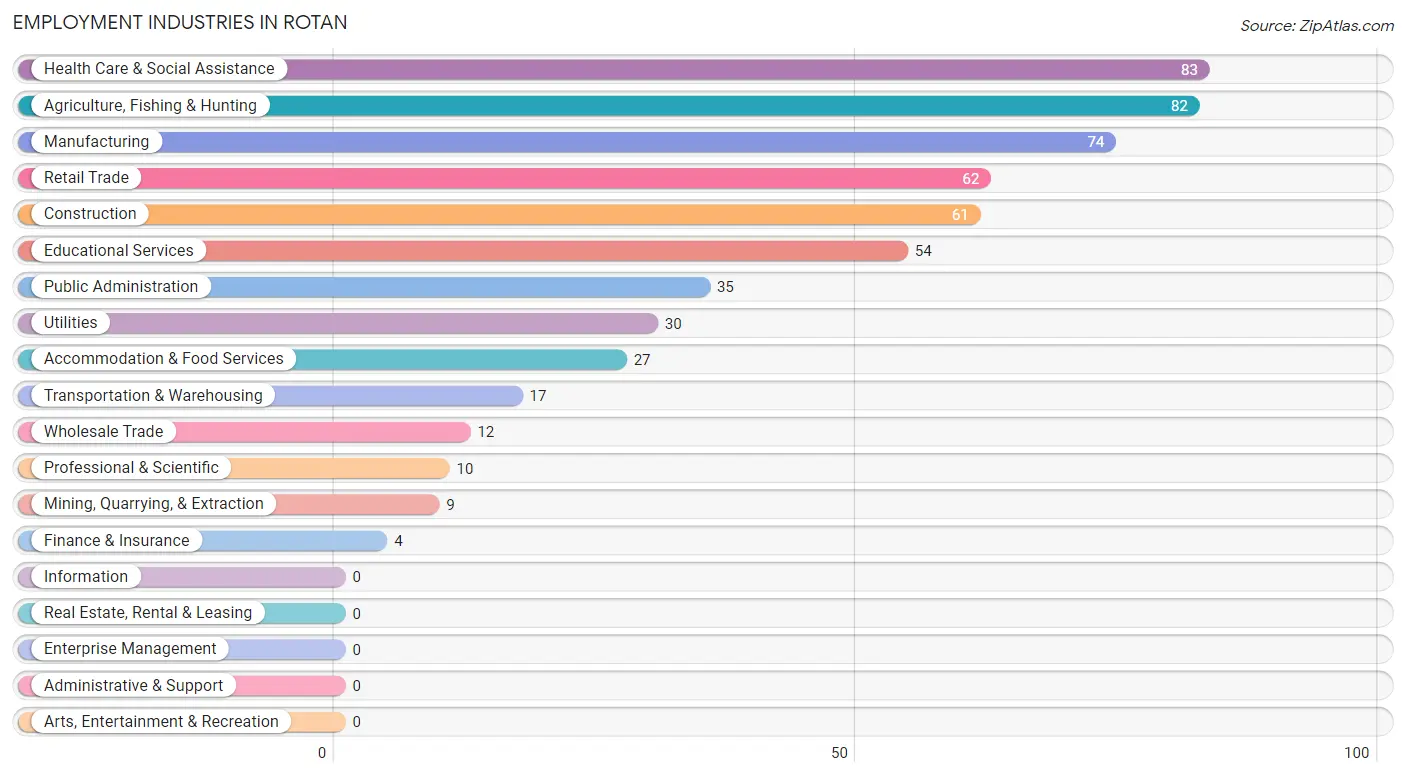
Employment Industries in Rotan
The major employment industries in Rotan include Health Care & Social Assistance (83 | 13.8%), Agriculture, Fishing & Hunting (82 | 13.6%), Manufacturing (74 | 12.3%), Retail Trade (62 | 10.3%), and Construction (61 | 10.1%).
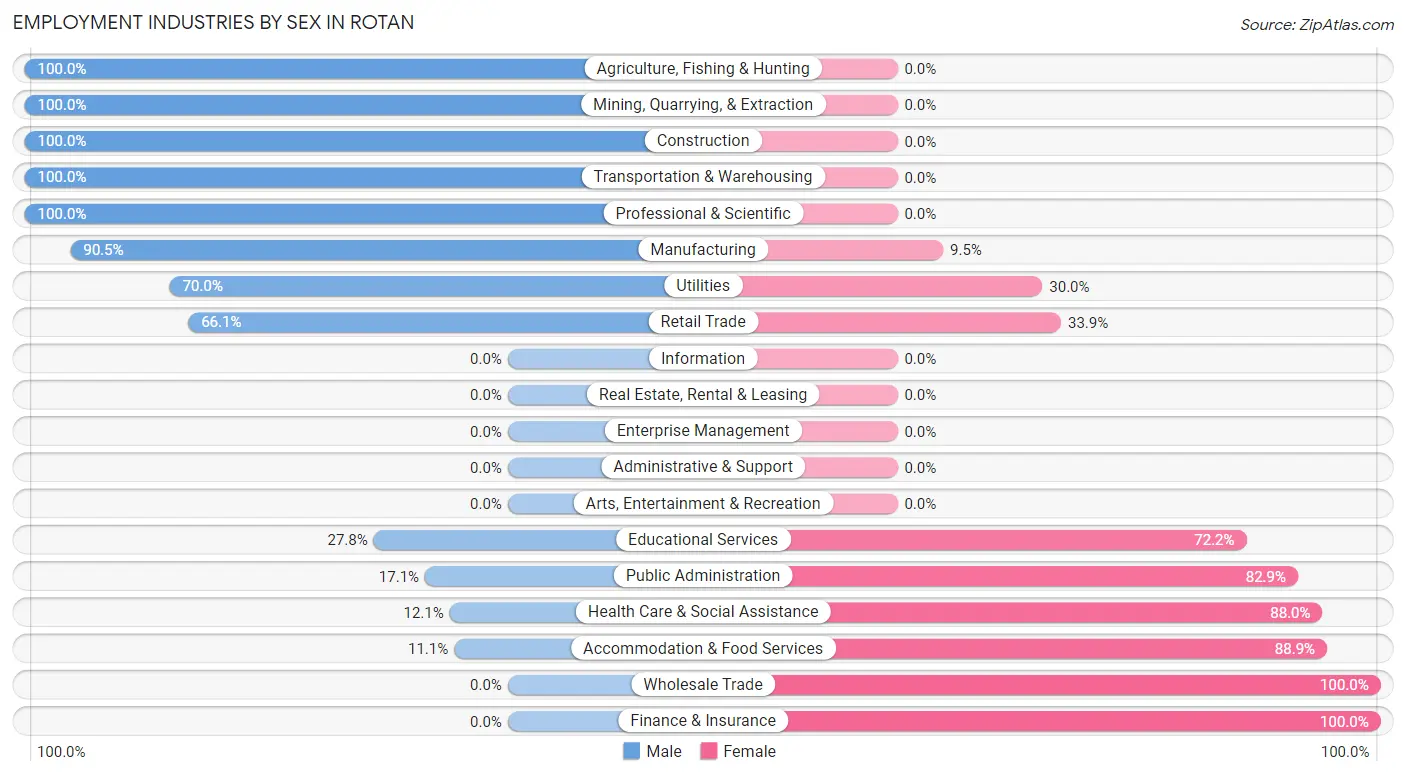
Employment Industries by Sex in Rotan
The Rotan industries that see more men than women are Agriculture, Fishing & Hunting (100.0%), Mining, Quarrying, & Extraction (100.0%), and Construction (100.0%), whereas the industries that tend to have a higher number of women are Wholesale Trade (100.0%), Finance & Insurance (100.0%), and Accommodation & Food Services (88.9%).
| Industry | Male | Female |
| Agriculture, Fishing & Hunting | 82 (100.0%) | 0 (0.0%) |
| Mining, Quarrying, & Extraction | 9 (100.0%) | 0 (0.0%) |
| Construction | 61 (100.0%) | 0 (0.0%) |
| Manufacturing | 67 (90.5%) | 7 (9.5%) |
| Wholesale Trade | 0 (0.0%) | 12 (100.0%) |
| Retail Trade | 41 (66.1%) | 21 (33.9%) |
| Transportation & Warehousing | 17 (100.0%) | 0 (0.0%) |
| Utilities | 21 (70.0%) | 9 (30.0%) |
| Information | 0 (0.0%) | 0 (0.0%) |
| Finance & Insurance | 0 (0.0%) | 4 (100.0%) |
| Real Estate, Rental & Leasing | 0 (0.0%) | 0 (0.0%) |
| Professional & Scientific | 10 (100.0%) | 0 (0.0%) |
| Enterprise Management | 0 (0.0%) | 0 (0.0%) |
| Administrative & Support | 0 (0.0%) | 0 (0.0%) |
| Educational Services | 15 (27.8%) | 39 (72.2%) |
| Health Care & Social Assistance | 10 (12.0%) | 73 (87.9%) |
| Arts, Entertainment & Recreation | 0 (0.0%) | 0 (0.0%) |
| Accommodation & Food Services | 3 (11.1%) | 24 (88.9%) |
| Public Administration | 6 (17.1%) | 29 (82.9%) |
| Total | 381 (63.2%) | 222 (36.8%) |
Education in Rotan
School Enrollment in Rotan
The most common levels of schooling among the 223 students in Rotan are middle school (52 | 23.3%), high school (44 | 19.7%), and elementary school (34 | 15.2%).
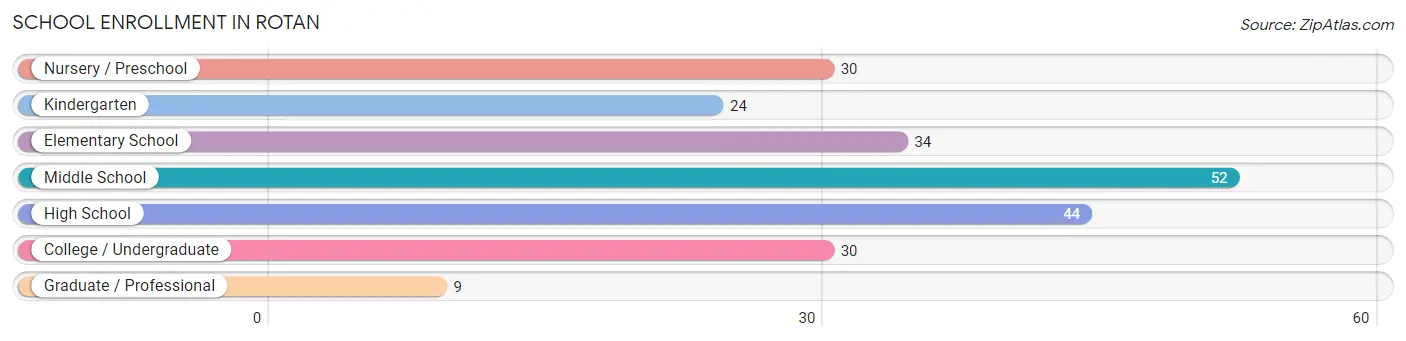
| School Level | # Students | % Students |
| Nursery / Preschool | 30 | 13.5% |
| Kindergarten | 24 | 10.8% |
| Elementary School | 34 | 15.2% |
| Middle School | 52 | 23.3% |
| High School | 44 | 19.7% |
| College / Undergraduate | 30 | 13.5% |
| Graduate / Professional | 9 | 4.0% |
| Total | 223 | 100.0% |
School Enrollment by Age by Funding Source in Rotan
Out of a total of 223 students who are enrolled in schools in Rotan, 6 (2.7%) attend a private institution, while the remaining 217 (97.3%) are enrolled in public schools. The age group of 35 years and over has the highest likelihood of being enrolled in private schools, with 6 (66.7% in the age bracket) enrolled. Conversely, the age group of 3 to 4 year olds has the lowest likelihood of being enrolled in a private school, with 19 (100.0% in the age bracket) attending a public institution.
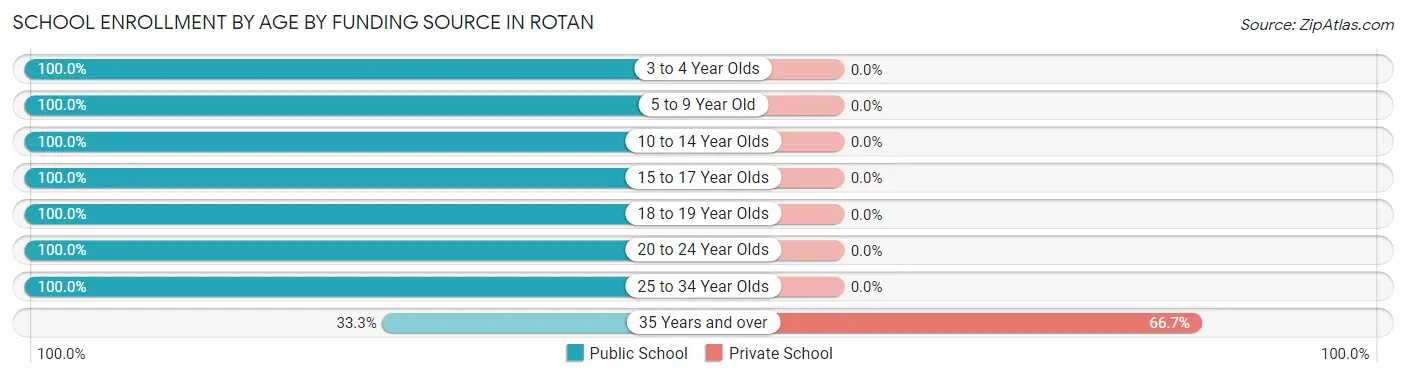
| Age Bracket | Public School | Private School |
| 3 to 4 Year Olds | 19 (100.0%) | 0 (0.0%) |
| 5 to 9 Year Old | 54 (100.0%) | 0 (0.0%) |
| 10 to 14 Year Olds | 67 (100.0%) | 0 (0.0%) |
| 15 to 17 Year Olds | 44 (100.0%) | 0 (0.0%) |
| 18 to 19 Year Olds | 16 (100.0%) | 0 (0.0%) |
| 20 to 24 Year Olds | 7 (100.0%) | 0 (0.0%) |
| 25 to 34 Year Olds | 7 (100.0%) | 0 (0.0%) |
| 35 Years and over | 3 (33.3%) | 6 (66.7%) |
| Total | 217 (97.3%) | 6 (2.7%) |
Educational Attainment by Field of Study in Rotan
Education (43 | 31.4%), science & technology (21 | 15.3%), bio, nature & agricultural (19 | 13.9%), psychology (17 | 12.4%), and business (17 | 12.4%) are the most common fields of study among 137 individuals in Rotan who have obtained a bachelor's degree or higher.
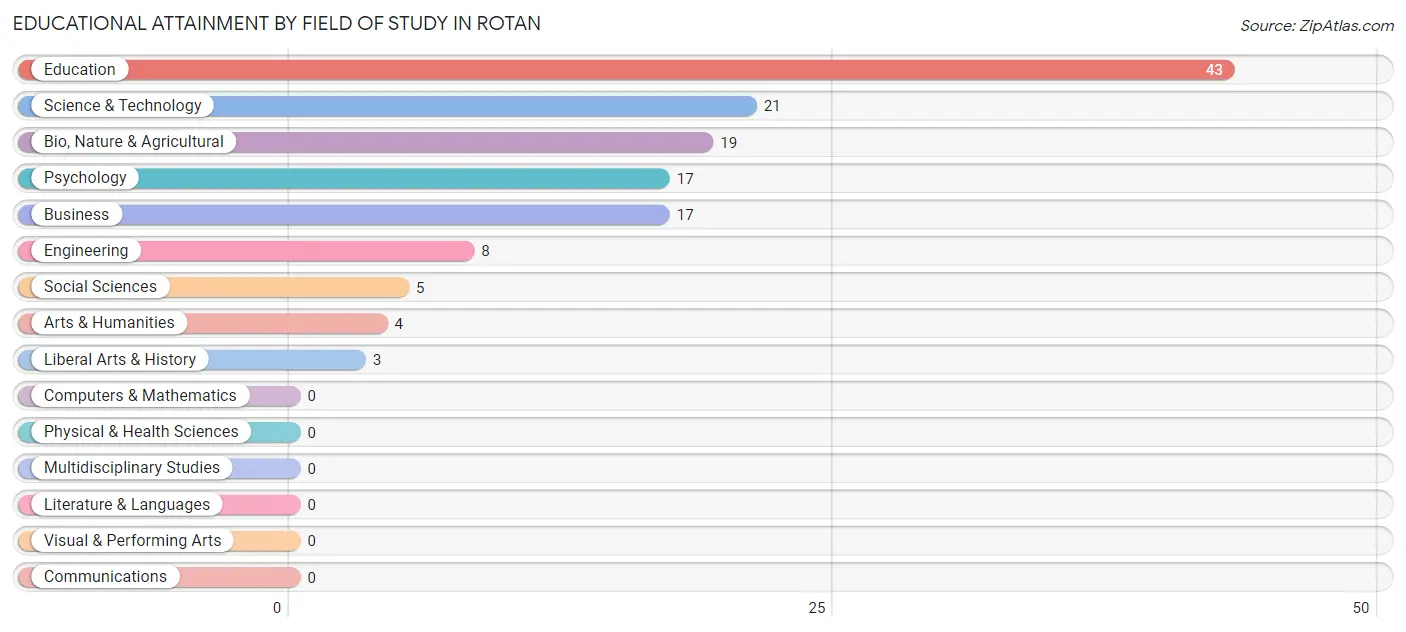
| Field of Study | # Graduates | % Graduates |
| Computers & Mathematics | 0 | 0.0% |
| Bio, Nature & Agricultural | 19 | 13.9% |
| Physical & Health Sciences | 0 | 0.0% |
| Psychology | 17 | 12.4% |
| Social Sciences | 5 | 3.6% |
| Engineering | 8 | 5.8% |
| Multidisciplinary Studies | 0 | 0.0% |
| Science & Technology | 21 | 15.3% |
| Business | 17 | 12.4% |
| Education | 43 | 31.4% |
| Literature & Languages | 0 | 0.0% |
| Liberal Arts & History | 3 | 2.2% |
| Visual & Performing Arts | 0 | 0.0% |
| Communications | 0 | 0.0% |
| Arts & Humanities | 4 | 2.9% |
| Total | 137 | 100.0% |
Transportation & Commute in Rotan
Vehicle Availability by Sex in Rotan
The most prevalent vehicle ownership categories in Rotan are males with 1 vehicle (123, accounting for 33.1%) and females with 1 vehicle (60, making up 56.2%).
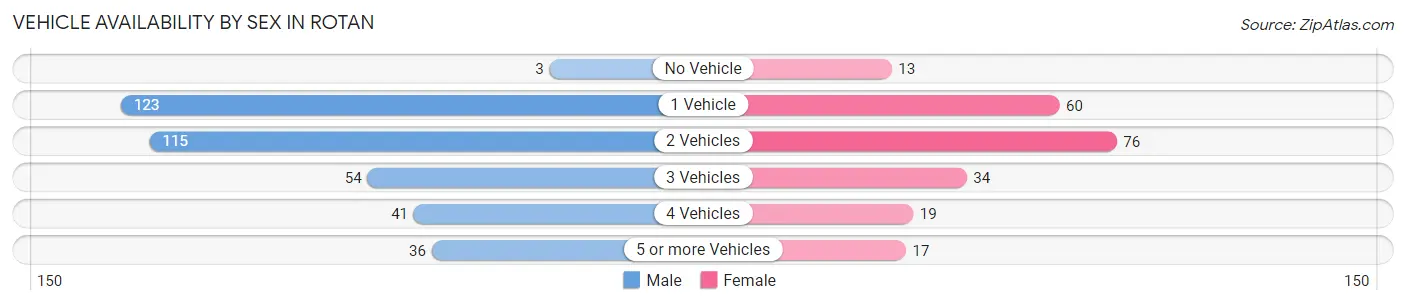
| Vehicles Available | Male | Female |
| No Vehicle | 3 (0.8%) | 13 (5.9%) |
| 1 Vehicle | 123 (33.1%) | 60 (27.4%) |
| 2 Vehicles | 115 (30.9%) | 76 (34.7%) |
| 3 Vehicles | 54 (14.5%) | 34 (15.5%) |
| 4 Vehicles | 41 (11.0%) | 19 (8.7%) |
| 5 or more Vehicles | 36 (9.7%) | 17 (7.8%) |
| Total | 372 (100.0%) | 219 (100.0%) |
Commute Time in Rotan
The most frequently occuring commute durations in Rotan are 5 to 9 minutes (190 commuters, 33.3%), less than 5 minutes (106 commuters, 18.6%), and 10 to 14 minutes (103 commuters, 18.0%).
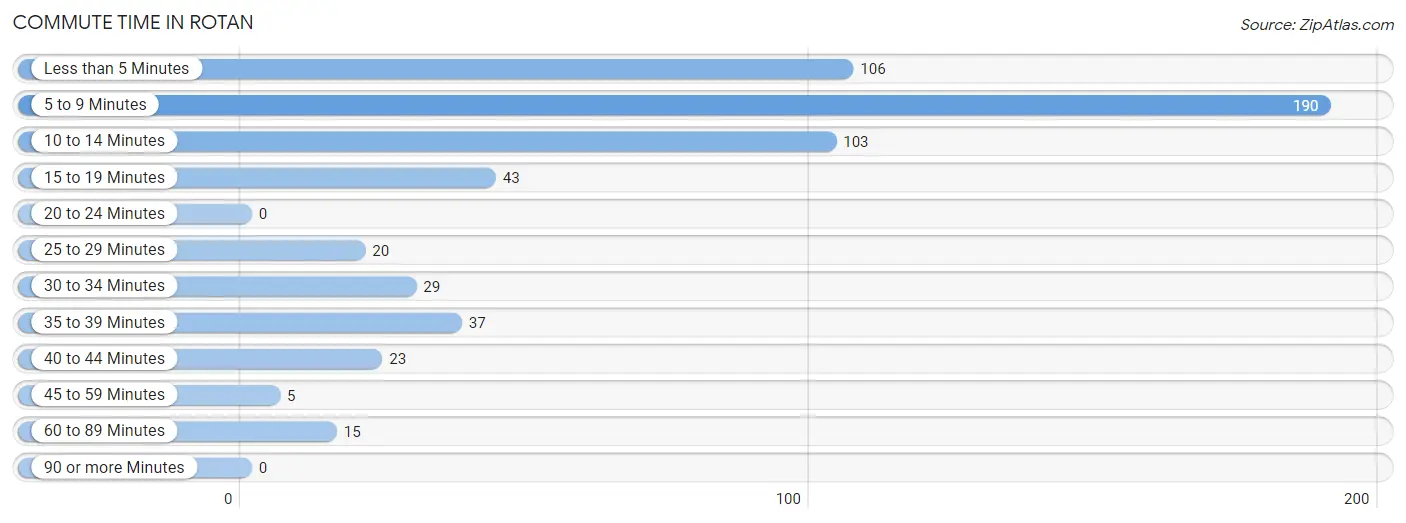
| Commute Time | # Commuters | % Commuters |
| Less than 5 Minutes | 106 | 18.6% |
| 5 to 9 Minutes | 190 | 33.3% |
| 10 to 14 Minutes | 103 | 18.0% |
| 15 to 19 Minutes | 43 | 7.5% |
| 20 to 24 Minutes | 0 | 0.0% |
| 25 to 29 Minutes | 20 | 3.5% |
| 30 to 34 Minutes | 29 | 5.1% |
| 35 to 39 Minutes | 37 | 6.5% |
| 40 to 44 Minutes | 23 | 4.0% |
| 45 to 59 Minutes | 5 | 0.9% |
| 60 to 89 Minutes | 15 | 2.6% |
| 90 or more Minutes | 0 | 0.0% |
Commute Time by Sex in Rotan
The most common commute times in Rotan are 5 to 9 minutes (161 commuters, 44.1%) for males and less than 5 minutes (48 commuters, 23.3%) for females.
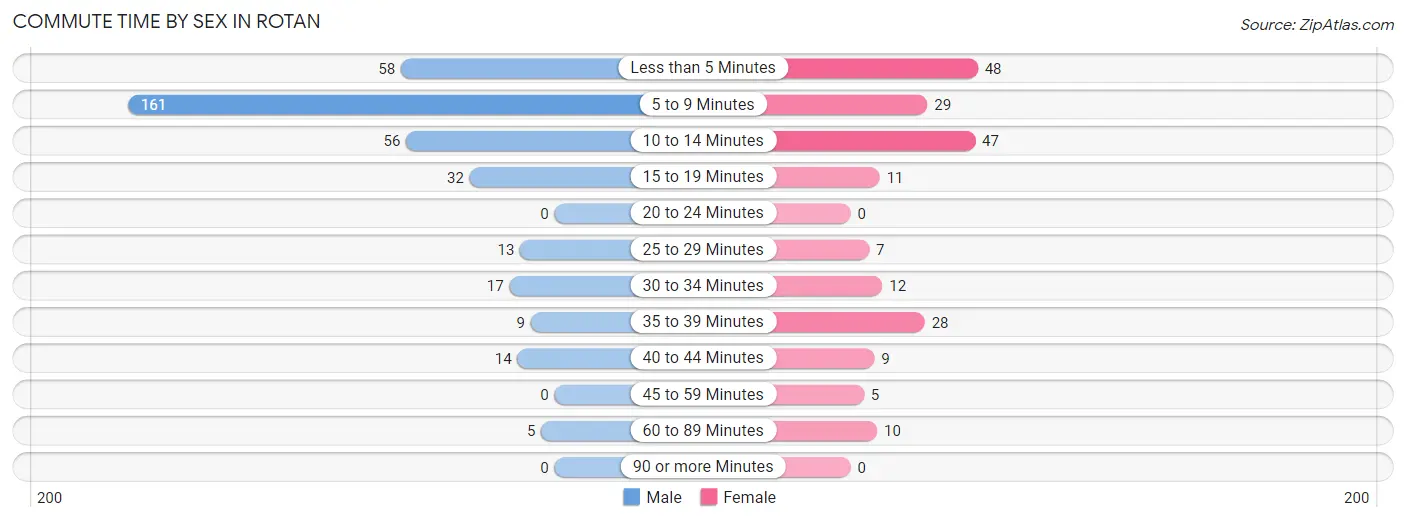
| Commute Time | Male | Female |
| Less than 5 Minutes | 58 (15.9%) | 48 (23.3%) |
| 5 to 9 Minutes | 161 (44.1%) | 29 (14.1%) |
| 10 to 14 Minutes | 56 (15.3%) | 47 (22.8%) |
| 15 to 19 Minutes | 32 (8.8%) | 11 (5.3%) |
| 20 to 24 Minutes | 0 (0.0%) | 0 (0.0%) |
| 25 to 29 Minutes | 13 (3.6%) | 7 (3.4%) |
| 30 to 34 Minutes | 17 (4.7%) | 12 (5.8%) |
| 35 to 39 Minutes | 9 (2.5%) | 28 (13.6%) |
| 40 to 44 Minutes | 14 (3.8%) | 9 (4.4%) |
| 45 to 59 Minutes | 0 (0.0%) | 5 (2.4%) |
| 60 to 89 Minutes | 5 (1.4%) | 10 (4.9%) |
| 90 or more Minutes | 0 (0.0%) | 0 (0.0%) |
Time of Departure to Work by Sex in Rotan
The most frequent times of departure to work in Rotan are 8:00 AM to 8:29 AM (112, 30.7%) for males and 6:00 AM to 6:29 AM (41, 19.9%) for females.
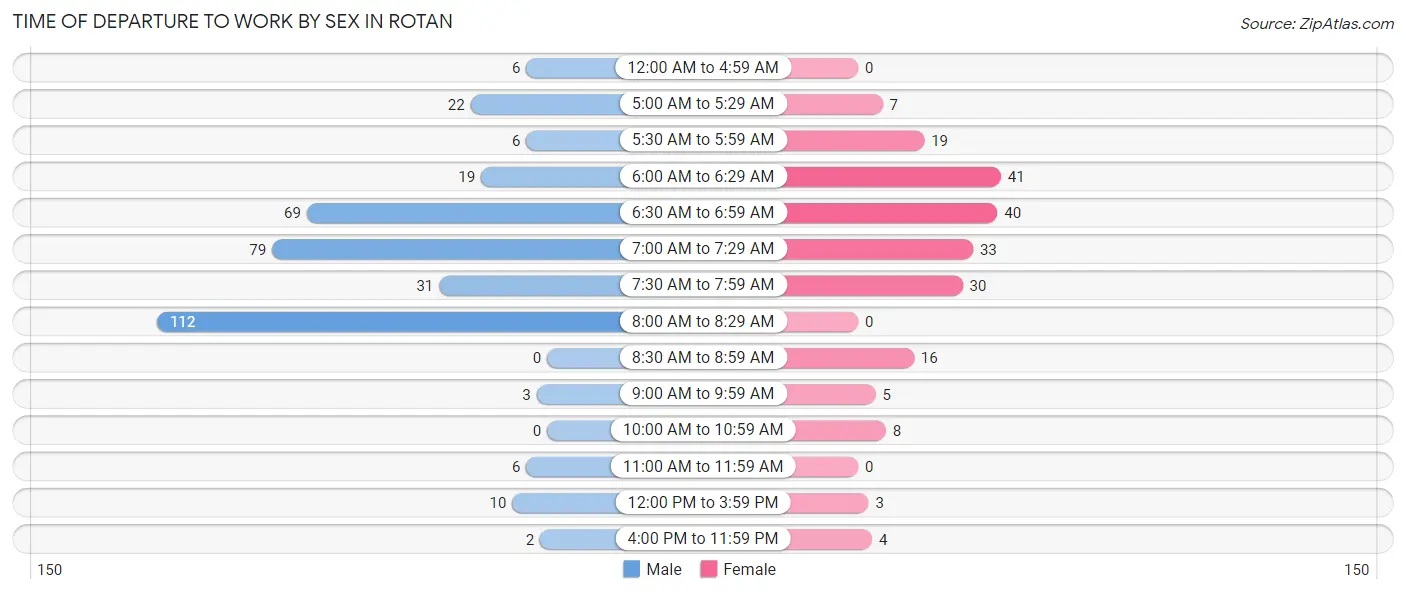
| Time of Departure | Male | Female |
| 12:00 AM to 4:59 AM | 6 (1.6%) | 0 (0.0%) |
| 5:00 AM to 5:29 AM | 22 (6.0%) | 7 (3.4%) |
| 5:30 AM to 5:59 AM | 6 (1.6%) | 19 (9.2%) |
| 6:00 AM to 6:29 AM | 19 (5.2%) | 41 (19.9%) |
| 6:30 AM to 6:59 AM | 69 (18.9%) | 40 (19.4%) |
| 7:00 AM to 7:29 AM | 79 (21.6%) | 33 (16.0%) |
| 7:30 AM to 7:59 AM | 31 (8.5%) | 30 (14.6%) |
| 8:00 AM to 8:29 AM | 112 (30.7%) | 0 (0.0%) |
| 8:30 AM to 8:59 AM | 0 (0.0%) | 16 (7.8%) |
| 9:00 AM to 9:59 AM | 3 (0.8%) | 5 (2.4%) |
| 10:00 AM to 10:59 AM | 0 (0.0%) | 8 (3.9%) |
| 11:00 AM to 11:59 AM | 6 (1.6%) | 0 (0.0%) |
| 12:00 PM to 3:59 PM | 10 (2.7%) | 3 (1.5%) |
| 4:00 PM to 11:59 PM | 2 (0.5%) | 4 (1.9%) |
| Total | 365 (100.0%) | 206 (100.0%) |
Housing Occupancy in Rotan
Occupancy by Ownership in Rotan
Of the total 503 dwellings in Rotan, owner-occupied units account for 339 (67.4%), while renter-occupied units make up 164 (32.6%).
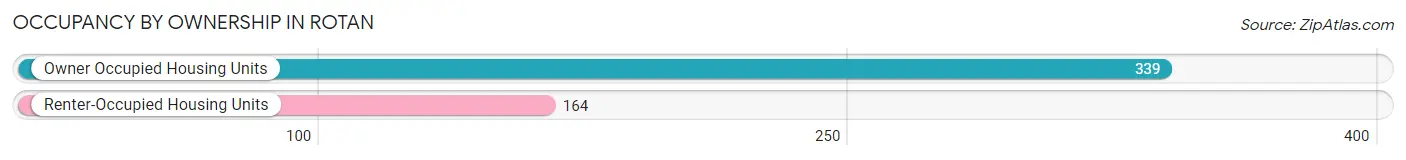
| Occupancy | # Housing Units | % Housing Units |
| Owner Occupied Housing Units | 339 | 67.4% |
| Renter-Occupied Housing Units | 164 | 32.6% |
| Total Occupied Housing Units | 503 | 100.0% |
Occupancy by Household Size in Rotan
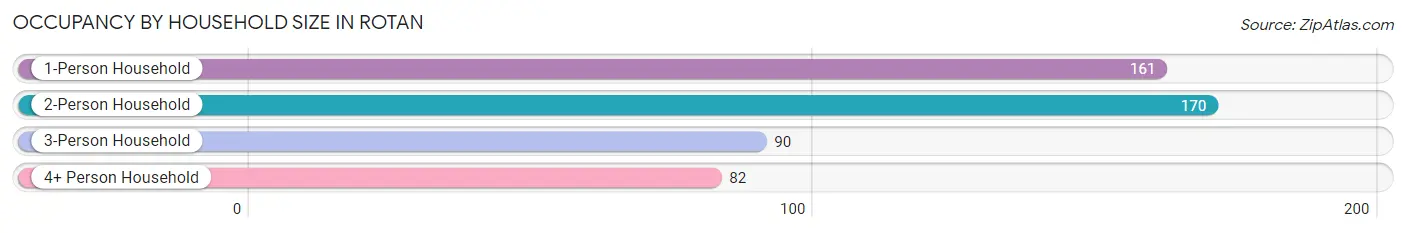
| Household Size | # Housing Units | % Housing Units |
| 1-Person Household | 161 | 32.0% |
| 2-Person Household | 170 | 33.8% |
| 3-Person Household | 90 | 17.9% |
| 4+ Person Household | 82 | 16.3% |
| Total Housing Units | 503 | 100.0% |
Occupancy by Ownership by Household Size in Rotan
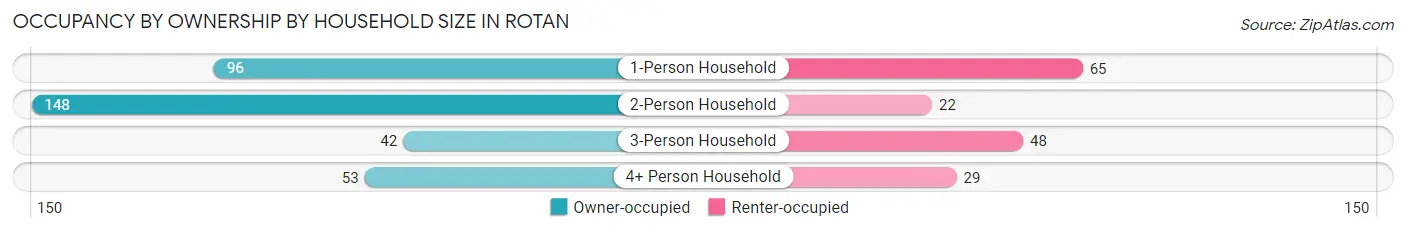
| Household Size | Owner-occupied | Renter-occupied |
| 1-Person Household | 96 (59.6%) | 65 (40.4%) |
| 2-Person Household | 148 (87.1%) | 22 (12.9%) |
| 3-Person Household | 42 (46.7%) | 48 (53.3%) |
| 4+ Person Household | 53 (64.6%) | 29 (35.4%) |
| Total Housing Units | 339 (67.4%) | 164 (32.6%) |
Occupancy by Educational Attainment in Rotan
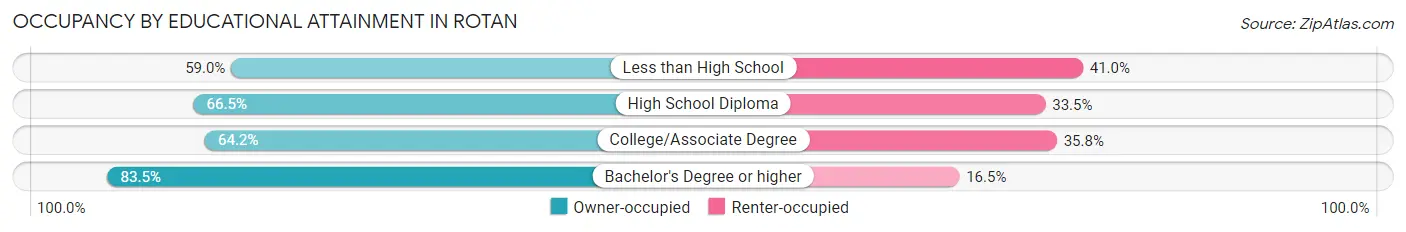
| Household Size | Owner-occupied | Renter-occupied |
| Less than High School | 49 (59.0%) | 34 (41.0%) |
| High School Diploma | 115 (66.5%) | 58 (33.5%) |
| College/Associate Degree | 104 (64.2%) | 58 (35.8%) |
| Bachelor's Degree or higher | 71 (83.5%) | 14 (16.5%) |
Occupancy by Age of Householder in Rotan
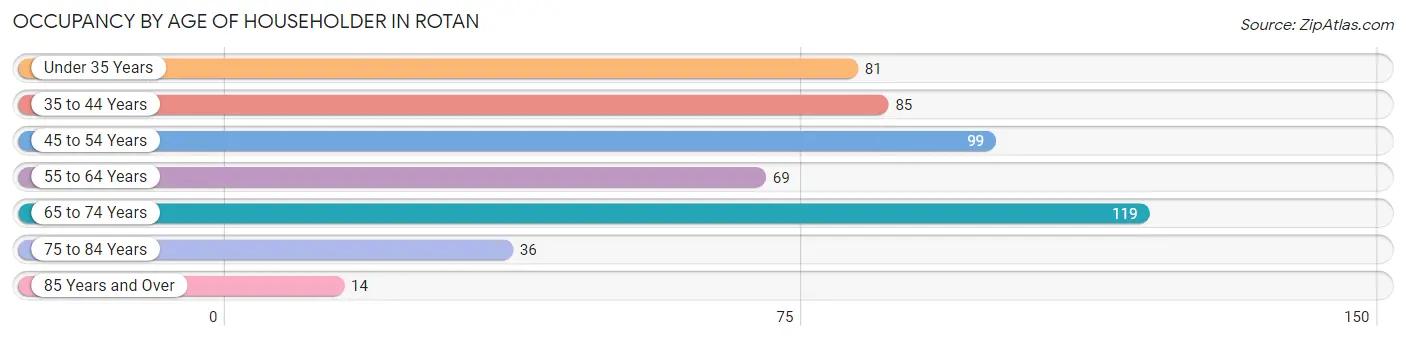
| Age Bracket | # Households | % Households |
| Under 35 Years | 81 | 16.1% |
| 35 to 44 Years | 85 | 16.9% |
| 45 to 54 Years | 99 | 19.7% |
| 55 to 64 Years | 69 | 13.7% |
| 65 to 74 Years | 119 | 23.7% |
| 75 to 84 Years | 36 | 7.2% |
| 85 Years and Over | 14 | 2.8% |
| Total | 503 | 100.0% |
Housing Finances in Rotan
Median Income by Occupancy in Rotan
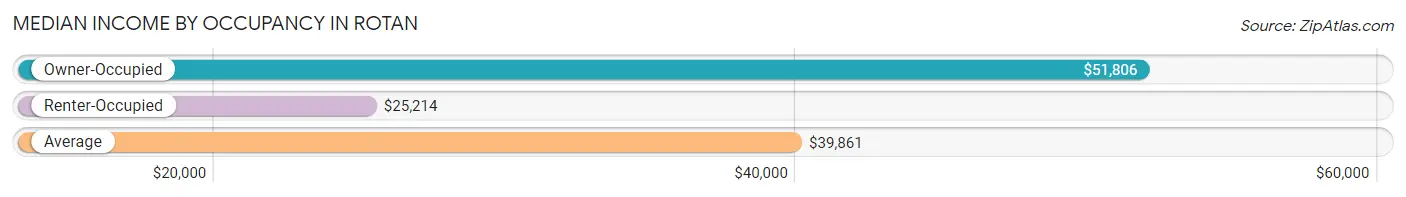
| Occupancy Type | # Households | Median Income |
| Owner-Occupied | 339 (67.4%) | $51,806 |
| Renter-Occupied | 164 (32.6%) | $25,214 |
| Average | 503 (100.0%) | $39,861 |
Occupancy by Householder Income Bracket in Rotan
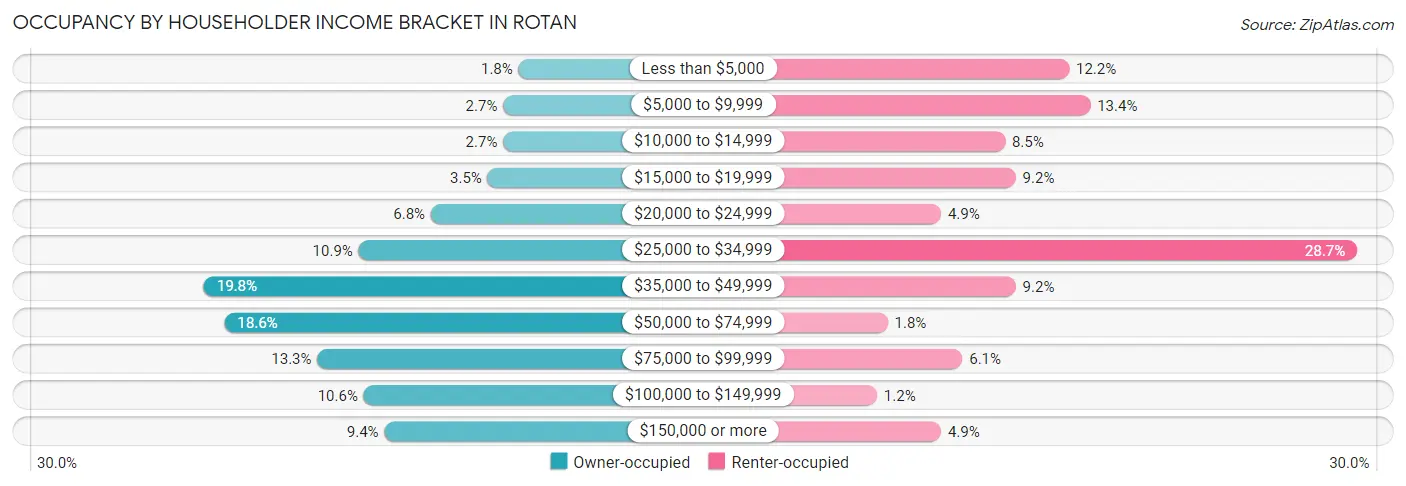
| Income Bracket | Owner-occupied | Renter-occupied |
| Less than $5,000 | 6 (1.8%) | 20 (12.2%) |
| $5,000 to $9,999 | 9 (2.6%) | 22 (13.4%) |
| $10,000 to $14,999 | 9 (2.6%) | 14 (8.5%) |
| $15,000 to $19,999 | 12 (3.5%) | 15 (9.1%) |
| $20,000 to $24,999 | 23 (6.8%) | 8 (4.9%) |
| $25,000 to $34,999 | 37 (10.9%) | 47 (28.7%) |
| $35,000 to $49,999 | 67 (19.8%) | 15 (9.1%) |
| $50,000 to $74,999 | 63 (18.6%) | 3 (1.8%) |
| $75,000 to $99,999 | 45 (13.3%) | 10 (6.1%) |
| $100,000 to $149,999 | 36 (10.6%) | 2 (1.2%) |
| $150,000 or more | 32 (9.4%) | 8 (4.9%) |
| Total | 339 (100.0%) | 164 (100.0%) |
Monthly Housing Cost Tiers in Rotan
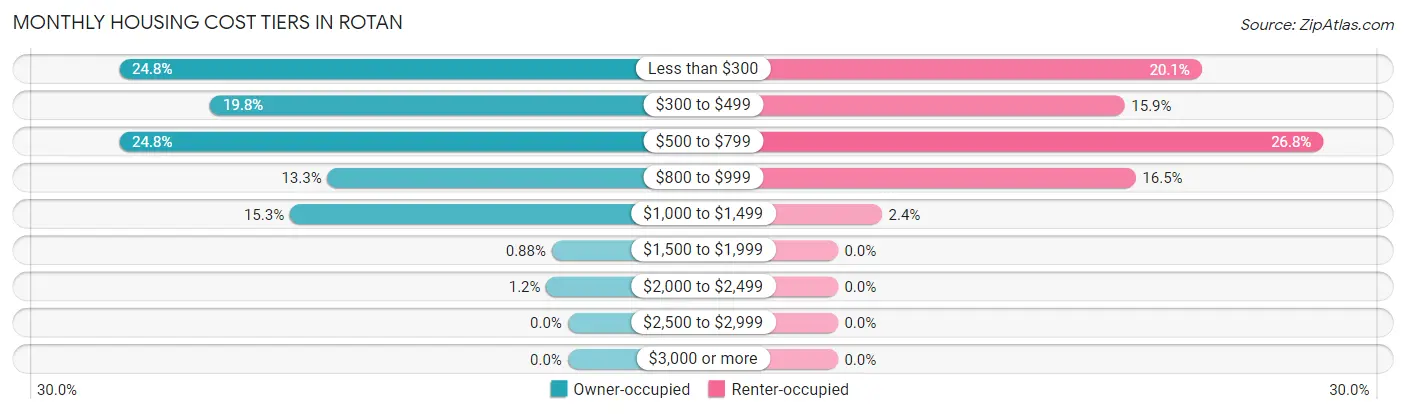
| Monthly Cost | Owner-occupied | Renter-occupied |
| Less than $300 | 84 (24.8%) | 33 (20.1%) |
| $300 to $499 | 67 (19.8%) | 26 (15.9%) |
| $500 to $799 | 84 (24.8%) | 44 (26.8%) |
| $800 to $999 | 45 (13.3%) | 27 (16.5%) |
| $1,000 to $1,499 | 52 (15.3%) | 4 (2.4%) |
| $1,500 to $1,999 | 3 (0.9%) | 0 (0.0%) |
| $2,000 to $2,499 | 4 (1.2%) | 0 (0.0%) |
| $2,500 to $2,999 | 0 (0.0%) | 0 (0.0%) |
| $3,000 or more | 0 (0.0%) | 0 (0.0%) |
| Total | 339 (100.0%) | 164 (100.0%) |
Physical Housing Characteristics in Rotan
Housing Structures in Rotan
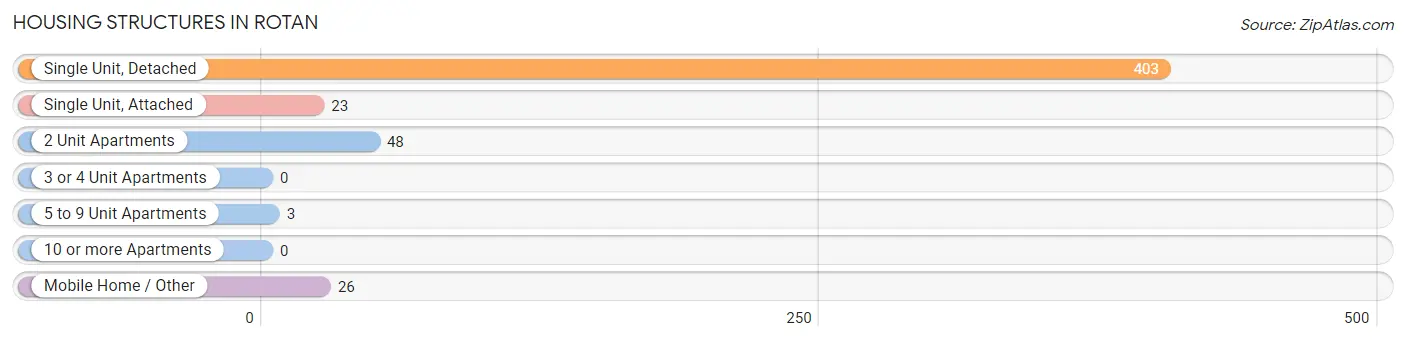
| Structure Type | # Housing Units | % Housing Units |
| Single Unit, Detached | 403 | 80.1% |
| Single Unit, Attached | 23 | 4.6% |
| 2 Unit Apartments | 48 | 9.5% |
| 3 or 4 Unit Apartments | 0 | 0.0% |
| 5 to 9 Unit Apartments | 3 | 0.6% |
| 10 or more Apartments | 0 | 0.0% |
| Mobile Home / Other | 26 | 5.2% |
| Total | 503 | 100.0% |
Housing Structures by Occupancy in Rotan
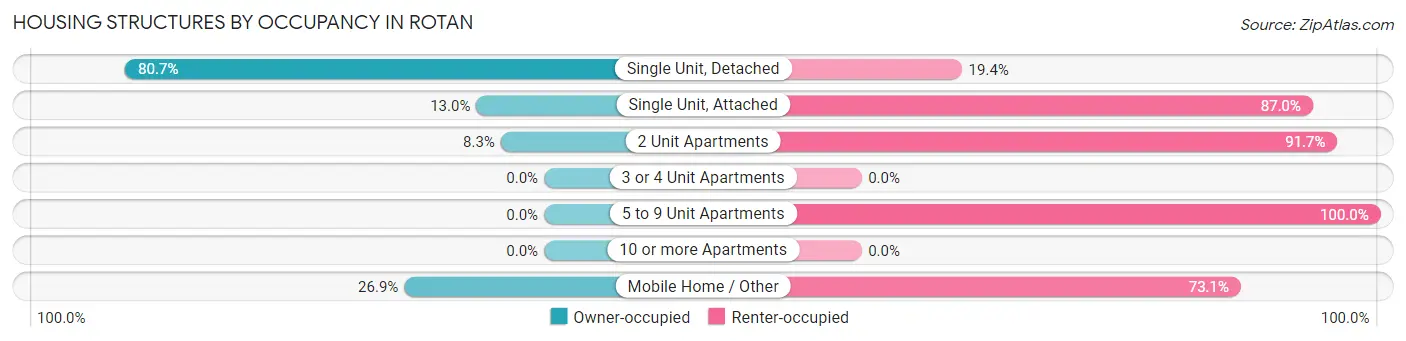
| Structure Type | Owner-occupied | Renter-occupied |
| Single Unit, Detached | 325 (80.6%) | 78 (19.4%) |
| Single Unit, Attached | 3 (13.0%) | 20 (87.0%) |
| 2 Unit Apartments | 4 (8.3%) | 44 (91.7%) |
| 3 or 4 Unit Apartments | 0 (0.0%) | 0 (0.0%) |
| 5 to 9 Unit Apartments | 0 (0.0%) | 3 (100.0%) |
| 10 or more Apartments | 0 (0.0%) | 0 (0.0%) |
| Mobile Home / Other | 7 (26.9%) | 19 (73.1%) |
| Total | 339 (67.4%) | 164 (32.6%) |
Housing Structures by Number of Rooms in Rotan
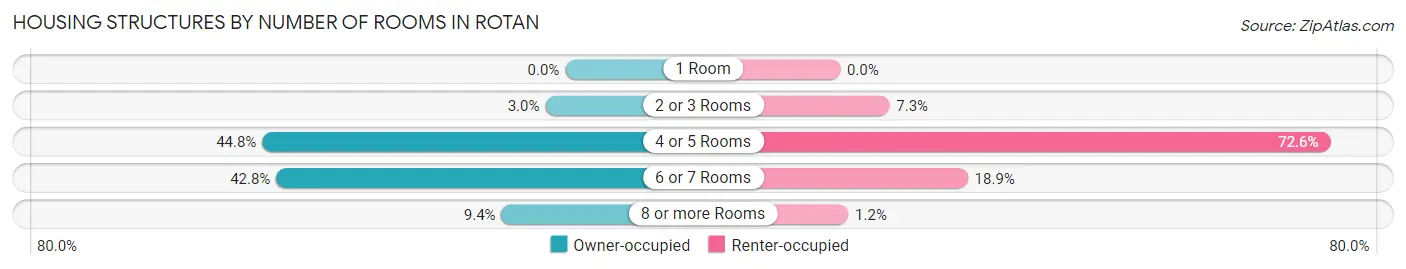
| Number of Rooms | Owner-occupied | Renter-occupied |
| 1 Room | 0 (0.0%) | 0 (0.0%) |
| 2 or 3 Rooms | 10 (2.9%) | 12 (7.3%) |
| 4 or 5 Rooms | 152 (44.8%) | 119 (72.6%) |
| 6 or 7 Rooms | 145 (42.8%) | 31 (18.9%) |
| 8 or more Rooms | 32 (9.4%) | 2 (1.2%) |
| Total | 339 (100.0%) | 164 (100.0%) |
Housing Structure by Heating Type in Rotan
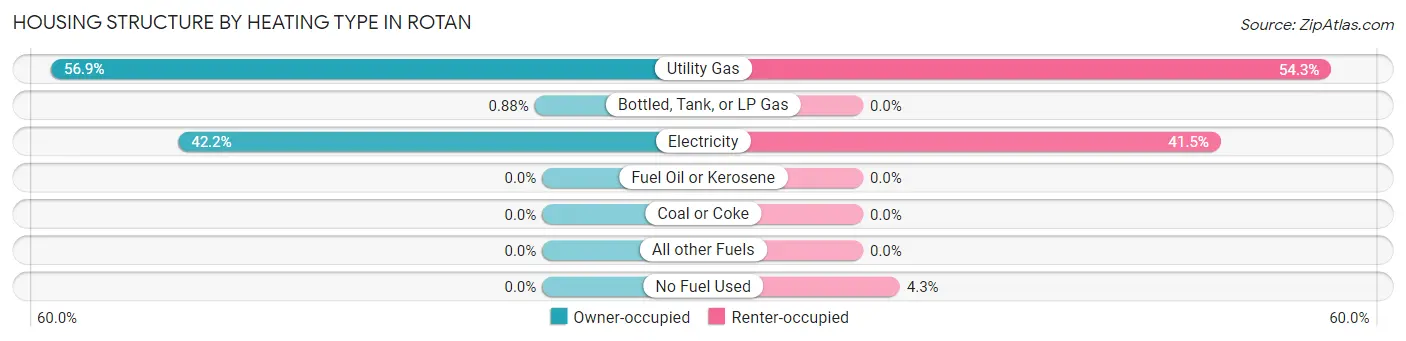
| Heating Type | Owner-occupied | Renter-occupied |
| Utility Gas | 193 (56.9%) | 89 (54.3%) |
| Bottled, Tank, or LP Gas | 3 (0.9%) | 0 (0.0%) |
| Electricity | 143 (42.2%) | 68 (41.5%) |
| Fuel Oil or Kerosene | 0 (0.0%) | 0 (0.0%) |
| Coal or Coke | 0 (0.0%) | 0 (0.0%) |
| All other Fuels | 0 (0.0%) | 0 (0.0%) |
| No Fuel Used | 0 (0.0%) | 7 (4.3%) |
| Total | 339 (100.0%) | 164 (100.0%) |
Household Vehicle Usage in Rotan
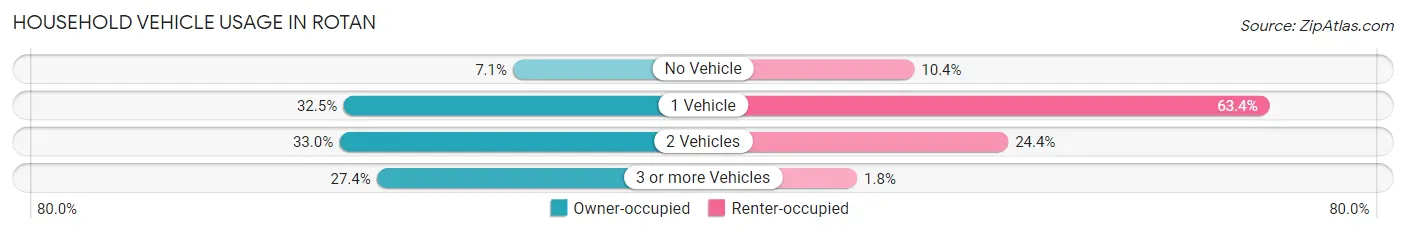
| Vehicles per Household | Owner-occupied | Renter-occupied |
| No Vehicle | 24 (7.1%) | 17 (10.4%) |
| 1 Vehicle | 110 (32.5%) | 104 (63.4%) |
| 2 Vehicles | 112 (33.0%) | 40 (24.4%) |
| 3 or more Vehicles | 93 (27.4%) | 3 (1.8%) |
| Total | 339 (100.0%) | 164 (100.0%) |
Real Estate & Mortgages in Rotan
Real Estate and Mortgage Overview in Rotan
| Characteristic | Without Mortgage | With Mortgage |
| Housing Units | 226 | 113 |
| Median Property Value | $47,900 | $60,600 |
| Median Household Income | $48,800 | $24 |
| Monthly Housing Costs | $375 | $0 |
| Real Estate Taxes | $1,007 | $8 |
Property Value by Mortgage Status in Rotan
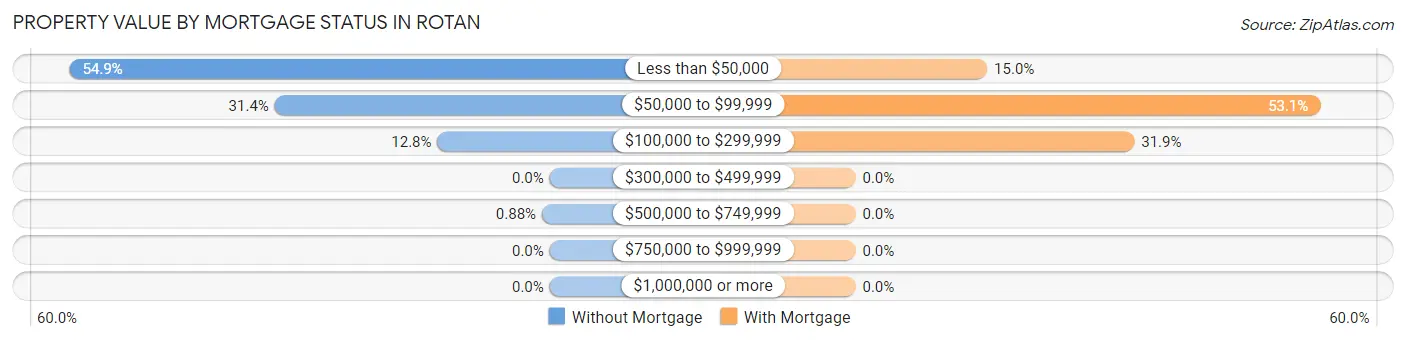
| Property Value | Without Mortgage | With Mortgage |
| Less than $50,000 | 124 (54.9%) | 17 (15.0%) |
| $50,000 to $99,999 | 71 (31.4%) | 60 (53.1%) |
| $100,000 to $299,999 | 29 (12.8%) | 36 (31.9%) |
| $300,000 to $499,999 | 0 (0.0%) | 0 (0.0%) |
| $500,000 to $749,999 | 2 (0.9%) | 0 (0.0%) |
| $750,000 to $999,999 | 0 (0.0%) | 0 (0.0%) |
| $1,000,000 or more | 0 (0.0%) | 0 (0.0%) |
| Total | 226 (100.0%) | 113 (100.0%) |
Household Income by Mortgage Status in Rotan
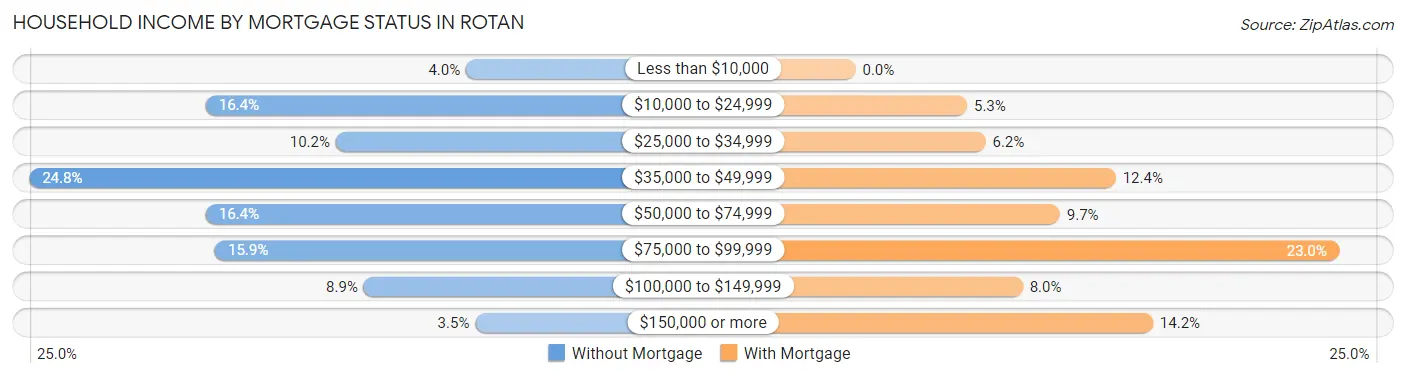
| Household Income | Without Mortgage | With Mortgage |
| Less than $10,000 | 9 (4.0%) | 0 (0.0%) |
| $10,000 to $24,999 | 37 (16.4%) | 6 (5.3%) |
| $25,000 to $34,999 | 23 (10.2%) | 7 (6.2%) |
| $35,000 to $49,999 | 56 (24.8%) | 14 (12.4%) |
| $50,000 to $74,999 | 37 (16.4%) | 11 (9.7%) |
| $75,000 to $99,999 | 36 (15.9%) | 26 (23.0%) |
| $100,000 to $149,999 | 20 (8.8%) | 9 (8.0%) |
| $150,000 or more | 8 (3.5%) | 16 (14.2%) |
| Total | 226 (100.0%) | 113 (100.0%) |
Property Value to Household Income Ratio in Rotan
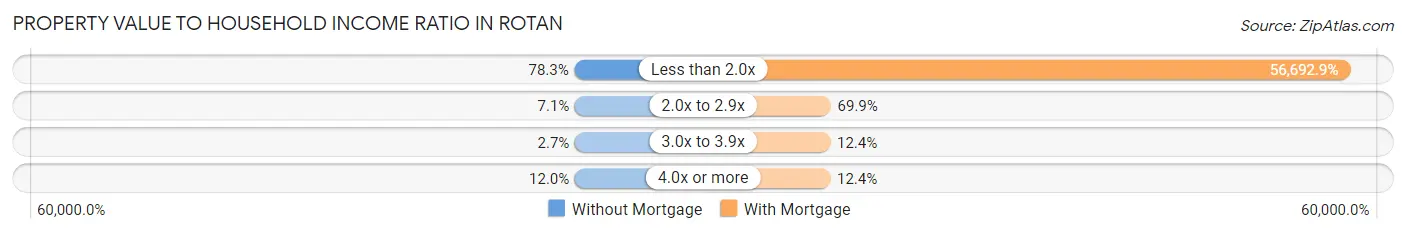
| Value-to-Income Ratio | Without Mortgage | With Mortgage |
| Less than 2.0x | 177 (78.3%) | 64,063 (56,692.9%) |
| 2.0x to 2.9x | 16 (7.1%) | 79 (69.9%) |
| 3.0x to 3.9x | 6 (2.6%) | 14 (12.4%) |
| 4.0x or more | 27 (11.9%) | 14 (12.4%) |
| Total | 226 (100.0%) | 113 (100.0%) |
Real Estate Taxes by Mortgage Status in Rotan
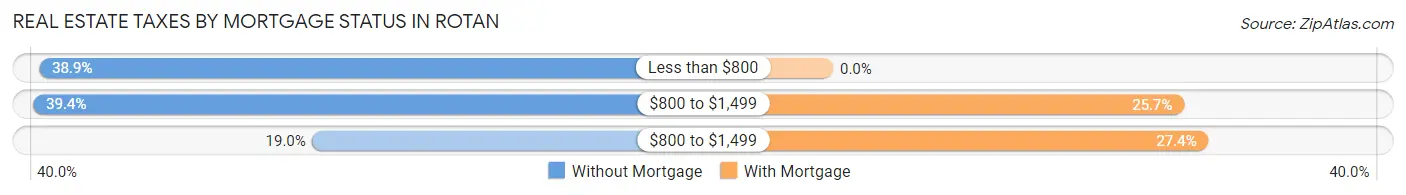
| Property Taxes | Without Mortgage | With Mortgage |
| Less than $800 | 88 (38.9%) | 0 (0.0%) |
| $800 to $1,499 | 89 (39.4%) | 29 (25.7%) |
| $800 to $1,499 | 43 (19.0%) | 31 (27.4%) |
| Total | 226 (100.0%) | 113 (100.0%) |
Health & Disability in Rotan
Health Insurance Coverage by Age in Rotan
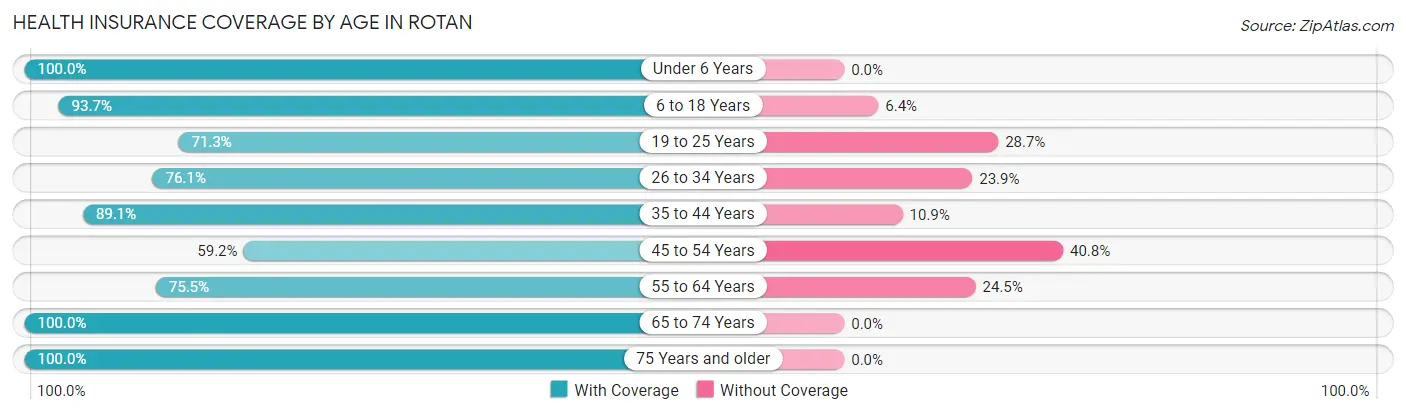
| Age Bracket | With Coverage | Without Coverage |
| Under 6 Years | 108 (100.0%) | 0 (0.0%) |
| 6 to 18 Years | 177 (93.6%) | 12 (6.4%) |
| 19 to 25 Years | 82 (71.3%) | 33 (28.7%) |
| 26 to 34 Years | 118 (76.1%) | 37 (23.9%) |
| 35 to 44 Years | 123 (89.1%) | 15 (10.9%) |
| 45 to 54 Years | 90 (59.2%) | 62 (40.8%) |
| 55 to 64 Years | 111 (75.5%) | 36 (24.5%) |
| 65 to 74 Years | 164 (100.0%) | 0 (0.0%) |
| 75 Years and older | 102 (100.0%) | 0 (0.0%) |
| Total | 1,075 (84.7%) | 195 (15.3%) |
Health Insurance Coverage by Citizenship Status in Rotan
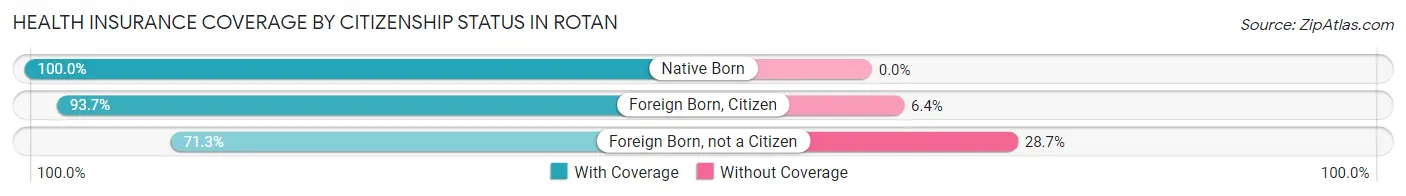
| Citizenship Status | With Coverage | Without Coverage |
| Native Born | 108 (100.0%) | 0 (0.0%) |
| Foreign Born, Citizen | 177 (93.6%) | 12 (6.4%) |
| Foreign Born, not a Citizen | 82 (71.3%) | 33 (28.7%) |
Health Insurance Coverage by Household Income in Rotan
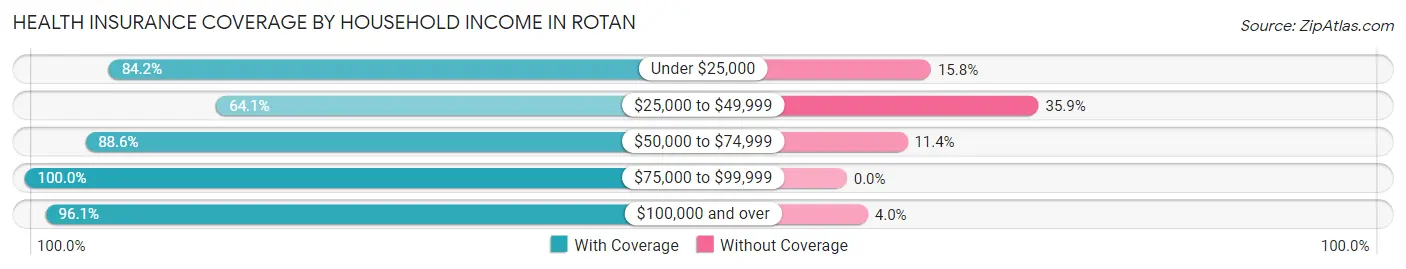
| Household Income | With Coverage | Without Coverage |
| Under $25,000 | 251 (84.2%) | 47 (15.8%) |
| $25,000 to $49,999 | 198 (64.1%) | 111 (35.9%) |
| $50,000 to $74,999 | 195 (88.6%) | 25 (11.4%) |
| $75,000 to $99,999 | 121 (100.0%) | 0 (0.0%) |
| $100,000 and over | 292 (96.1%) | 12 (4.0%) |
Public vs Private Health Insurance Coverage by Age in Rotan
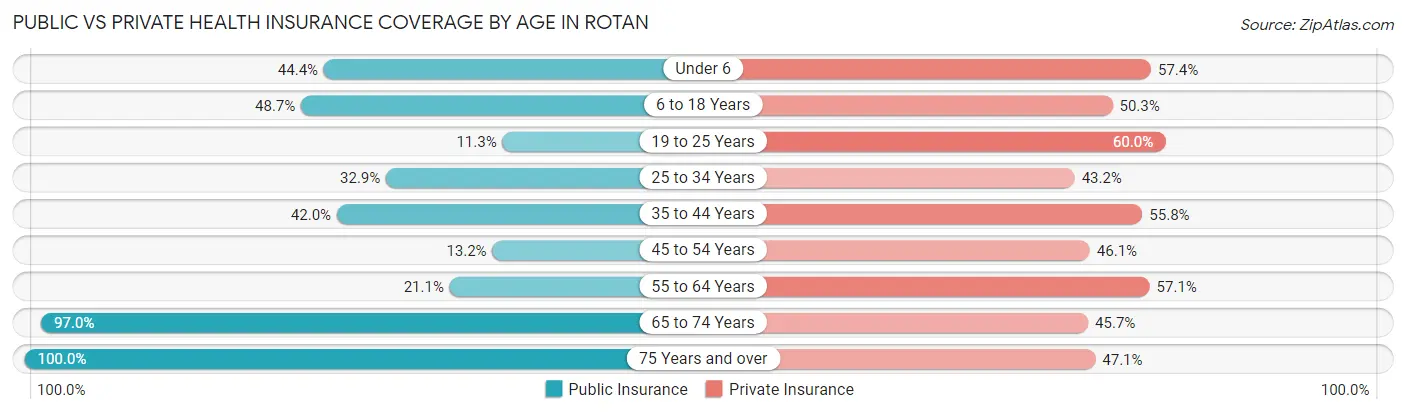
| Age Bracket | Public Insurance | Private Insurance |
| Under 6 | 48 (44.4%) | 62 (57.4%) |
| 6 to 18 Years | 92 (48.7%) | 95 (50.3%) |
| 19 to 25 Years | 13 (11.3%) | 69 (60.0%) |
| 25 to 34 Years | 51 (32.9%) | 67 (43.2%) |
| 35 to 44 Years | 58 (42.0%) | 77 (55.8%) |
| 45 to 54 Years | 20 (13.2%) | 70 (46.1%) |
| 55 to 64 Years | 31 (21.1%) | 84 (57.1%) |
| 65 to 74 Years | 159 (97.0%) | 75 (45.7%) |
| 75 Years and over | 102 (100.0%) | 48 (47.1%) |
| Total | 574 (45.2%) | 647 (50.9%) |
Disability Status by Sex by Age in Rotan
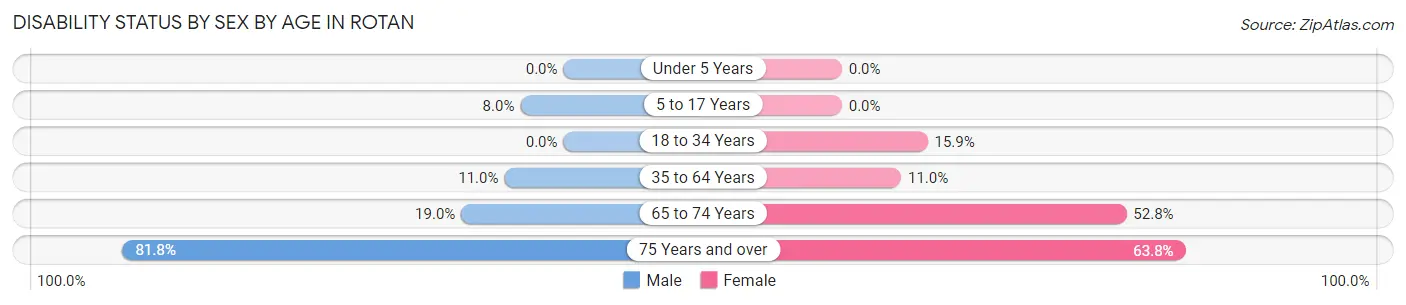
| Age Bracket | Male | Female |
| Under 5 Years | 0 (0.0%) | 0 (0.0%) |
| 5 to 17 Years | 6 (8.0%) | 0 (0.0%) |
| 18 to 34 Years | 0 (0.0%) | 21 (15.9%) |
| 35 to 64 Years | 26 (11.0%) | 22 (11.0%) |
| 65 to 74 Years | 11 (19.0%) | 56 (52.8%) |
| 75 Years and over | 27 (81.8%) | 44 (63.8%) |
Disability Class by Sex by Age in Rotan
Disability Class: Hearing Difficulty
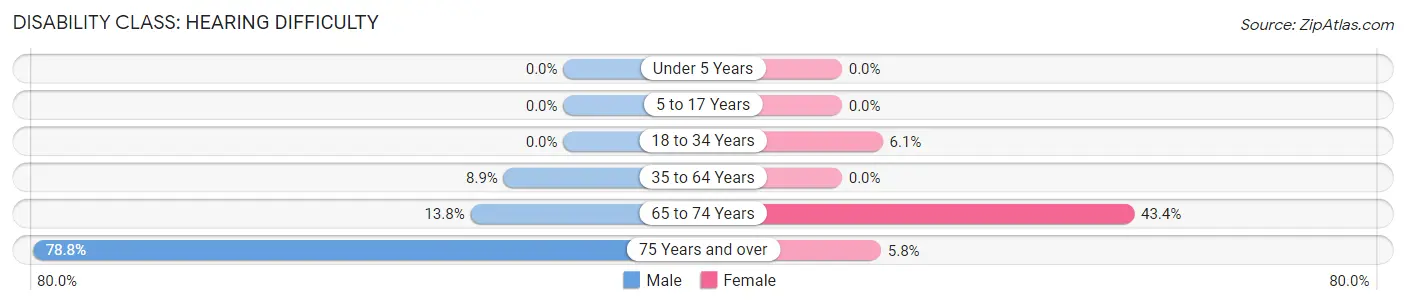
| Age Bracket | Male | Female |
| Under 5 Years | 0 (0.0%) | 0 (0.0%) |
| 5 to 17 Years | 0 (0.0%) | 0 (0.0%) |
| 18 to 34 Years | 0 (0.0%) | 8 (6.1%) |
| 35 to 64 Years | 21 (8.9%) | 0 (0.0%) |
| 65 to 74 Years | 8 (13.8%) | 46 (43.4%) |
| 75 Years and over | 26 (78.8%) | 4 (5.8%) |
Disability Class: Vision Difficulty
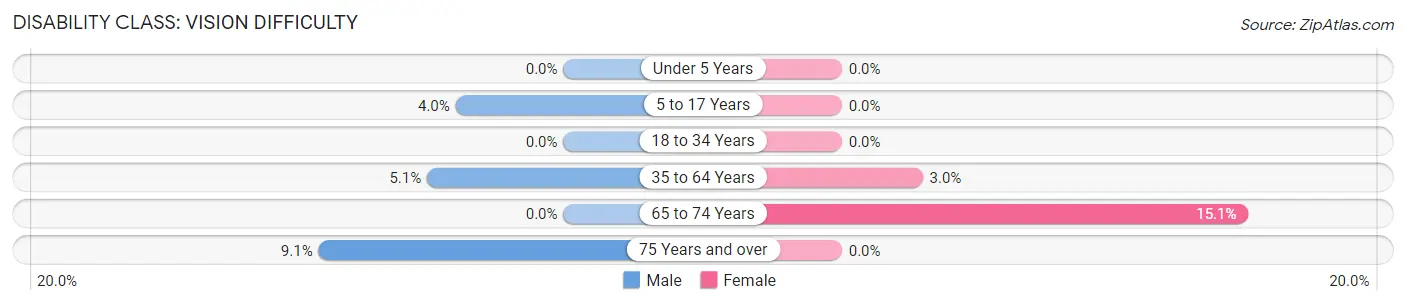
| Age Bracket | Male | Female |
| Under 5 Years | 0 (0.0%) | 0 (0.0%) |
| 5 to 17 Years | 3 (4.0%) | 0 (0.0%) |
| 18 to 34 Years | 0 (0.0%) | 0 (0.0%) |
| 35 to 64 Years | 12 (5.1%) | 6 (3.0%) |
| 65 to 74 Years | 0 (0.0%) | 16 (15.1%) |
| 75 Years and over | 3 (9.1%) | 0 (0.0%) |
Disability Class: Cognitive Difficulty
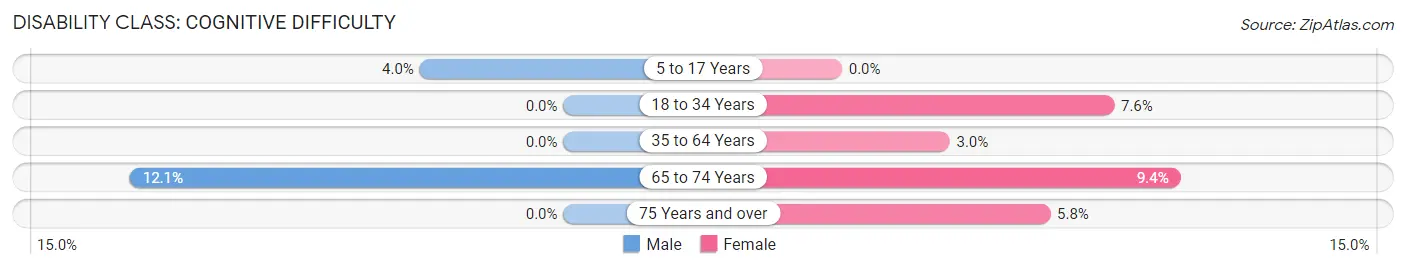
| Age Bracket | Male | Female |
| 5 to 17 Years | 3 (4.0%) | 0 (0.0%) |
| 18 to 34 Years | 0 (0.0%) | 10 (7.6%) |
| 35 to 64 Years | 0 (0.0%) | 6 (3.0%) |
| 65 to 74 Years | 7 (12.1%) | 10 (9.4%) |
| 75 Years and over | 0 (0.0%) | 4 (5.8%) |
Disability Class: Ambulatory Difficulty
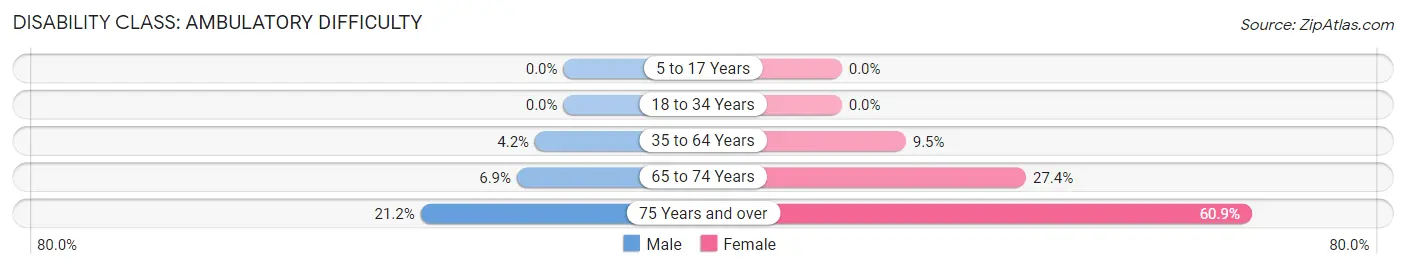
| Age Bracket | Male | Female |
| 5 to 17 Years | 0 (0.0%) | 0 (0.0%) |
| 18 to 34 Years | 0 (0.0%) | 0 (0.0%) |
| 35 to 64 Years | 10 (4.2%) | 19 (9.5%) |
| 65 to 74 Years | 4 (6.9%) | 29 (27.4%) |
| 75 Years and over | 7 (21.2%) | 42 (60.9%) |
Disability Class: Self-Care Difficulty
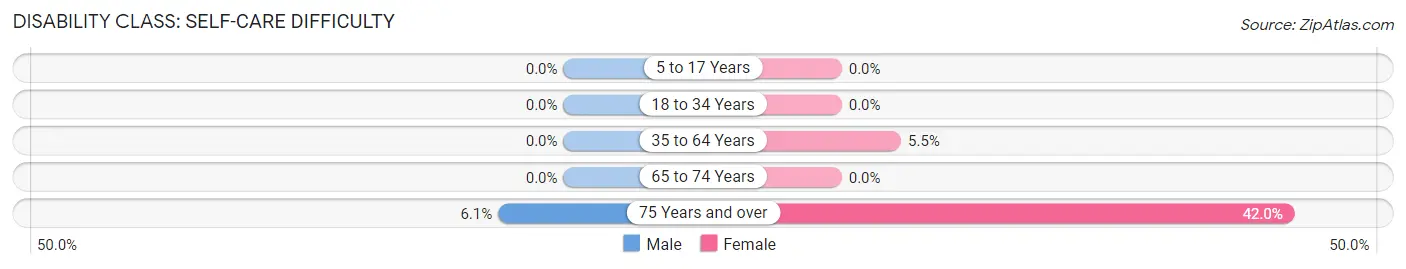
| Age Bracket | Male | Female |
| 5 to 17 Years | 0 (0.0%) | 0 (0.0%) |
| 18 to 34 Years | 0 (0.0%) | 0 (0.0%) |
| 35 to 64 Years | 0 (0.0%) | 11 (5.5%) |
| 65 to 74 Years | 0 (0.0%) | 0 (0.0%) |
| 75 Years and over | 2 (6.1%) | 29 (42.0%) |
Technology Access in Rotan
Computing Device Access in Rotan
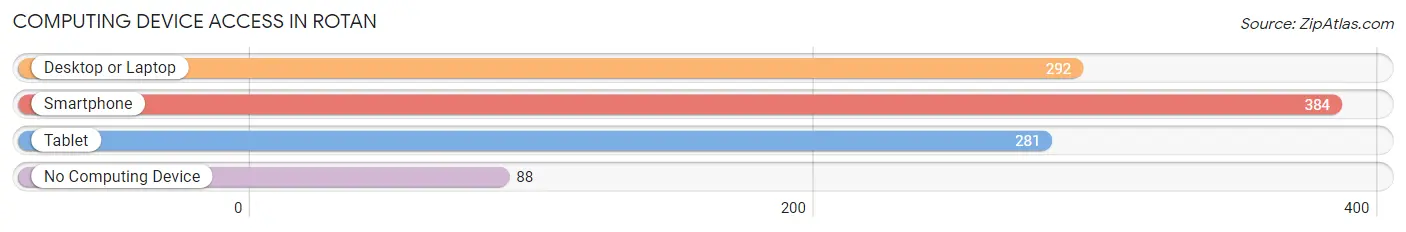
| Device Type | # Households | % Households |
| Desktop or Laptop | 292 | 58.1% |
| Smartphone | 384 | 76.3% |
| Tablet | 281 | 55.9% |
| No Computing Device | 88 | 17.5% |
| Total | 503 | 100.0% |
Internet Access in Rotan
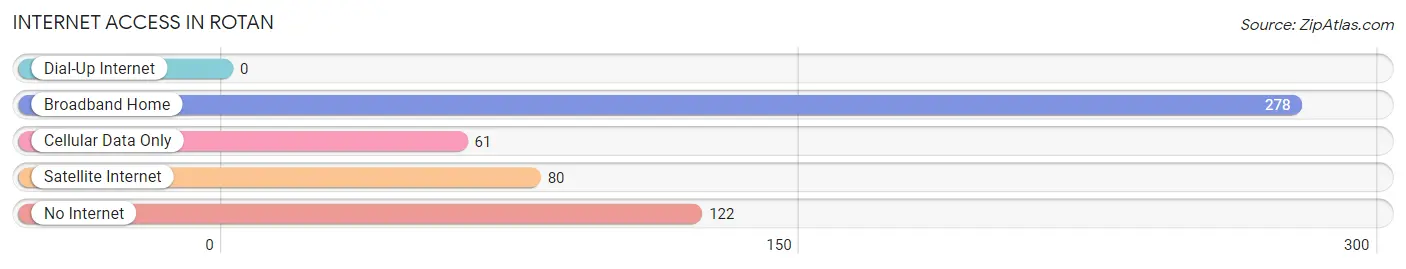
| Internet Type | # Households | % Households |
| Dial-Up Internet | 0 | 0.0% |
| Broadband Home | 278 | 55.3% |
| Cellular Data Only | 61 | 12.1% |
| Satellite Internet | 80 | 15.9% |
| No Internet | 122 | 24.2% |
| Total | 503 | 100.0% |
Rotan Summary
Rotan is a small town located in Fisher County, Texas, United States. It is situated on the western edge of the Texas Panhandle, approximately 90 miles southeast of Lubbock and 70 miles northwest of Abilene. The population of Rotan was 1,541 at the 2010 census.
History
The town of Rotan was founded in 1891 by the Santa Fe Railroad. The town was named after the Rotan family, who were early settlers in the area. The first post office was established in 1892.
In the early 1900s, Rotan was a thriving agricultural center, with cotton, corn, and wheat being the main crops. The town also had a number of businesses, including a bank, a hotel, a drug store, and a movie theater.
In the 1920s, the town began to decline as the railroad began to move away from the area. The Great Depression further exacerbated the town’s decline, and by the 1940s, the population had dropped to just over 500.
Geography
Rotan is located at 33°14'25" North, 100°25'45" West (33.240278, -100.429167). According to the United States Census Bureau, the town has a total area of 1.2 square miles (3.1 km2), all of it land.
Economy
The economy of Rotan is largely based on agriculture. The town is home to several cotton gins, as well as a number of grain elevators. The town also has a number of small businesses, including a grocery store, a hardware store, and a restaurant.
Demographics
As of the 2010 census, there were 1,541 people, 602 households, and 397 families residing in the town. The population density was 1,279.2 people per square mile (493.2/km2). There were 690 housing units at an average density of 575.0 per square mile (222.3/km2). The racial makeup of the town was 79.2% White, 0.7% African American, 0.7% Native American, 0.1% Asian, 16.7% from other races, and 2.6% from two or more races. Hispanic or Latino of any race were 33.2% of the population.
There were 602 households, out of which 33.1% had children under the age of 18 living with them, 48.3% were married couples living together, 12.3% had a female householder with no husband present, and 33.4% were non-families. 30.3% of all households were made up of individuals, and 16.3% had someone living alone who was 65 years of age or older. The average household size was 2.54 and the average family size was 3.17.
In the town, the population was spread out, with 28.2% under the age of 18, 8.2% from 18 to 24, 24.2% from 25 to 44, 22.2% from 45 to 64, and 17.2% who were 65 years of age or older. The median age was 37 years. For every 100 females, there were 91.2 males. For every 100 females age 18 and over, there were 86.2 males.
The median income for a household in the town was $25,938, and the median income for a family was $31,250. Males had a median income of $25,000 versus $17,500 for females. The per capita income for the town was $13,845. About 17.2% of families and 20.2% of the population were below the poverty line, including 28.3% of those under age 18 and 15.2% of those age 65 or over.
Common Questions
What is Per Capita Income in Rotan?
Per Capita income in Rotan is $26,370.
What is the Median Family Income in Rotan?
Median Family Income in Rotan is $51,607.
What is the Median Household income in Rotan?
Median Household Income in Rotan is $39,861.
What is Income or Wage Gap in Rotan?
Income or Wage Gap in Rotan is 40.1%.
Women in Rotan earn 59.9 cents for every dollar earned by a man.
What is Inequality or Gini Index in Rotan?
Inequality or Gini Index in Rotan is 0.46.
What is the Total Population of Rotan?
Total Population of Rotan is 1,270.
What is the Total Male Population of Rotan?
Total Male Population of Rotan is 602.
What is the Total Female Population of Rotan?
Total Female Population of Rotan is 668.
What is the Ratio of Males per 100 Females in Rotan?
There are 90.12 Males per 100 Females in Rotan.
What is the Ratio of Females per 100 Males in Rotan?
There are 110.96 Females per 100 Males in Rotan.
What is the Median Population Age in Rotan?
Median Population Age in Rotan is 39.0 Years.
What is the Average Family Size in Rotan
Average Family Size in Rotan is 3.1 People.
What is the Average Household Size in Rotan
Average Household Size in Rotan is 2.5 People.
How Large is the Labor Force in Rotan?
There are 629 People in the Labor Forcein in Rotan.
What is the Percentage of People in the Labor Force in Rotan?
62.4% of People are in the Labor Force in Rotan.
What is the Unemployment Rate in Rotan?
Unemployment Rate in Rotan is 4.1%.