Income Overview in Loma Linda East CDP Jim Wells County
Characteristic
Number
Measure
Per Capita Income
34
$32,929
Median Family Income
21
$0
Mean Family Income
21
$0
Median Household Income
21
$0
Mean Household Income
21
$0
Income Deficit
21
$0
Wage / Income Gap (%)
34
0.00%
Wage / Income Gap ($)
34
100.00¢ per $1
Gini / Inequality Index
34
0.31
Earnings by Sex in Loma Linda East CDP Jim Wells County
Sex
Number
Average Earnings
Male
0 (0.0%)
$0
Female
10 (100.0%)
$0
Total
10 (100.0%)
$0
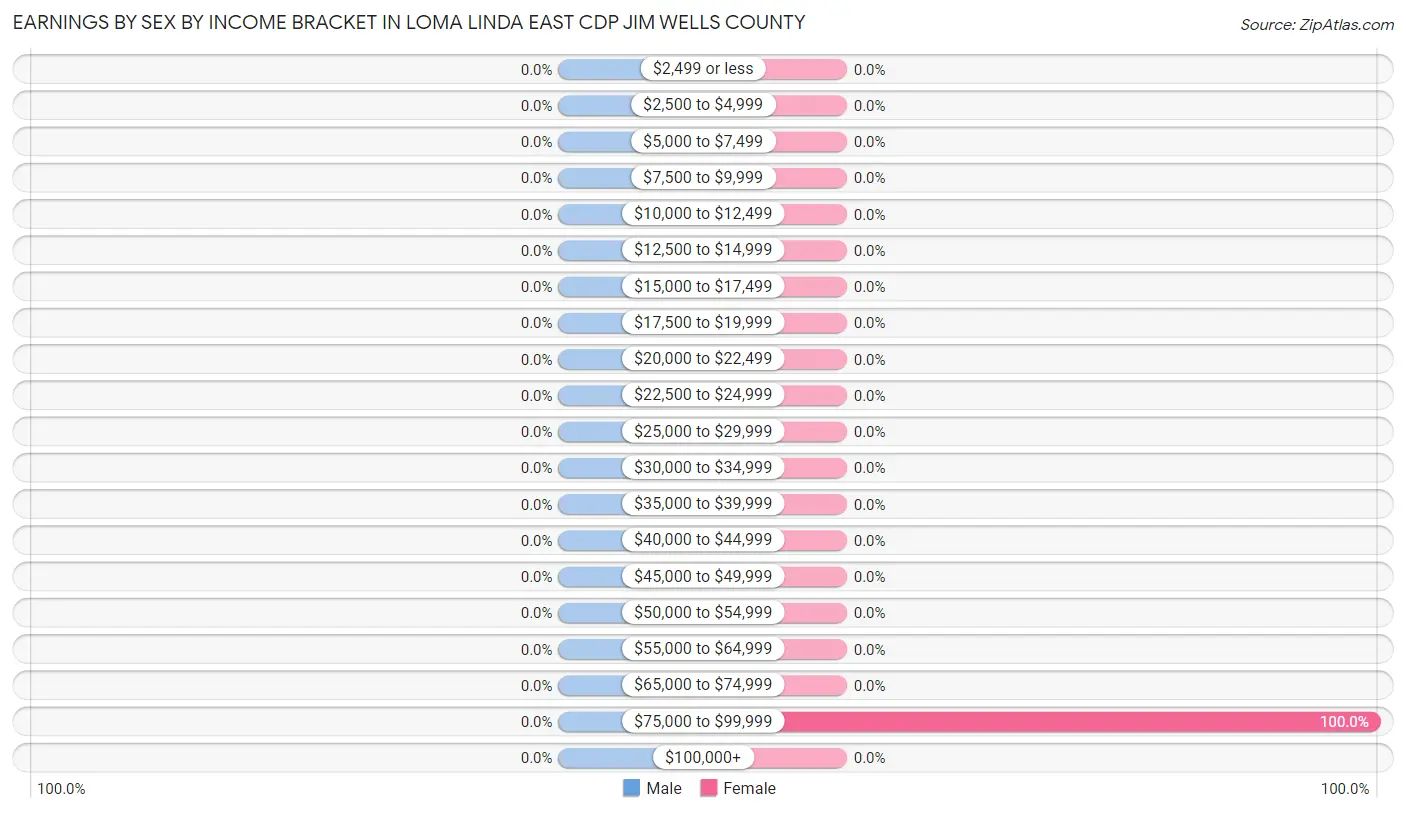
Earnings by Sex by Income Bracket in Loma Linda East CDP Jim Wells County
Income
Male
Female
$2,499 or less
0 (0.0%)
0 (0.0%)
$2,500 to $4,999
0 (0.0%)
0 (0.0%)
$5,000 to $7,499
0 (0.0%)
0 (0.0%)
$7,500 to $9,999
0 (0.0%)
0 (0.0%)
$10,000 to $12,499
0 (0.0%)
0 (0.0%)
$12,500 to $14,999
0 (0.0%)
0 (0.0%)
$15,000 to $17,499
0 (0.0%)
0 (0.0%)
$17,500 to $19,999
0 (0.0%)
0 (0.0%)
$20,000 to $22,499
0 (0.0%)
0 (0.0%)
$22,500 to $24,999
0 (0.0%)
0 (0.0%)
$25,000 to $29,999
0 (0.0%)
0 (0.0%)
$30,000 to $34,999
0 (0.0%)
0 (0.0%)
$35,000 to $39,999
0 (0.0%)
0 (0.0%)
$40,000 to $44,999
0 (0.0%)
0 (0.0%)
$45,000 to $49,999
0 (0.0%)
0 (0.0%)
$50,000 to $54,999
0 (0.0%)
0 (0.0%)
$55,000 to $64,999
0 (0.0%)
0 (0.0%)
$65,000 to $74,999
0 (0.0%)
0 (0.0%)
$75,000 to $99,999
0 (0.0%)
10 (100.0%)
$100,000+
0 (0.0%)
0 (0.0%)
Total
0 (0.0%)
10 (100.0%)
Earnings by Sex by Educational Attainment in Loma Linda East CDP Jim Wells County
Educational Attainment
Male Income
Female Income
Less than High School
-
-
High School Diploma
-
-
College or Associate's Degree
-
-
Bachelor's Degree
-
-
Graduate Degree
-
-
Total
-
-
Family Income in Loma Linda East CDP Jim Wells County
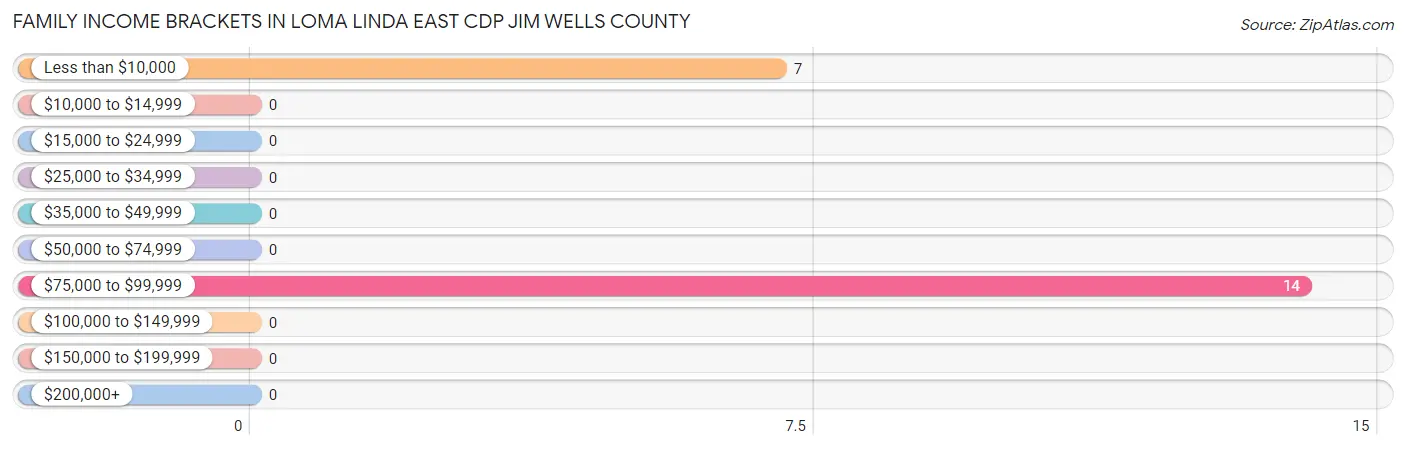
Family Income Brackets in Loma Linda East CDP Jim Wells County
According to the Loma Linda East CDP Jim Wells County family income data, there are 14 families falling into the $75,000 to $99,999 income range, which is the most common income bracket and makes up 66.7% of all families.
Income Bracket
# Families
% Families
Less than $10,000
7
33.3%
$10,000 to $14,999
0
0.0%
$15,000 to $24,999
0
0.0%
$25,000 to $34,999
0
0.0%
$35,000 to $49,999
0
0.0%
$50,000 to $74,999
0
0.0%
$75,000 to $99,999
14
66.7%
$100,000 to $149,999
0
0.0%
$150,000 to $199,999
0
0.0%
$200,000+
0
0.0%
Family Income by Famaliy Size in Loma Linda East CDP Jim Wells County
Income Bracket
# Families
Median Income
2-Person Families
21 (100.0%)
$0
3-Person Families
0 (0.0%)
$0
4-Person Families
0 (0.0%)
$0
5-Person Families
0 (0.0%)
$0
6-Person Families
0 (0.0%)
$0
7+ Person Families
0 (0.0%)
$0
Total
21 (100.0%)
$0
Family Income by Number of Earners in Loma Linda East CDP Jim Wells County
Number of Earners
# Families
Median Income
No Earners
7 (33.3%)
$0
1 Earner
14 (66.7%)
$0
2 Earners
0 (0.0%)
$0
3+ Earners
0 (0.0%)
$0
Total
21 (100.0%)
$0
Household Income in Loma Linda East CDP Jim Wells County
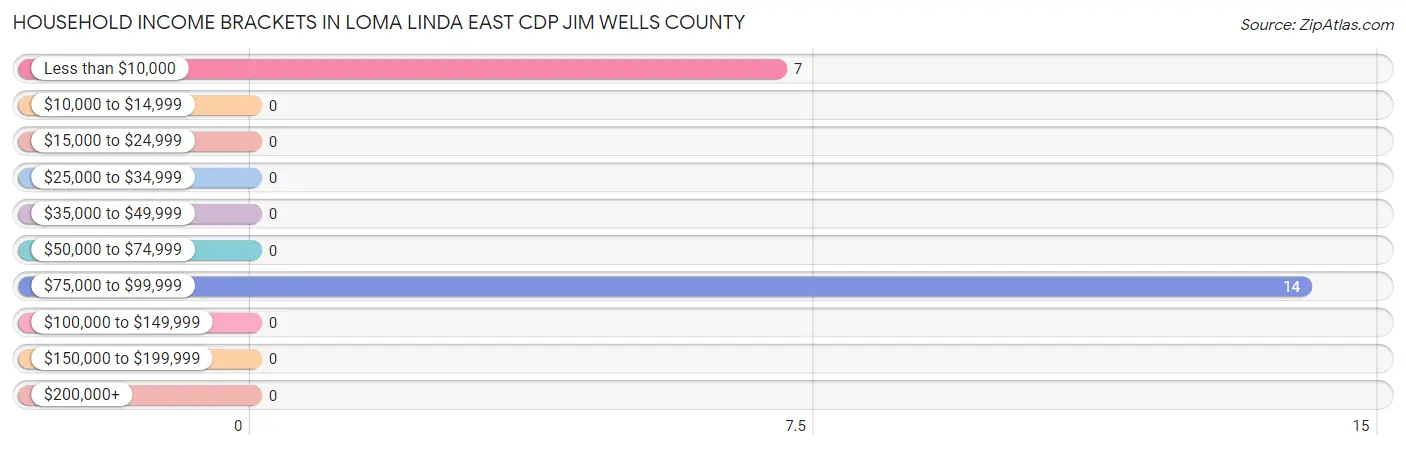
Household Income Brackets in Loma Linda East CDP Jim Wells County
With 14 households falling in the category, the $75,000 to $99,999 income range is the most frequent in Loma Linda East CDP Jim Wells County, accounting for 66.7% of all households.
Income Bracket
# Households
% Households
Less than $10,000
7
33.3%
$10,000 to $14,999
0
0.0%
$15,000 to $24,999
0
0.0%
$25,000 to $34,999
0
0.0%
$35,000 to $49,999
0
0.0%
$50,000 to $74,999
0
0.0%
$75,000 to $99,999
14
66.7%
$100,000 to $149,999
0
0.0%
$150,000 to $199,999
0
0.0%
$200,000+
0
0.0%
Household Income by Householder Age in Loma Linda East CDP Jim Wells County
Income Bracket
# Households
Median Income
15 to 24 Years
0 (0.0%)
$0
25 to 44 Years
0 (0.0%)
$0
45 to 64 Years
0 (0.0%)
$0
65+ Years
21 (100.0%)
$0
Total
21 (100.0%)
$0
Poverty in Loma Linda East CDP Jim Wells County
Income Below Poverty by Sex and Age in Loma Linda East CDP Jim Wells County
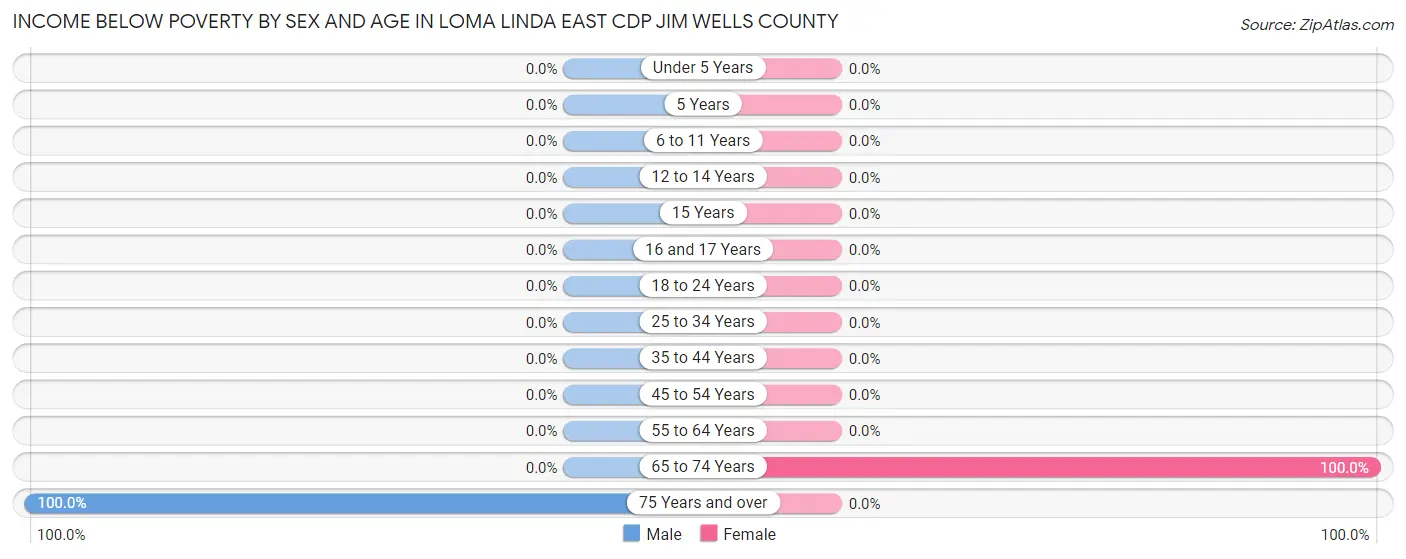
With 33.3% poverty level for males and 23.1% for females among the residents of Loma Linda East CDP Jim Wells County, 75 year old and over males and 65 to 74 year old females are the most vulnerable to poverty, with 7 males (100.0%) and 3 females (100.0%) in their respective age groups living below the poverty level.
Age Bracket
Male
Female
Under 5 Years
0 (0.0%)
0 (0.0%)
5 Years
0 (0.0%)
0 (0.0%)
6 to 11 Years
0 (0.0%)
0 (0.0%)
12 to 14 Years
0 (0.0%)
0 (0.0%)
15 Years
0 (0.0%)
0 (0.0%)
16 and 17 Years
0 (0.0%)
0 (0.0%)
18 to 24 Years
0 (0.0%)
0 (0.0%)
25 to 34 Years
0 (0.0%)
0 (0.0%)
35 to 44 Years
0 (0.0%)
0 (0.0%)
45 to 54 Years
0 (0.0%)
0 (0.0%)
55 to 64 Years
0 (0.0%)
0 (0.0%)
65 to 74 Years
0 (0.0%)
3 (100.0%)
75 Years and over
7 (100.0%)
0 (0.0%)
Total
7 (33.3%)
3 (23.1%)
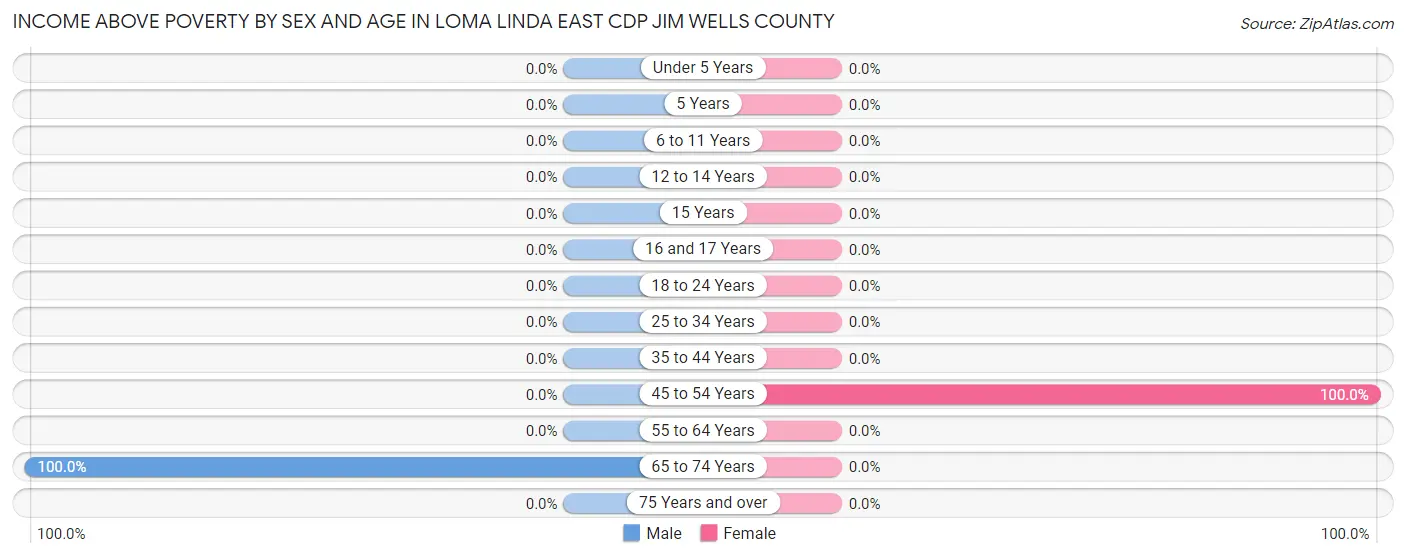
Income Above Poverty by Sex and Age in Loma Linda East CDP Jim Wells County
According to the poverty statistics in Loma Linda East CDP Jim Wells County, males aged 65 to 74 years and females aged 45 to 54 years are the age groups that are most secure financially, with 100.0% of males and 100.0% of females in these age groups living above the poverty line.
Age Bracket
Male
Female
Under 5 Years
0 (0.0%)
0 (0.0%)
5 Years
0 (0.0%)
0 (0.0%)
6 to 11 Years
0 (0.0%)
0 (0.0%)
12 to 14 Years
0 (0.0%)
0 (0.0%)
15 Years
0 (0.0%)
0 (0.0%)
16 and 17 Years
0 (0.0%)
0 (0.0%)
18 to 24 Years
0 (0.0%)
0 (0.0%)
25 to 34 Years
0 (0.0%)
0 (0.0%)
35 to 44 Years
0 (0.0%)
0 (0.0%)
45 to 54 Years
0 (0.0%)
10 (100.0%)
55 to 64 Years
0 (0.0%)
0 (0.0%)
65 to 74 Years
14 (100.0%)
0 (0.0%)
75 Years and over
0 (0.0%)
0 (0.0%)
Total
14 (66.7%)
10 (76.9%)
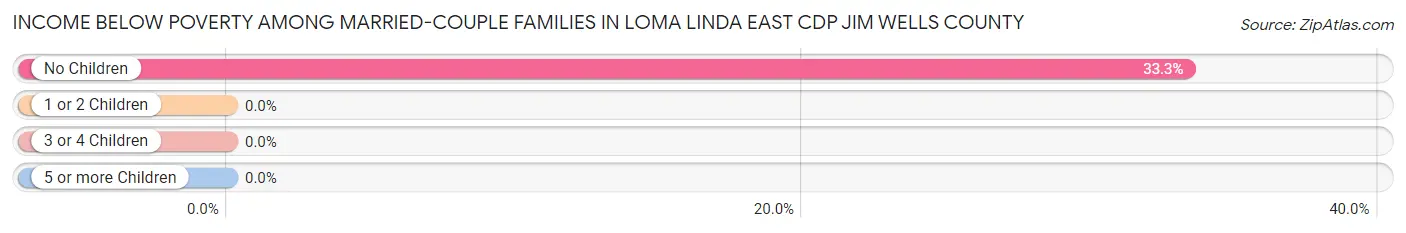
Income Below Poverty Among Married-Couple Families in Loma Linda East CDP Jim Wells County
The poverty statistics for married-couple families in Loma Linda East CDP Jim Wells County show that 33.3% or 7 of the total 21 families live below the poverty line. Families with no children have the highest poverty rate of 33.3%, comprising of 7 families. On the other hand, families with no children have the lowest poverty rate of 33.3%, which includes 7 families.
Children
Above Poverty
Below Poverty
No Children
14 (66.7%)
7 (33.3%)
1 or 2 Children
0 (0.0%)
0 (0.0%)
3 or 4 Children
0 (0.0%)
0 (0.0%)
5 or more Children
0 (0.0%)
0 (0.0%)
Total
14 (66.7%)
7 (33.3%)
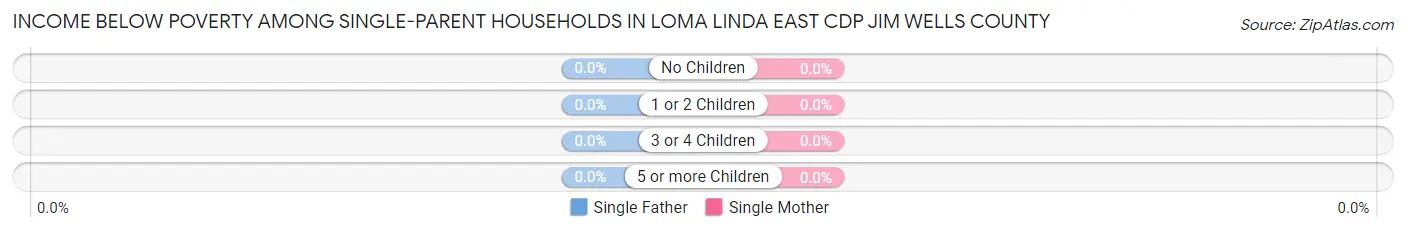
Income Below Poverty Among Single-Parent Households in Loma Linda East CDP Jim Wells County
Children
Single Father
Single Mother
No Children
0 (0.0%)
0 (0.0%)
1 or 2 Children
0 (0.0%)
0 (0.0%)
3 or 4 Children
0 (0.0%)
0 (0.0%)
5 or more Children
0 (0.0%)
0 (0.0%)
Total
0 (0.0%)
0 (0.0%)
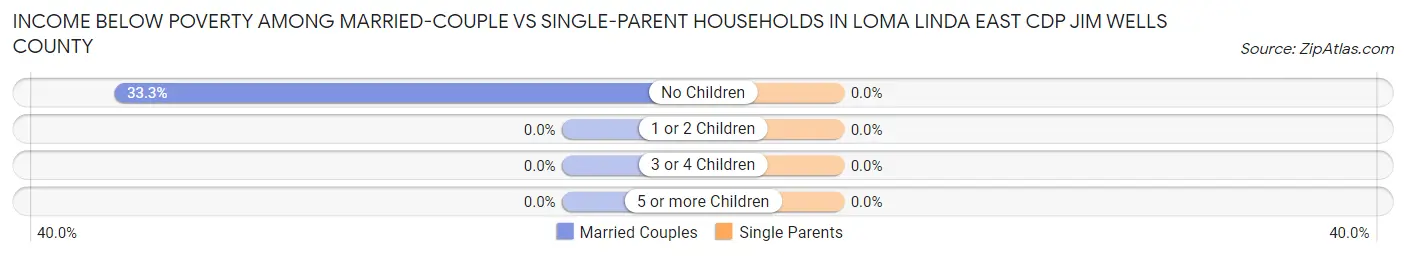
Income Below Poverty Among Married-Couple vs Single-Parent Households in Loma Linda East CDP Jim Wells County
Children
Married-Couple Families
Single-Parent Households
No Children
7 (33.3%)
0 (0.0%)
1 or 2 Children
0 (0.0%)
0 (0.0%)
3 or 4 Children
0 (0.0%)
0 (0.0%)
5 or more Children
0 (0.0%)
0 (0.0%)
Total
7 (33.3%)
0 (0.0%)
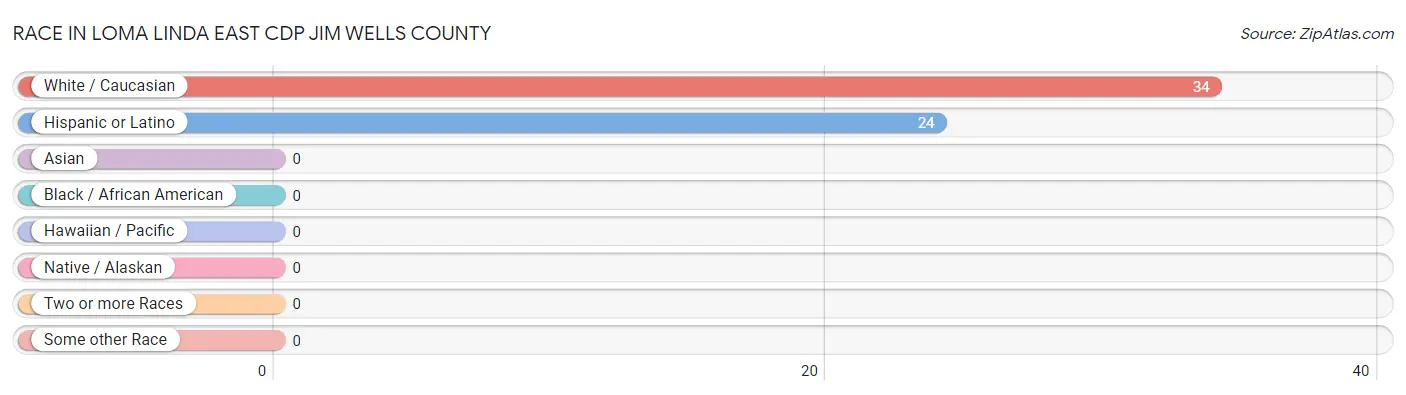
Race in Loma Linda East CDP Jim Wells County
The most populous races in Loma Linda East CDP Jim Wells County are White / Caucasian (34 | 100.0%), and Hispanic or Latino (24 | 70.6%).
Race
# Population
% Population
Asian
0
0.0%
Black / African American
0
0.0%
Hawaiian / Pacific
0
0.0%
Hispanic or Latino
24
70.6%
Native / Alaskan
0
0.0%
White / Caucasian
34
100.0%
Two or more Races
0
0.0%
Some other Race
0
0.0%
Total
34
100.0%
Ancestry in Loma Linda East CDP Jim Wells County
The most populous ancestries reported in Loma Linda East CDP Jim Wells County are , and Mexican (24 | 70.6%), together accounting for 70.6% of all Loma Linda East CDP Jim Wells County residents.
Ancestry
# Population
% Population
Mexican
24
70.6%
View All 1 Rows
Immigrants in Loma Linda East CDP Jim Wells County
Immigration Origin
# Population
% Population
View All 0 Rows
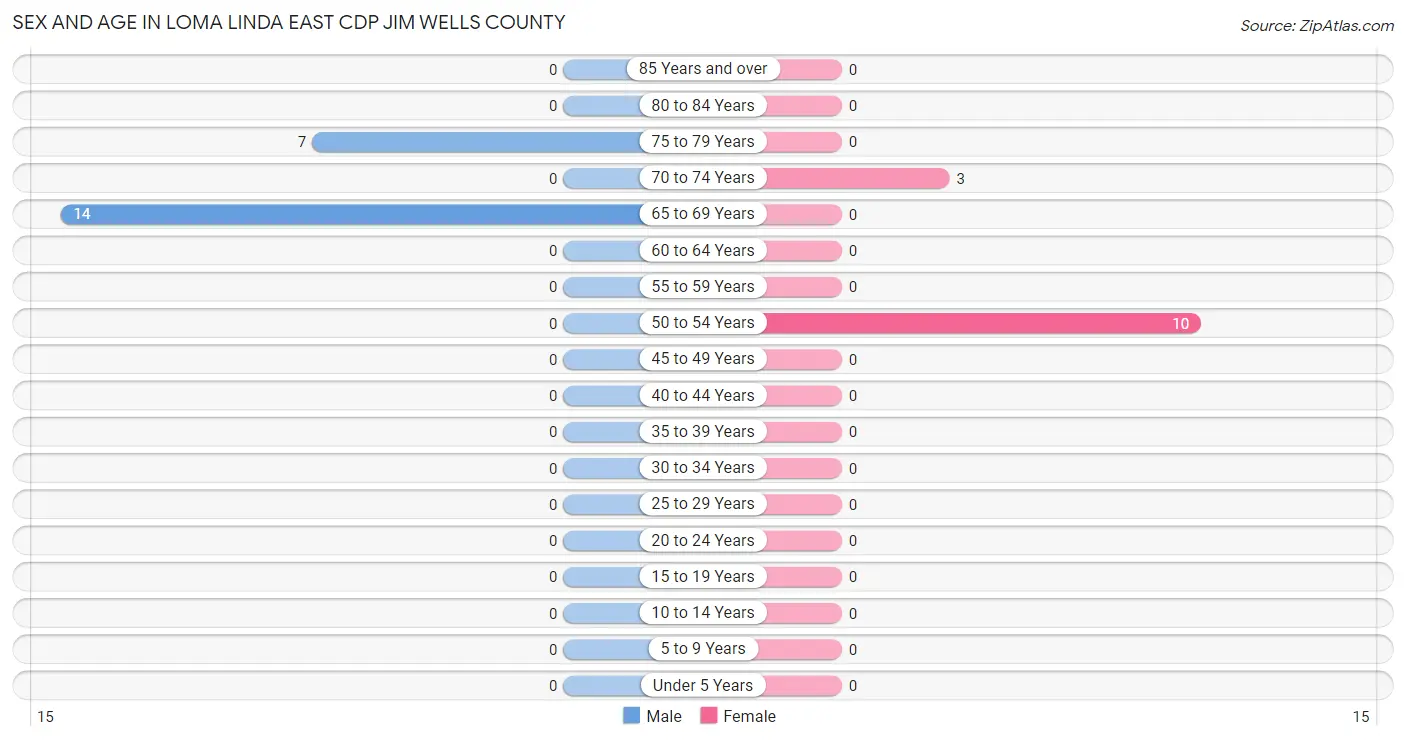
Sex and Age in Loma Linda East CDP Jim Wells County
Sex and Age in Loma Linda East CDP Jim Wells County
The most populous age groups in Loma Linda East CDP Jim Wells County are 65 to 69 Years (14 | 66.7%) for men and 50 to 54 Years (10 | 76.9%) for women.
Age Bracket
Male
Female
Under 5 Years
0 (0.0%)
0 (0.0%)
5 to 9 Years
0 (0.0%)
0 (0.0%)
10 to 14 Years
0 (0.0%)
0 (0.0%)
15 to 19 Years
0 (0.0%)
0 (0.0%)
20 to 24 Years
0 (0.0%)
0 (0.0%)
25 to 29 Years
0 (0.0%)
0 (0.0%)
30 to 34 Years
0 (0.0%)
0 (0.0%)
35 to 39 Years
0 (0.0%)
0 (0.0%)
40 to 44 Years
0 (0.0%)
0 (0.0%)
45 to 49 Years
0 (0.0%)
0 (0.0%)
50 to 54 Years
0 (0.0%)
10 (76.9%)
55 to 59 Years
0 (0.0%)
0 (0.0%)
60 to 64 Years
0 (0.0%)
0 (0.0%)
65 to 69 Years
14 (66.7%)
0 (0.0%)
70 to 74 Years
0 (0.0%)
3 (23.1%)
75 to 79 Years
7 (33.3%)
0 (0.0%)
80 to 84 Years
0 (0.0%)
0 (0.0%)
85 Years and over
0 (0.0%)
0 (0.0%)
Total
21 (100.0%)
13 (100.0%)
Families and Households in Loma Linda East CDP Jim Wells County
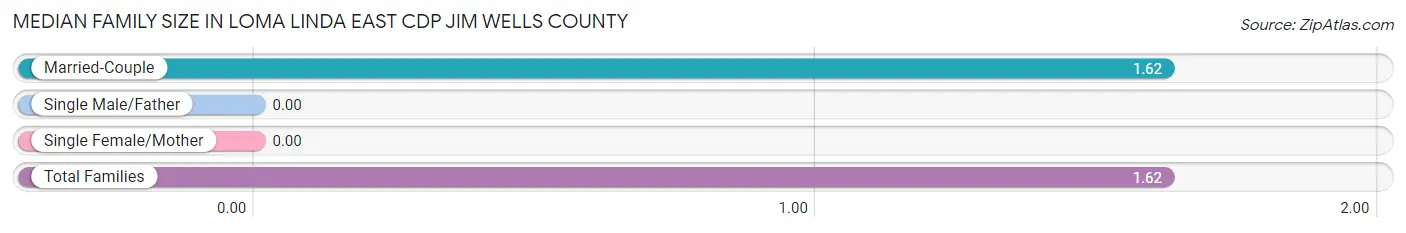
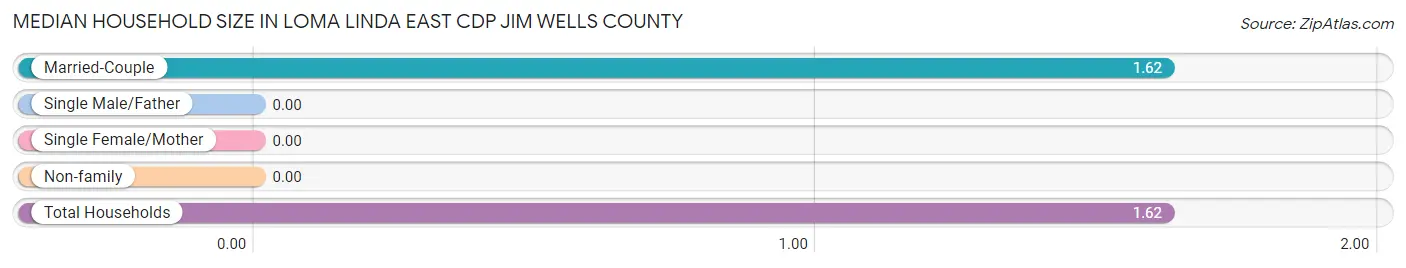
Median Family Size in Loma Linda East CDP Jim Wells County
Family Type
# Families
Family Size
Married-Couple
21 (100.0%)
1.62
Single Male/Father
0 (0.0%)
-
Single Female/Mother
0 (0.0%)
-
Total Families
21 (100.0%)
1.62
Median Household Size in Loma Linda East CDP Jim Wells County
Household Type
# Households
Household Size
Married-Couple
21 (100.0%)
1.62
Single Male/Father
0 (0.0%)
-
Single Female/Mother
0 (0.0%)
-
Non-family
0 (0.0%)
-
Total Households
21 (100.0%)
1.62
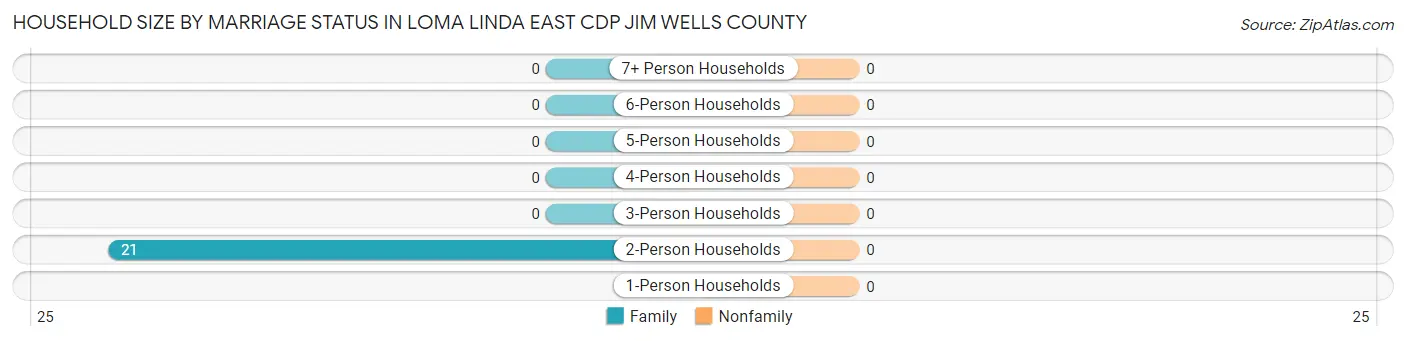
Household Size by Marriage Status in Loma Linda East CDP Jim Wells County
Household Size
Family Households
Nonfamily Households
1-Person Households
-
0 (0.0%)
2-Person Households
21 (100.0%)
0 (0.0%)
3-Person Households
0 (0.0%)
0 (0.0%)
4-Person Households
0 (0.0%)
0 (0.0%)
5-Person Households
0 (0.0%)
0 (0.0%)
6-Person Households
0 (0.0%)
0 (0.0%)
7+ Person Households
0 (0.0%)
0 (0.0%)
Total
21 (100.0%)
0 (0.0%)
Female Fertility in Loma Linda East CDP Jim Wells County
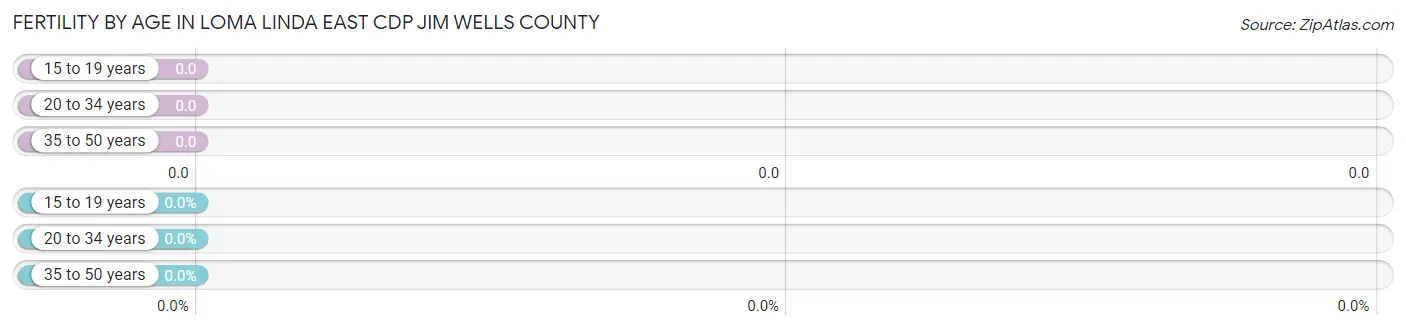
Fertility by Age in Loma Linda East CDP Jim Wells County
Age Bracket
Women with Births
Births / 1,000 Women
15 to 19 years
0 (0.0%)
0.0
20 to 34 years
0 (0.0%)
0.0
35 to 50 years
0 (0.0%)
0.0
Total
0 (0.0%)
0.0
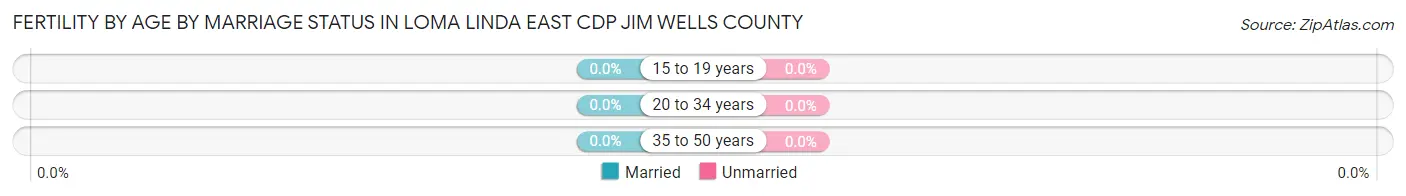
Fertility by Age by Marriage Status in Loma Linda East CDP Jim Wells County
Age Bracket
Married
Unmarried
15 to 19 years
0 (0.0%)
0 (0.0%)
20 to 34 years
0 (0.0%)
0 (0.0%)
35 to 50 years
0 (0.0%)
0 (0.0%)
Total
0 (0.0%)
0 (0.0%)
Fertility by Education in Loma Linda East CDP Jim Wells County
Educational Attainment
Women with Births
Births / 1,000 Women
Less than High School
0 (0.0%)
0.0
High School Diploma
0 (0.0%)
0.0
College or Associate's Degree
0 (0.0%)
0.0
Bachelor's Degree
0 (0.0%)
0.0
Graduate Degree
0 (0.0%)
0.0
Total
0 (0.0%)
0.0
Fertility by Education by Marriage Status in Loma Linda East CDP Jim Wells County
Educational Attainment
Married
Unmarried
Less than High School
0 (0.0%)
0 (0.0%)
High School Diploma
0 (0.0%)
0 (0.0%)
College or Associate's Degree
0 (0.0%)
0 (0.0%)
Bachelor's Degree
0 (0.0%)
0 (0.0%)
Graduate Degree
0 (0.0%)
0 (0.0%)
Total
0 (0.0%)
0 (0.0%)
Employment Characteristics in Loma Linda East CDP Jim Wells County
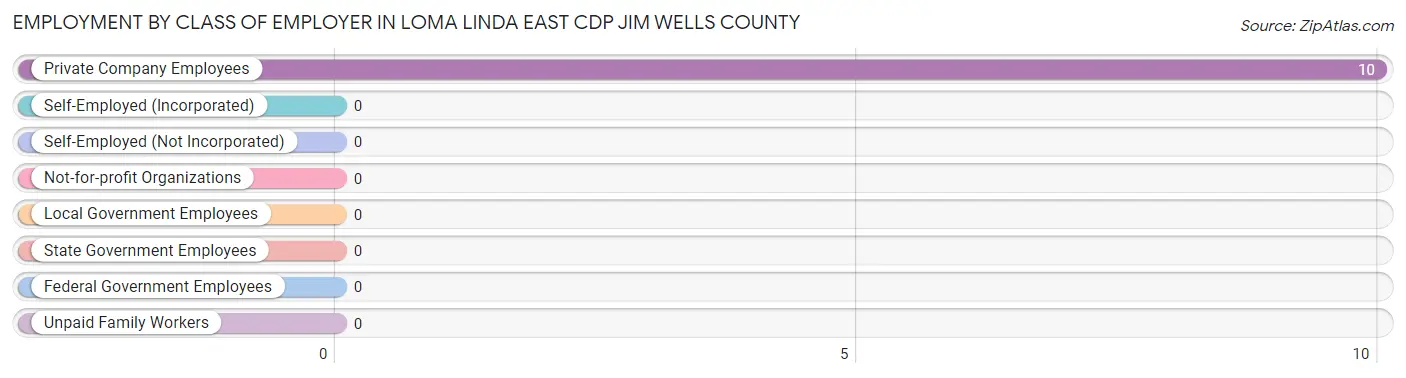
Employment by Class of Employer in Loma Linda East CDP Jim Wells County
Among the 10 employed individuals in Loma Linda East CDP Jim Wells County, , and private company employees (10 | 100.0%) make up the most common classes of employment.
Employer Class
# Employees
% Employees
Private Company Employees
10
100.0%
Self-Employed (Incorporated)
0
0.0%
Self-Employed (Not Incorporated)
0
0.0%
Not-for-profit Organizations
0
0.0%
Local Government Employees
0
0.0%
State Government Employees
0
0.0%
Federal Government Employees
0
0.0%
Unpaid Family Workers
0
0.0%
Total
10
100.0%
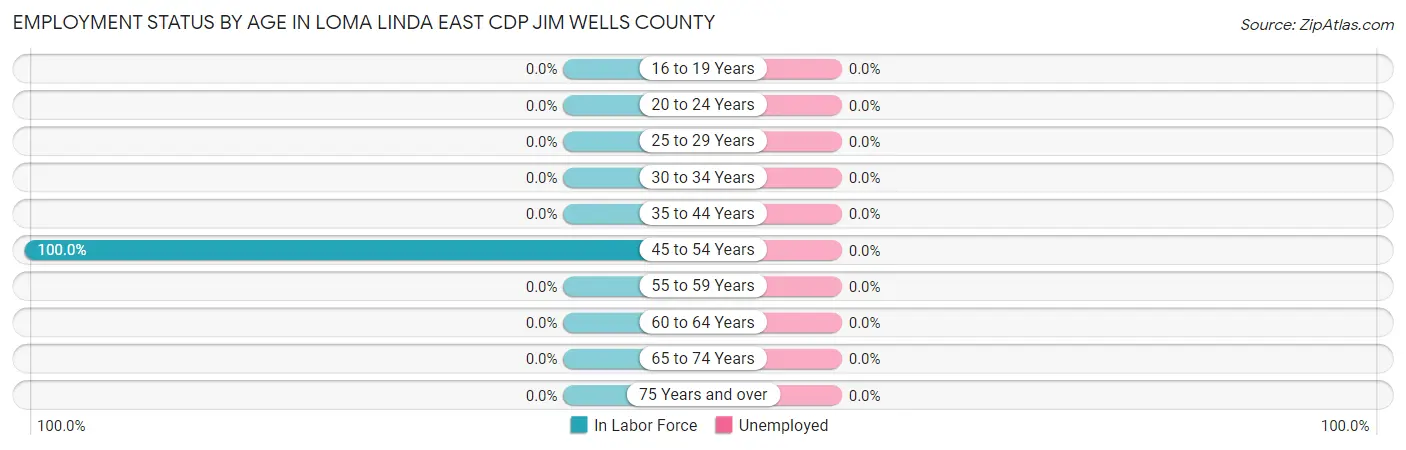
Employment Status by Age in Loma Linda East CDP Jim Wells County
Age Bracket
In Labor Force
Unemployed
16 to 19 Years
0 (0.0%)
0 (0.0%)
20 to 24 Years
0 (0.0%)
0 (0.0%)
25 to 29 Years
0 (0.0%)
0 (0.0%)
30 to 34 Years
0 (0.0%)
0 (0.0%)
35 to 44 Years
0 (0.0%)
0 (0.0%)
45 to 54 Years
10 (100.0%)
0 (0.0%)
55 to 59 Years
0 (0.0%)
0 (0.0%)
60 to 64 Years
0 (0.0%)
0 (0.0%)
65 to 74 Years
0 (0.0%)
0 (0.0%)
75 Years and over
0 (0.0%)
0 (0.0%)
Total
10 (29.4%)
0 (0.0%)
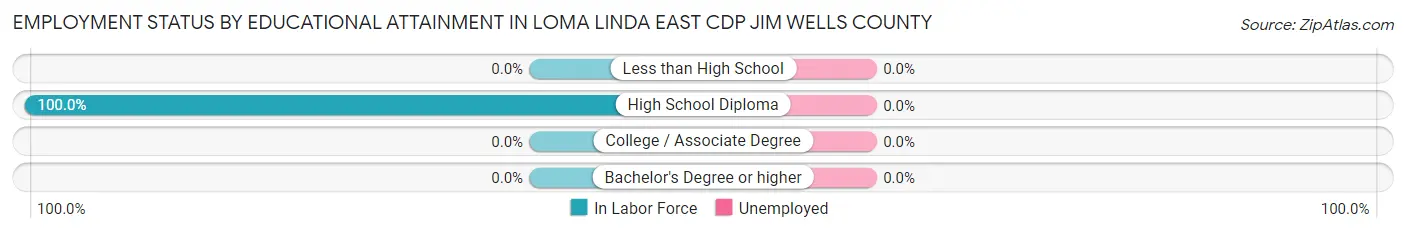
Employment Status by Educational Attainment in Loma Linda East CDP Jim Wells County
Educational Attainment
In Labor Force
Unemployed
Less than High School
0 (0.0%)
0 (0.0%)
High School Diploma
10 (100.0%)
0 (0.0%)
College / Associate Degree
0 (0.0%)
0 (0.0%)
Bachelor's Degree or higher
0 (0.0%)
0 (0.0%)
Total
10 (100.0%)
0 (0.0%)
Employment Occupations by Sex in Loma Linda East CDP Jim Wells County
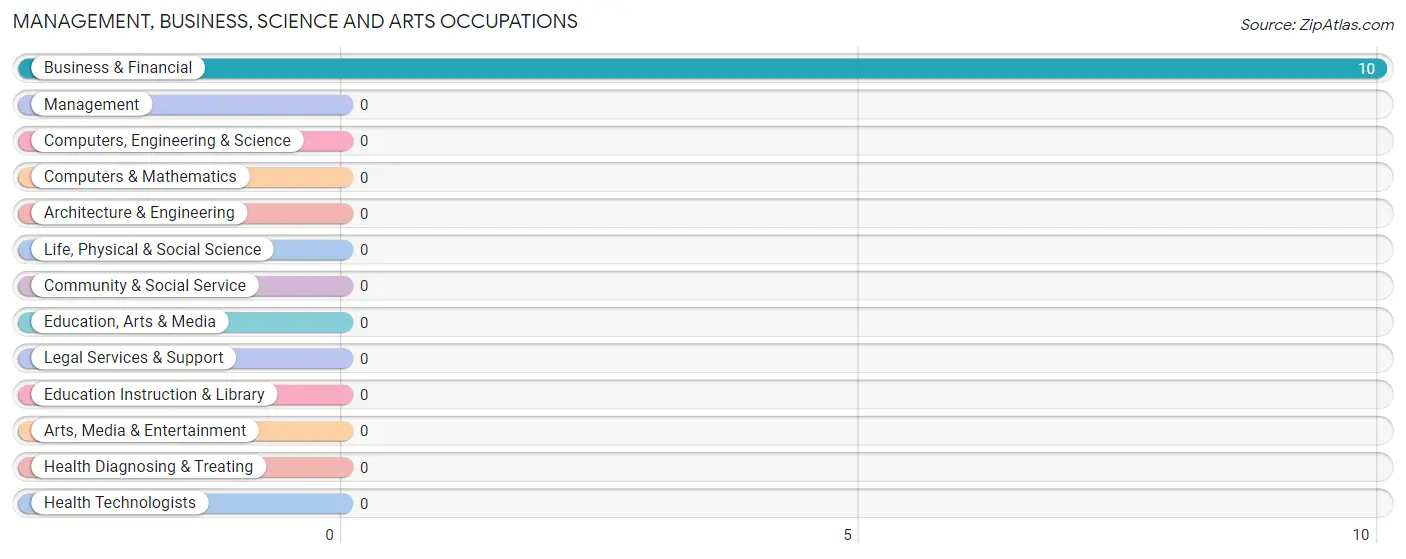
Management, Business, Science and Arts Occupations
The most common Management, Business, Science and Arts occupations in Loma Linda East CDP Jim Wells County are , and Business & Financial (10 | 100.0%).
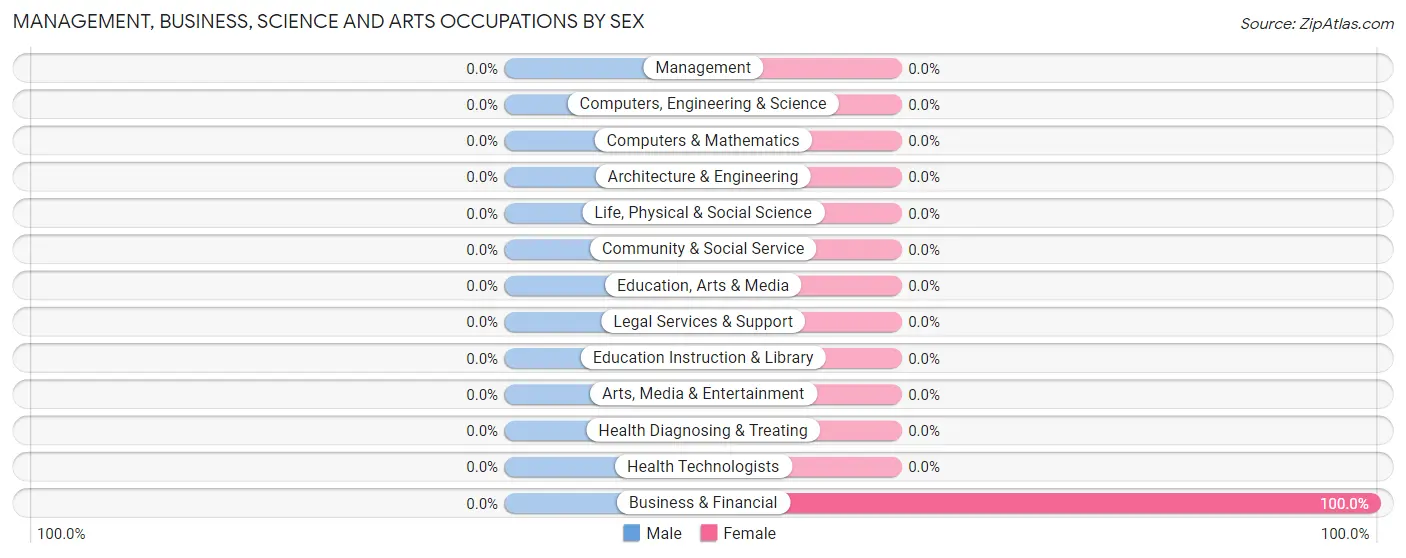
Management, Business, Science and Arts Occupations by Sex
Occupation
Male
Female
Management
0 (0.0%)
0 (0.0%)
Business & Financial
0 (0.0%)
10 (100.0%)
Computers, Engineering & Science
0 (0.0%)
0 (0.0%)
Computers & Mathematics
0 (0.0%)
0 (0.0%)
Architecture & Engineering
0 (0.0%)
0 (0.0%)
Life, Physical & Social Science
0 (0.0%)
0 (0.0%)
Community & Social Service
0 (0.0%)
0 (0.0%)
Education, Arts & Media
0 (0.0%)
0 (0.0%)
Legal Services & Support
0 (0.0%)
0 (0.0%)
Education Instruction & Library
0 (0.0%)
0 (0.0%)
Arts, Media & Entertainment
0 (0.0%)
0 (0.0%)
Health Diagnosing & Treating
0 (0.0%)
0 (0.0%)
Health Technologists
0 (0.0%)
0 (0.0%)
Total (Category)
0 (0.0%)
10 (100.0%)
Total (Overall)
0 (0.0%)
10 (100.0%)
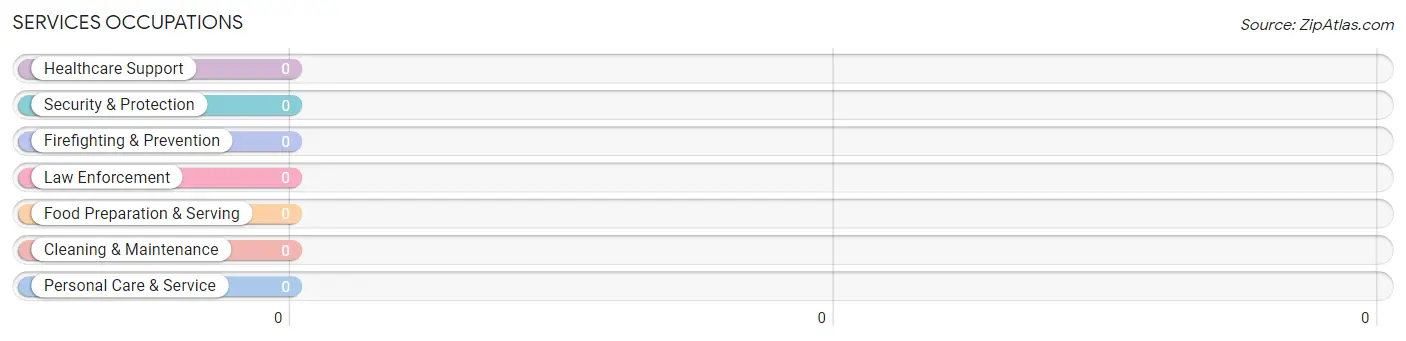
Services Occupations
Services Occupations by Sex
Occupation
Male
Female
Healthcare Support
0 (0.0%)
0 (0.0%)
Security & Protection
0 (0.0%)
0 (0.0%)
Firefighting & Prevention
0 (0.0%)
0 (0.0%)
Law Enforcement
0 (0.0%)
0 (0.0%)
Food Preparation & Serving
0 (0.0%)
0 (0.0%)
Cleaning & Maintenance
0 (0.0%)
0 (0.0%)
Personal Care & Service
0 (0.0%)
0 (0.0%)
Total (Category)
0 (0.0%)
0 (0.0%)
Total (Overall)
0 (0.0%)
10 (100.0%)
Sales and Office Occupations
Sales and Office Occupations by Sex
Occupation
Male
Female
Sales & Related
0 (0.0%)
0 (0.0%)
Office & Administration
0 (0.0%)
0 (0.0%)
Total (Category)
0 (0.0%)
0 (0.0%)
Total (Overall)
0 (0.0%)
10 (100.0%)
Natural Resources, Construction and Maintenance Occupations
Natural Resources, Construction and Maintenance Occupations by Sex
Occupation
Male
Female
Farming, Fishing & Forestry
0 (0.0%)
0 (0.0%)
Construction & Extraction
0 (0.0%)
0 (0.0%)
Installation, Maintenance & Repair
0 (0.0%)
0 (0.0%)
Total (Category)
0 (0.0%)
0 (0.0%)
Total (Overall)
0 (0.0%)
10 (100.0%)
Production, Transportation and Moving Occupations
Production, Transportation and Moving Occupations by Sex
Occupation
Male
Female
Production
0 (0.0%)
0 (0.0%)
Transportation
0 (0.0%)
0 (0.0%)
Material Moving
0 (0.0%)
0 (0.0%)
Total (Category)
0 (0.0%)
0 (0.0%)
Total (Overall)
0 (0.0%)
10 (100.0%)
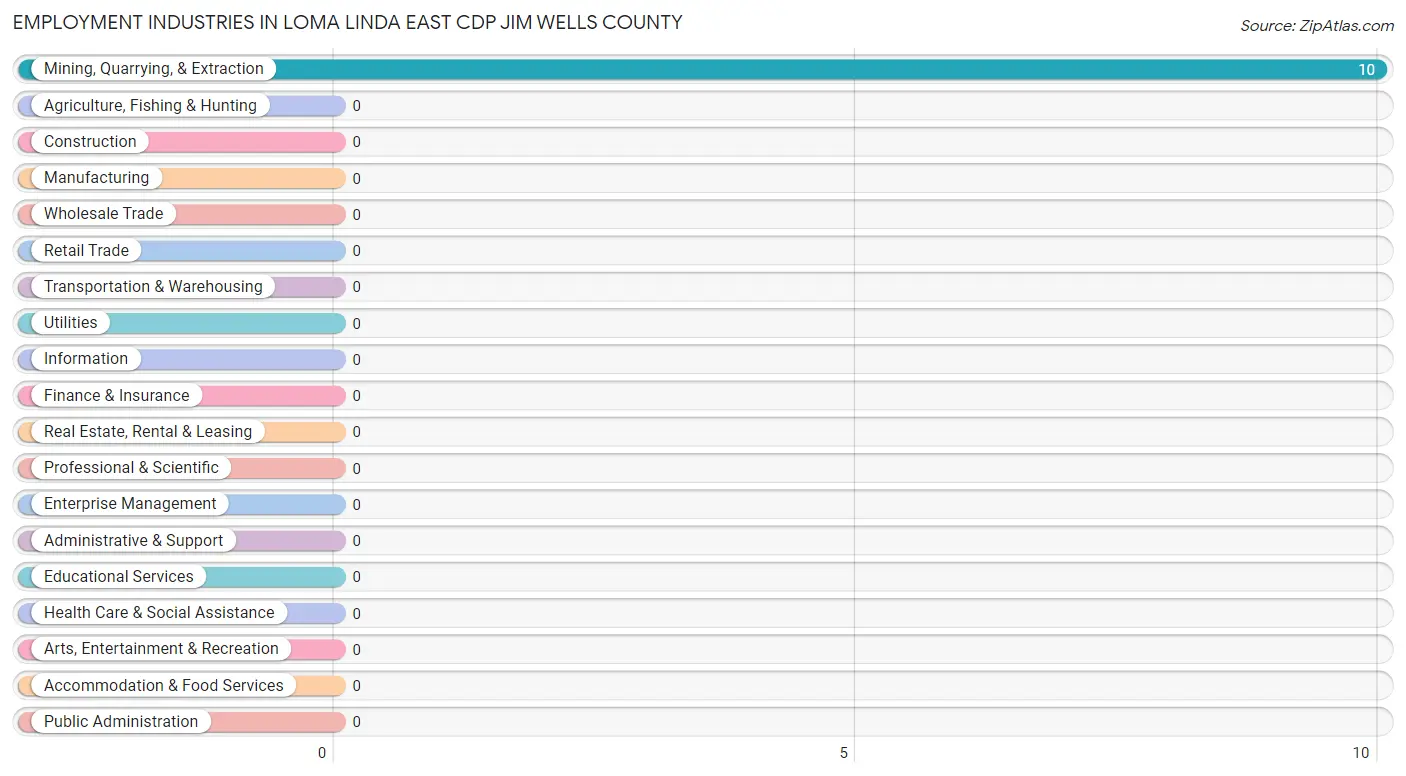
Employment Industries by Sex in Loma Linda East CDP Jim Wells County
Employment Industries in Loma Linda East CDP Jim Wells County
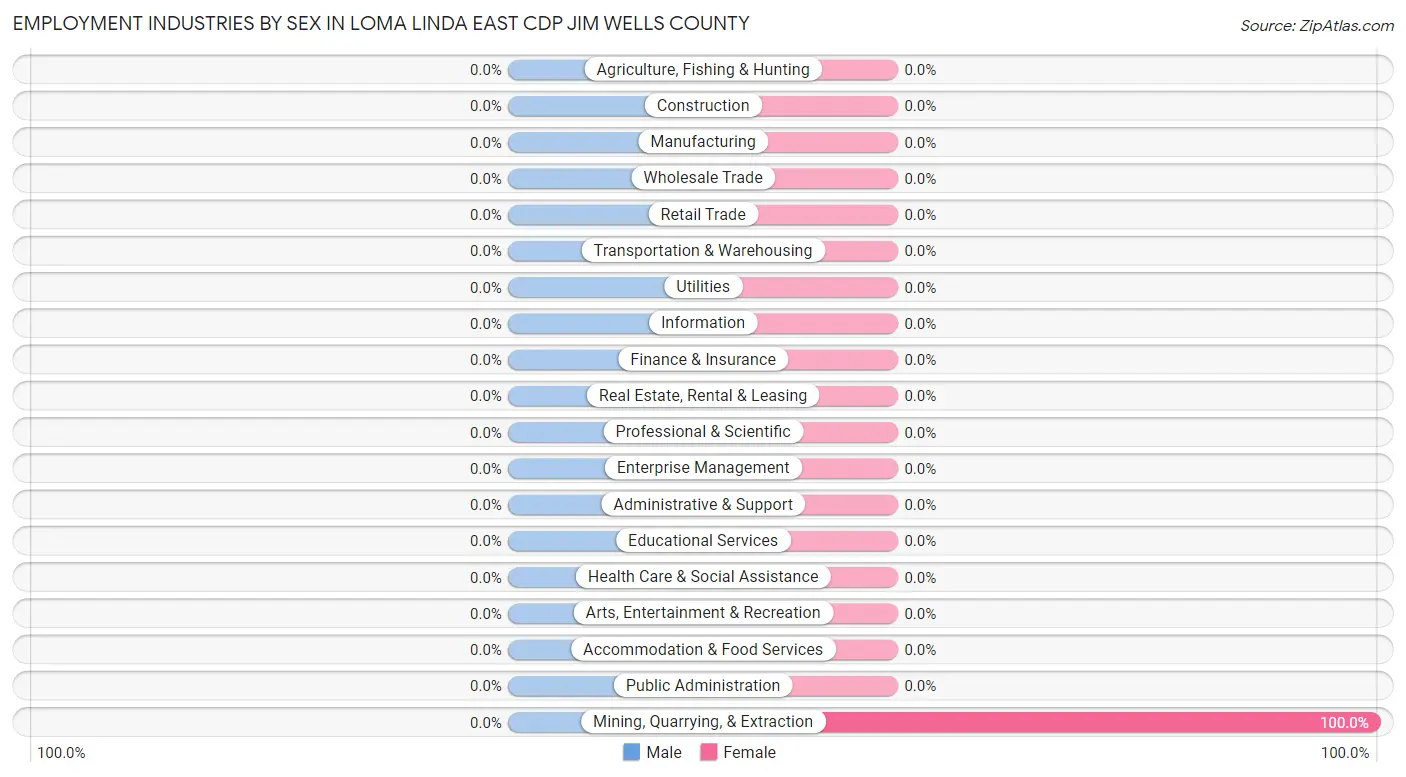
The major employment industries in Loma Linda East CDP Jim Wells County include , and Mining, Quarrying, & Extraction (10 | 100.0%).
Employment Industries by Sex in Loma Linda East CDP Jim Wells County
Industry
Male
Female
Agriculture, Fishing & Hunting
0 (0.0%)
0 (0.0%)
Mining, Quarrying, & Extraction
0 (0.0%)
10 (100.0%)
Construction
0 (0.0%)
0 (0.0%)
Manufacturing
0 (0.0%)
0 (0.0%)
Wholesale Trade
0 (0.0%)
0 (0.0%)
Retail Trade
0 (0.0%)
0 (0.0%)
Transportation & Warehousing
0 (0.0%)
0 (0.0%)
Utilities
0 (0.0%)
0 (0.0%)
Information
0 (0.0%)
0 (0.0%)
Finance & Insurance
0 (0.0%)
0 (0.0%)
Real Estate, Rental & Leasing
0 (0.0%)
0 (0.0%)
Professional & Scientific
0 (0.0%)
0 (0.0%)
Enterprise Management
0 (0.0%)
0 (0.0%)
Administrative & Support
0 (0.0%)
0 (0.0%)
Educational Services
0 (0.0%)
0 (0.0%)
Health Care & Social Assistance
0 (0.0%)
0 (0.0%)
Arts, Entertainment & Recreation
0 (0.0%)
0 (0.0%)
Accommodation & Food Services
0 (0.0%)
0 (0.0%)
Public Administration
0 (0.0%)
0 (0.0%)
Total
0 (0.0%)
10 (100.0%)
Education in Loma Linda East CDP Jim Wells County
School Enrollment in Loma Linda East CDP Jim Wells County
School Level
# Students
% Students
Nursery / Preschool
0
0.0%
Kindergarten
0
0.0%
Elementary School
0
0.0%
Middle School
0
0.0%
High School
0
0.0%
College / Undergraduate
0
0.0%
Graduate / Professional
0
0.0%
Total
0
0.0%
School Enrollment by Age by Funding Source in Loma Linda East CDP Jim Wells County
Age Bracket
Public School
Private School
3 to 4 Year Olds
0 (0.0%)
0 (0.0%)
5 to 9 Year Old
0 (0.0%)
0 (0.0%)
10 to 14 Year Olds
0 (0.0%)
0 (0.0%)
15 to 17 Year Olds
0 (0.0%)
0 (0.0%)
18 to 19 Year Olds
0 (0.0%)
0 (0.0%)
20 to 24 Year Olds
0 (0.0%)
0 (0.0%)
25 to 34 Year Olds
0 (0.0%)
0 (0.0%)
35 Years and over
0 (0.0%)
0 (0.0%)
Total
0 (0.0%)
0 (0.0%)
Educational Attainment by Field of Study in Loma Linda East CDP Jim Wells County
Field of Study
# Graduates
% Graduates
Computers & Mathematics
0
0.0%
Bio, Nature & Agricultural
0
0.0%
Physical & Health Sciences
0
0.0%
Psychology
0
0.0%
Social Sciences
0
0.0%
Engineering
0
0.0%
Multidisciplinary Studies
0
0.0%
Science & Technology
0
0.0%
Business
0
0.0%
Education
0
0.0%
Literature & Languages
0
0.0%
Liberal Arts & History
0
0.0%
Visual & Performing Arts
0
0.0%
Communications
0
0.0%
Arts & Humanities
0
0.0%
Total
0
0.0%
Transportation & Commute in Loma Linda East CDP Jim Wells County
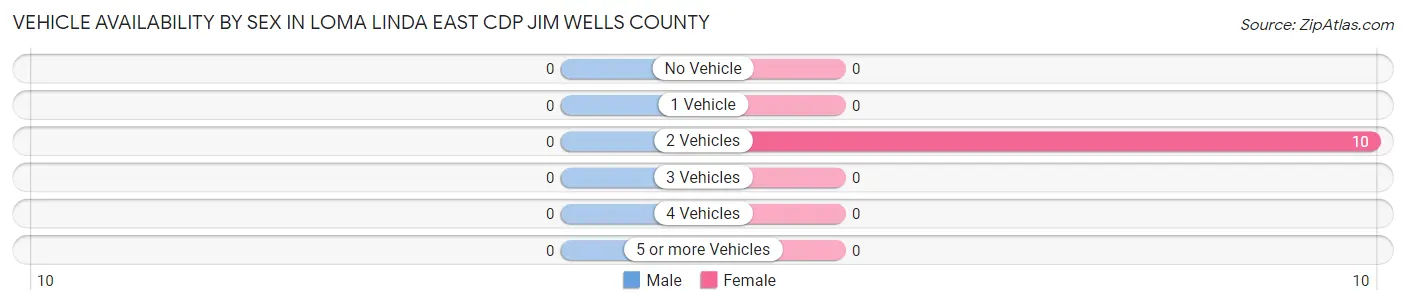
Vehicle Availability by Sex in Loma Linda East CDP Jim Wells County
Vehicles Available
Male
Female
No Vehicle
0 (0.0%)
0 (0.0%)
1 Vehicle
0 (0.0%)
0 (0.0%)
2 Vehicles
0 (0.0%)
10 (100.0%)
3 Vehicles
0 (0.0%)
0 (0.0%)
4 Vehicles
0 (0.0%)
0 (0.0%)
5 or more Vehicles
0 (0.0%)
0 (0.0%)
Total
0 (0.0%)
10 (100.0%)
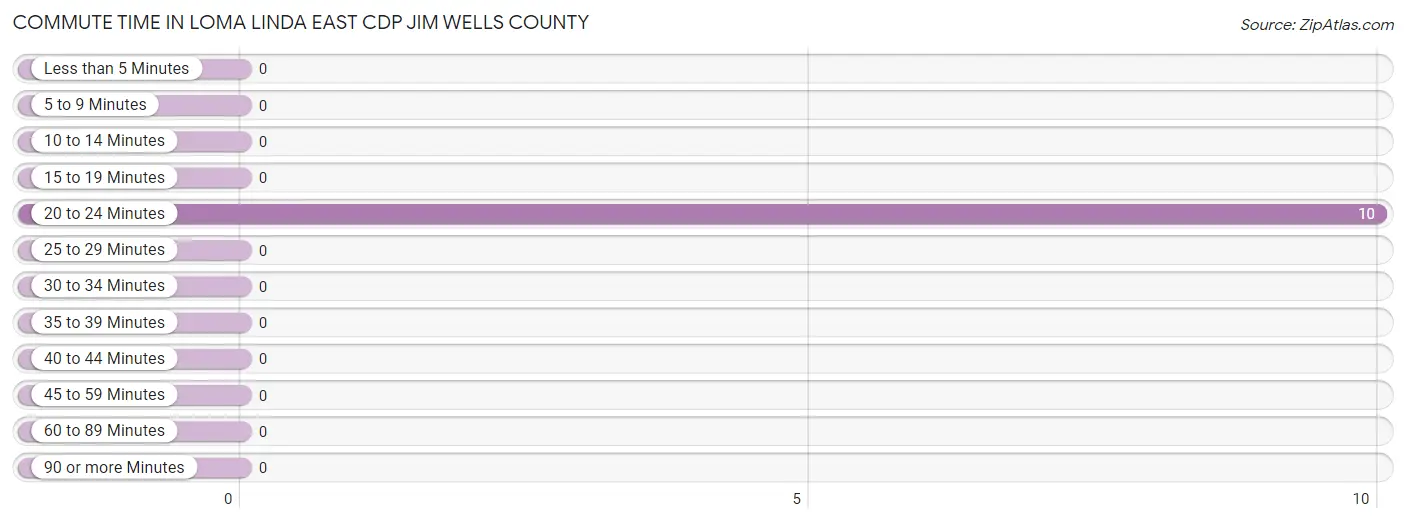
Commute Time in Loma Linda East CDP Jim Wells County
The most frequently occuring commute durations in Loma Linda East CDP Jim Wells County are 20 to 24 minutes (10 commuters, 100.0%), less than 5 minutes (0 commuters, 0.0%), and 5 to 9 minutes (0 commuters, 0.0%).
Commute Time
# Commuters
% Commuters
Less than 5 Minutes
0
0.0%
5 to 9 Minutes
0
0.0%
10 to 14 Minutes
0
0.0%
15 to 19 Minutes
0
0.0%
20 to 24 Minutes
10
100.0%
25 to 29 Minutes
0
0.0%
30 to 34 Minutes
0
0.0%
35 to 39 Minutes
0
0.0%
40 to 44 Minutes
0
0.0%
45 to 59 Minutes
0
0.0%
60 to 89 Minutes
0
0.0%
90 or more Minutes
0
0.0%
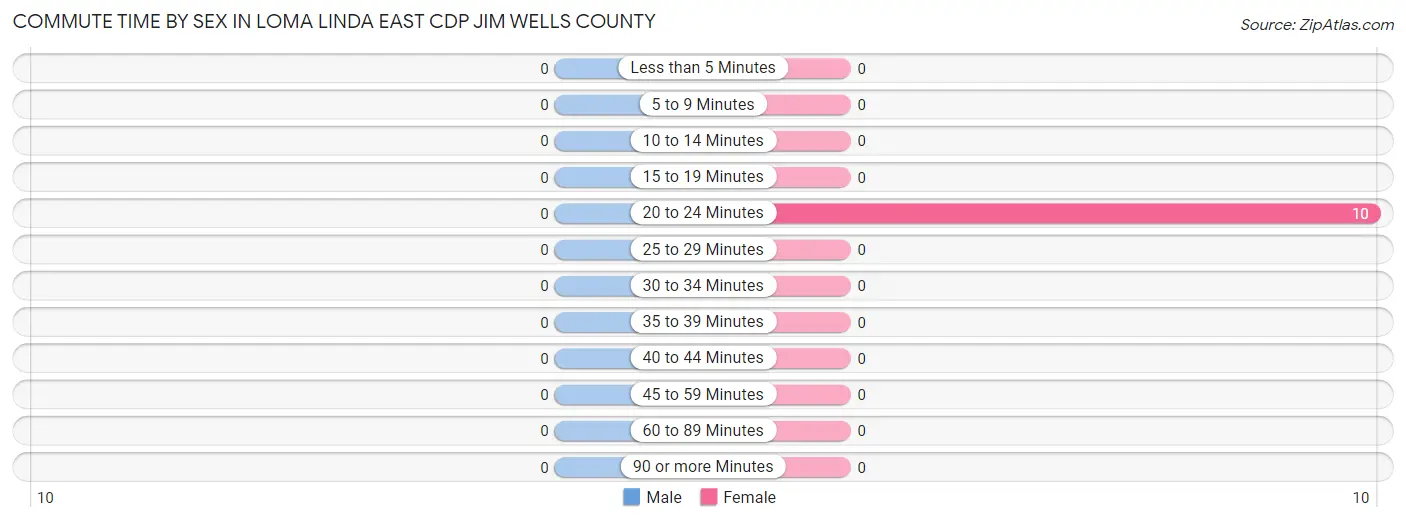
Commute Time by Sex in Loma Linda East CDP Jim Wells County
Commute Time
Male
Female
Less than 5 Minutes
0 (0.0%)
0 (0.0%)
5 to 9 Minutes
0 (0.0%)
0 (0.0%)
10 to 14 Minutes
0 (0.0%)
0 (0.0%)
15 to 19 Minutes
0 (0.0%)
0 (0.0%)
20 to 24 Minutes
0 (0.0%)
10 (100.0%)
25 to 29 Minutes
0 (0.0%)
0 (0.0%)
30 to 34 Minutes
0 (0.0%)
0 (0.0%)
35 to 39 Minutes
0 (0.0%)
0 (0.0%)
40 to 44 Minutes
0 (0.0%)
0 (0.0%)
45 to 59 Minutes
0 (0.0%)
0 (0.0%)
60 to 89 Minutes
0 (0.0%)
0 (0.0%)
90 or more Minutes
0 (0.0%)
0 (0.0%)
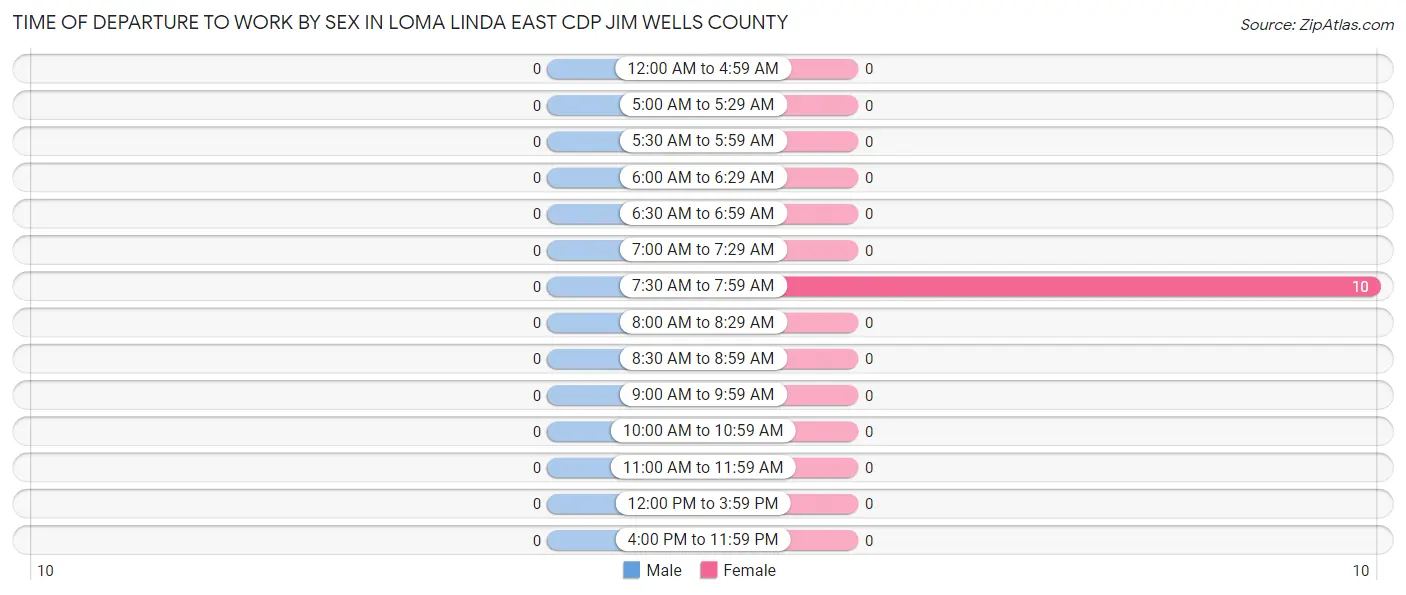
Time of Departure to Work by Sex in Loma Linda East CDP Jim Wells County
Time of Departure
Male
Female
12:00 AM to 4:59 AM
0 (0.0%)
0 (0.0%)
5:00 AM to 5:29 AM
0 (0.0%)
0 (0.0%)
5:30 AM to 5:59 AM
0 (0.0%)
0 (0.0%)
6:00 AM to 6:29 AM
0 (0.0%)
0 (0.0%)
6:30 AM to 6:59 AM
0 (0.0%)
0 (0.0%)
7:00 AM to 7:29 AM
0 (0.0%)
0 (0.0%)
7:30 AM to 7:59 AM
0 (0.0%)
10 (100.0%)
8:00 AM to 8:29 AM
0 (0.0%)
0 (0.0%)
8:30 AM to 8:59 AM
0 (0.0%)
0 (0.0%)
9:00 AM to 9:59 AM
0 (0.0%)
0 (0.0%)
10:00 AM to 10:59 AM
0 (0.0%)
0 (0.0%)
11:00 AM to 11:59 AM
0 (0.0%)
0 (0.0%)
12:00 PM to 3:59 PM
0 (0.0%)
0 (0.0%)
4:00 PM to 11:59 PM
0 (0.0%)
0 (0.0%)
Total
0 (0.0%)
10 (100.0%)
Housing Occupancy in Loma Linda East CDP Jim Wells County
Occupancy by Ownership in Loma Linda East CDP Jim Wells County
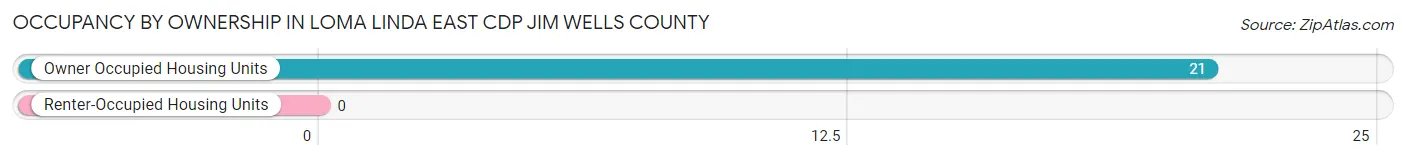
Of the total 21 dwellings in Loma Linda East CDP Jim Wells County, owner-occupied units account for 21 (100.0%), while renter-occupied units make up 0 (0.0%).
Occupancy
# Housing Units
% Housing Units
Owner Occupied Housing Units
21
100.0%
Renter-Occupied Housing Units
0
0.0%
Total Occupied Housing Units
21
100.0%
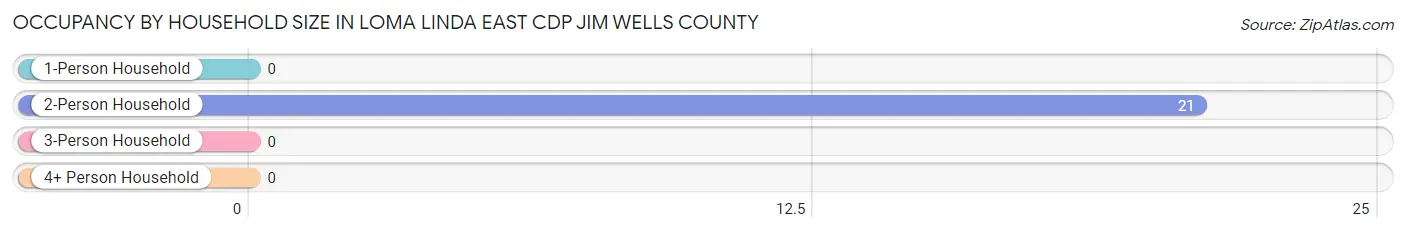
Occupancy by Household Size in Loma Linda East CDP Jim Wells County
Household Size
# Housing Units
% Housing Units
1-Person Household
0
0.0%
2-Person Household
21
100.0%
3-Person Household
0
0.0%
4+ Person Household
0
0.0%
Total Housing Units
21
100.0%
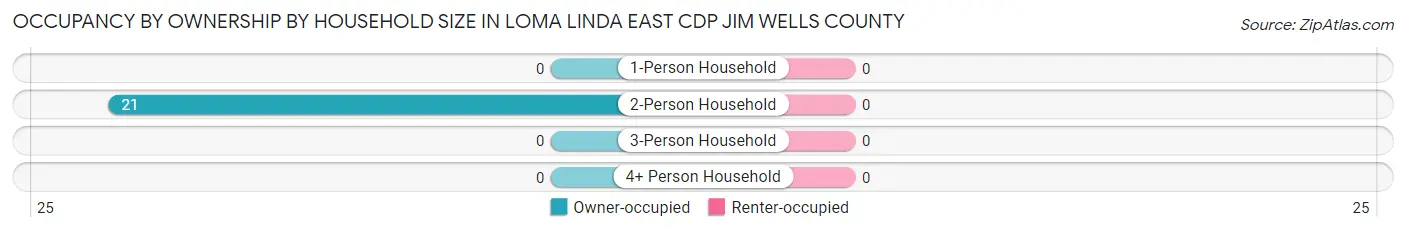
Occupancy by Ownership by Household Size in Loma Linda East CDP Jim Wells County
Household Size
Owner-occupied
Renter-occupied
1-Person Household
0 (0.0%)
0 (0.0%)
2-Person Household
21 (100.0%)
0 (0.0%)
3-Person Household
0 (0.0%)
0 (0.0%)
4+ Person Household
0 (0.0%)
0 (0.0%)
Total Housing Units
21 (100.0%)
0 (0.0%)
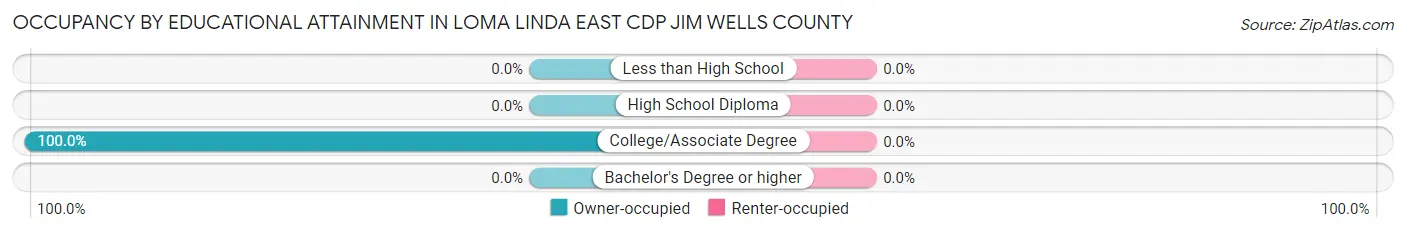
Occupancy by Educational Attainment in Loma Linda East CDP Jim Wells County
Household Size
Owner-occupied
Renter-occupied
Less than High School
0 (0.0%)
0 (0.0%)
High School Diploma
0 (0.0%)
0 (0.0%)
College/Associate Degree
21 (100.0%)
0 (0.0%)
Bachelor's Degree or higher
0 (0.0%)
0 (0.0%)
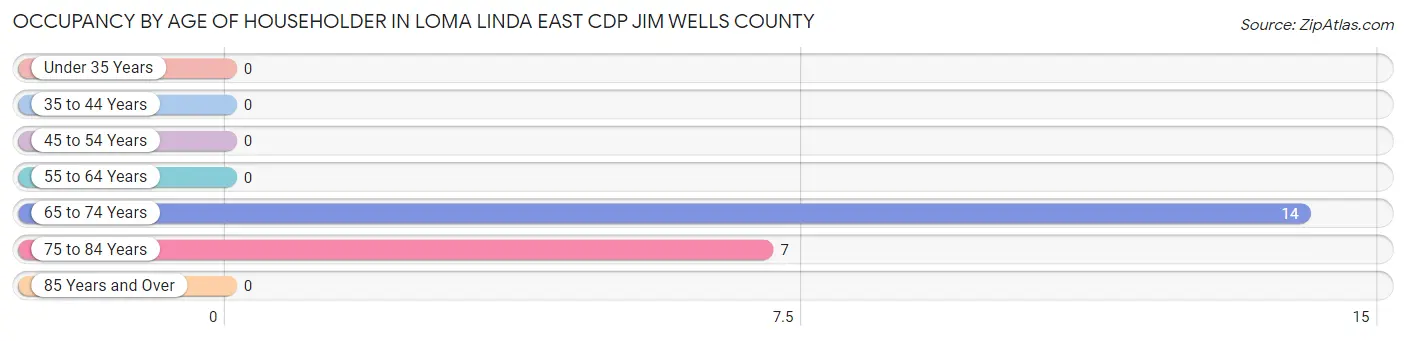
Occupancy by Age of Householder in Loma Linda East CDP Jim Wells County
Age Bracket
# Households
% Households
Under 35 Years
0
0.0%
35 to 44 Years
0
0.0%
45 to 54 Years
0
0.0%
55 to 64 Years
0
0.0%
65 to 74 Years
14
66.7%
75 to 84 Years
7
33.3%
85 Years and Over
0
0.0%
Total
21
100.0%
Housing Finances in Loma Linda East CDP Jim Wells County
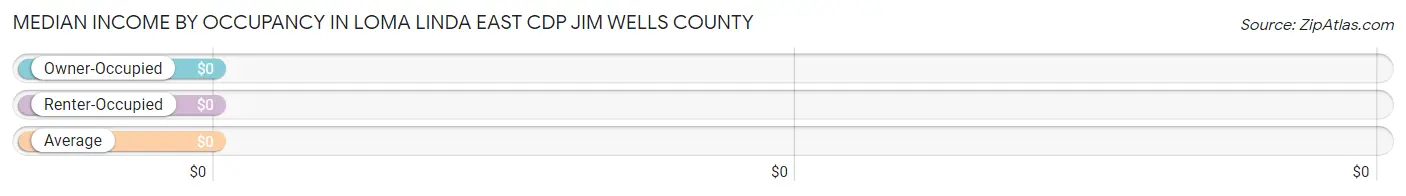
Median Income by Occupancy in Loma Linda East CDP Jim Wells County
Occupancy Type
# Households
Median Income
Owner-Occupied
21 (100.0%)
$0
Renter-Occupied
0 (0.0%)
$0
Average
21 (100.0%)
$0
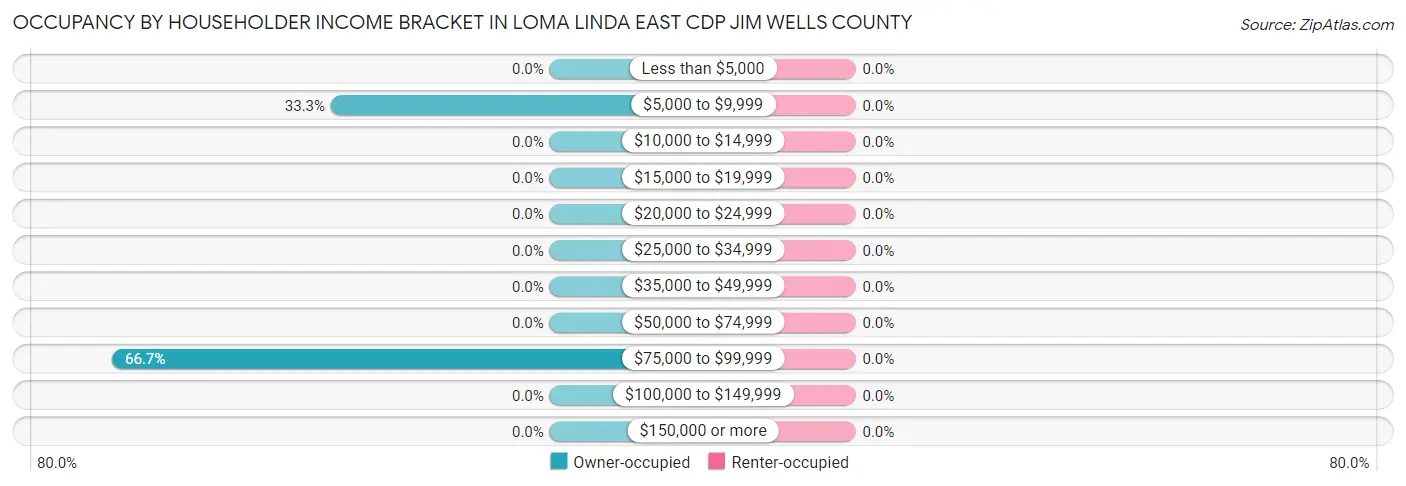
Occupancy by Householder Income Bracket in Loma Linda East CDP Jim Wells County
Income Bracket
Owner-occupied
Renter-occupied
Less than $5,000
0 (0.0%)
0 (0.0%)
$5,000 to $9,999
7 (33.3%)
0 (0.0%)
$10,000 to $14,999
0 (0.0%)
0 (0.0%)
$15,000 to $19,999
0 (0.0%)
0 (0.0%)
$20,000 to $24,999
0 (0.0%)
0 (0.0%)
$25,000 to $34,999
0 (0.0%)
0 (0.0%)
$35,000 to $49,999
0 (0.0%)
0 (0.0%)
$50,000 to $74,999
0 (0.0%)
0 (0.0%)
$75,000 to $99,999
14 (66.7%)
0 (0.0%)
$100,000 to $149,999
0 (0.0%)
0 (0.0%)
$150,000 or more
0 (0.0%)
0 (0.0%)
Total
21 (100.0%)
0 (0.0%)
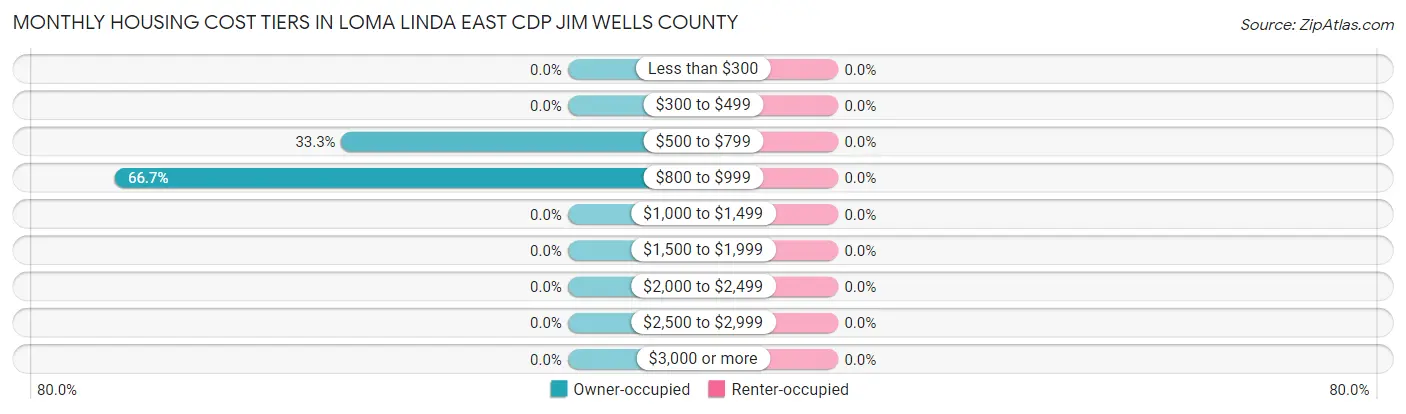
Monthly Housing Cost Tiers in Loma Linda East CDP Jim Wells County
Monthly Cost
Owner-occupied
Renter-occupied
Less than $300
0 (0.0%)
0 (0.0%)
$300 to $499
0 (0.0%)
0 (0.0%)
$500 to $799
7 (33.3%)
0 (0.0%)
$800 to $999
14 (66.7%)
0 (0.0%)
$1,000 to $1,499
0 (0.0%)
0 (0.0%)
$1,500 to $1,999
0 (0.0%)
0 (0.0%)
$2,000 to $2,499
0 (0.0%)
0 (0.0%)
$2,500 to $2,999
0 (0.0%)
0 (0.0%)
$3,000 or more
0 (0.0%)
0 (0.0%)
Total
21 (100.0%)
0 (0.0%)
Physical Housing Characteristics in Loma Linda East CDP Jim Wells County
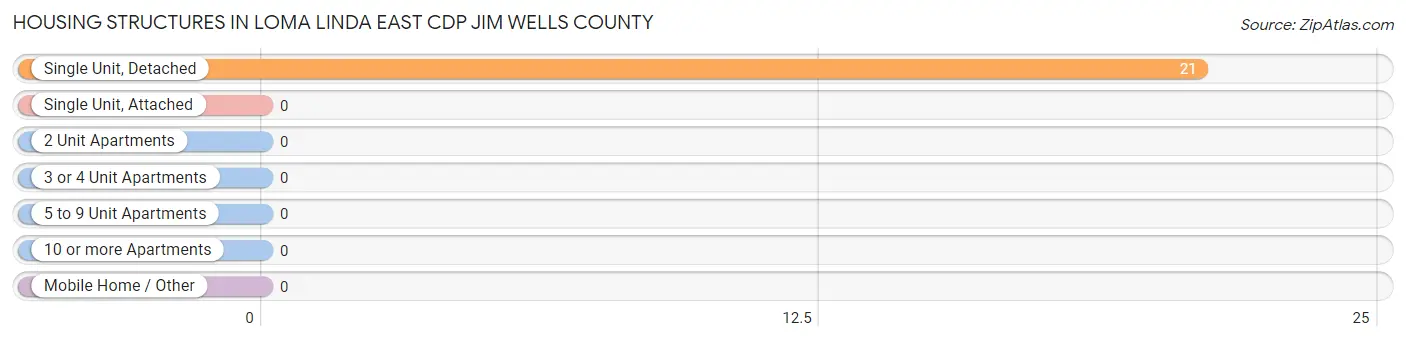
Housing Structures in Loma Linda East CDP Jim Wells County
Structure Type
# Housing Units
% Housing Units
Single Unit, Detached
21
100.0%
Single Unit, Attached
0
0.0%
2 Unit Apartments
0
0.0%
3 or 4 Unit Apartments
0
0.0%
5 to 9 Unit Apartments
0
0.0%
10 or more Apartments
0
0.0%
Mobile Home / Other
0
0.0%
Total
21
100.0%
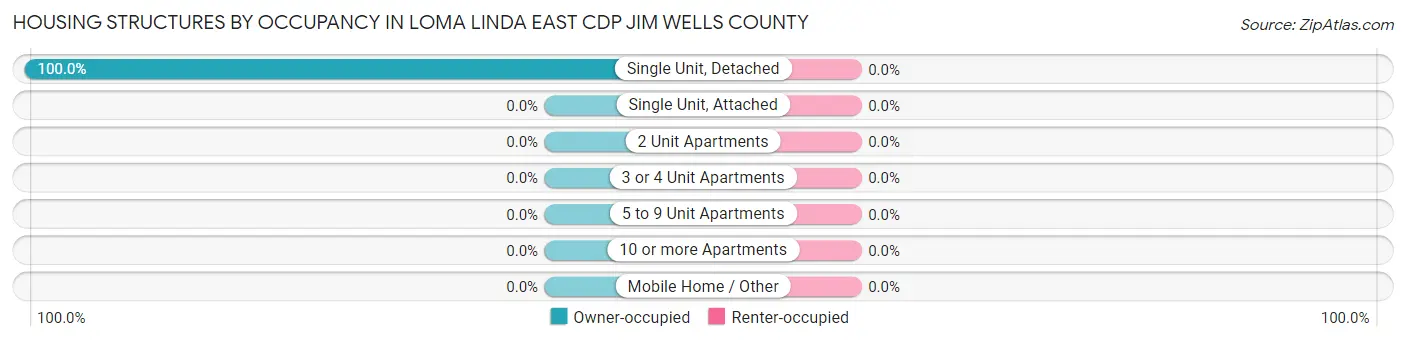
Housing Structures by Occupancy in Loma Linda East CDP Jim Wells County
Structure Type
Owner-occupied
Renter-occupied
Single Unit, Detached
21 (100.0%)
0 (0.0%)
Single Unit, Attached
0 (0.0%)
0 (0.0%)
2 Unit Apartments
0 (0.0%)
0 (0.0%)
3 or 4 Unit Apartments
0 (0.0%)
0 (0.0%)
5 to 9 Unit Apartments
0 (0.0%)
0 (0.0%)
10 or more Apartments
0 (0.0%)
0 (0.0%)
Mobile Home / Other
0 (0.0%)
0 (0.0%)
Total
21 (100.0%)
0 (0.0%)
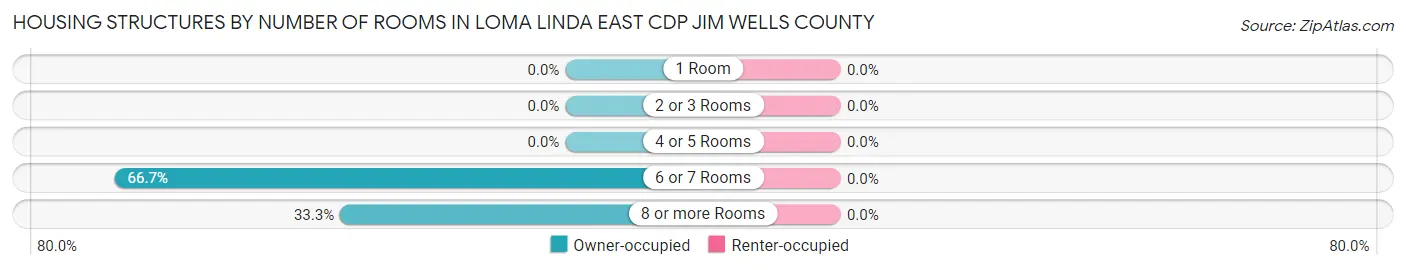
Housing Structures by Number of Rooms in Loma Linda East CDP Jim Wells County
Number of Rooms
Owner-occupied
Renter-occupied
1 Room
0 (0.0%)
0 (0.0%)
2 or 3 Rooms
0 (0.0%)
0 (0.0%)
4 or 5 Rooms
0 (0.0%)
0 (0.0%)
6 or 7 Rooms
14 (66.7%)
0 (0.0%)
8 or more Rooms
7 (33.3%)
0 (0.0%)
Total
21 (100.0%)
0 (0.0%)
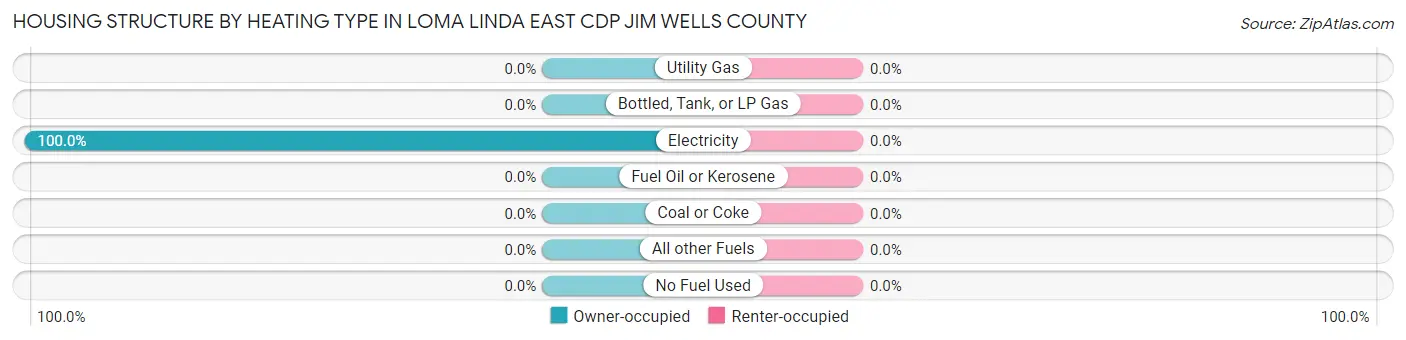
Housing Structure by Heating Type in Loma Linda East CDP Jim Wells County
Heating Type
Owner-occupied
Renter-occupied
Utility Gas
0 (0.0%)
0 (0.0%)
Bottled, Tank, or LP Gas
0 (0.0%)
0 (0.0%)
Electricity
21 (100.0%)
0 (0.0%)
Fuel Oil or Kerosene
0 (0.0%)
0 (0.0%)
Coal or Coke
0 (0.0%)
0 (0.0%)
All other Fuels
0 (0.0%)
0 (0.0%)
No Fuel Used
0 (0.0%)
0 (0.0%)
Total
21 (100.0%)
0 (0.0%)
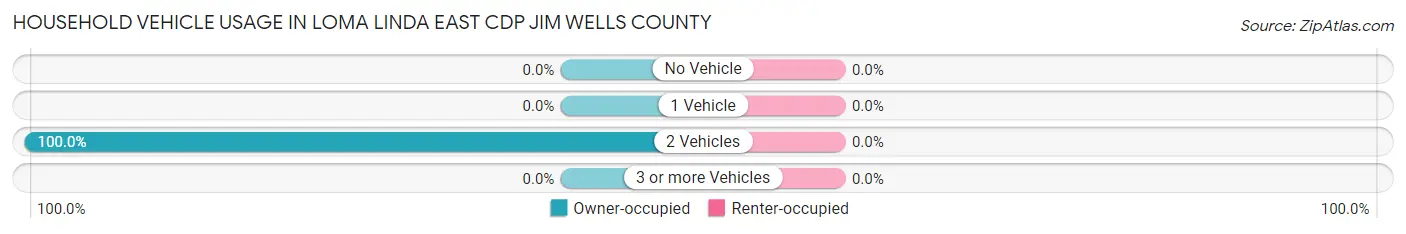
Household Vehicle Usage in Loma Linda East CDP Jim Wells County
Vehicles per Household
Owner-occupied
Renter-occupied
No Vehicle
0 (0.0%)
0 (0.0%)
1 Vehicle
0 (0.0%)
0 (0.0%)
2 Vehicles
21 (100.0%)
0 (0.0%)
3 or more Vehicles
0 (0.0%)
0 (0.0%)
Total
21 (100.0%)
0 (0.0%)
Real Estate & Mortgages in Loma Linda East CDP Jim Wells County
Real Estate and Mortgage Overview in Loma Linda East CDP Jim Wells County
Characteristic
Without Mortgage
With Mortgage
Housing Units
21
0
Median Property Value
-
-
Median Household Income
-
-
Monthly Housing Costs
-
-
Real Estate Taxes
-
-
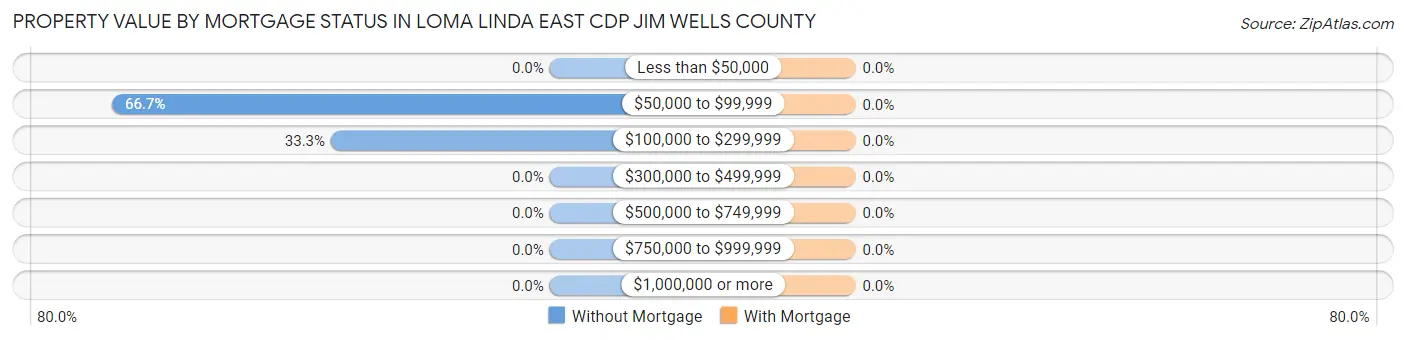
Property Value by Mortgage Status in Loma Linda East CDP Jim Wells County
Property Value
Without Mortgage
With Mortgage
Less than $50,000
0 (0.0%)
0 (0.0%)
$50,000 to $99,999
14 (66.7%)
0 (0.0%)
$100,000 to $299,999
7 (33.3%)
0 (0.0%)
$300,000 to $499,999
0 (0.0%)
0 (0.0%)
$500,000 to $749,999
0 (0.0%)
0 (0.0%)
$750,000 to $999,999
0 (0.0%)
0 (0.0%)
$1,000,000 or more
0 (0.0%)
0 (0.0%)
Total
21 (100.0%)
0 (0.0%)
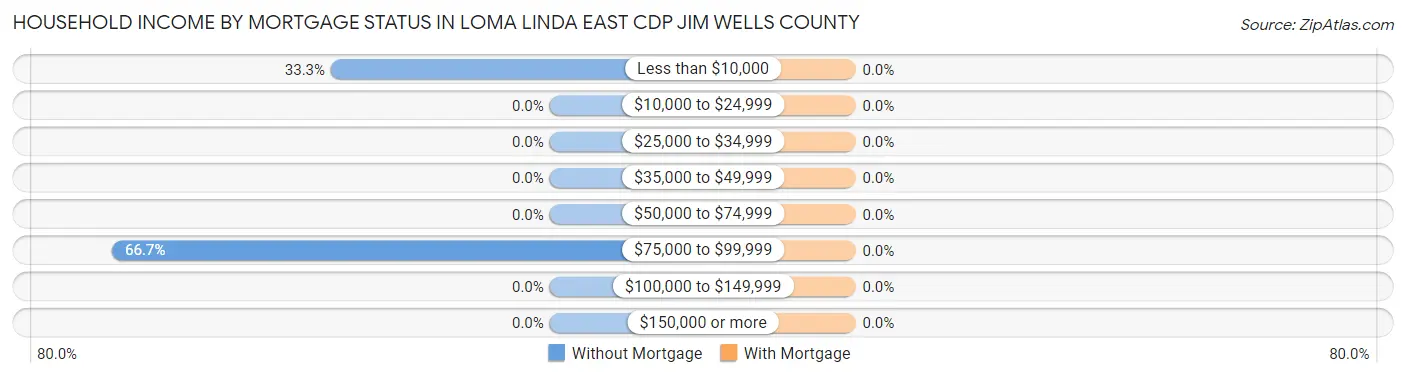
Household Income by Mortgage Status in Loma Linda East CDP Jim Wells County
Household Income
Without Mortgage
With Mortgage
Less than $10,000
7 (33.3%)
0 (0.0%)
$10,000 to $24,999
0 (0.0%)
0 (0.0%)
$25,000 to $34,999
0 (0.0%)
0 (0.0%)
$35,000 to $49,999
0 (0.0%)
0 (0.0%)
$50,000 to $74,999
0 (0.0%)
0 (0.0%)
$75,000 to $99,999
14 (66.7%)
0 (0.0%)
$100,000 to $149,999
0 (0.0%)
0 (0.0%)
$150,000 or more
0 (0.0%)
0 (0.0%)
Total
21 (100.0%)
0 (0.0%)
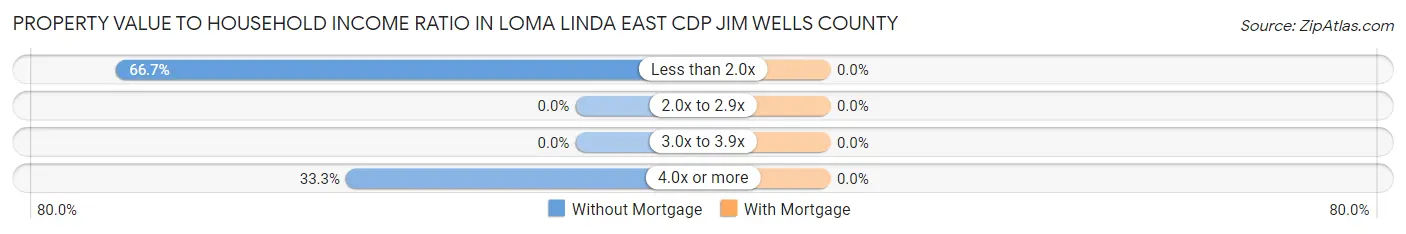
Property Value to Household Income Ratio in Loma Linda East CDP Jim Wells County
Value-to-Income Ratio
Without Mortgage
With Mortgage
Less than 2.0x
14 (66.7%)
0 (0.0%)
2.0x to 2.9x
0 (0.0%)
0 (0.0%)
3.0x to 3.9x
0 (0.0%)
0 (0.0%)
4.0x or more
7 (33.3%)
0 (0.0%)
Total
21 (100.0%)
0 (0.0%)
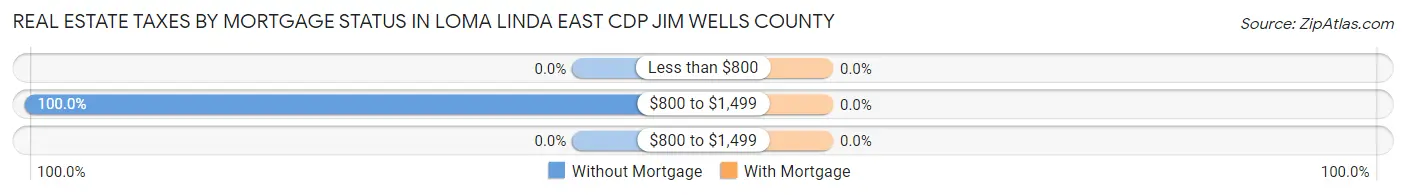
Real Estate Taxes by Mortgage Status in Loma Linda East CDP Jim Wells County
Property Taxes
Without Mortgage
With Mortgage
Less than $800
0 (0.0%)
0 (0.0%)
$800 to $1,499
21 (100.0%)
0 (0.0%)
$800 to $1,499
0 (0.0%)
0 (0.0%)
Total
21 (100.0%)
0 (0.0%)
Health & Disability in Loma Linda East CDP Jim Wells County
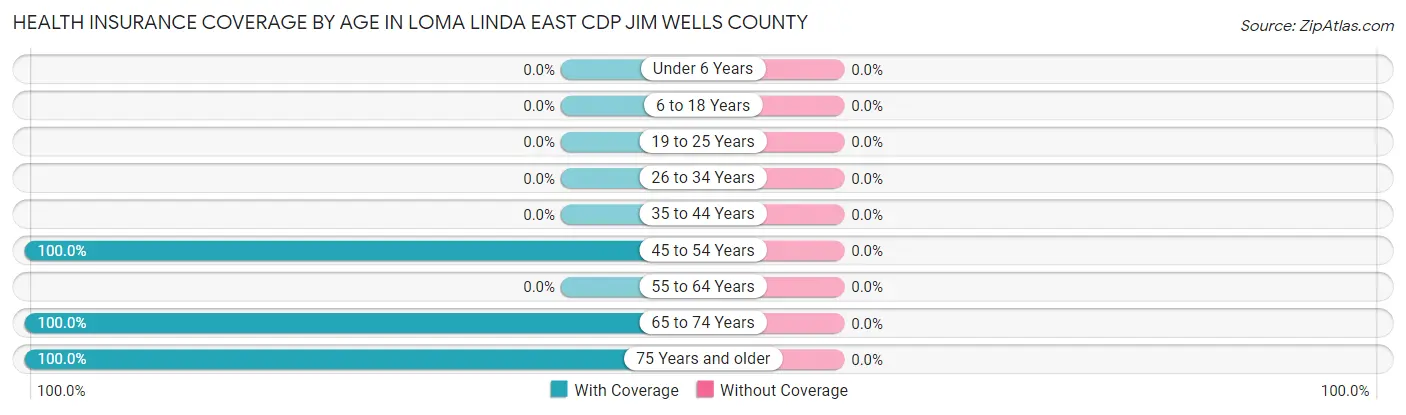
Health Insurance Coverage by Age in Loma Linda East CDP Jim Wells County
Age Bracket
With Coverage
Without Coverage
Under 6 Years
0 (0.0%)
0 (0.0%)
6 to 18 Years
0 (0.0%)
0 (0.0%)
19 to 25 Years
0 (0.0%)
0 (0.0%)
26 to 34 Years
0 (0.0%)
0 (0.0%)
35 to 44 Years
0 (0.0%)
0 (0.0%)
45 to 54 Years
10 (100.0%)
0 (0.0%)
55 to 64 Years
0 (0.0%)
0 (0.0%)
65 to 74 Years
17 (100.0%)
0 (0.0%)
75 Years and older
7 (100.0%)
0 (0.0%)
Total
34 (100.0%)
0 (0.0%)
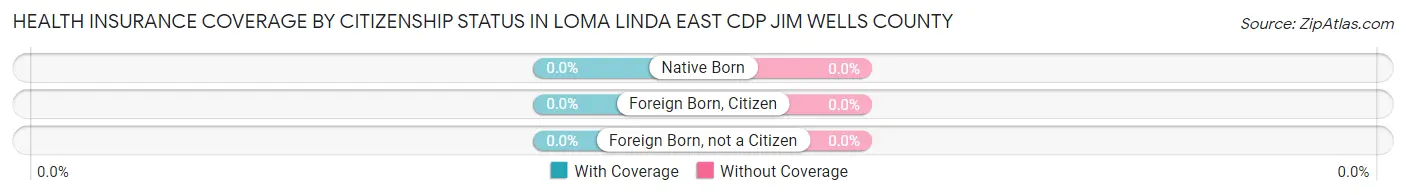
Health Insurance Coverage by Citizenship Status in Loma Linda East CDP Jim Wells County
Citizenship Status
With Coverage
Without Coverage
Native Born
0 (0.0%)
0 (0.0%)
Foreign Born, Citizen
0 (0.0%)
0 (0.0%)
Foreign Born, not a Citizen
0 (0.0%)
0 (0.0%)
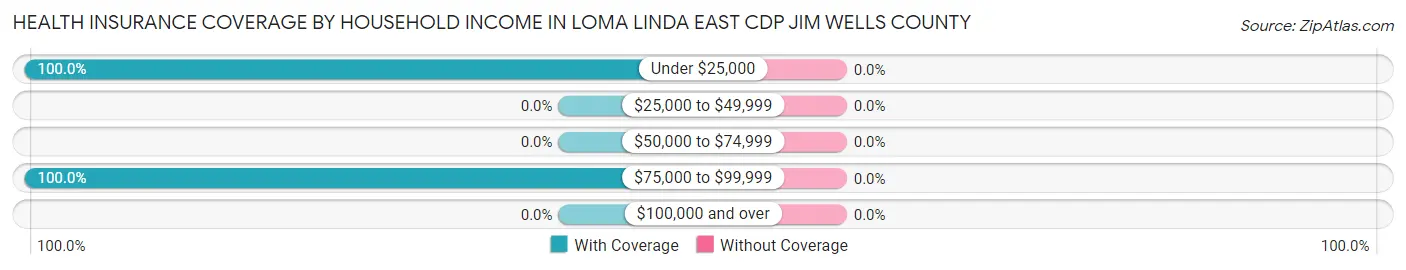
Health Insurance Coverage by Household Income in Loma Linda East CDP Jim Wells County
Household Income
With Coverage
Without Coverage
Under $25,000
10 (100.0%)
0 (0.0%)
$25,000 to $49,999
0 (0.0%)
0 (0.0%)
$50,000 to $74,999
0 (0.0%)
0 (0.0%)
$75,000 to $99,999
24 (100.0%)
0 (0.0%)
$100,000 and over
0 (0.0%)
0 (0.0%)
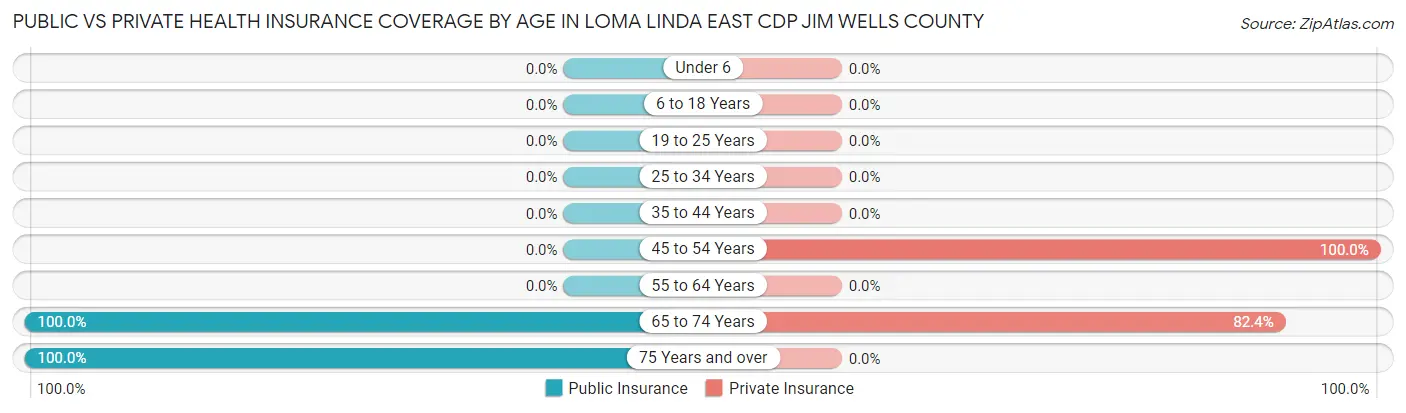
Public vs Private Health Insurance Coverage by Age in Loma Linda East CDP Jim Wells County
Age Bracket
Public Insurance
Private Insurance
Under 6
0 (0.0%)
0 (0.0%)
6 to 18 Years
0 (0.0%)
0 (0.0%)
19 to 25 Years
0 (0.0%)
0 (0.0%)
25 to 34 Years
0 (0.0%)
0 (0.0%)
35 to 44 Years
0 (0.0%)
0 (0.0%)
45 to 54 Years
0 (0.0%)
10 (100.0%)
55 to 64 Years
0 (0.0%)
0 (0.0%)
65 to 74 Years
17 (100.0%)
14 (82.4%)
75 Years and over
7 (100.0%)
0 (0.0%)
Total
24 (70.6%)
24 (70.6%)
Disability Status by Sex by Age in Loma Linda East CDP Jim Wells County
Age Bracket
Male
Female
Under 5 Years
0 (0.0%)
0 (0.0%)
5 to 17 Years
0 (0.0%)
0 (0.0%)
18 to 34 Years
0 (0.0%)
0 (0.0%)
35 to 64 Years
0 (0.0%)
0 (0.0%)
65 to 74 Years
0 (0.0%)
0 (0.0%)
75 Years and over
0 (0.0%)
0 (0.0%)
Disability Class by Sex by Age in Loma Linda East CDP Jim Wells County
Disability Class: Hearing Difficulty
Age Bracket
Male
Female
Under 5 Years
0 (0.0%)
0 (0.0%)
5 to 17 Years
0 (0.0%)
0 (0.0%)
18 to 34 Years
0 (0.0%)
0 (0.0%)
35 to 64 Years
0 (0.0%)
0 (0.0%)
65 to 74 Years
0 (0.0%)
0 (0.0%)
75 Years and over
0 (0.0%)
0 (0.0%)
Disability Class: Vision Difficulty
Age Bracket
Male
Female
Under 5 Years
0 (0.0%)
0 (0.0%)
5 to 17 Years
0 (0.0%)
0 (0.0%)
18 to 34 Years
0 (0.0%)
0 (0.0%)
35 to 64 Years
0 (0.0%)
0 (0.0%)
65 to 74 Years
0 (0.0%)
0 (0.0%)
75 Years and over
0 (0.0%)
0 (0.0%)
Disability Class: Cognitive Difficulty
Age Bracket
Male
Female
5 to 17 Years
0 (0.0%)
0 (0.0%)
18 to 34 Years
0 (0.0%)
0 (0.0%)
35 to 64 Years
0 (0.0%)
0 (0.0%)
65 to 74 Years
0 (0.0%)
0 (0.0%)
75 Years and over
0 (0.0%)
0 (0.0%)
Disability Class: Ambulatory Difficulty
Age Bracket
Male
Female
5 to 17 Years
0 (0.0%)
0 (0.0%)
18 to 34 Years
0 (0.0%)
0 (0.0%)
35 to 64 Years
0 (0.0%)
0 (0.0%)
65 to 74 Years
0 (0.0%)
0 (0.0%)
75 Years and over
0 (0.0%)
0 (0.0%)
Disability Class: Self-Care Difficulty
Age Bracket
Male
Female
5 to 17 Years
0 (0.0%)
0 (0.0%)
18 to 34 Years
0 (0.0%)
0 (0.0%)
35 to 64 Years
0 (0.0%)
0 (0.0%)
65 to 74 Years
0 (0.0%)
0 (0.0%)
75 Years and over
0 (0.0%)
0 (0.0%)
Technology Access in Loma Linda East CDP Jim Wells County
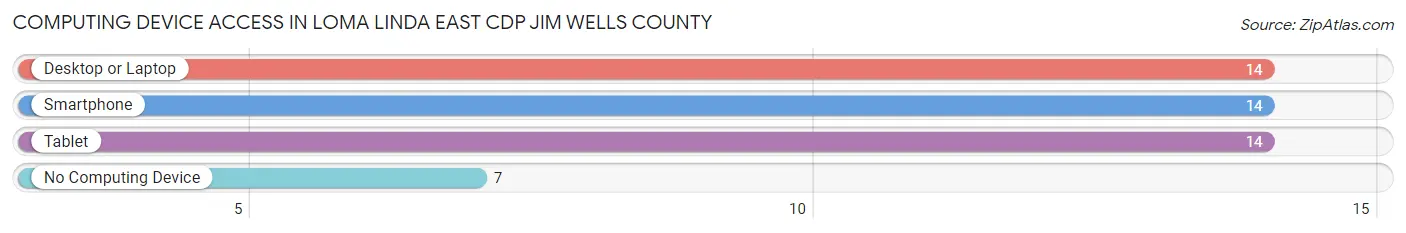
Computing Device Access in Loma Linda East CDP Jim Wells County
Device Type
# Households
% Households
Desktop or Laptop
14
66.7%
Smartphone
14
66.7%
Tablet
14
66.7%
No Computing Device
7
33.3%
Total
21
100.0%
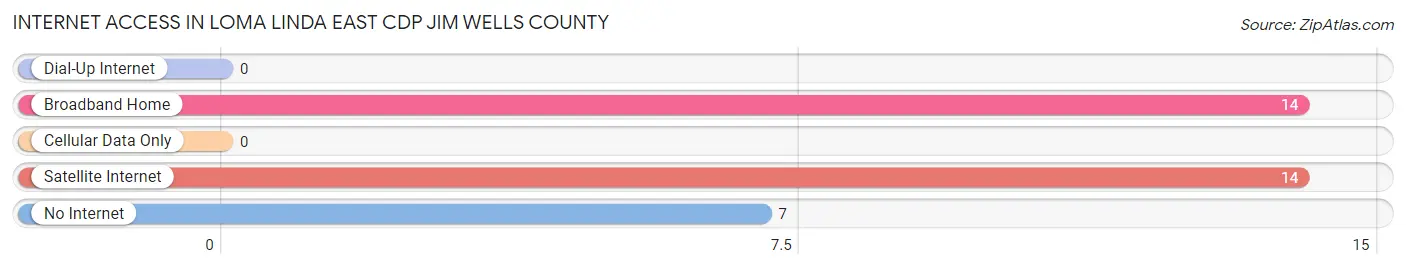
Internet Access in Loma Linda East CDP Jim Wells County
Internet Type
# Households
% Households
Dial-Up Internet
0
0.0%
Broadband Home
14
66.7%
Cellular Data Only
0
0.0%
Satellite Internet
14
66.7%
No Internet
7
33.3%
Total
21
100.0%
Loma Linda East CDP Jim Wells County Summary
Loma Linda East Cdp is a census-designated place (CDP) located in Jim Wells County, Texas. It is situated in the Coastal Bend region of South Texas, approximately 25 miles northwest of Corpus Christi. The population of Loma Linda East Cdp was 1,845 at the 2010 census.
Geography
Loma Linda East Cdp is located at 28°25'25" North, 97°59'45" West (28.423, -97.996). It has an area of 1.3 square miles, all of which is land.
History
Loma Linda East Cdp was first settled in the late 19th century by ranchers and farmers. The area was originally part of Nueces County, but was annexed by Jim Wells County in the early 20th century. The community was named after the nearby Loma Linda Ranch, which was owned by the prominent local family of the same name.
The first post office in the area was established in 1910, and the community was officially incorporated in 1915. The town grew steadily throughout the 20th century, and by the 2000 census, the population had reached 1,845.
Economy
The economy of Loma Linda East Cdp is largely based on agriculture and ranching. The area is home to several large ranches, including the Loma Linda Ranch, which is one of the largest in the region. The town also has a few small businesses, including a grocery store, a hardware store, and a few restaurants.
Demographics
As of the 2010 census, the population of Loma Linda East Cdp was 1,845. The racial makeup of the town was 79.3% White, 0.3% African American, 0.2% Native American, 0.2% Asian, 0.1% Pacific Islander, 17.7% from other races, and 2.4% from two or more races. Hispanic or Latino of any race were 33.2% of the population.
The median household income in Loma Linda East Cdp was $30,938, and the median family income was $35,625. About 22.2% of families and 25.2% of the population were below the poverty line, including 33.3% of those under age 18 and 16.2% of those age 65 or over.
Education
Loma Linda East Cdp is served by the Jim Wells County Independent School District. The town is home to Loma Linda Elementary School, which serves students in grades K-5. Students in grades 6-12 attend Orange Grove High School in nearby Orange Grove.
Common Questions
What is Per Capita Income in Loma Linda East CDP Jim Wells County?
Per Capita income in Loma Linda East CDP Jim Wells County is $32,929.
What is Inequality or Gini Index in Loma Linda East CDP Jim Wells County?
Inequality or Gini Index in Loma Linda East CDP Jim Wells County is 0.31.
What is the Total Population of Loma Linda East CDP Jim Wells County?
Total Population of Loma Linda East CDP Jim Wells County is 34.
What is the Total Male Population of Loma Linda East CDP Jim Wells County?
Total Male Population of Loma Linda East CDP Jim Wells County is 21.
What is the Total Female Population of Loma Linda East CDP Jim Wells County?
Total Female Population of Loma Linda East CDP Jim Wells County is 13.
What is the Ratio of Males per 100 Females in Loma Linda East CDP Jim Wells County?
There are 161.54 Males per 100 Females in Loma Linda East CDP Jim Wells County.
What is the Ratio of Females per 100 Males in Loma Linda East CDP Jim Wells County?
There are 61.90 Females per 100 Males in Loma Linda East CDP Jim Wells County.
What is the Median Population Age in Loma Linda East CDP Jim Wells County?
Median Population Age in Loma Linda East CDP Jim Wells County is 65.5 Years.
What is the Average Family Size in Loma Linda East CDP Jim Wells County
Average Family Size in Loma Linda East CDP Jim Wells County is 1.6 People.
What is the Average Household Size in Loma Linda East CDP Jim Wells County
Average Household Size in Loma Linda East CDP Jim Wells County is 1.6 People.
How Large is the Labor Force in Loma Linda East CDP Jim Wells County?
There are 10 People in the Labor Forcein in Loma Linda East CDP Jim Wells County.
What is the Percentage of People in the Labor Force in Loma Linda East CDP Jim Wells County?
29.4% of People are in the Labor Force in Loma Linda East CDP Jim Wells County.
Report Title
Report Link
HTML Copy & Paste Link
Social Media
Copy and paste the folowing code into any webpage where you would like this interactive chart to display