Zip Codes with the Highest Percentage of Families with Income Below $10,000 in San Antonio, TX
RELATED REPORTS & OPTIONS
Family Income | $0-10k
San Antonio
Compare Zip Codes
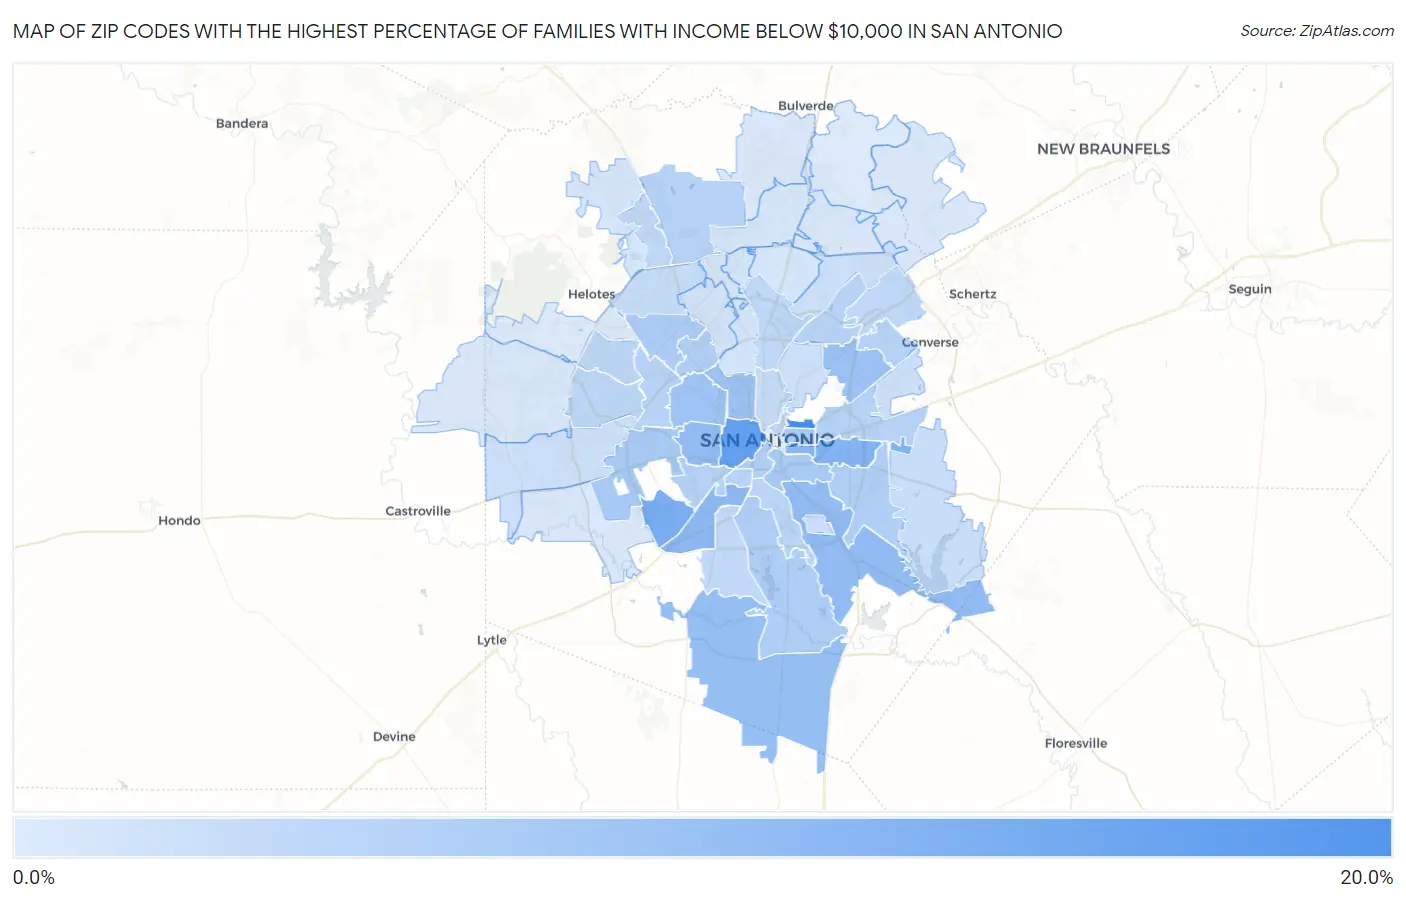
Map of Zip Codes with the Highest Percentage of Families with Income Below $10,000 in San Antonio
0.50%
15.2%
Zip Codes with the Highest Percentage of Families with Income Below $10,000 in San Antonio, TX
| Zip Code | Families with Income < $10k | vs State | vs National | |
| 1. | 78208 | 15.2% | 3.5%(+11.7)#40 | 3.1%(+12.1)#838 |
| 2. | 78207 | 12.3% | 3.5%(+8.80)#60 | 3.1%(+9.20)#1,256 |
| 3. | 78242 | 10.1% | 3.5%(+6.60)#91 | 3.1%(+7.00)#1,865 |
| 4. | 78220 | 9.3% | 3.5%(+5.80)#115 | 3.1%(+6.20)#2,195 |
| 5. | 78203 | 8.6% | 3.5%(+5.10)#138 | 3.1%(+5.50)#2,575 |
| 6. | 78211 | 8.1% | 3.5%(+4.60)#164 | 3.1%(+5.00)#2,900 |
| 7. | 78237 | 7.7% | 3.5%(+4.20)#188 | 3.1%(+4.60)#3,129 |
| 8. | 78223 | 7.6% | 3.5%(+4.10)#190 | 3.1%(+4.50)#3,191 |
| 9. | 78264 | 7.2% | 3.5%(+3.70)#204 | 3.1%(+4.10)#3,489 |
| 10. | 78218 | 6.6% | 3.5%(+3.10)#240 | 3.1%(+3.50)#3,996 |
| 11. | 78228 | 6.3% | 3.5%(+2.80)#266 | 3.1%(+3.20)#4,286 |
| 12. | 78201 | 6.3% | 3.5%(+2.80)#269 | 3.1%(+3.20)#4,293 |
| 13. | 78227 | 5.4% | 3.5%(+1.90)#377 | 3.1%(+2.30)#5,433 |
| 14. | 78210 | 5.4% | 3.5%(+1.90)#380 | 3.1%(+2.30)#5,445 |
| 15. | 78202 | 5.4% | 3.5%(+1.90)#389 | 3.1%(+2.30)#5,492 |
| 16. | 78240 | 5.1% | 3.5%(+1.60)#418 | 3.1%(+2.00)#5,910 |
| 17. | 78221 | 4.9% | 3.5%(+1.40)#447 | 3.1%(+1.80)#6,254 |
| 18. | 78229 | 4.6% | 3.5%(+1.10)#485 | 3.1%(+1.50)#6,813 |
| 19. | 78222 | 4.5% | 3.5%(+1.000)#506 | 3.1%(+1.40)#7,014 |
| 20. | 78204 | 4.5% | 3.5%(+1.000)#511 | 3.1%(+1.40)#7,043 |
| 21. | 78226 | 4.2% | 3.5%(+0.700)#567 | 3.1%(+1.10)#7,742 |
| 22. | 78239 | 4.1% | 3.5%(+0.600)#578 | 3.1%(+1.000)#7,898 |
| 23. | 78219 | 4.1% | 3.5%(+0.600)#579 | 3.1%(+1.000)#7,936 |
| 24. | 78257 | 4.1% | 3.5%(+0.600)#584 | 3.1%(+1.000)#7,976 |
| 25. | 78238 | 4.0% | 3.5%(+0.500)#592 | 3.1%(+0.900)#8,168 |
| 26. | 78217 | 3.9% | 3.5%(+0.400)#603 | 3.1%(+0.800)#8,408 |
| 27. | 78225 | 3.9% | 3.5%(+0.400)#607 | 3.1%(+0.800)#8,470 |
| 28. | 78214 | 3.8% | 3.5%(+0.300)#617 | 3.1%(+0.700)#8,694 |
| 29. | 78251 | 3.6% | 3.5%(+0.100)#643 | 3.1%(+0.500)#9,206 |
| 30. | 78250 | 3.4% | 3.5%(-0.100)#684 | 3.1%(+0.300)#9,764 |
| 31. | 78216 | 3.3% | 3.5%(-0.200)#706 | 3.1%(+0.200)#10,113 |
| 32. | 78233 | 3.2% | 3.5%(-0.300)#727 | 3.1%(+0.100)#10,414 |
| 33. | 78256 | 3.1% | 3.5%(-0.400)#761 | 3.1%(=0.000)#10,888 |
| 34. | 78224 | 3.0% | 3.5%(-0.500)#780 | 3.1%(-0.100)#11,171 |
| 35. | 78215 | 2.9% | 3.5%(-0.600)#813 | 3.1%(-0.200)#11,649 |
| 36. | 78212 | 2.8% | 3.5%(-0.700)#830 | 3.1%(-0.300)#11,892 |
| 37. | 78249 | 2.6% | 3.5%(-0.900)#873 | 3.1%(-0.500)#12,589 |
| 38. | 78263 | 2.4% | 3.5%(-1.10)#935 | 3.1%(-0.700)#13,648 |
| 39. | 78235 | 2.1% | 3.5%(-1.40)#1,023 | 3.1%(-1.000)#15,098 |
| 40. | 78247 | 2.0% | 3.5%(-1.50)#1,033 | 3.1%(-1.10)#15,253 |
| 41. | 78209 | 2.0% | 3.5%(-1.50)#1,035 | 3.1%(-1.10)#15,270 |
| 42. | 78244 | 2.0% | 3.5%(-1.50)#1,037 | 3.1%(-1.10)#15,295 |
| 43. | 78245 | 1.9% | 3.5%(-1.60)#1,056 | 3.1%(-1.20)#15,707 |
| 44. | 78230 | 1.6% | 3.5%(-1.90)#1,147 | 3.1%(-1.50)#17,212 |
| 45. | 78213 | 1.5% | 3.5%(-2.00)#1,176 | 3.1%(-1.60)#17,685 |
| 46. | 78248 | 1.3% | 3.5%(-2.20)#1,237 | 3.1%(-1.80)#18,862 |
| 47. | 78232 | 1.2% | 3.5%(-2.30)#1,260 | 3.1%(-1.90)#19,237 |
| 48. | 78255 | 1.2% | 3.5%(-2.30)#1,267 | 3.1%(-1.90)#19,351 |
| 49. | 78258 | 1.1% | 3.5%(-2.40)#1,295 | 3.1%(-2.00)#19,708 |
| 50. | 78231 | 1.1% | 3.5%(-2.40)#1,309 | 3.1%(-2.00)#19,900 |
| 51. | 78259 | 1.0% | 3.5%(-2.50)#1,324 | 3.1%(-2.10)#20,280 |
| 52. | 78266 | 1.0% | 3.5%(-2.50)#1,328 | 3.1%(-2.10)#20,434 |
| 53. | 78253 | 0.90% | 3.5%(-2.60)#1,339 | 3.1%(-2.20)#20,698 |
| 54. | 78252 | 0.90% | 3.5%(-2.60)#1,345 | 3.1%(-2.20)#20,845 |
| 55. | 78260 | 0.80% | 3.5%(-2.70)#1,361 | 3.1%(-2.30)#21,218 |
| 56. | 78254 | 0.60% | 3.5%(-2.90)#1,401 | 3.1%(-2.50)#22,137 |
| 57. | 78261 | 0.50% | 3.5%(-3.00)#1,414 | 3.1%(-2.60)#22,639 |
1
Common Questions
What are the Top 10 Zip Codes with the Highest Percentage of Families with Income Below $10,000 in San Antonio, TX?
Top 10 Zip Codes with the Highest Percentage of Families with Income Below $10,000 in San Antonio, TX are:
What zip code has the Highest Percentage of Families with Income Below $10,000 in San Antonio, TX?
78208 has the Highest Percentage of Families with Income Below $10,000 in San Antonio, TX with 15.2%.
What is the Percentage of Families with Income Below $10,000 in San Antonio, TX?
Percentage of Families with Income Below $10,000 in San Antonio is 4.3%.
What is the Percentage of Families with Income Below $10,000 in Texas?
Percentage of Families with Income Below $10,000 in Texas is 3.5%.
What is the Percentage of Families with Income Below $10,000 in the United States?
Percentage of Families with Income Below $10,000 in the United States is 3.1%.