San Carlos, TX Map & Demographics
San Carlos Map
San Carlos Overview
$15,688
PER CAPITA INCOME
$54,886
AVG FAMILY INCOME
$38,348
AVG HOUSEHOLD INCOME
40.3%
WAGE / INCOME GAP [ % ]
59.7¢/ $1
WAGE / INCOME GAP [ $ ]
0.47
INEQUALITY / GINI INDEX
4,069
TOTAL POPULATION
2,019
MALE POPULATION
2,050
FEMALE POPULATION
98.49
MALES / 100 FEMALES
101.54
FEMALES / 100 MALES
30.6
MEDIAN AGE
4.4
AVG FAMILY SIZE
4.2
AVG HOUSEHOLD SIZE
1,656
LABOR FORCE [ PEOPLE ]
56.6%
PERCENT IN LABOR FORCE
17.7%
UNEMPLOYMENT RATE
Income in San Carlos
Income Overview in San Carlos
Per Capita Income in San Carlos is $15,688, while median incomes of families and households are $54,886 and $38,348 respectively.
| Characteristic | Number | Measure |
| Per Capita Income | 4,069 | $15,688 |
| Median Family Income | 895 | $54,886 |
| Mean Family Income | 895 | $60,762 |
| Median Household Income | 977 | $38,348 |
| Mean Household Income | 977 | $57,391 |
| Income Deficit | 895 | $0 |
| Wage / Income Gap (%) | 4,069 | 40.26% |
| Wage / Income Gap ($) | 4,069 | 59.74¢ per $1 |
| Gini / Inequality Index | 4,069 | 0.47 |
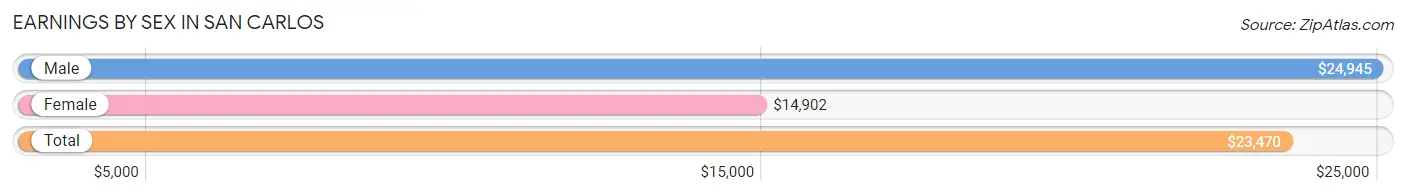
Earnings by Sex in San Carlos
Average Earnings in San Carlos are $23,470, $24,945 for men and $14,902 for women, a difference of 40.3%.
| Sex | Number | Average Earnings |
| Male | 1,142 (64.7%) | $24,945 |
| Female | 624 (35.3%) | $14,902 |
| Total | 1,766 (100.0%) | $23,470 |
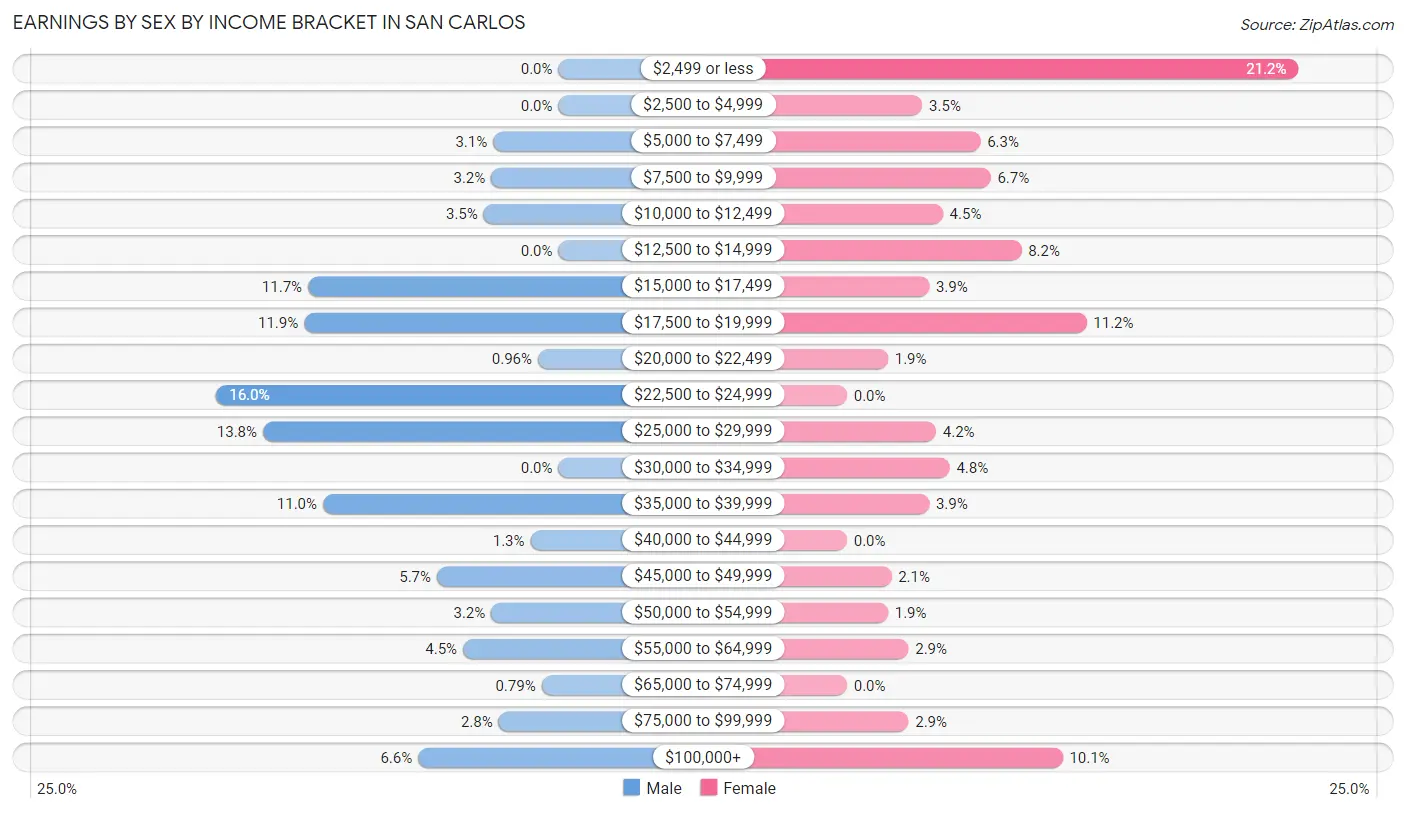
Earnings by Sex by Income Bracket in San Carlos
The most common earnings brackets in San Carlos are $22,500 to $24,999 for men (183 | 16.0%) and $2,499 or less for women (132 | 21.1%).
| Income | Male | Female |
| $2,499 or less | 0 (0.0%) | 132 (21.1%) |
| $2,500 to $4,999 | 0 (0.0%) | 22 (3.5%) |
| $5,000 to $7,499 | 35 (3.1%) | 39 (6.2%) |
| $7,500 to $9,999 | 36 (3.2%) | 42 (6.7%) |
| $10,000 to $12,499 | 40 (3.5%) | 28 (4.5%) |
| $12,500 to $14,999 | 0 (0.0%) | 51 (8.2%) |
| $15,000 to $17,499 | 134 (11.7%) | 24 (3.8%) |
| $17,500 to $19,999 | 136 (11.9%) | 70 (11.2%) |
| $20,000 to $22,499 | 11 (1.0%) | 12 (1.9%) |
| $22,500 to $24,999 | 183 (16.0%) | 0 (0.0%) |
| $25,000 to $29,999 | 158 (13.8%) | 26 (4.2%) |
| $30,000 to $34,999 | 0 (0.0%) | 30 (4.8%) |
| $35,000 to $39,999 | 126 (11.0%) | 24 (3.8%) |
| $40,000 to $44,999 | 15 (1.3%) | 0 (0.0%) |
| $45,000 to $49,999 | 65 (5.7%) | 13 (2.1%) |
| $50,000 to $54,999 | 36 (3.2%) | 12 (1.9%) |
| $55,000 to $64,999 | 51 (4.5%) | 18 (2.9%) |
| $65,000 to $74,999 | 9 (0.8%) | 0 (0.0%) |
| $75,000 to $99,999 | 32 (2.8%) | 18 (2.9%) |
| $100,000+ | 75 (6.6%) | 63 (10.1%) |
| Total | 1,142 (100.0%) | 624 (100.0%) |
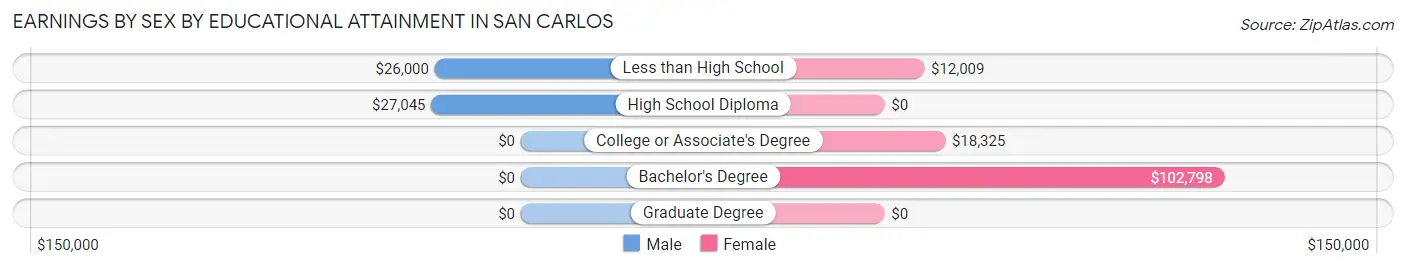
Earnings by Sex by Educational Attainment in San Carlos
Average earnings in San Carlos are $26,944 for men and $17,995 for women, a difference of 33.2%. Men with an educational attainment of high school diploma enjoy the highest average annual earnings of $27,045, while those with less than high school education earn the least with $26,000. Women with an educational attainment of bachelor's degree earn the most with the average annual earnings of $102,798, while those with less than high school education have the smallest earnings of $12,009.
| Educational Attainment | Male Income | Female Income |
| Less than High School | $26,000 | $12,009 |
| High School Diploma | $27,045 | $0 |
| College or Associate's Degree | - | - |
| Bachelor's Degree | - | - |
| Graduate Degree | - | - |
| Total | $26,944 | $17,995 |
Family Income in San Carlos
Family Income Brackets in San Carlos
According to the San Carlos family income data, there are 247 families falling into the $50,000 to $74,999 income range, which is the most common income bracket and makes up 27.6% of all families.
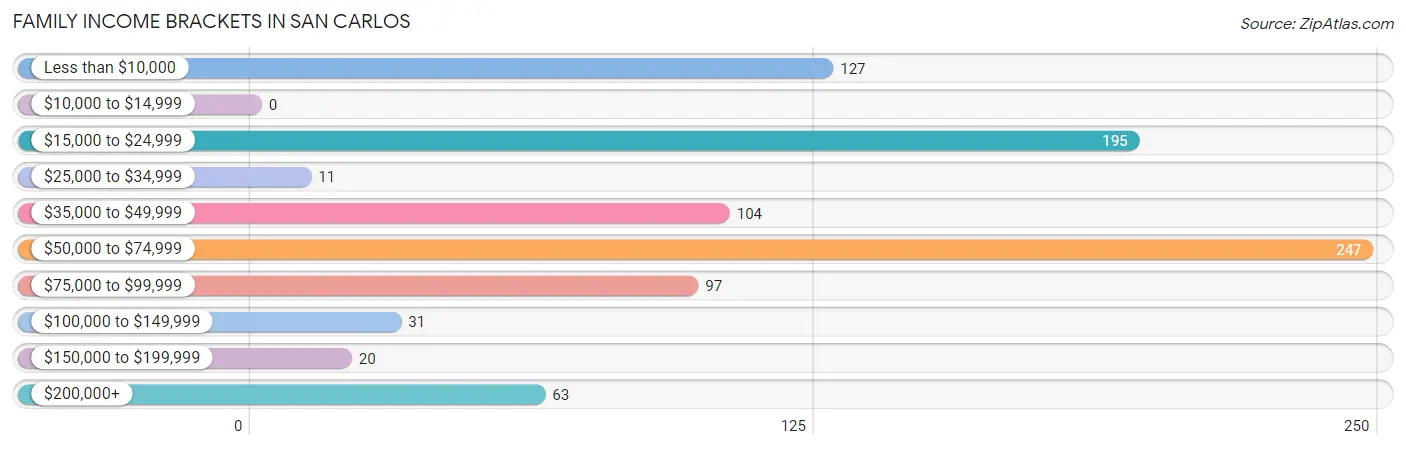
| Income Bracket | # Families | % Families |
| Less than $10,000 | 127 | 14.2% |
| $10,000 to $14,999 | 0 | 0.0% |
| $15,000 to $24,999 | 195 | 21.8% |
| $25,000 to $34,999 | 11 | 1.2% |
| $35,000 to $49,999 | 104 | 11.6% |
| $50,000 to $74,999 | 247 | 27.6% |
| $75,000 to $99,999 | 97 | 10.8% |
| $100,000 to $149,999 | 31 | 3.5% |
| $150,000 to $199,999 | 20 | 2.2% |
| $200,000+ | 63 | 7.0% |
Family Income by Famaliy Size in San Carlos
4-person families (316 | 35.3%) account for the highest median family income in San Carlos with $74,158 per family, while 4-person families (316 | 35.3%) have the highest median income of $18,540 per family member.
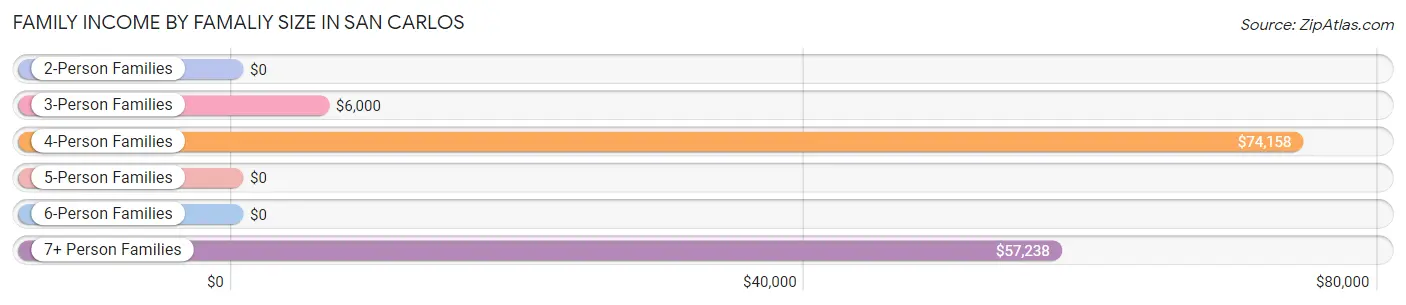
| Income Bracket | # Families | Median Income |
| 2-Person Families | 259 (28.9%) | $0 |
| 3-Person Families | 84 (9.4%) | $6,000 |
| 4-Person Families | 316 (35.3%) | $74,158 |
| 5-Person Families | 68 (7.6%) | $0 |
| 6-Person Families | 27 (3.0%) | $0 |
| 7+ Person Families | 141 (15.8%) | $57,238 |
| Total | 895 (100.0%) | $54,886 |
Family Income by Number of Earners in San Carlos
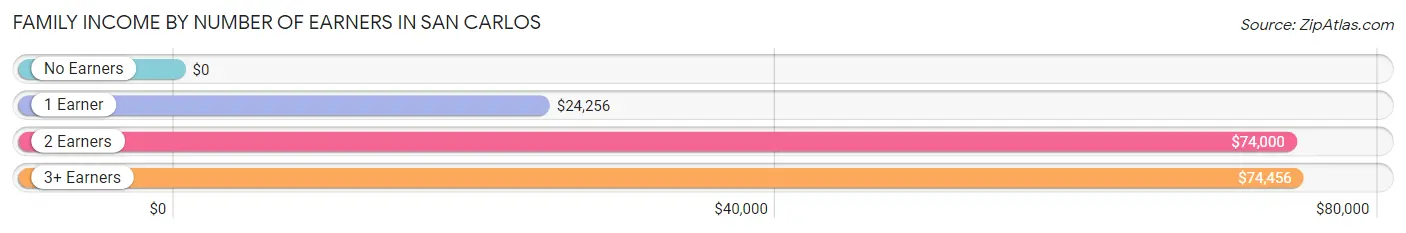
| Number of Earners | # Families | Median Income |
| No Earners | 100 (11.2%) | $0 |
| 1 Earner | 363 (40.6%) | $24,256 |
| 2 Earners | 238 (26.6%) | $74,000 |
| 3+ Earners | 194 (21.7%) | $74,456 |
| Total | 895 (100.0%) | $54,886 |
Household Income in San Carlos
Household Income Brackets in San Carlos
With 261 households falling in the category, the $15,000 to $24,999 income range is the most frequent in San Carlos, accounting for 26.7% of all households.
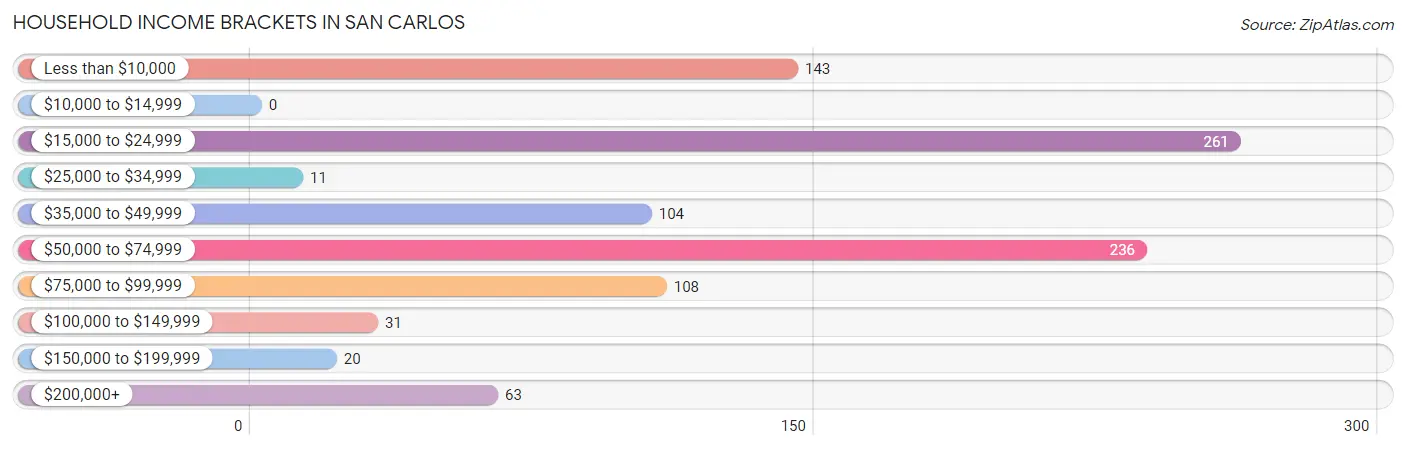
| Income Bracket | # Households | % Households |
| Less than $10,000 | 143 | 14.6% |
| $10,000 to $14,999 | 0 | 0.0% |
| $15,000 to $24,999 | 261 | 26.7% |
| $25,000 to $34,999 | 11 | 1.1% |
| $35,000 to $49,999 | 104 | 10.6% |
| $50,000 to $74,999 | 236 | 24.2% |
| $75,000 to $99,999 | 108 | 11.1% |
| $100,000 to $149,999 | 31 | 3.2% |
| $150,000 to $199,999 | 20 | 2.0% |
| $200,000+ | 63 | 6.4% |
Household Income by Householder Age in San Carlos
The median household income in San Carlos is $38,348, with the highest median household income of $72,907 found in the 25 to 44 years age bracket for the primary householder. A total of 423 households (43.3%) fall into this category. Meanwhile, the 15 to 24 years age bracket for the primary householder has the lowest median household income of $0, with 49 households (5.0%) in this group.
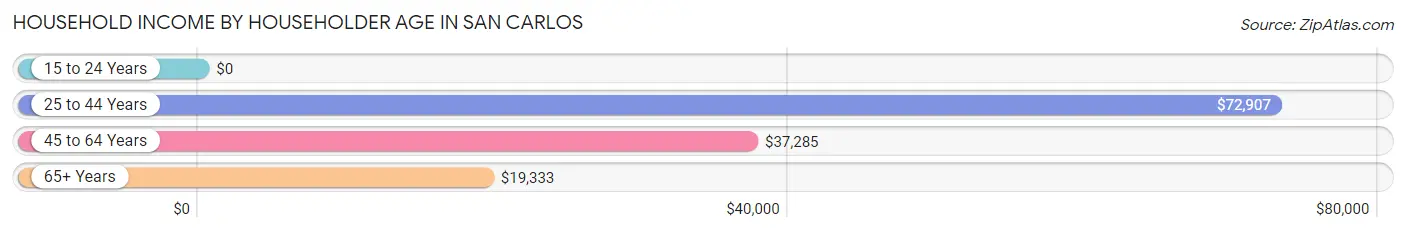
| Income Bracket | # Households | Median Income |
| 15 to 24 Years | 49 (5.0%) | $0 |
| 25 to 44 Years | 423 (43.3%) | $72,907 |
| 45 to 64 Years | 345 (35.3%) | $37,285 |
| 65+ Years | 160 (16.4%) | $19,333 |
| Total | 977 (100.0%) | $38,348 |
Poverty in San Carlos
Income Below Poverty by Sex and Age in San Carlos
With 21.6% poverty level for males and 23.1% for females among the residents of San Carlos, 12 to 14 year old males and 5 year old females are the most vulnerable to poverty, with 57 males (100.0%) and 35 females (53.8%) in their respective age groups living below the poverty level.
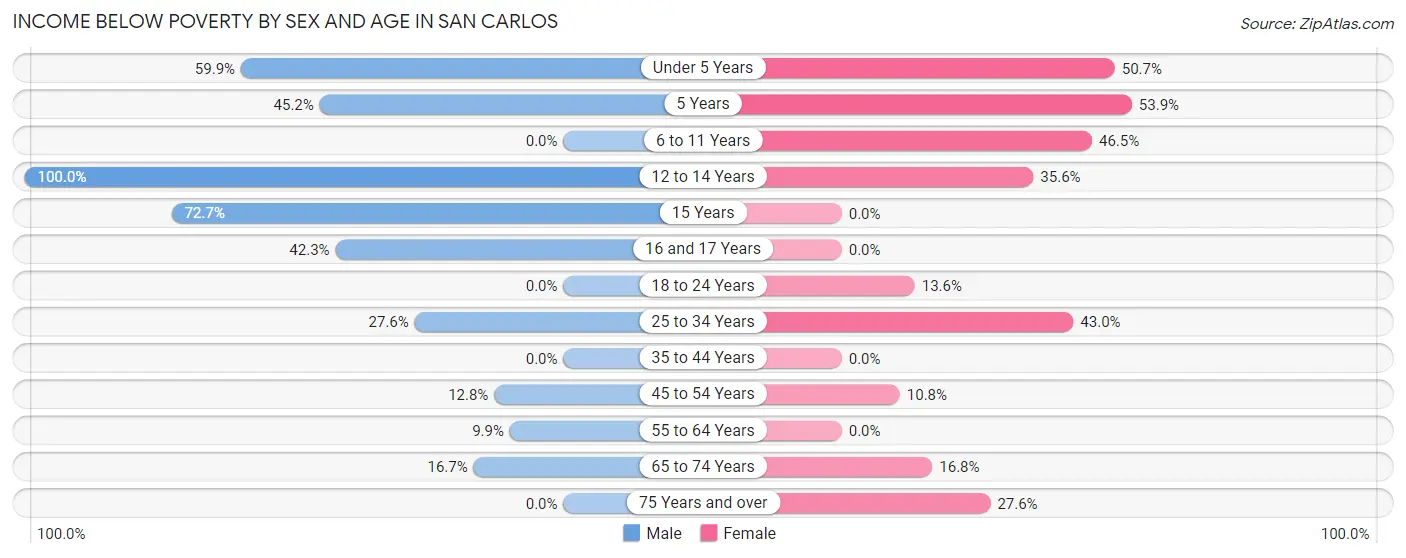
| Age Bracket | Male | Female |
| Under 5 Years | 82 (59.9%) | 37 (50.7%) |
| 5 Years | 57 (45.2%) | 35 (53.8%) |
| 6 to 11 Years | 0 (0.0%) | 85 (46.5%) |
| 12 to 14 Years | 57 (100.0%) | 90 (35.6%) |
| 15 Years | 40 (72.7%) | 0 (0.0%) |
| 16 and 17 Years | 44 (42.3%) | 0 (0.0%) |
| 18 to 24 Years | 0 (0.0%) | 34 (13.6%) |
| 25 to 34 Years | 74 (27.6%) | 135 (43.0%) |
| 35 to 44 Years | 0 (0.0%) | 0 (0.0%) |
| 45 to 54 Years | 42 (12.8%) | 22 (10.8%) |
| 55 to 64 Years | 18 (9.9%) | 0 (0.0%) |
| 65 to 74 Years | 23 (16.7%) | 20 (16.8%) |
| 75 Years and over | 0 (0.0%) | 16 (27.6%) |
| Total | 437 (21.6%) | 474 (23.1%) |
Income Above Poverty by Sex and Age in San Carlos
According to the poverty statistics in San Carlos, males aged 6 to 11 years and females aged 15 years are the age groups that are most secure financially, with 100.0% of males and 100.0% of females in these age groups living above the poverty line.
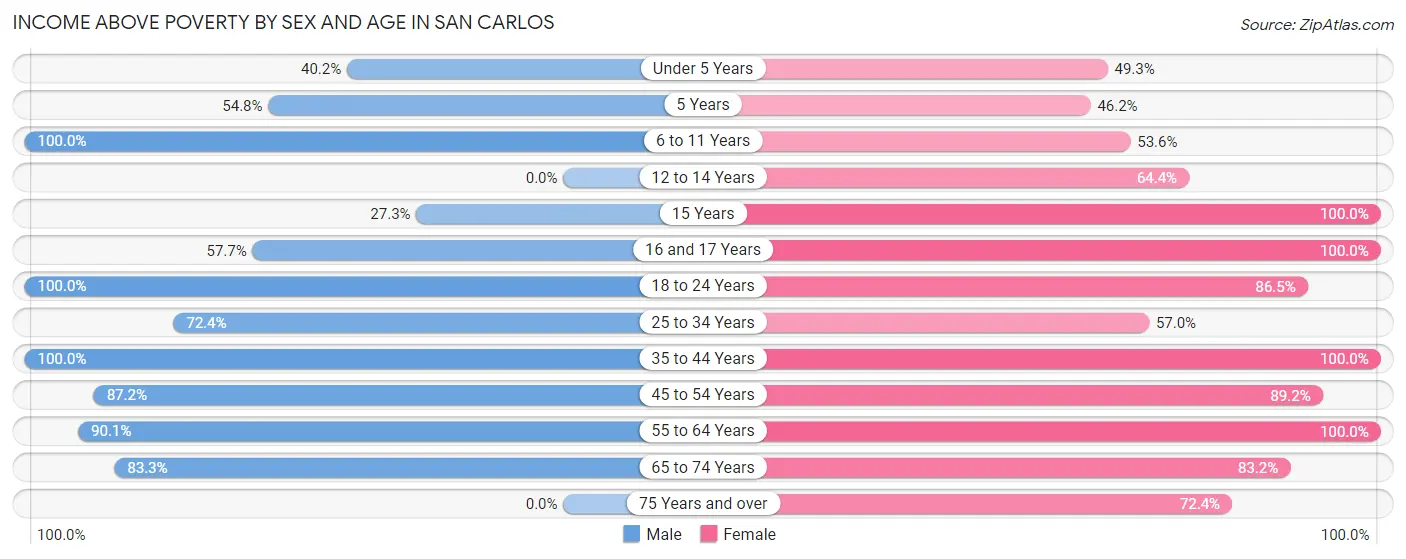
| Age Bracket | Male | Female |
| Under 5 Years | 55 (40.2%) | 36 (49.3%) |
| 5 Years | 69 (54.8%) | 30 (46.2%) |
| 6 to 11 Years | 146 (100.0%) | 98 (53.5%) |
| 12 to 14 Years | 0 (0.0%) | 163 (64.4%) |
| 15 Years | 15 (27.3%) | 48 (100.0%) |
| 16 and 17 Years | 60 (57.7%) | 41 (100.0%) |
| 18 to 24 Years | 227 (100.0%) | 217 (86.5%) |
| 25 to 34 Years | 194 (72.4%) | 179 (57.0%) |
| 35 to 44 Years | 253 (100.0%) | 298 (100.0%) |
| 45 to 54 Years | 285 (87.2%) | 182 (89.2%) |
| 55 to 64 Years | 163 (90.1%) | 143 (100.0%) |
| 65 to 74 Years | 115 (83.3%) | 99 (83.2%) |
| 75 Years and over | 0 (0.0%) | 42 (72.4%) |
| Total | 1,582 (78.4%) | 1,576 (76.9%) |
Income Below Poverty Among Married-Couple Families in San Carlos
The poverty statistics for married-couple families in San Carlos show that 20.0% or 129 of the total 644 families live below the poverty line. Families with 5 or more children have the highest poverty rate of 47.8%, comprising of 32 families. On the other hand, families with no children have the lowest poverty rate of 8.1%, which includes 20 families.
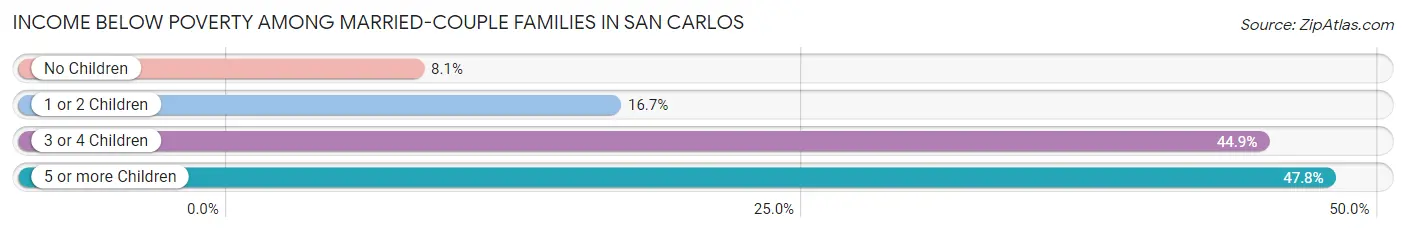
| Children | Above Poverty | Below Poverty |
| No Children | 227 (91.9%) | 20 (8.1%) |
| 1 or 2 Children | 210 (83.3%) | 42 (16.7%) |
| 3 or 4 Children | 43 (55.1%) | 35 (44.9%) |
| 5 or more Children | 35 (52.2%) | 32 (47.8%) |
| Total | 515 (80.0%) | 129 (20.0%) |
Income Below Poverty Among Single-Parent Households in San Carlos
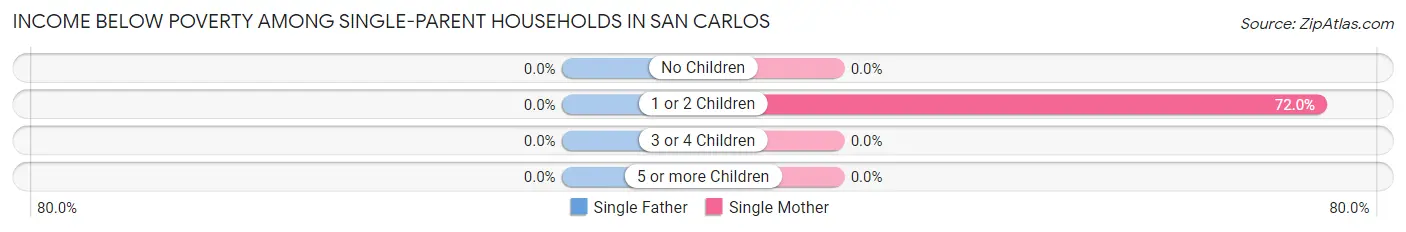
| Children | Single Father | Single Mother |
| No Children | 0 (0.0%) | 0 (0.0%) |
| 1 or 2 Children | 0 (0.0%) | 72 (72.0%) |
| 3 or 4 Children | 0 (0.0%) | 0 (0.0%) |
| 5 or more Children | 0 (0.0%) | 0 (0.0%) |
| Total | 0 (0.0%) | 72 (34.3%) |
Income Below Poverty Among Married-Couple vs Single-Parent Households in San Carlos
The poverty data for San Carlos shows that 129 of the married-couple family households (20.0%) and 72 of the single-parent households (28.7%) are living below the poverty level. Within the married-couple family households, those with 5 or more children have the highest poverty rate, with 32 households (47.8%) falling below the poverty line. Among the single-parent households, those with 1 or 2 children have the highest poverty rate, with 72 household (72.0%) living below poverty.
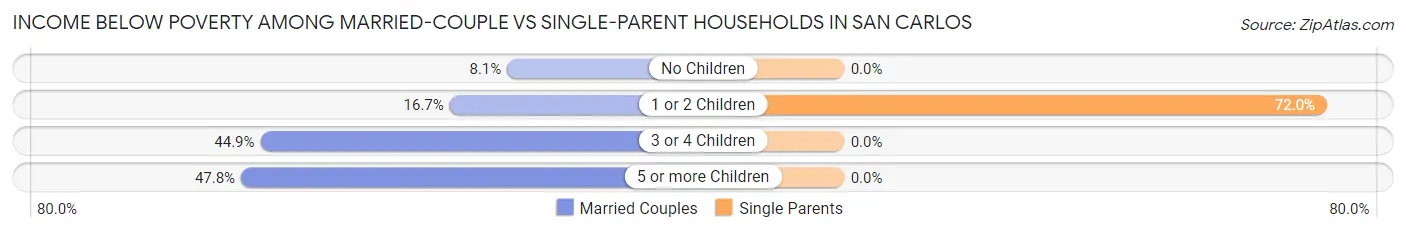
| Children | Married-Couple Families | Single-Parent Households |
| No Children | 20 (8.1%) | 0 (0.0%) |
| 1 or 2 Children | 42 (16.7%) | 72 (72.0%) |
| 3 or 4 Children | 35 (44.9%) | 0 (0.0%) |
| 5 or more Children | 32 (47.8%) | 0 (0.0%) |
| Total | 129 (20.0%) | 72 (28.7%) |
Race in San Carlos
The most populous races in San Carlos are Hispanic or Latino (3,979 | 97.8%), White / Caucasian (2,278 | 56.0%), and Two or more Races (1,619 | 39.8%).
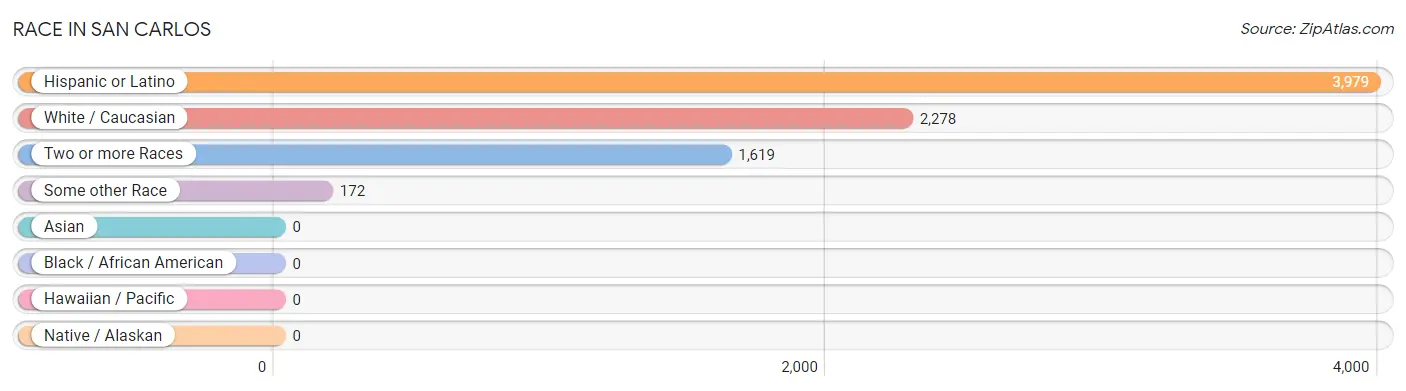
| Race | # Population | % Population |
| Asian | 0 | 0.0% |
| Black / African American | 0 | 0.0% |
| Hawaiian / Pacific | 0 | 0.0% |
| Hispanic or Latino | 3,979 | 97.8% |
| Native / Alaskan | 0 | 0.0% |
| White / Caucasian | 2,278 | 56.0% |
| Two or more Races | 1,619 | 39.8% |
| Some other Race | 172 | 4.2% |
| Total | 4,069 | 100.0% |
Ancestry in San Carlos
The most populous ancestries reported in San Carlos are Mexican (3,450 | 84.8%), Central American (66 | 1.6%), Honduran (34 | 0.8%), and Nicaraguan (32 | 0.8%), together accounting for 88.0% of all San Carlos residents.
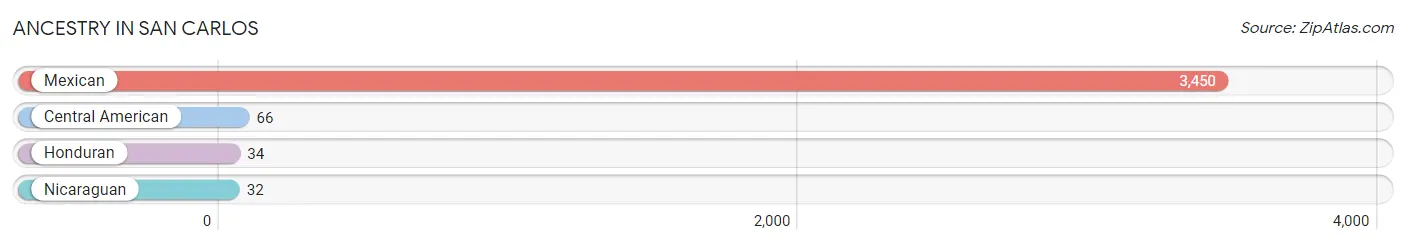
| Ancestry | # Population | % Population |
| Central American | 66 | 1.6% |
| Honduran | 34 | 0.8% |
| Mexican | 3,450 | 84.8% |
| Nicaraguan | 32 | 0.8% | View All 4 Rows |
Immigrants in San Carlos
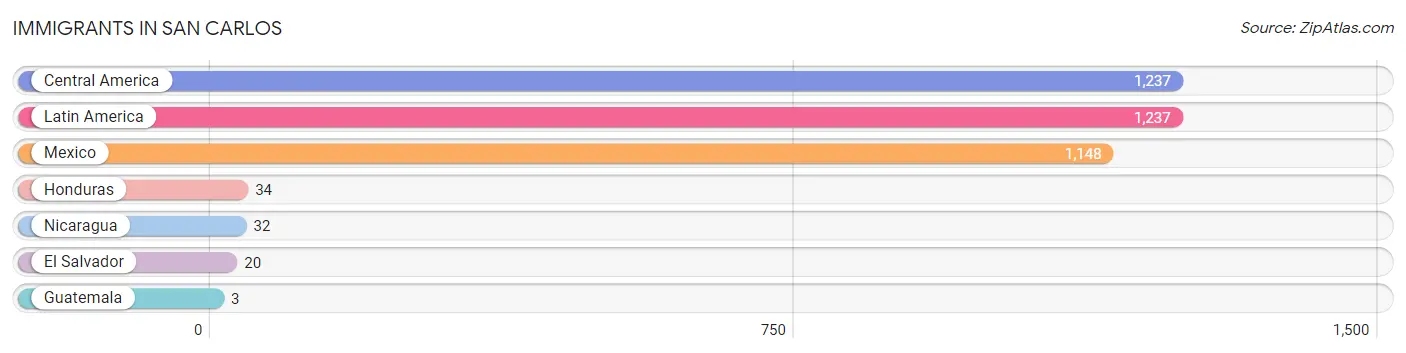
The most numerous immigrant groups reported in San Carlos came from Central America (1,237 | 30.4%), Latin America (1,237 | 30.4%), Mexico (1,148 | 28.2%), Honduras (34 | 0.8%), and Nicaragua (32 | 0.8%), together accounting for 90.6% of all San Carlos residents.
| Immigration Origin | # Population | % Population |
| Central America | 1,237 | 30.4% |
| El Salvador | 20 | 0.5% |
| Guatemala | 3 | 0.1% |
| Honduras | 34 | 0.8% |
| Latin America | 1,237 | 30.4% |
| Mexico | 1,148 | 28.2% |
| Nicaragua | 32 | 0.8% | View All 7 Rows |
Sex and Age in San Carlos
Sex and Age in San Carlos
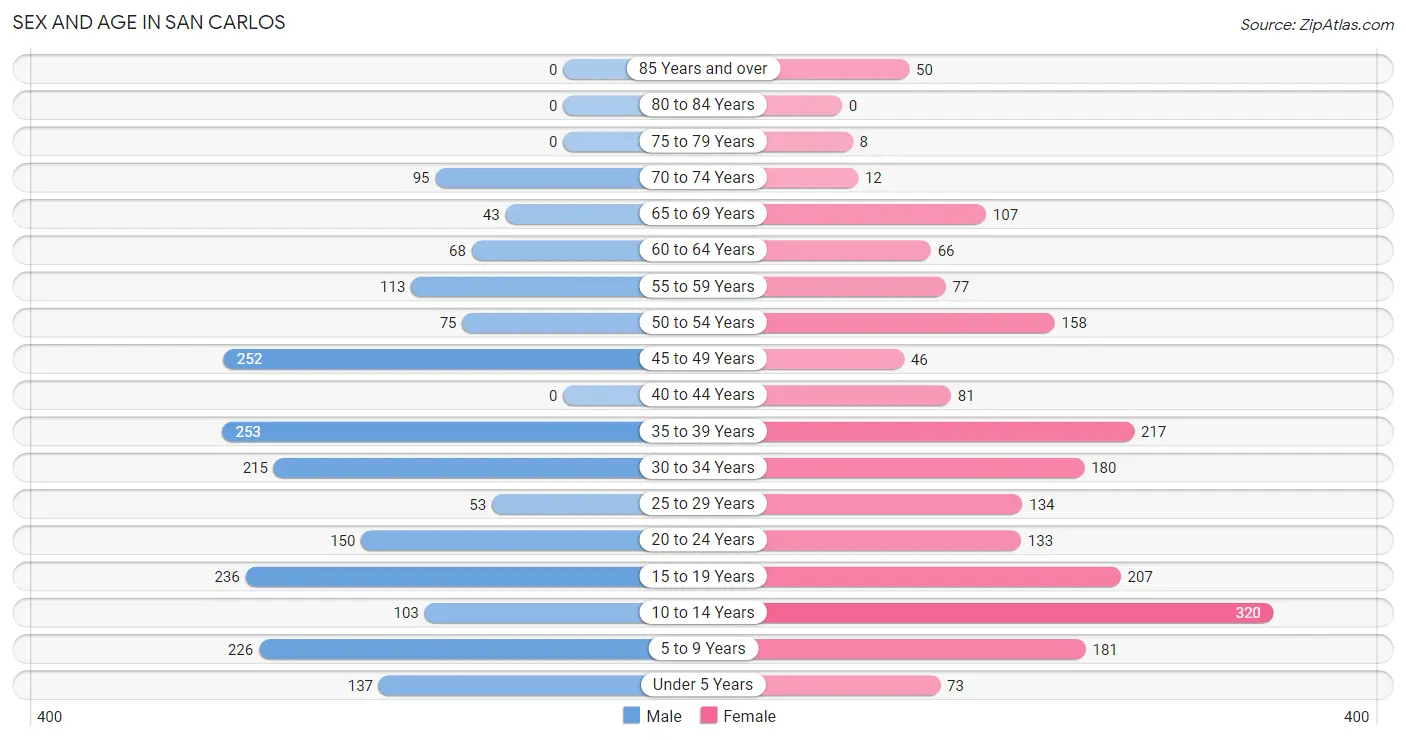
The most populous age groups in San Carlos are 35 to 39 Years (253 | 12.5%) for men and 10 to 14 Years (320 | 15.6%) for women.
| Age Bracket | Male | Female |
| Under 5 Years | 137 (6.8%) | 73 (3.6%) |
| 5 to 9 Years | 226 (11.2%) | 181 (8.8%) |
| 10 to 14 Years | 103 (5.1%) | 320 (15.6%) |
| 15 to 19 Years | 236 (11.7%) | 207 (10.1%) |
| 20 to 24 Years | 150 (7.4%) | 133 (6.5%) |
| 25 to 29 Years | 53 (2.6%) | 134 (6.5%) |
| 30 to 34 Years | 215 (10.6%) | 180 (8.8%) |
| 35 to 39 Years | 253 (12.5%) | 217 (10.6%) |
| 40 to 44 Years | 0 (0.0%) | 81 (4.0%) |
| 45 to 49 Years | 252 (12.5%) | 46 (2.2%) |
| 50 to 54 Years | 75 (3.7%) | 158 (7.7%) |
| 55 to 59 Years | 113 (5.6%) | 77 (3.8%) |
| 60 to 64 Years | 68 (3.4%) | 66 (3.2%) |
| 65 to 69 Years | 43 (2.1%) | 107 (5.2%) |
| 70 to 74 Years | 95 (4.7%) | 12 (0.6%) |
| 75 to 79 Years | 0 (0.0%) | 8 (0.4%) |
| 80 to 84 Years | 0 (0.0%) | 0 (0.0%) |
| 85 Years and over | 0 (0.0%) | 50 (2.4%) |
| Total | 2,019 (100.0%) | 2,050 (100.0%) |
Families and Households in San Carlos
Median Family Size in San Carlos
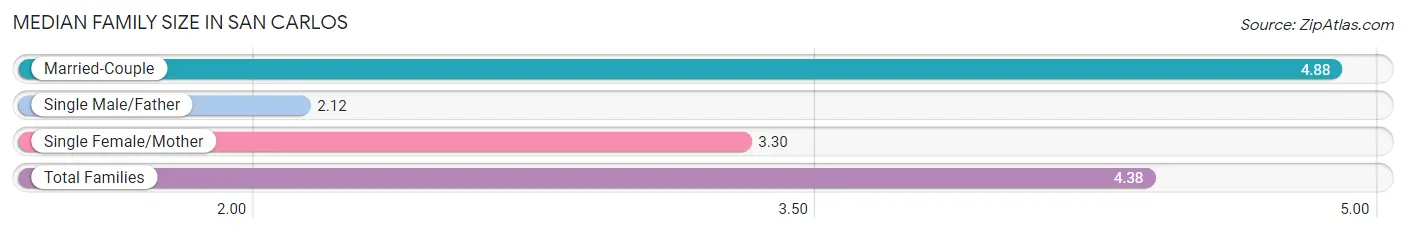
The median family size in San Carlos is 4.38 persons per family, with married-couple families (644 | 72.0%) accounting for the largest median family size of 4.88 persons per family. On the other hand, single male/father families (41 | 4.6%) represent the smallest median family size with 2.12 persons per family.
| Family Type | # Families | Family Size |
| Married-Couple | 644 (72.0%) | 4.88 |
| Single Male/Father | 41 (4.6%) | 2.12 |
| Single Female/Mother | 210 (23.5%) | 3.30 |
| Total Families | 895 (100.0%) | 4.38 |
Median Household Size in San Carlos
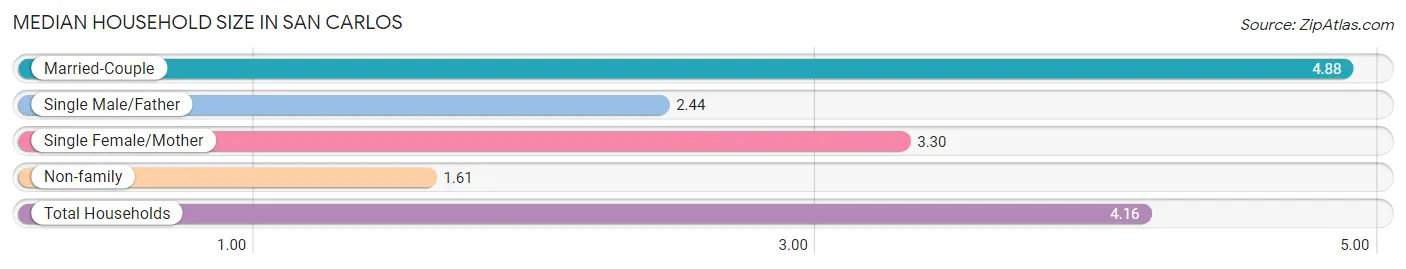
The median household size in San Carlos is 4.16 persons per household, with married-couple households (644 | 65.9%) accounting for the largest median household size of 4.88 persons per household. non-family households (82 | 8.4%) represent the smallest median household size with 1.61 persons per household.
| Household Type | # Households | Household Size |
| Married-Couple | 644 (65.9%) | 4.88 |
| Single Male/Father | 41 (4.2%) | 2.44 |
| Single Female/Mother | 210 (21.5%) | 3.30 |
| Non-family | 82 (8.4%) | 1.61 |
| Total Households | 977 (100.0%) | 4.16 |
Household Size by Marriage Status in San Carlos
Out of a total of 977 households in San Carlos, 895 (91.6%) are family households, while 82 (8.4%) are nonfamily households. The most numerous type of family households are 4-person households, comprising 316, and the most common type of nonfamily households are 2-person households, comprising 50.
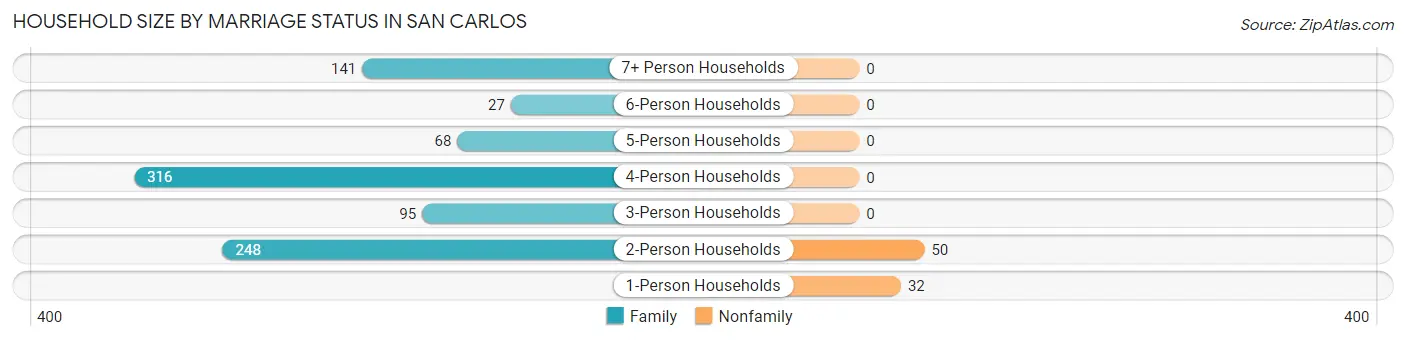
| Household Size | Family Households | Nonfamily Households |
| 1-Person Households | - | 32 (3.3%) |
| 2-Person Households | 248 (25.4%) | 50 (5.1%) |
| 3-Person Households | 95 (9.7%) | 0 (0.0%) |
| 4-Person Households | 316 (32.3%) | 0 (0.0%) |
| 5-Person Households | 68 (7.0%) | 0 (0.0%) |
| 6-Person Households | 27 (2.8%) | 0 (0.0%) |
| 7+ Person Households | 141 (14.4%) | 0 (0.0%) |
| Total | 895 (91.6%) | 82 (8.4%) |
Female Fertility in San Carlos
Fertility by Age in San Carlos
| Age Bracket | Women with Births | Births / 1,000 Women |
| 15 to 19 years | 0 (0.0%) | 0.0 |
| 20 to 34 years | 0 (0.0%) | 0.0 |
| 35 to 50 years | 0 (0.0%) | 0.0 |
| Total | 0 (0.0%) | 0.0 |
Fertility by Age by Marriage Status in San Carlos
| Age Bracket | Married | Unmarried |
| 15 to 19 years | 0 (0.0%) | 0 (0.0%) |
| 20 to 34 years | 0 (0.0%) | 0 (0.0%) |
| 35 to 50 years | 0 (0.0%) | 0 (0.0%) |
| Total | 0 (0.0%) | 0 (0.0%) |
Fertility by Education in San Carlos
| Educational Attainment | Women with Births | Births / 1,000 Women |
| Less than High School | 0 (0.0%) | 0.0 |
| High School Diploma | 0 (0.0%) | 0.0 |
| College or Associate's Degree | 0 (0.0%) | 0.0 |
| Bachelor's Degree | 0 (0.0%) | 0.0 |
| Graduate Degree | 0 (0.0%) | 0.0 |
| Total | 0 (0.0%) | 0.0 |
Fertility by Education by Marriage Status in San Carlos
| Educational Attainment | Married | Unmarried |
| Less than High School | 0 (0.0%) | 0 (0.0%) |
| High School Diploma | 0 (0.0%) | 0 (0.0%) |
| College or Associate's Degree | 0 (0.0%) | 0 (0.0%) |
| Bachelor's Degree | 0 (0.0%) | 0 (0.0%) |
| Graduate Degree | 0 (0.0%) | 0 (0.0%) |
| Total | 0 (0.0%) | 0 (0.0%) |
Employment Characteristics in San Carlos
Employment by Class of Employer in San Carlos
Among the 1,301 employed individuals in San Carlos, private company employees (780 | 60.0%), self-employed (not incorporated) (400 | 30.7%), and local government employees (59 | 4.5%) make up the most common classes of employment.
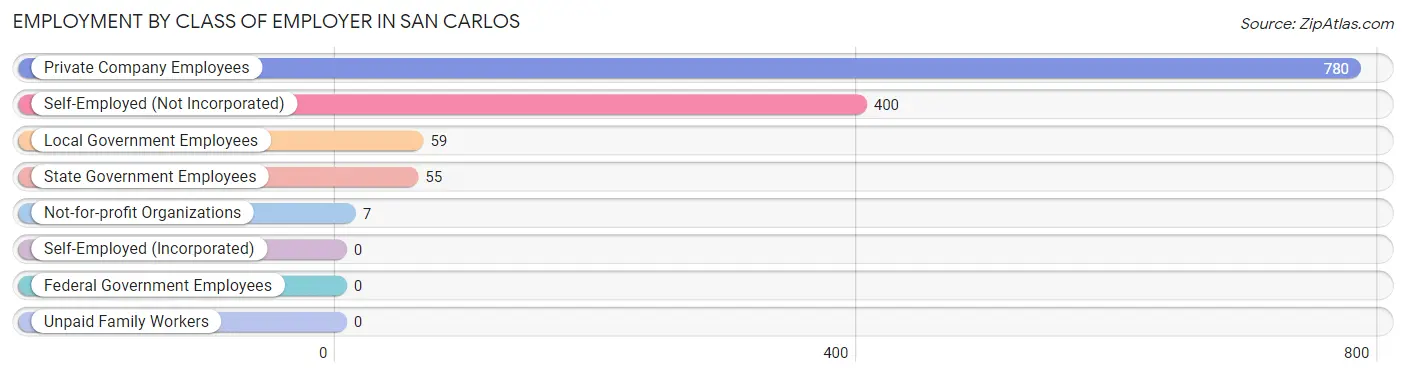
| Employer Class | # Employees | % Employees |
| Private Company Employees | 780 | 60.0% |
| Self-Employed (Incorporated) | 0 | 0.0% |
| Self-Employed (Not Incorporated) | 400 | 30.7% |
| Not-for-profit Organizations | 7 | 0.5% |
| Local Government Employees | 59 | 4.5% |
| State Government Employees | 55 | 4.2% |
| Federal Government Employees | 0 | 0.0% |
| Unpaid Family Workers | 0 | 0.0% |
| Total | 1,301 | 100.0% |
Employment Status by Age in San Carlos
According to the labor force statistics for San Carlos, out of the total population over 16 years of age (2,926), 56.6% or 1,656 individuals are in the labor force, with 17.7% or 293 of them unemployed. The age group with the highest labor force participation rate is 55 to 59 years, with 95.3% or 181 individuals in the labor force. Within the labor force, the 35 to 44 years age range has the highest percentage of unemployed individuals, with 40.2% or 137 of them being unemployed.
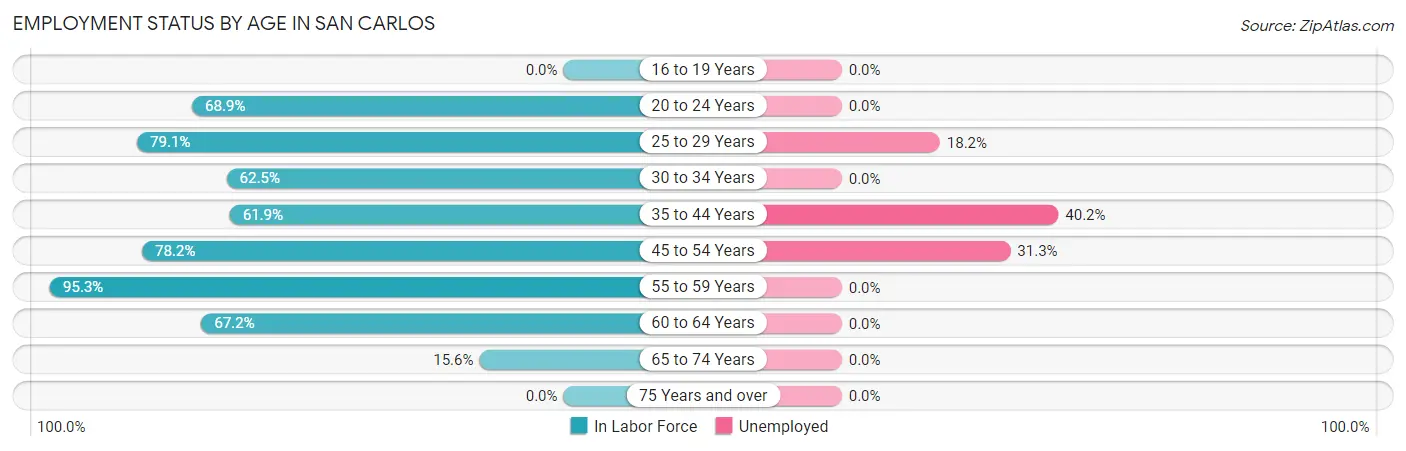
| Age Bracket | In Labor Force | Unemployed |
| 16 to 19 Years | 0 (0.0%) | 0 (0.0%) |
| 20 to 24 Years | 195 (68.9%) | 0 (0.0%) |
| 25 to 29 Years | 148 (79.1%) | 27 (18.2%) |
| 30 to 34 Years | 247 (62.5%) | 0 (0.0%) |
| 35 to 44 Years | 341 (61.9%) | 137 (40.2%) |
| 45 to 54 Years | 415 (78.2%) | 130 (31.3%) |
| 55 to 59 Years | 181 (95.3%) | 0 (0.0%) |
| 60 to 64 Years | 90 (67.2%) | 0 (0.0%) |
| 65 to 74 Years | 40 (15.6%) | 0 (0.0%) |
| 75 Years and over | 0 (0.0%) | 0 (0.0%) |
| Total | 1,656 (56.6%) | 293 (17.7%) |
Employment Status by Educational Attainment in San Carlos
According to labor force statistics for San Carlos, 71.5% of individuals (1,421) out of the total population between 25 and 64 years of age (1,988) are in the labor force, with 20.7% or 294 of them being unemployed. The group with the highest labor force participation rate are those with the educational attainment of college / associate degree, with 83.5% or 279 individuals in the labor force. Within the labor force, individuals with high school diploma education have the highest percentage of unemployment, with 58.6% or 259 of them being unemployed.
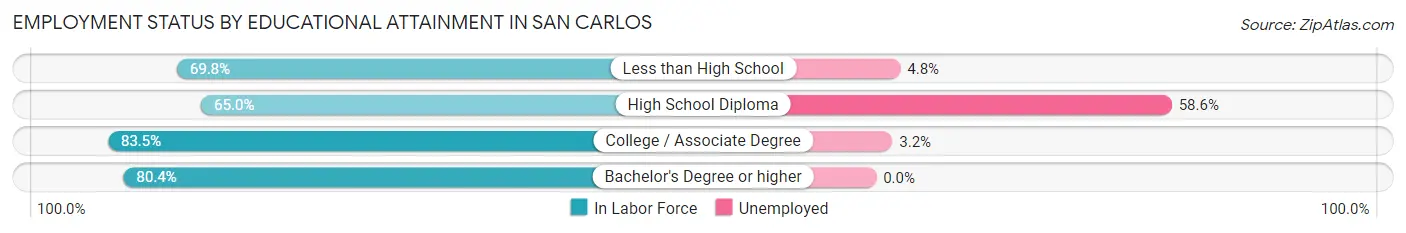
| Educational Attainment | In Labor Force | Unemployed |
| Less than High School | 541 (69.8%) | 37 (4.8%) |
| High School Diploma | 442 (65.0%) | 398 (58.6%) |
| College / Associate Degree | 279 (83.5%) | 11 (3.2%) |
| Bachelor's Degree or higher | 160 (80.4%) | 0 (0.0%) |
| Total | 1,421 (71.5%) | 412 (20.7%) |
Employment Occupations by Sex in San Carlos
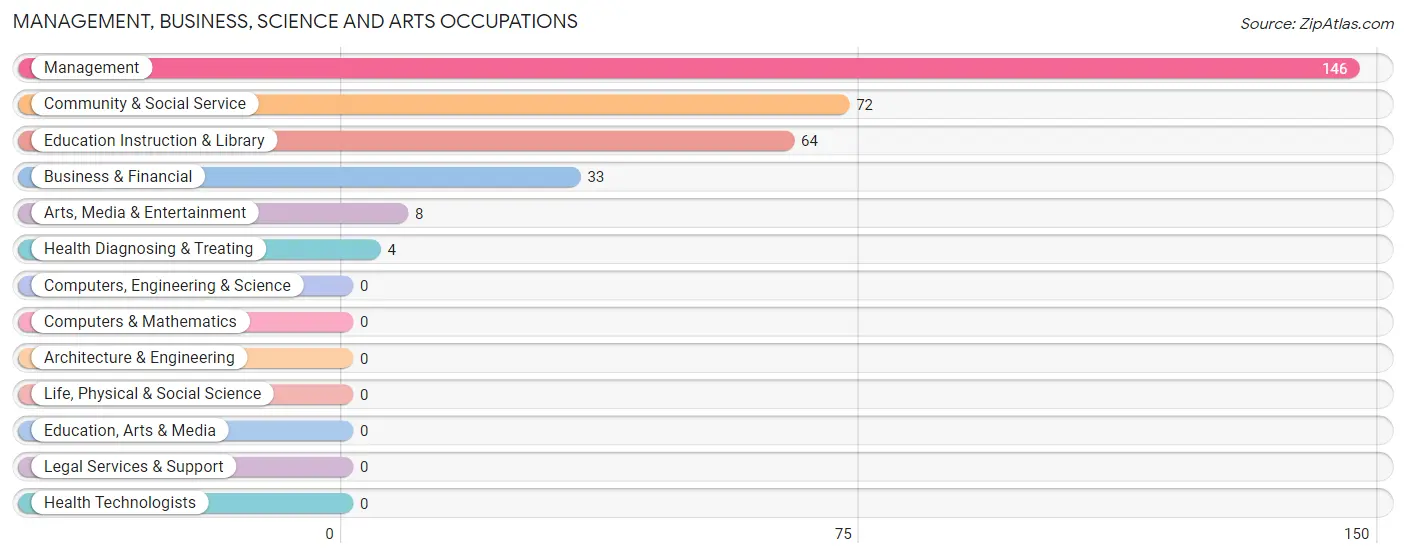
Management, Business, Science and Arts Occupations
The most common Management, Business, Science and Arts occupations in San Carlos are Management (146 | 10.7%), Community & Social Service (72 | 5.3%), Education Instruction & Library (64 | 4.7%), Business & Financial (33 | 2.4%), and Arts, Media & Entertainment (8 | 0.6%).
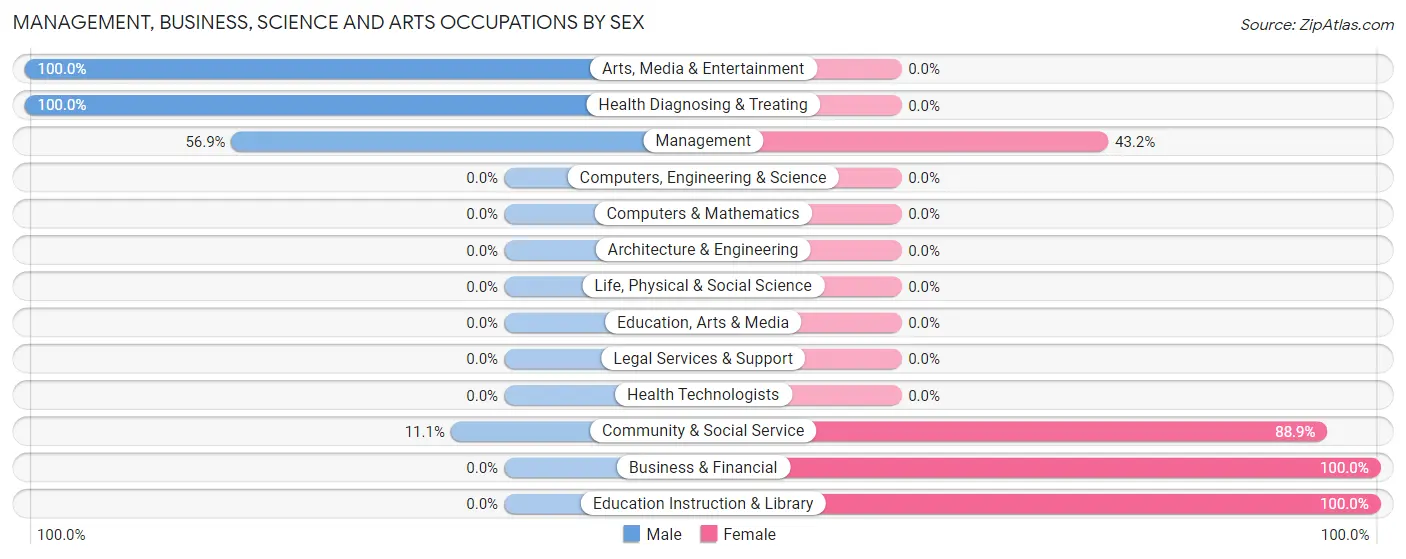
Management, Business, Science and Arts Occupations by Sex
Within the Management, Business, Science and Arts occupations in San Carlos, the most male-oriented occupations are Arts, Media & Entertainment (100.0%), Health Diagnosing & Treating (100.0%), and Management (56.9%), while the most female-oriented occupations are Business & Financial (100.0%), Education Instruction & Library (100.0%), and Community & Social Service (88.9%).
| Occupation | Male | Female |
| Management | 83 (56.9%) | 63 (43.1%) |
| Business & Financial | 0 (0.0%) | 33 (100.0%) |
| Computers, Engineering & Science | 0 (0.0%) | 0 (0.0%) |
| Computers & Mathematics | 0 (0.0%) | 0 (0.0%) |
| Architecture & Engineering | 0 (0.0%) | 0 (0.0%) |
| Life, Physical & Social Science | 0 (0.0%) | 0 (0.0%) |
| Community & Social Service | 8 (11.1%) | 64 (88.9%) |
| Education, Arts & Media | 0 (0.0%) | 0 (0.0%) |
| Legal Services & Support | 0 (0.0%) | 0 (0.0%) |
| Education Instruction & Library | 0 (0.0%) | 64 (100.0%) |
| Arts, Media & Entertainment | 8 (100.0%) | 0 (0.0%) |
| Health Diagnosing & Treating | 4 (100.0%) | 0 (0.0%) |
| Health Technologists | 0 (0.0%) | 0 (0.0%) |
| Total (Category) | 95 (37.2%) | 160 (62.7%) |
| Total (Overall) | 879 (64.5%) | 484 (35.5%) |
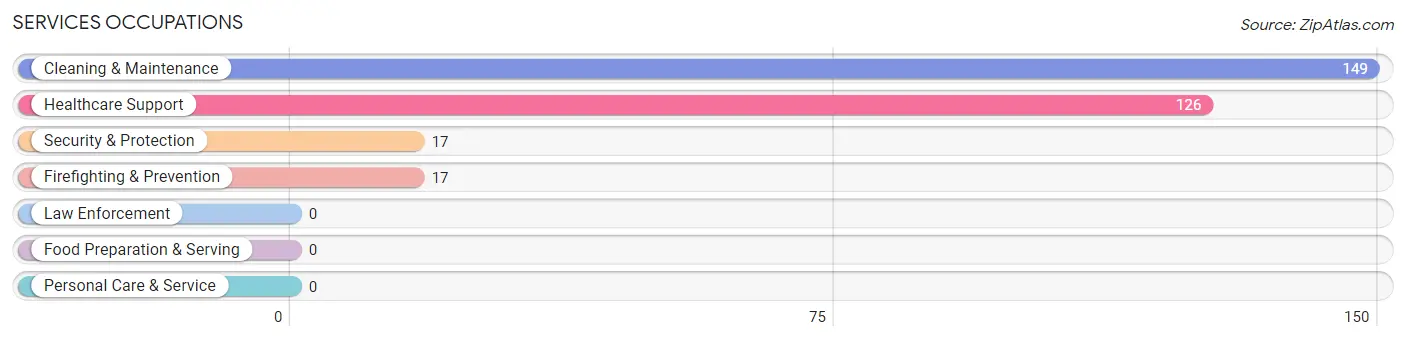
Services Occupations
The most common Services occupations in San Carlos are Cleaning & Maintenance (149 | 10.9%), Healthcare Support (126 | 9.2%), Security & Protection (17 | 1.3%), and Firefighting & Prevention (17 | 1.3%).
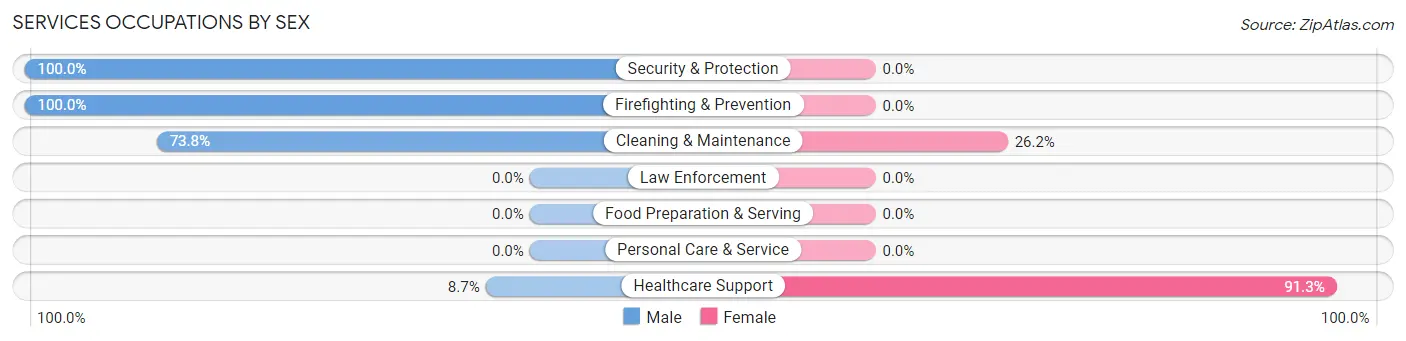
Services Occupations by Sex
Within the Services occupations in San Carlos, the most male-oriented occupations are Security & Protection (100.0%), Firefighting & Prevention (100.0%), and Cleaning & Maintenance (73.8%), while the most female-oriented occupations are Healthcare Support (91.3%), and Cleaning & Maintenance (26.2%).
| Occupation | Male | Female |
| Healthcare Support | 11 (8.7%) | 115 (91.3%) |
| Security & Protection | 17 (100.0%) | 0 (0.0%) |
| Firefighting & Prevention | 17 (100.0%) | 0 (0.0%) |
| Law Enforcement | 0 (0.0%) | 0 (0.0%) |
| Food Preparation & Serving | 0 (0.0%) | 0 (0.0%) |
| Cleaning & Maintenance | 110 (73.8%) | 39 (26.2%) |
| Personal Care & Service | 0 (0.0%) | 0 (0.0%) |
| Total (Category) | 138 (47.3%) | 154 (52.7%) |
| Total (Overall) | 879 (64.5%) | 484 (35.5%) |
Sales and Office Occupations
The most common Sales and Office occupations in San Carlos are Sales & Related (173 | 12.7%), and Office & Administration (101 | 7.4%).
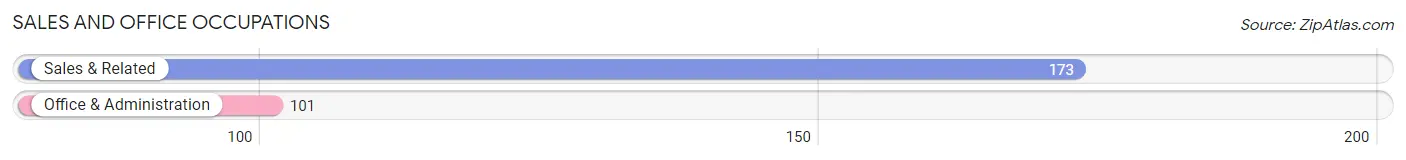
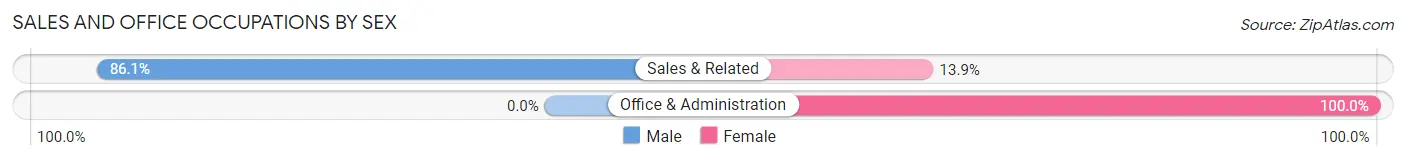
Sales and Office Occupations by Sex
| Occupation | Male | Female |
| Sales & Related | 149 (86.1%) | 24 (13.9%) |
| Office & Administration | 0 (0.0%) | 101 (100.0%) |
| Total (Category) | 149 (54.4%) | 125 (45.6%) |
| Total (Overall) | 879 (64.5%) | 484 (35.5%) |
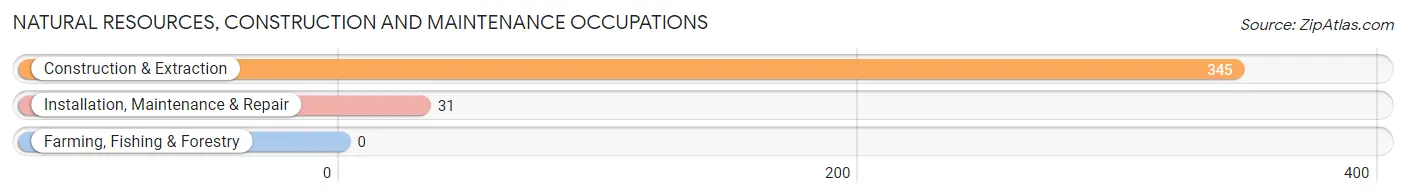
Natural Resources, Construction and Maintenance Occupations
The most common Natural Resources, Construction and Maintenance occupations in San Carlos are Construction & Extraction (345 | 25.3%), and Installation, Maintenance & Repair (31 | 2.3%).
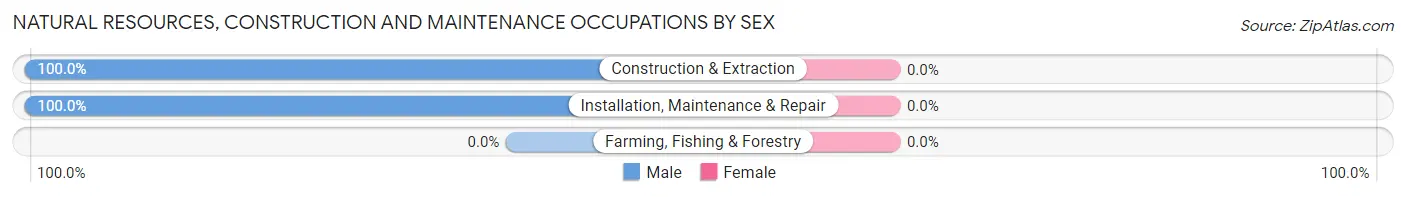
Natural Resources, Construction and Maintenance Occupations by Sex
| Occupation | Male | Female |
| Farming, Fishing & Forestry | 0 (0.0%) | 0 (0.0%) |
| Construction & Extraction | 345 (100.0%) | 0 (0.0%) |
| Installation, Maintenance & Repair | 31 (100.0%) | 0 (0.0%) |
| Total (Category) | 376 (100.0%) | 0 (0.0%) |
| Total (Overall) | 879 (64.5%) | 484 (35.5%) |
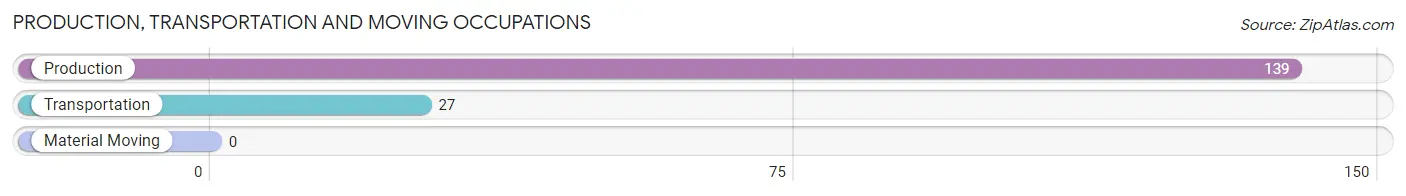
Production, Transportation and Moving Occupations
The most common Production, Transportation and Moving occupations in San Carlos are Production (139 | 10.2%), and Transportation (27 | 2.0%).
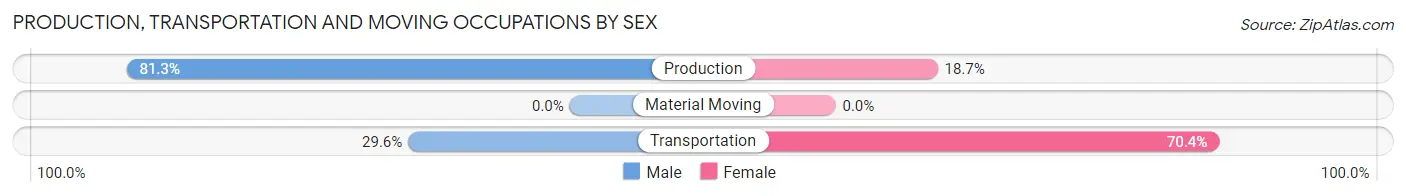
Production, Transportation and Moving Occupations by Sex
| Occupation | Male | Female |
| Production | 113 (81.3%) | 26 (18.7%) |
| Transportation | 8 (29.6%) | 19 (70.4%) |
| Material Moving | 0 (0.0%) | 0 (0.0%) |
| Total (Category) | 121 (72.9%) | 45 (27.1%) |
| Total (Overall) | 879 (64.5%) | 484 (35.5%) |
Employment Industries by Sex in San Carlos
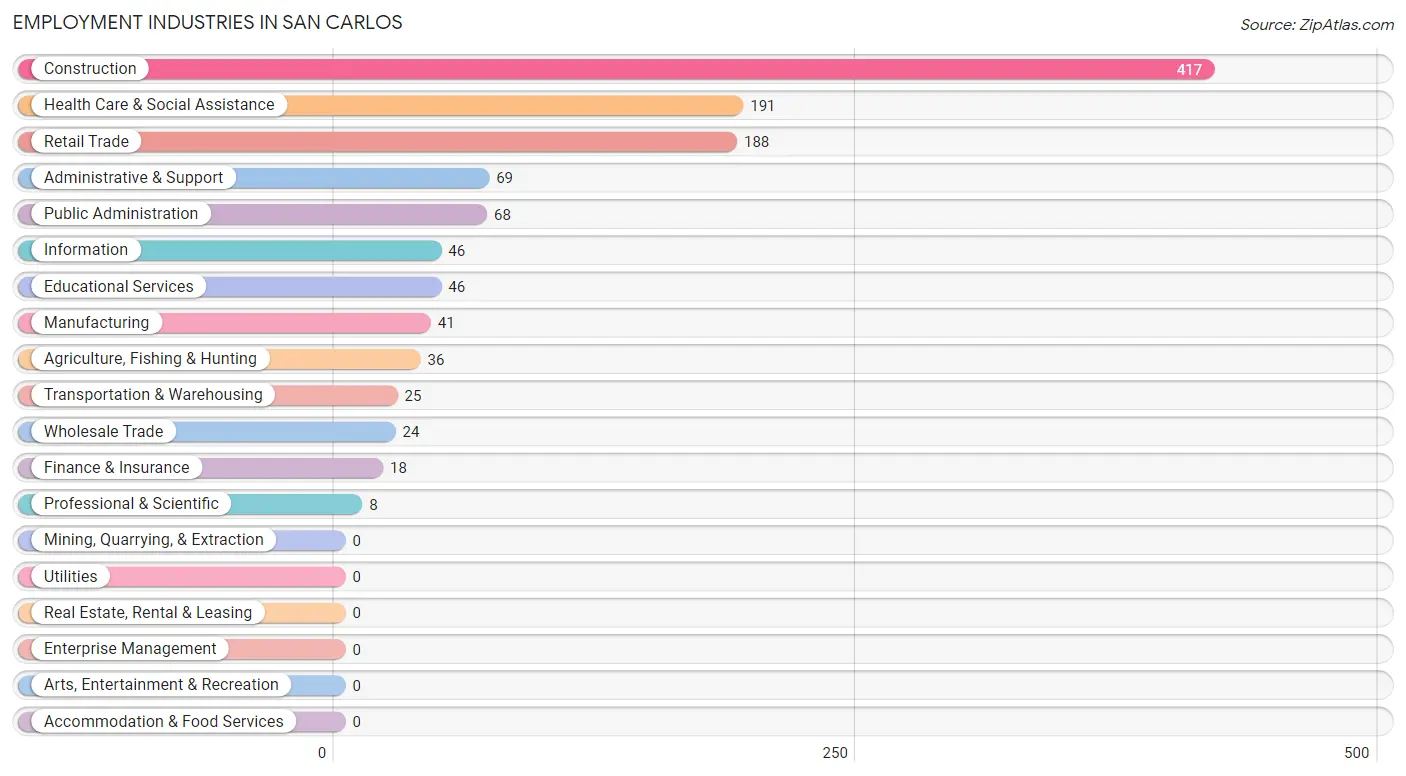
Employment Industries in San Carlos
The major employment industries in San Carlos include Construction (417 | 30.6%), Health Care & Social Assistance (191 | 14.0%), Retail Trade (188 | 13.8%), Administrative & Support (69 | 5.1%), and Public Administration (68 | 5.0%).
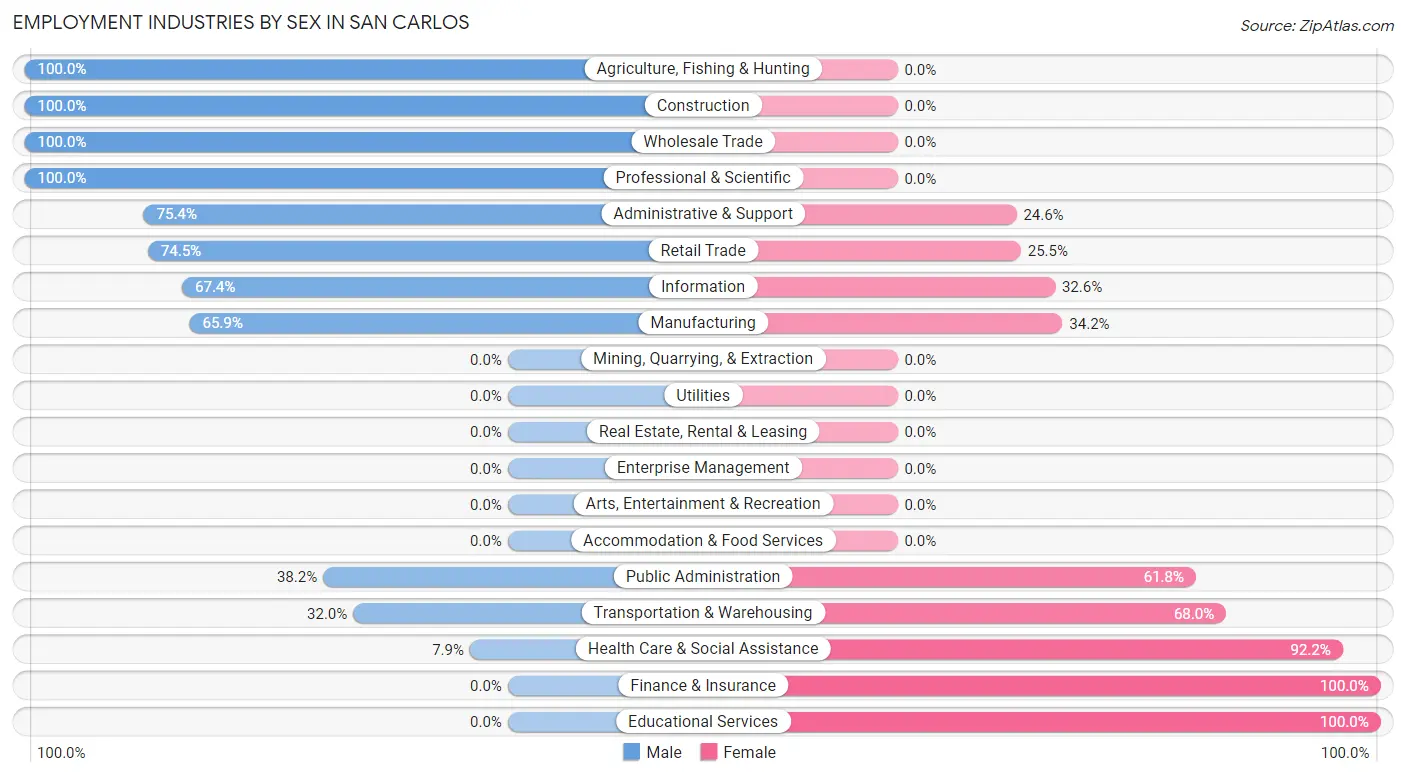
Employment Industries by Sex in San Carlos
The San Carlos industries that see more men than women are Agriculture, Fishing & Hunting (100.0%), Construction (100.0%), and Wholesale Trade (100.0%), whereas the industries that tend to have a higher number of women are Finance & Insurance (100.0%), Educational Services (100.0%), and Health Care & Social Assistance (92.1%).
| Industry | Male | Female |
| Agriculture, Fishing & Hunting | 36 (100.0%) | 0 (0.0%) |
| Mining, Quarrying, & Extraction | 0 (0.0%) | 0 (0.0%) |
| Construction | 417 (100.0%) | 0 (0.0%) |
| Manufacturing | 27 (65.8%) | 14 (34.2%) |
| Wholesale Trade | 24 (100.0%) | 0 (0.0%) |
| Retail Trade | 140 (74.5%) | 48 (25.5%) |
| Transportation & Warehousing | 8 (32.0%) | 17 (68.0%) |
| Utilities | 0 (0.0%) | 0 (0.0%) |
| Information | 31 (67.4%) | 15 (32.6%) |
| Finance & Insurance | 0 (0.0%) | 18 (100.0%) |
| Real Estate, Rental & Leasing | 0 (0.0%) | 0 (0.0%) |
| Professional & Scientific | 8 (100.0%) | 0 (0.0%) |
| Enterprise Management | 0 (0.0%) | 0 (0.0%) |
| Administrative & Support | 52 (75.4%) | 17 (24.6%) |
| Educational Services | 0 (0.0%) | 46 (100.0%) |
| Health Care & Social Assistance | 15 (7.9%) | 176 (92.1%) |
| Arts, Entertainment & Recreation | 0 (0.0%) | 0 (0.0%) |
| Accommodation & Food Services | 0 (0.0%) | 0 (0.0%) |
| Public Administration | 26 (38.2%) | 42 (61.8%) |
| Total | 879 (64.5%) | 484 (35.5%) |
Education in San Carlos
School Enrollment in San Carlos
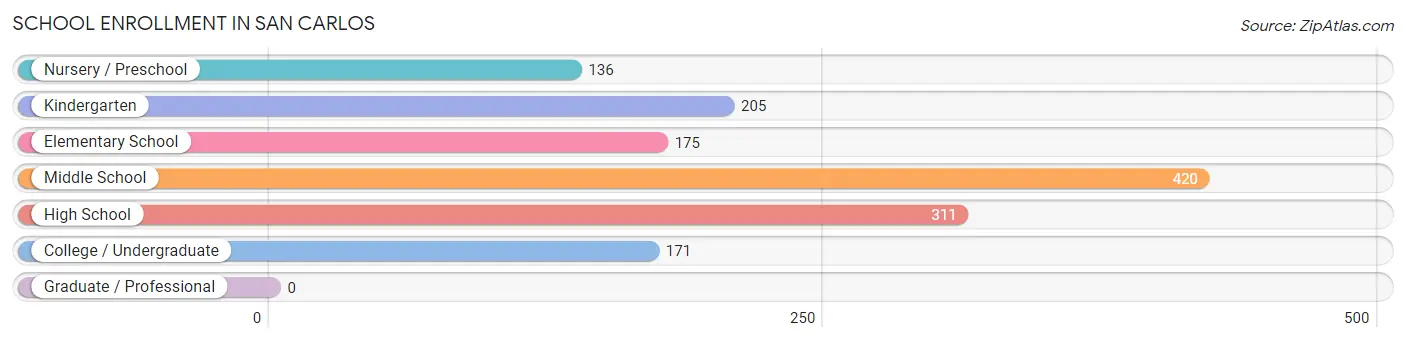
The most common levels of schooling among the 1,418 students in San Carlos are middle school (420 | 29.6%), high school (311 | 21.9%), and kindergarten (205 | 14.5%).
| School Level | # Students | % Students |
| Nursery / Preschool | 136 | 9.6% |
| Kindergarten | 205 | 14.5% |
| Elementary School | 175 | 12.3% |
| Middle School | 420 | 29.6% |
| High School | 311 | 21.9% |
| College / Undergraduate | 171 | 12.1% |
| Graduate / Professional | 0 | 0.0% |
| Total | 1,418 | 100.0% |
School Enrollment by Age by Funding Source in San Carlos
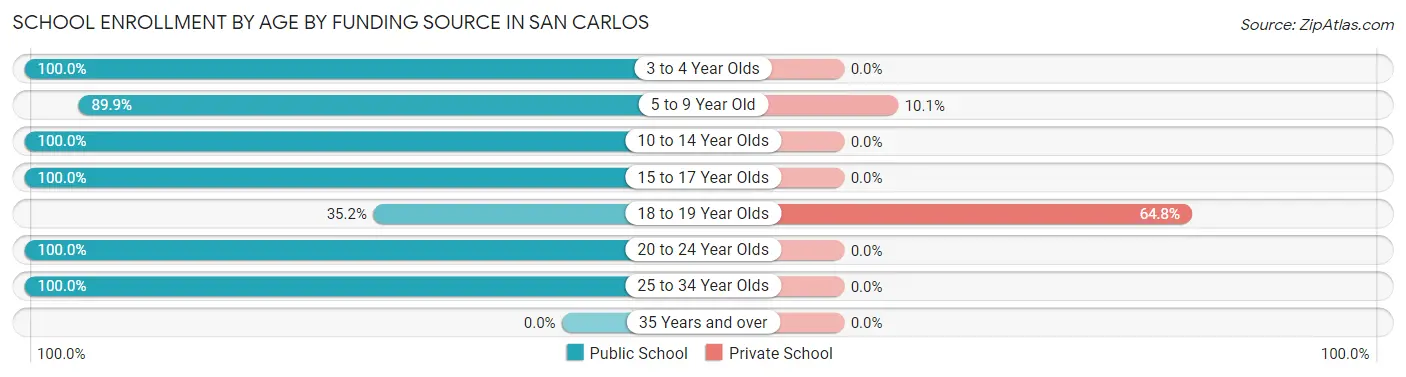
Out of a total of 1,418 students who are enrolled in schools in San Carlos, 159 (11.2%) attend a private institution, while the remaining 1,259 (88.8%) are enrolled in public schools. The age group of 18 to 19 year olds has the highest likelihood of being enrolled in private schools, with 118 (64.8% in the age bracket) enrolled. Conversely, the age group of 3 to 4 year olds has the lowest likelihood of being enrolled in a private school, with 101 (100.0% in the age bracket) attending a public institution.
| Age Bracket | Public School | Private School |
| 3 to 4 Year Olds | 101 (100.0%) | 0 (0.0%) |
| 5 to 9 Year Old | 366 (89.9%) | 41 (10.1%) |
| 10 to 14 Year Olds | 423 (100.0%) | 0 (0.0%) |
| 15 to 17 Year Olds | 248 (100.0%) | 0 (0.0%) |
| 18 to 19 Year Olds | 64 (35.2%) | 118 (64.8%) |
| 20 to 24 Year Olds | 53 (100.0%) | 0 (0.0%) |
| 25 to 34 Year Olds | 4 (100.0%) | 0 (0.0%) |
| 35 Years and over | 0 (0.0%) | 0 (0.0%) |
| Total | 1,259 (88.8%) | 159 (11.2%) |
Educational Attainment by Field of Study in San Carlos
Science & technology (102 | 51.3%), education (48 | 24.1%), social sciences (34 | 17.1%), and visual & performing arts (15 | 7.5%) are the most common fields of study among 199 individuals in San Carlos who have obtained a bachelor's degree or higher.
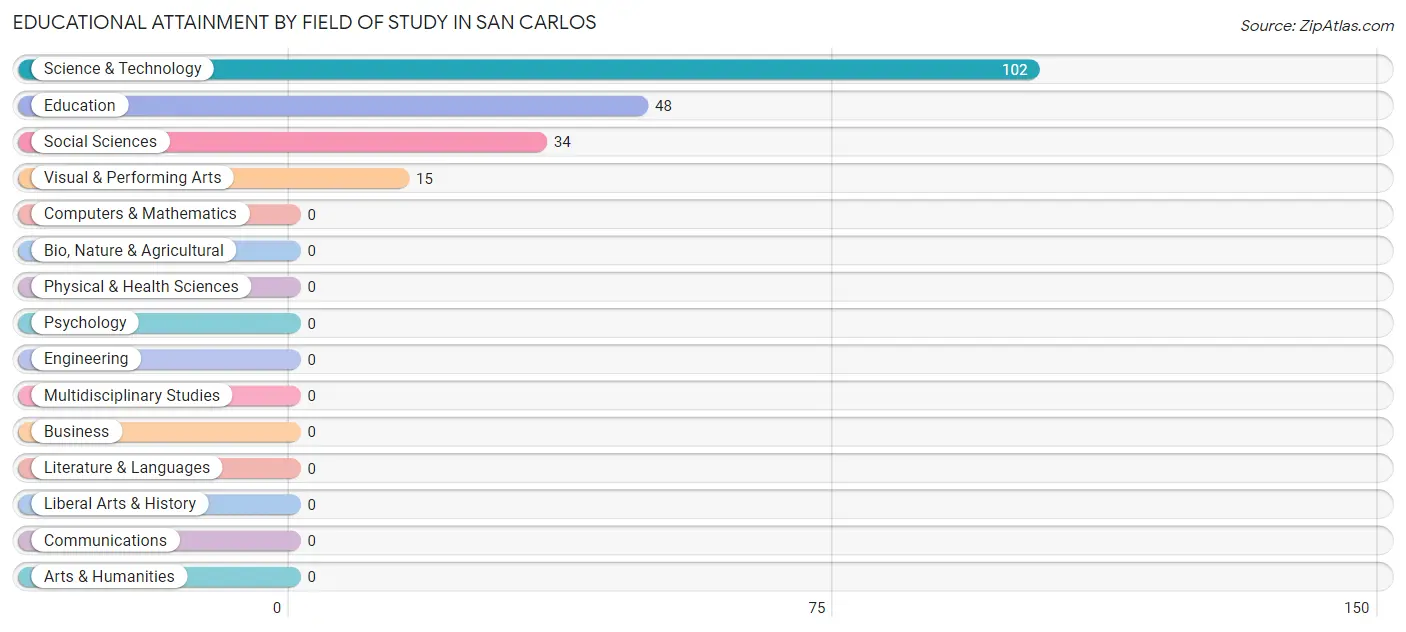
| Field of Study | # Graduates | % Graduates |
| Computers & Mathematics | 0 | 0.0% |
| Bio, Nature & Agricultural | 0 | 0.0% |
| Physical & Health Sciences | 0 | 0.0% |
| Psychology | 0 | 0.0% |
| Social Sciences | 34 | 17.1% |
| Engineering | 0 | 0.0% |
| Multidisciplinary Studies | 0 | 0.0% |
| Science & Technology | 102 | 51.3% |
| Business | 0 | 0.0% |
| Education | 48 | 24.1% |
| Literature & Languages | 0 | 0.0% |
| Liberal Arts & History | 0 | 0.0% |
| Visual & Performing Arts | 15 | 7.5% |
| Communications | 0 | 0.0% |
| Arts & Humanities | 0 | 0.0% |
| Total | 199 | 100.0% |
Transportation & Commute in San Carlos
Vehicle Availability by Sex in San Carlos
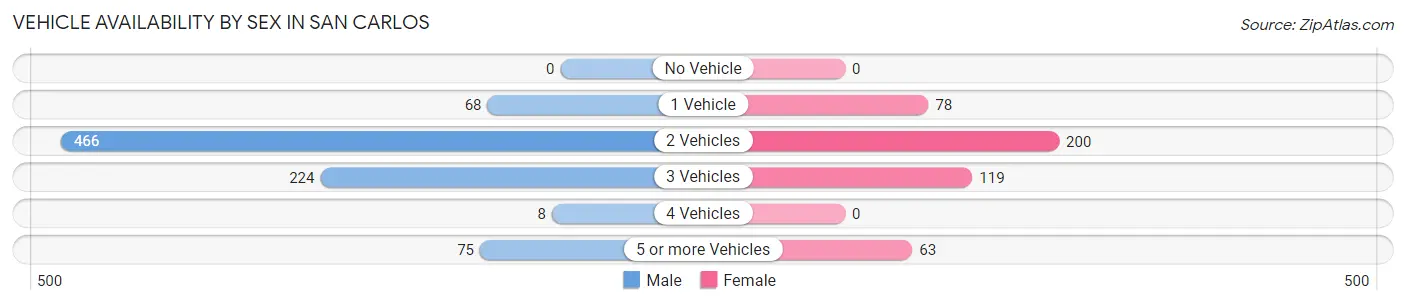
The most prevalent vehicle ownership categories in San Carlos are males with 2 vehicles (466, accounting for 55.4%) and females with 2 vehicles (200, making up 101.3%).
| Vehicles Available | Male | Female |
| No Vehicle | 0 (0.0%) | 0 (0.0%) |
| 1 Vehicle | 68 (8.1%) | 78 (17.0%) |
| 2 Vehicles | 466 (55.4%) | 200 (43.5%) |
| 3 Vehicles | 224 (26.6%) | 119 (25.9%) |
| 4 Vehicles | 8 (0.9%) | 0 (0.0%) |
| 5 or more Vehicles | 75 (8.9%) | 63 (13.7%) |
| Total | 841 (100.0%) | 460 (100.0%) |
Commute Time in San Carlos
The most frequently occuring commute durations in San Carlos are 15 to 19 minutes (296 commuters, 29.4%), 10 to 14 minutes (235 commuters, 23.3%), and 30 to 34 minutes (156 commuters, 15.5%).
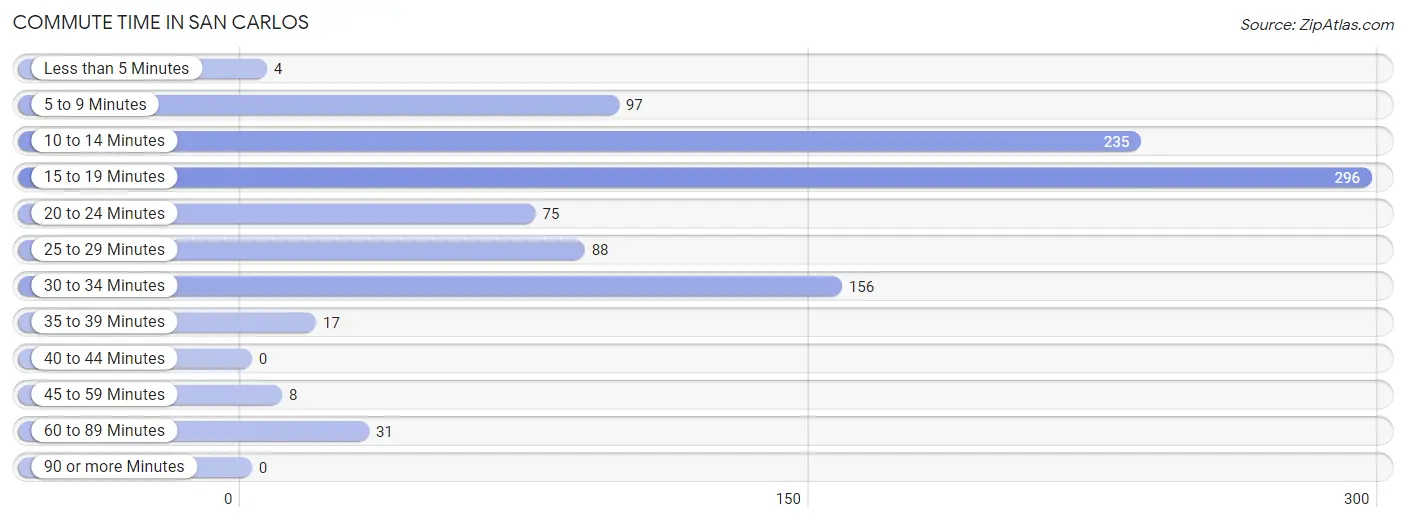
| Commute Time | # Commuters | % Commuters |
| Less than 5 Minutes | 4 | 0.4% |
| 5 to 9 Minutes | 97 | 9.6% |
| 10 to 14 Minutes | 235 | 23.3% |
| 15 to 19 Minutes | 296 | 29.4% |
| 20 to 24 Minutes | 75 | 7.4% |
| 25 to 29 Minutes | 88 | 8.7% |
| 30 to 34 Minutes | 156 | 15.5% |
| 35 to 39 Minutes | 17 | 1.7% |
| 40 to 44 Minutes | 0 | 0.0% |
| 45 to 59 Minutes | 8 | 0.8% |
| 60 to 89 Minutes | 31 | 3.1% |
| 90 or more Minutes | 0 | 0.0% |
Commute Time by Sex in San Carlos
The most common commute times in San Carlos are 10 to 14 minutes (165 commuters, 26.3%) for males and 15 to 19 minutes (143 commuters, 37.6%) for females.
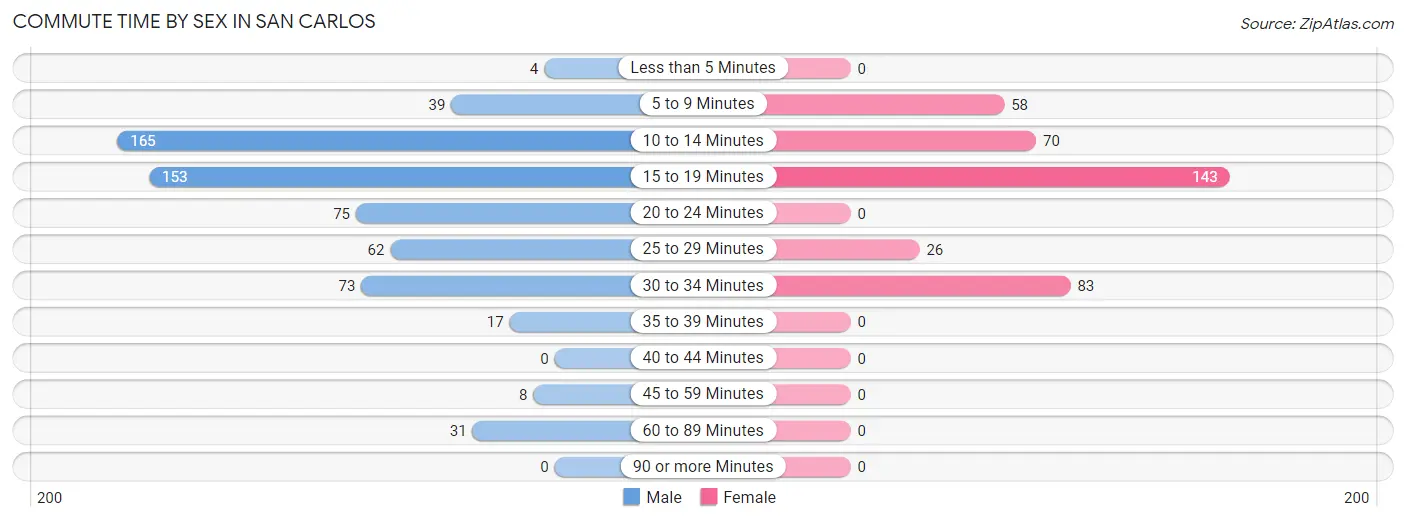
| Commute Time | Male | Female |
| Less than 5 Minutes | 4 (0.6%) | 0 (0.0%) |
| 5 to 9 Minutes | 39 (6.2%) | 58 (15.3%) |
| 10 to 14 Minutes | 165 (26.3%) | 70 (18.4%) |
| 15 to 19 Minutes | 153 (24.4%) | 143 (37.6%) |
| 20 to 24 Minutes | 75 (12.0%) | 0 (0.0%) |
| 25 to 29 Minutes | 62 (9.9%) | 26 (6.8%) |
| 30 to 34 Minutes | 73 (11.6%) | 83 (21.8%) |
| 35 to 39 Minutes | 17 (2.7%) | 0 (0.0%) |
| 40 to 44 Minutes | 0 (0.0%) | 0 (0.0%) |
| 45 to 59 Minutes | 8 (1.3%) | 0 (0.0%) |
| 60 to 89 Minutes | 31 (4.9%) | 0 (0.0%) |
| 90 or more Minutes | 0 (0.0%) | 0 (0.0%) |
Time of Departure to Work by Sex in San Carlos
The most frequent times of departure to work in San Carlos are 7:00 AM to 7:29 AM (213, 34.0%) for males and 7:00 AM to 7:29 AM (91, 23.9%) for females.
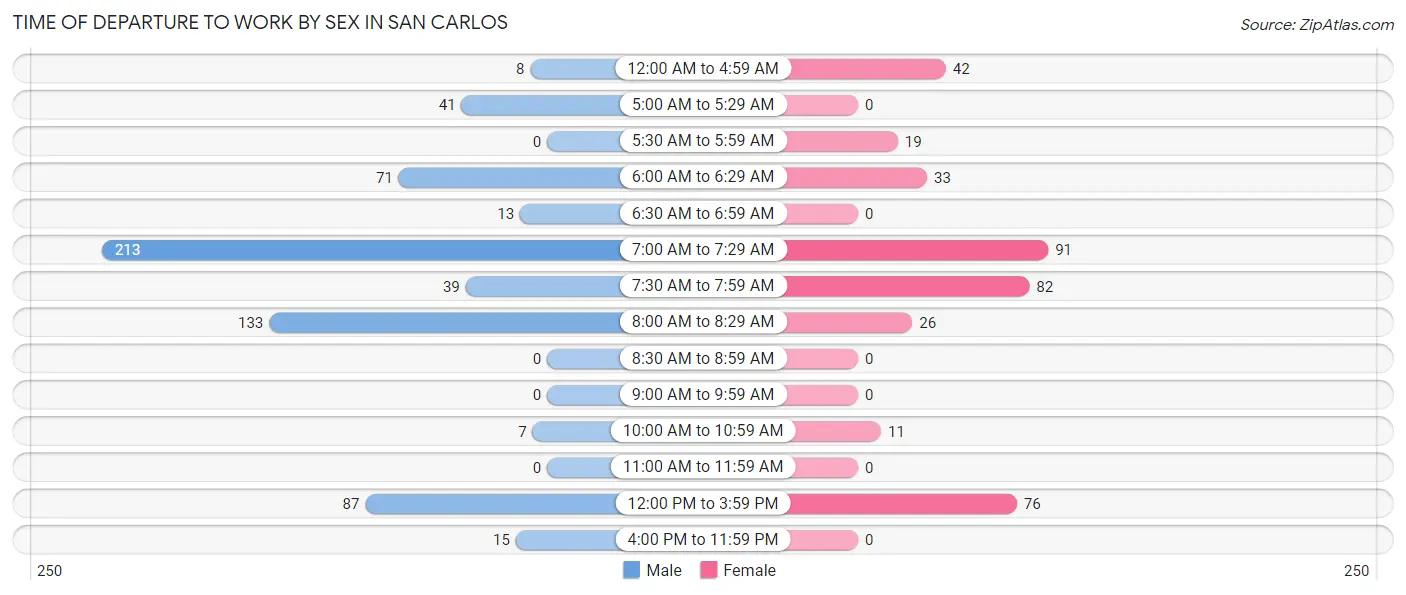
| Time of Departure | Male | Female |
| 12:00 AM to 4:59 AM | 8 (1.3%) | 42 (11.1%) |
| 5:00 AM to 5:29 AM | 41 (6.5%) | 0 (0.0%) |
| 5:30 AM to 5:59 AM | 0 (0.0%) | 19 (5.0%) |
| 6:00 AM to 6:29 AM | 71 (11.3%) | 33 (8.7%) |
| 6:30 AM to 6:59 AM | 13 (2.1%) | 0 (0.0%) |
| 7:00 AM to 7:29 AM | 213 (34.0%) | 91 (23.9%) |
| 7:30 AM to 7:59 AM | 39 (6.2%) | 82 (21.6%) |
| 8:00 AM to 8:29 AM | 133 (21.2%) | 26 (6.8%) |
| 8:30 AM to 8:59 AM | 0 (0.0%) | 0 (0.0%) |
| 9:00 AM to 9:59 AM | 0 (0.0%) | 0 (0.0%) |
| 10:00 AM to 10:59 AM | 7 (1.1%) | 11 (2.9%) |
| 11:00 AM to 11:59 AM | 0 (0.0%) | 0 (0.0%) |
| 12:00 PM to 3:59 PM | 87 (13.9%) | 76 (20.0%) |
| 4:00 PM to 11:59 PM | 15 (2.4%) | 0 (0.0%) |
| Total | 627 (100.0%) | 380 (100.0%) |
Housing Occupancy in San Carlos
Occupancy by Ownership in San Carlos
Of the total 977 dwellings in San Carlos, owner-occupied units account for 773 (79.1%), while renter-occupied units make up 204 (20.9%).
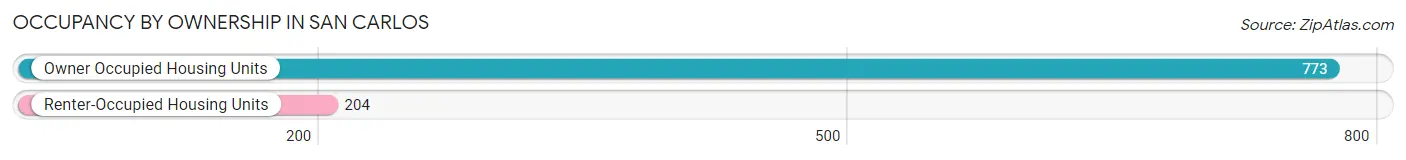
| Occupancy | # Housing Units | % Housing Units |
| Owner Occupied Housing Units | 773 | 79.1% |
| Renter-Occupied Housing Units | 204 | 20.9% |
| Total Occupied Housing Units | 977 | 100.0% |
Occupancy by Household Size in San Carlos
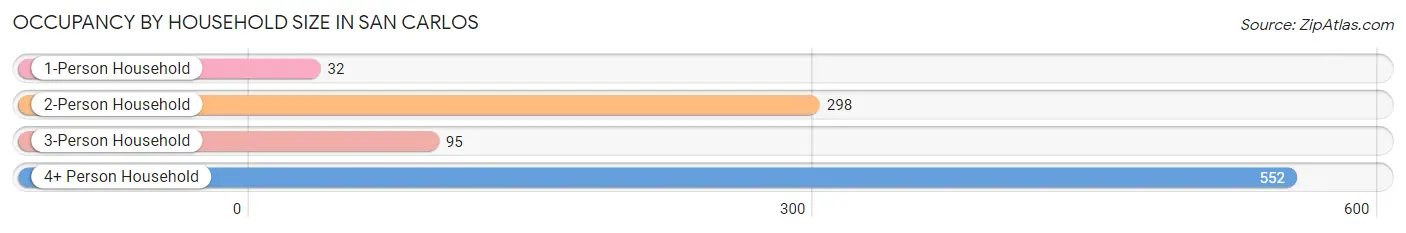
| Household Size | # Housing Units | % Housing Units |
| 1-Person Household | 32 | 3.3% |
| 2-Person Household | 298 | 30.5% |
| 3-Person Household | 95 | 9.7% |
| 4+ Person Household | 552 | 56.5% |
| Total Housing Units | 977 | 100.0% |
Occupancy by Ownership by Household Size in San Carlos
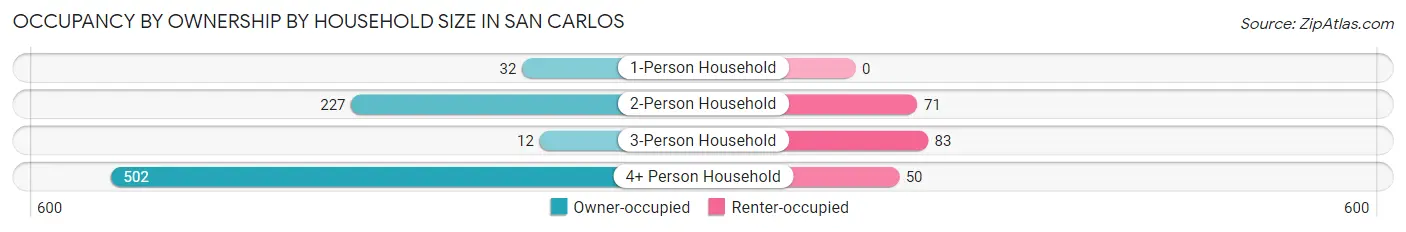
| Household Size | Owner-occupied | Renter-occupied |
| 1-Person Household | 32 (100.0%) | 0 (0.0%) |
| 2-Person Household | 227 (76.2%) | 71 (23.8%) |
| 3-Person Household | 12 (12.6%) | 83 (87.4%) |
| 4+ Person Household | 502 (90.9%) | 50 (9.1%) |
| Total Housing Units | 773 (79.1%) | 204 (20.9%) |
Occupancy by Educational Attainment in San Carlos
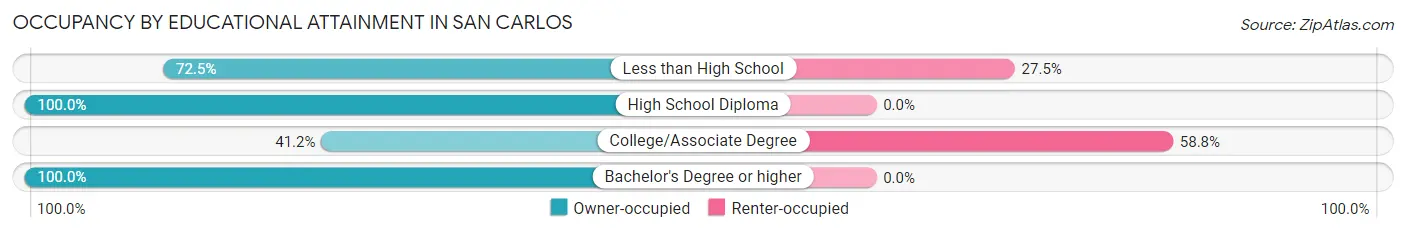
| Household Size | Owner-occupied | Renter-occupied |
| Less than High School | 354 (72.5%) | 134 (27.5%) |
| High School Diploma | 281 (100.0%) | 0 (0.0%) |
| College/Associate Degree | 49 (41.2%) | 70 (58.8%) |
| Bachelor's Degree or higher | 89 (100.0%) | 0 (0.0%) |
Occupancy by Age of Householder in San Carlos
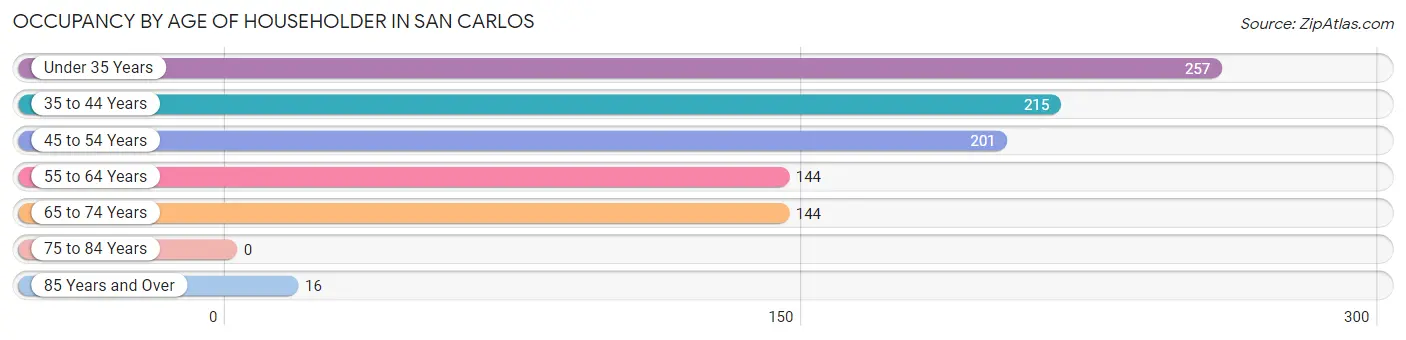
| Age Bracket | # Households | % Households |
| Under 35 Years | 257 | 26.3% |
| 35 to 44 Years | 215 | 22.0% |
| 45 to 54 Years | 201 | 20.6% |
| 55 to 64 Years | 144 | 14.7% |
| 65 to 74 Years | 144 | 14.7% |
| 75 to 84 Years | 0 | 0.0% |
| 85 Years and Over | 16 | 1.6% |
| Total | 977 | 100.0% |
Housing Finances in San Carlos
Median Income by Occupancy in San Carlos
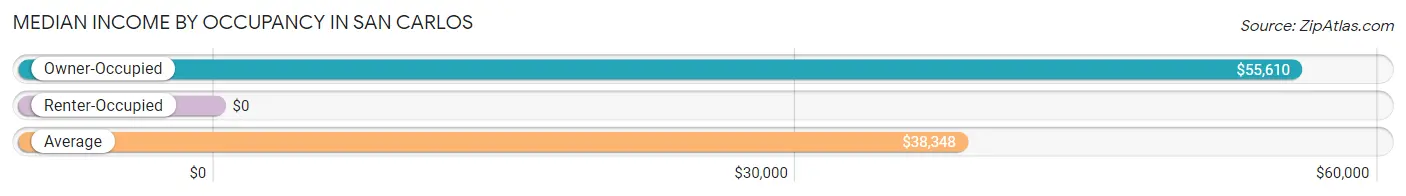
| Occupancy Type | # Households | Median Income |
| Owner-Occupied | 773 (79.1%) | $55,610 |
| Renter-Occupied | 204 (20.9%) | $0 |
| Average | 977 (100.0%) | $38,348 |
Occupancy by Householder Income Bracket in San Carlos
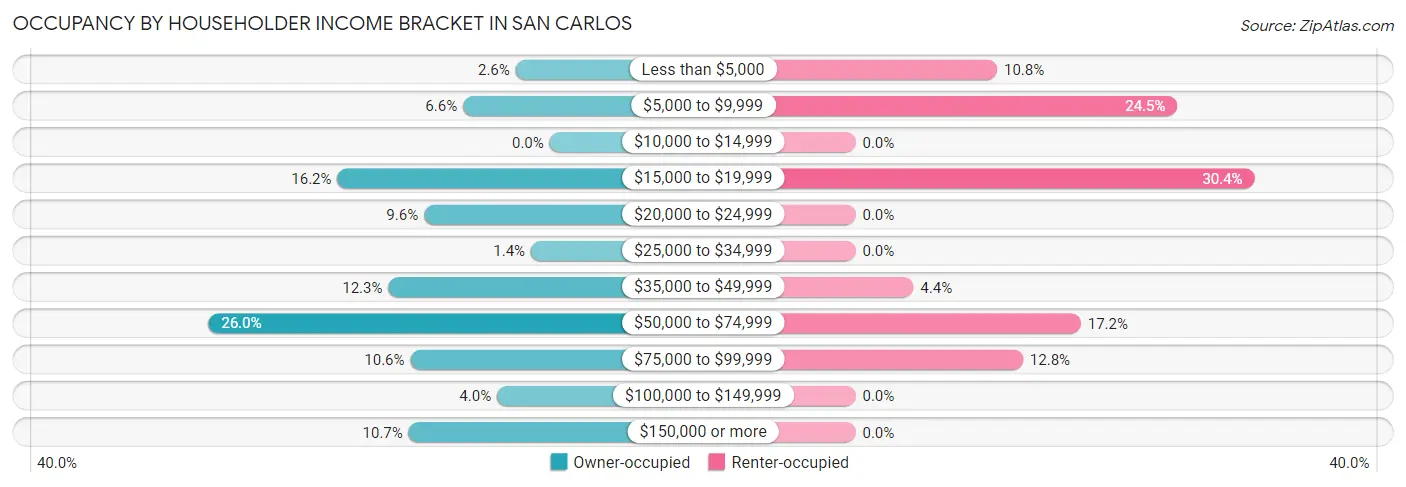
| Income Bracket | Owner-occupied | Renter-occupied |
| Less than $5,000 | 20 (2.6%) | 22 (10.8%) |
| $5,000 to $9,999 | 51 (6.6%) | 50 (24.5%) |
| $10,000 to $14,999 | 0 (0.0%) | 0 (0.0%) |
| $15,000 to $19,999 | 125 (16.2%) | 62 (30.4%) |
| $20,000 to $24,999 | 74 (9.6%) | 0 (0.0%) |
| $25,000 to $34,999 | 11 (1.4%) | 0 (0.0%) |
| $35,000 to $49,999 | 95 (12.3%) | 9 (4.4%) |
| $50,000 to $74,999 | 201 (26.0%) | 35 (17.2%) |
| $75,000 to $99,999 | 82 (10.6%) | 26 (12.8%) |
| $100,000 to $149,999 | 31 (4.0%) | 0 (0.0%) |
| $150,000 or more | 83 (10.7%) | 0 (0.0%) |
| Total | 773 (100.0%) | 204 (100.0%) |
Monthly Housing Cost Tiers in San Carlos
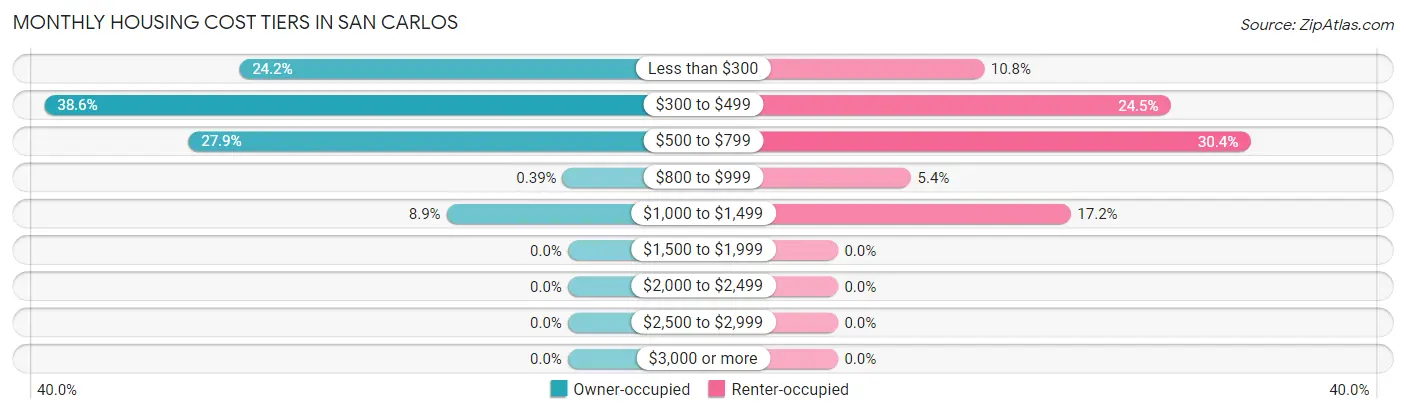
| Monthly Cost | Owner-occupied | Renter-occupied |
| Less than $300 | 187 (24.2%) | 22 (10.8%) |
| $300 to $499 | 298 (38.6%) | 50 (24.5%) |
| $500 to $799 | 216 (27.9%) | 62 (30.4%) |
| $800 to $999 | 3 (0.4%) | 11 (5.4%) |
| $1,000 to $1,499 | 69 (8.9%) | 35 (17.2%) |
| $1,500 to $1,999 | 0 (0.0%) | 0 (0.0%) |
| $2,000 to $2,499 | 0 (0.0%) | 0 (0.0%) |
| $2,500 to $2,999 | 0 (0.0%) | 0 (0.0%) |
| $3,000 or more | 0 (0.0%) | 0 (0.0%) |
| Total | 773 (100.0%) | 204 (100.0%) |
Physical Housing Characteristics in San Carlos
Housing Structures in San Carlos
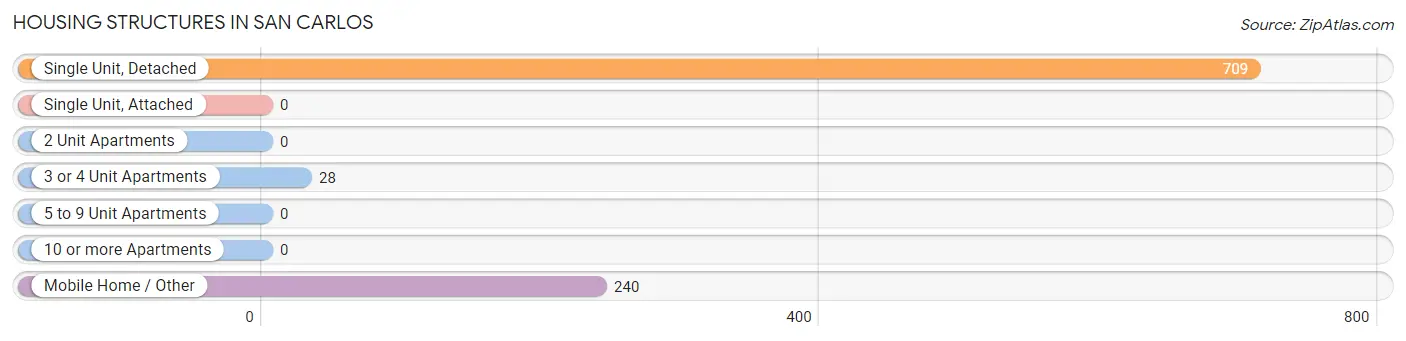
| Structure Type | # Housing Units | % Housing Units |
| Single Unit, Detached | 709 | 72.6% |
| Single Unit, Attached | 0 | 0.0% |
| 2 Unit Apartments | 0 | 0.0% |
| 3 or 4 Unit Apartments | 28 | 2.9% |
| 5 to 9 Unit Apartments | 0 | 0.0% |
| 10 or more Apartments | 0 | 0.0% |
| Mobile Home / Other | 240 | 24.6% |
| Total | 977 | 100.0% |
Housing Structures by Occupancy in San Carlos
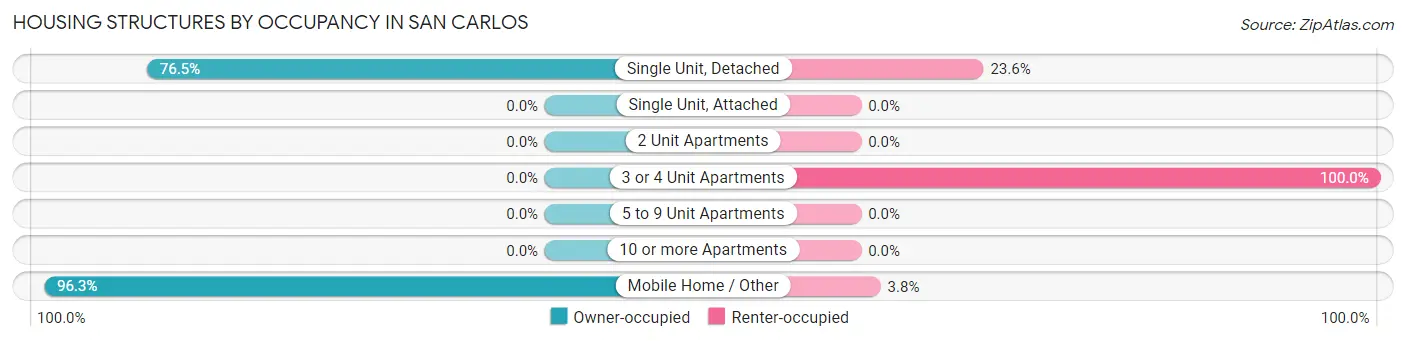
| Structure Type | Owner-occupied | Renter-occupied |
| Single Unit, Detached | 542 (76.4%) | 167 (23.5%) |
| Single Unit, Attached | 0 (0.0%) | 0 (0.0%) |
| 2 Unit Apartments | 0 (0.0%) | 0 (0.0%) |
| 3 or 4 Unit Apartments | 0 (0.0%) | 28 (100.0%) |
| 5 to 9 Unit Apartments | 0 (0.0%) | 0 (0.0%) |
| 10 or more Apartments | 0 (0.0%) | 0 (0.0%) |
| Mobile Home / Other | 231 (96.3%) | 9 (3.7%) |
| Total | 773 (79.1%) | 204 (20.9%) |
Housing Structures by Number of Rooms in San Carlos
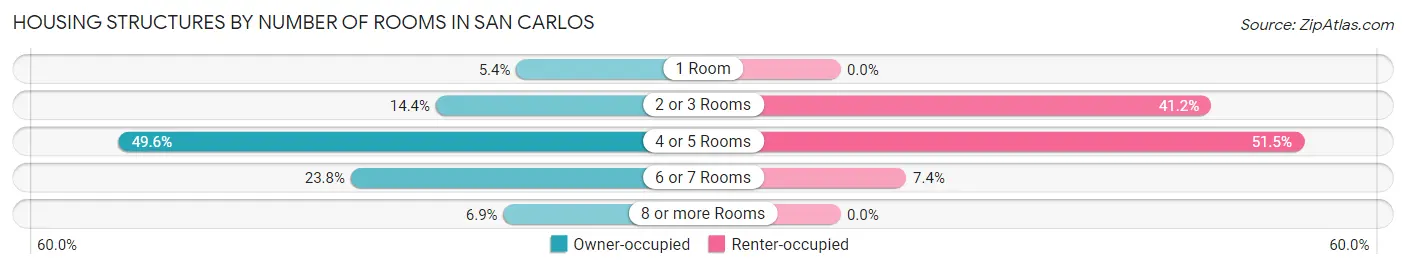
| Number of Rooms | Owner-occupied | Renter-occupied |
| 1 Room | 42 (5.4%) | 0 (0.0%) |
| 2 or 3 Rooms | 111 (14.4%) | 84 (41.2%) |
| 4 or 5 Rooms | 383 (49.5%) | 105 (51.5%) |
| 6 or 7 Rooms | 184 (23.8%) | 15 (7.3%) |
| 8 or more Rooms | 53 (6.9%) | 0 (0.0%) |
| Total | 773 (100.0%) | 204 (100.0%) |
Housing Structure by Heating Type in San Carlos
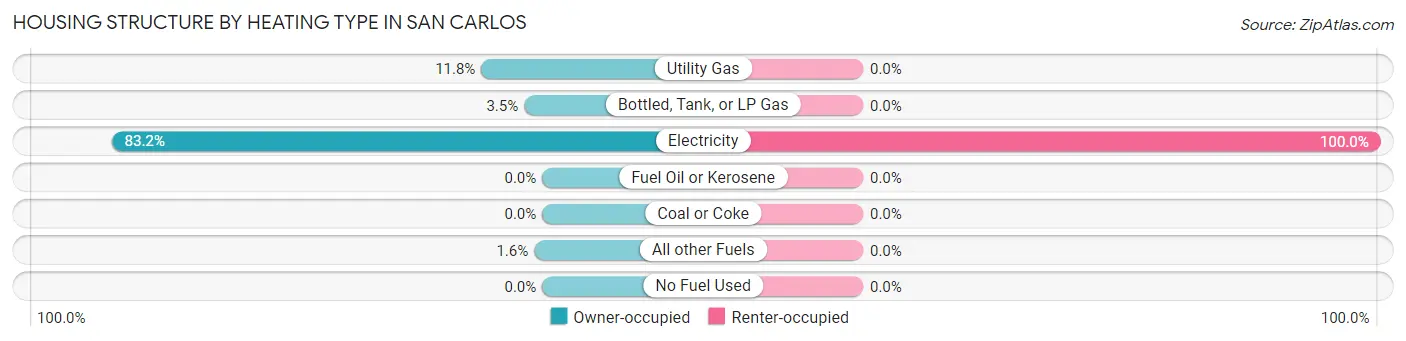
| Heating Type | Owner-occupied | Renter-occupied |
| Utility Gas | 91 (11.8%) | 0 (0.0%) |
| Bottled, Tank, or LP Gas | 27 (3.5%) | 0 (0.0%) |
| Electricity | 643 (83.2%) | 204 (100.0%) |
| Fuel Oil or Kerosene | 0 (0.0%) | 0 (0.0%) |
| Coal or Coke | 0 (0.0%) | 0 (0.0%) |
| All other Fuels | 12 (1.5%) | 0 (0.0%) |
| No Fuel Used | 0 (0.0%) | 0 (0.0%) |
| Total | 773 (100.0%) | 204 (100.0%) |
Household Vehicle Usage in San Carlos
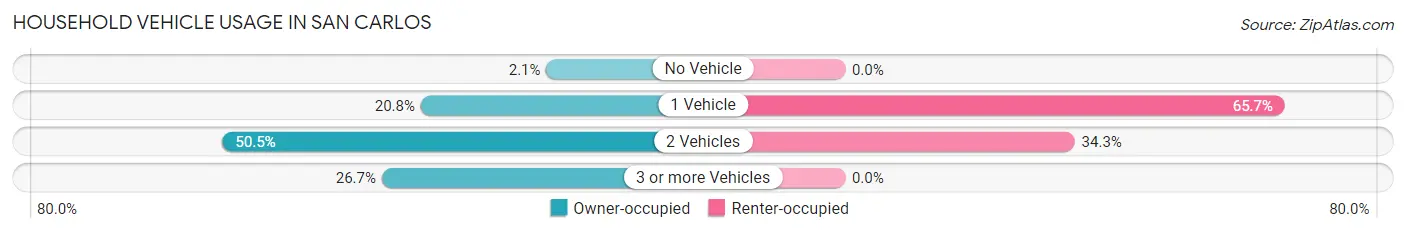
| Vehicles per Household | Owner-occupied | Renter-occupied |
| No Vehicle | 16 (2.1%) | 0 (0.0%) |
| 1 Vehicle | 161 (20.8%) | 134 (65.7%) |
| 2 Vehicles | 390 (50.4%) | 70 (34.3%) |
| 3 or more Vehicles | 206 (26.7%) | 0 (0.0%) |
| Total | 773 (100.0%) | 204 (100.0%) |
Real Estate & Mortgages in San Carlos
Real Estate and Mortgage Overview in San Carlos
| Characteristic | Without Mortgage | With Mortgage |
| Housing Units | 679 | 94 |
| Median Property Value | $71,500 | $73,400 |
| Median Household Income | $55,436 | $0 |
| Monthly Housing Costs | $375 | $0 |
| Real Estate Taxes | $1,115 | $0 |
Property Value by Mortgage Status in San Carlos
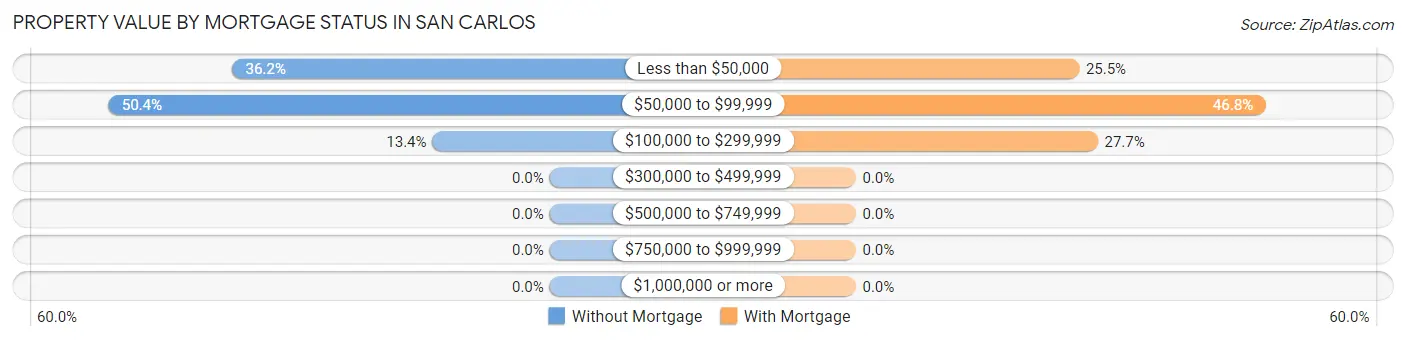
| Property Value | Without Mortgage | With Mortgage |
| Less than $50,000 | 246 (36.2%) | 24 (25.5%) |
| $50,000 to $99,999 | 342 (50.4%) | 44 (46.8%) |
| $100,000 to $299,999 | 91 (13.4%) | 26 (27.7%) |
| $300,000 to $499,999 | 0 (0.0%) | 0 (0.0%) |
| $500,000 to $749,999 | 0 (0.0%) | 0 (0.0%) |
| $750,000 to $999,999 | 0 (0.0%) | 0 (0.0%) |
| $1,000,000 or more | 0 (0.0%) | 0 (0.0%) |
| Total | 679 (100.0%) | 94 (100.0%) |
Household Income by Mortgage Status in San Carlos
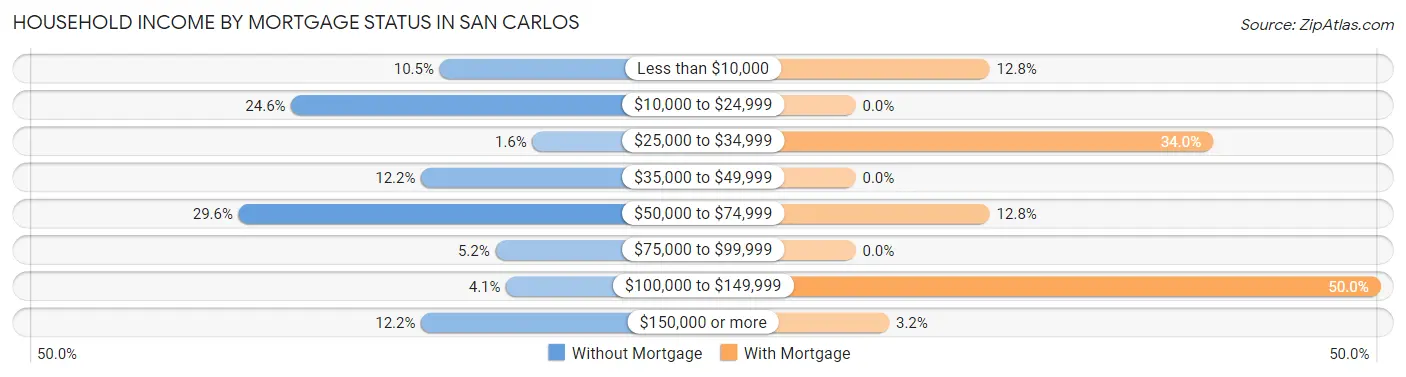
| Household Income | Without Mortgage | With Mortgage |
| Less than $10,000 | 71 (10.5%) | 12 (12.8%) |
| $10,000 to $24,999 | 167 (24.6%) | 0 (0.0%) |
| $25,000 to $34,999 | 11 (1.6%) | 32 (34.0%) |
| $35,000 to $49,999 | 83 (12.2%) | 0 (0.0%) |
| $50,000 to $74,999 | 201 (29.6%) | 12 (12.8%) |
| $75,000 to $99,999 | 35 (5.1%) | 0 (0.0%) |
| $100,000 to $149,999 | 28 (4.1%) | 47 (50.0%) |
| $150,000 or more | 83 (12.2%) | 3 (3.2%) |
| Total | 679 (100.0%) | 94 (100.0%) |
Property Value to Household Income Ratio in San Carlos
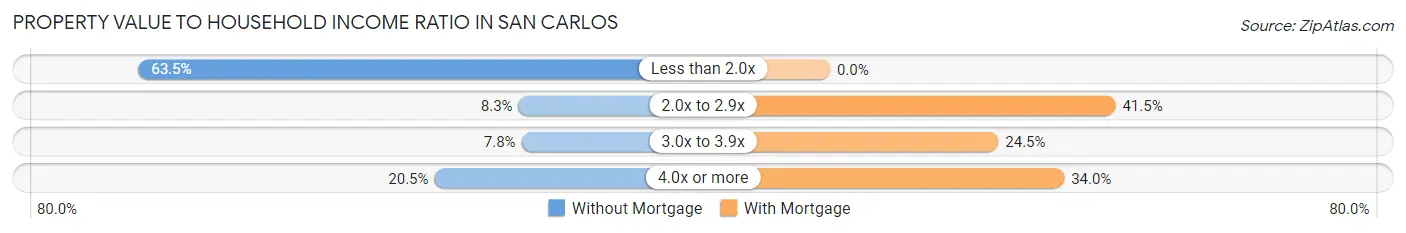
| Value-to-Income Ratio | Without Mortgage | With Mortgage |
| Less than 2.0x | 431 (63.5%) | 0 (0.0%) |
| 2.0x to 2.9x | 56 (8.3%) | 39 (41.5%) |
| 3.0x to 3.9x | 53 (7.8%) | 23 (24.5%) |
| 4.0x or more | 139 (20.5%) | 32 (34.0%) |
| Total | 679 (100.0%) | 94 (100.0%) |
Real Estate Taxes by Mortgage Status in San Carlos
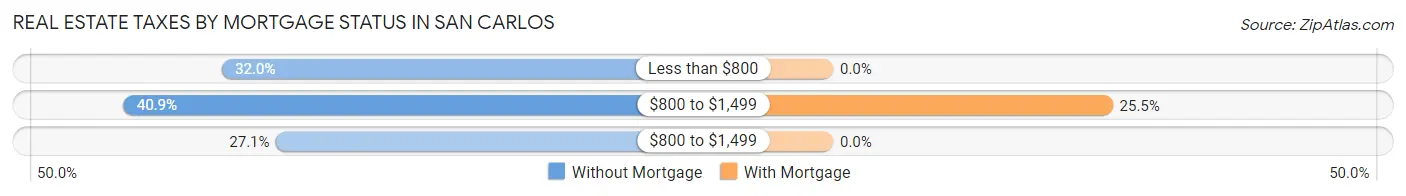
| Property Taxes | Without Mortgage | With Mortgage |
| Less than $800 | 217 (32.0%) | 0 (0.0%) |
| $800 to $1,499 | 278 (40.9%) | 24 (25.5%) |
| $800 to $1,499 | 184 (27.1%) | 0 (0.0%) |
| Total | 679 (100.0%) | 94 (100.0%) |
Health & Disability in San Carlos
Health Insurance Coverage by Age in San Carlos
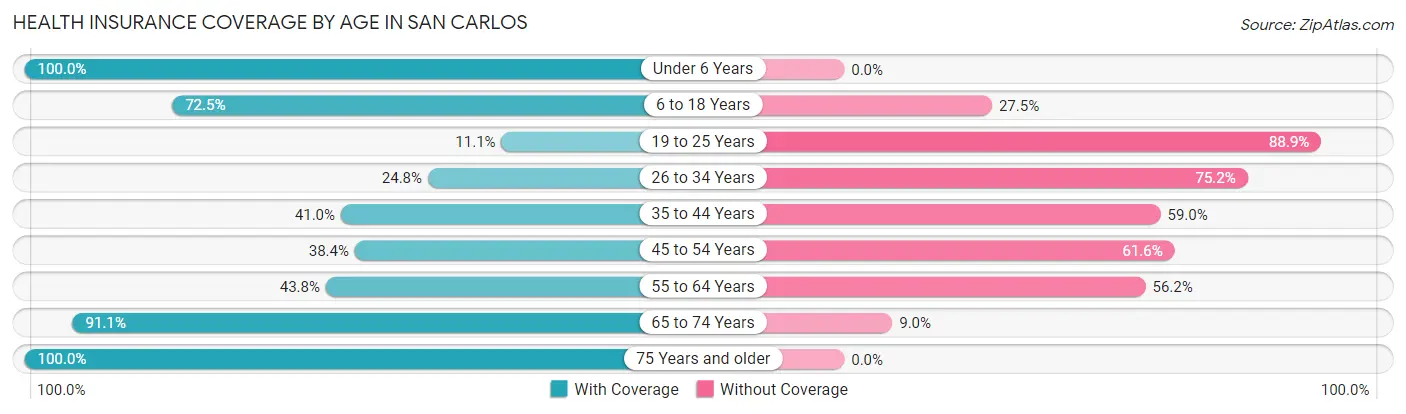
| Age Bracket | With Coverage | Without Coverage |
| Under 6 Years | 401 (100.0%) | 0 (0.0%) |
| 6 to 18 Years | 784 (72.5%) | 298 (27.5%) |
| 19 to 25 Years | 40 (11.1%) | 321 (88.9%) |
| 26 to 34 Years | 125 (24.8%) | 379 (75.2%) |
| 35 to 44 Years | 226 (41.0%) | 325 (59.0%) |
| 45 to 54 Years | 204 (38.4%) | 327 (61.6%) |
| 55 to 64 Years | 142 (43.8%) | 182 (56.2%) |
| 65 to 74 Years | 234 (91.0%) | 23 (8.9%) |
| 75 Years and older | 58 (100.0%) | 0 (0.0%) |
| Total | 2,214 (54.4%) | 1,855 (45.6%) |
Health Insurance Coverage by Citizenship Status in San Carlos
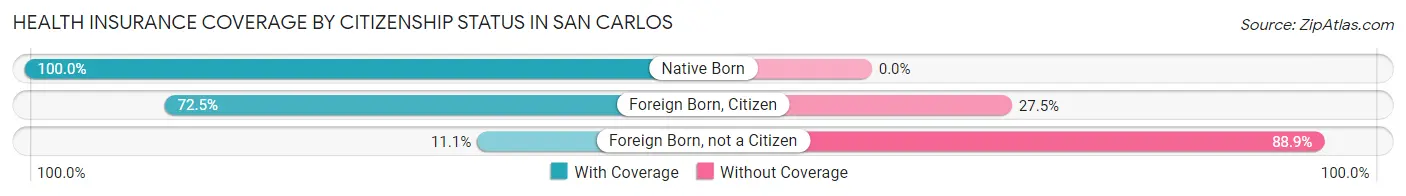
| Citizenship Status | With Coverage | Without Coverage |
| Native Born | 401 (100.0%) | 0 (0.0%) |
| Foreign Born, Citizen | 784 (72.5%) | 298 (27.5%) |
| Foreign Born, not a Citizen | 40 (11.1%) | 321 (88.9%) |
Health Insurance Coverage by Household Income in San Carlos
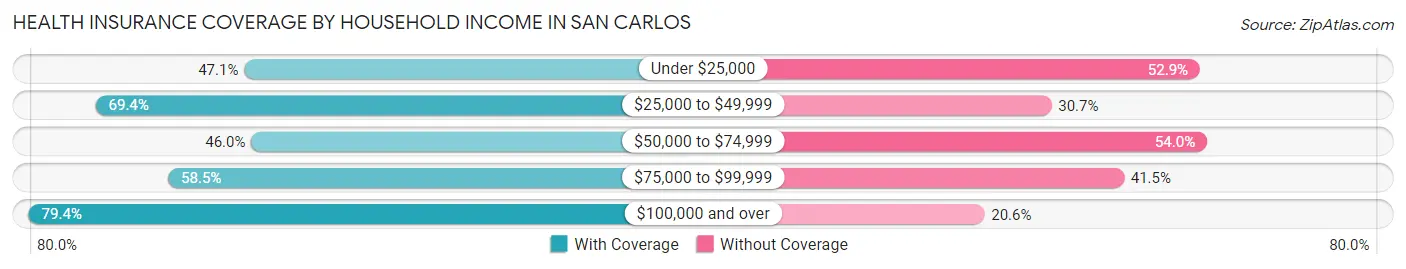
| Household Income | With Coverage | Without Coverage |
| Under $25,000 | 581 (47.1%) | 653 (52.9%) |
| $25,000 to $49,999 | 233 (69.4%) | 103 (30.6%) |
| $50,000 to $74,999 | 654 (46.0%) | 767 (54.0%) |
| $75,000 to $99,999 | 307 (58.5%) | 218 (41.5%) |
| $100,000 and over | 439 (79.4%) | 114 (20.6%) |
Public vs Private Health Insurance Coverage by Age in San Carlos
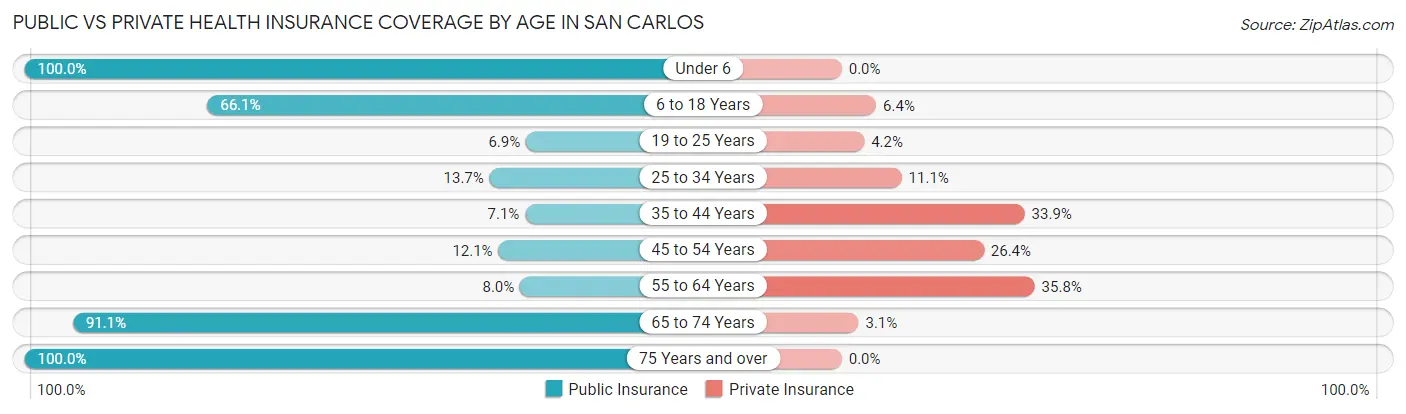
| Age Bracket | Public Insurance | Private Insurance |
| Under 6 | 401 (100.0%) | 0 (0.0%) |
| 6 to 18 Years | 715 (66.1%) | 69 (6.4%) |
| 19 to 25 Years | 25 (6.9%) | 15 (4.2%) |
| 25 to 34 Years | 69 (13.7%) | 56 (11.1%) |
| 35 to 44 Years | 39 (7.1%) | 187 (33.9%) |
| 45 to 54 Years | 64 (12.0%) | 140 (26.4%) |
| 55 to 64 Years | 26 (8.0%) | 116 (35.8%) |
| 65 to 74 Years | 234 (91.0%) | 8 (3.1%) |
| 75 Years and over | 58 (100.0%) | 0 (0.0%) |
| Total | 1,631 (40.1%) | 591 (14.5%) |
Disability Status by Sex by Age in San Carlos
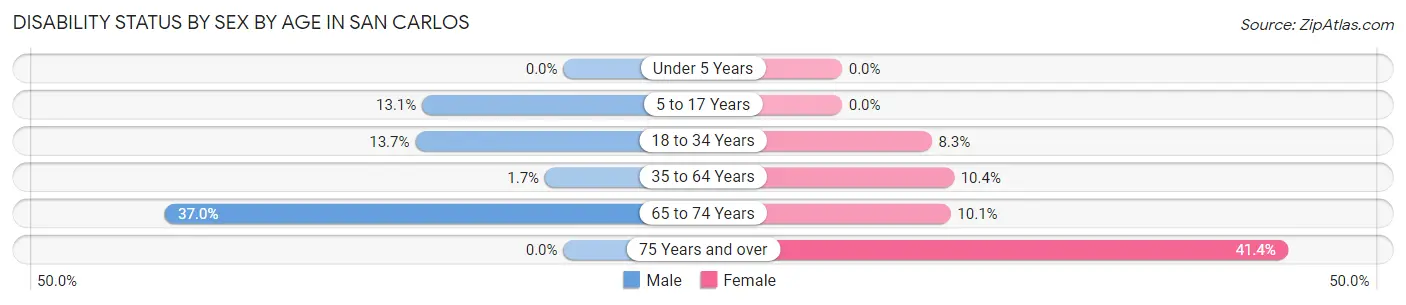
| Age Bracket | Male | Female |
| Under 5 Years | 0 (0.0%) | 0 (0.0%) |
| 5 to 17 Years | 64 (13.1%) | 0 (0.0%) |
| 18 to 34 Years | 68 (13.7%) | 47 (8.3%) |
| 35 to 64 Years | 13 (1.7%) | 67 (10.4%) |
| 65 to 74 Years | 51 (37.0%) | 12 (10.1%) |
| 75 Years and over | 0 (0.0%) | 24 (41.4%) |
Disability Class by Sex by Age in San Carlos
Disability Class: Hearing Difficulty
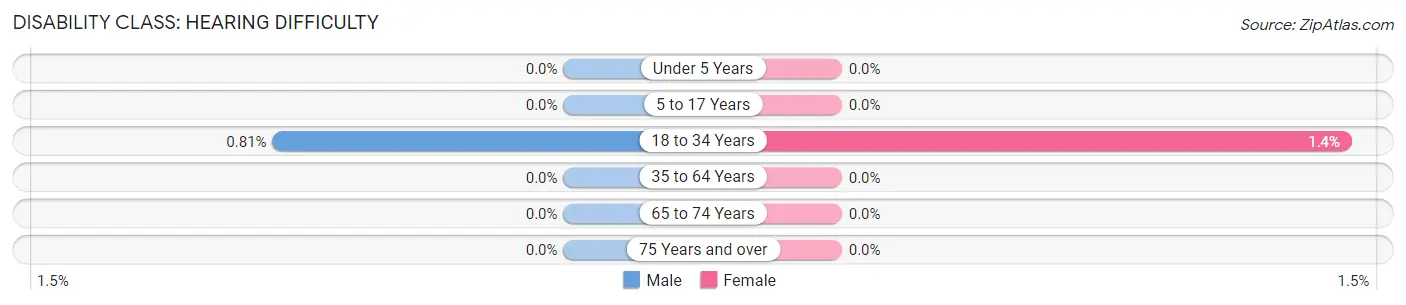
| Age Bracket | Male | Female |
| Under 5 Years | 0 (0.0%) | 0 (0.0%) |
| 5 to 17 Years | 0 (0.0%) | 0 (0.0%) |
| 18 to 34 Years | 4 (0.8%) | 8 (1.4%) |
| 35 to 64 Years | 0 (0.0%) | 0 (0.0%) |
| 65 to 74 Years | 0 (0.0%) | 0 (0.0%) |
| 75 Years and over | 0 (0.0%) | 0 (0.0%) |
Disability Class: Vision Difficulty
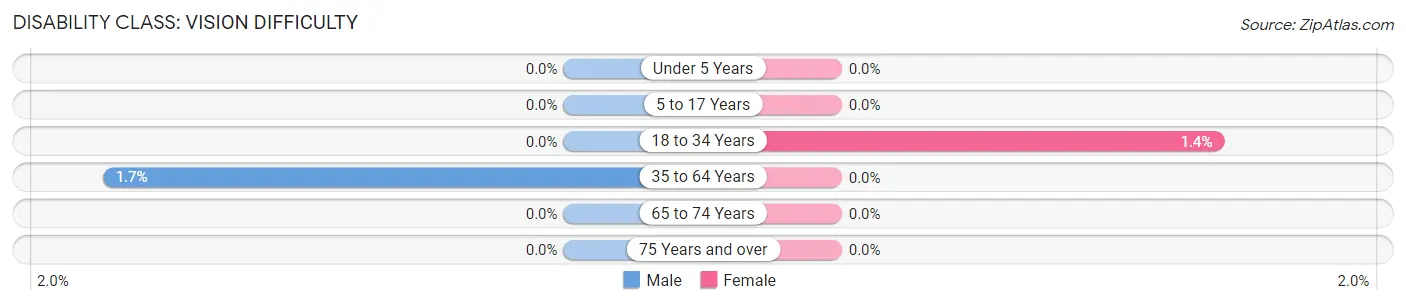
| Age Bracket | Male | Female |
| Under 5 Years | 0 (0.0%) | 0 (0.0%) |
| 5 to 17 Years | 0 (0.0%) | 0 (0.0%) |
| 18 to 34 Years | 0 (0.0%) | 8 (1.4%) |
| 35 to 64 Years | 13 (1.7%) | 0 (0.0%) |
| 65 to 74 Years | 0 (0.0%) | 0 (0.0%) |
| 75 Years and over | 0 (0.0%) | 0 (0.0%) |
Disability Class: Cognitive Difficulty
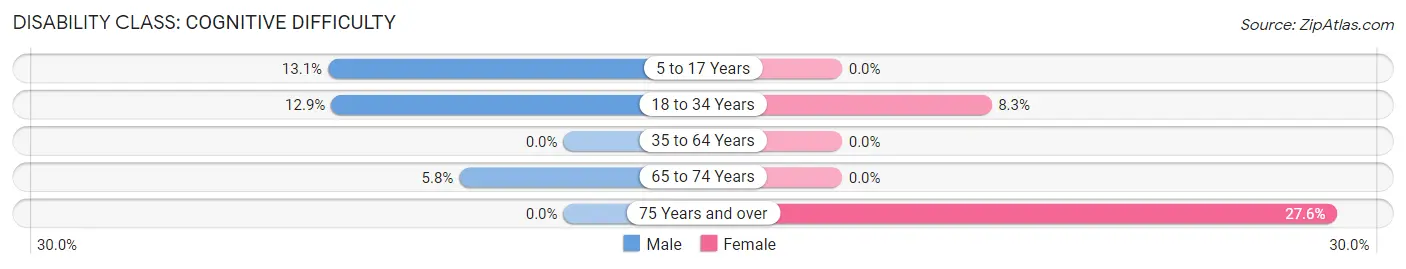
| Age Bracket | Male | Female |
| 5 to 17 Years | 64 (13.1%) | 0 (0.0%) |
| 18 to 34 Years | 64 (12.9%) | 47 (8.3%) |
| 35 to 64 Years | 0 (0.0%) | 0 (0.0%) |
| 65 to 74 Years | 8 (5.8%) | 0 (0.0%) |
| 75 Years and over | 0 (0.0%) | 16 (27.6%) |
Disability Class: Ambulatory Difficulty
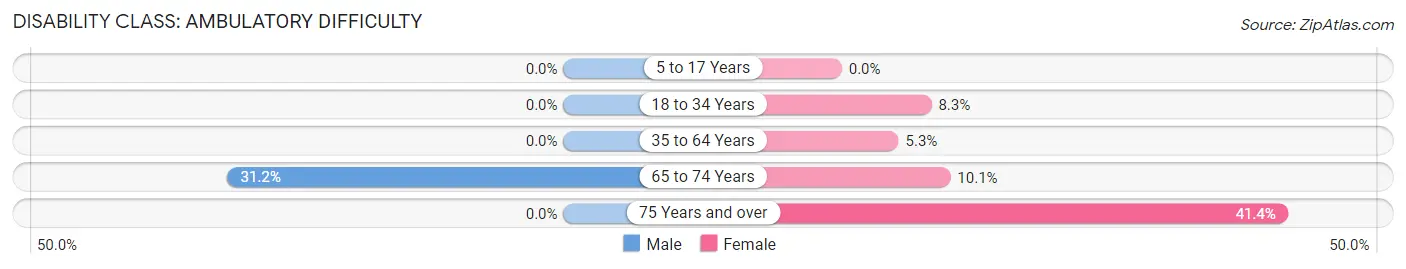
| Age Bracket | Male | Female |
| 5 to 17 Years | 0 (0.0%) | 0 (0.0%) |
| 18 to 34 Years | 0 (0.0%) | 47 (8.3%) |
| 35 to 64 Years | 0 (0.0%) | 34 (5.3%) |
| 65 to 74 Years | 43 (31.2%) | 12 (10.1%) |
| 75 Years and over | 0 (0.0%) | 24 (41.4%) |
Disability Class: Self-Care Difficulty
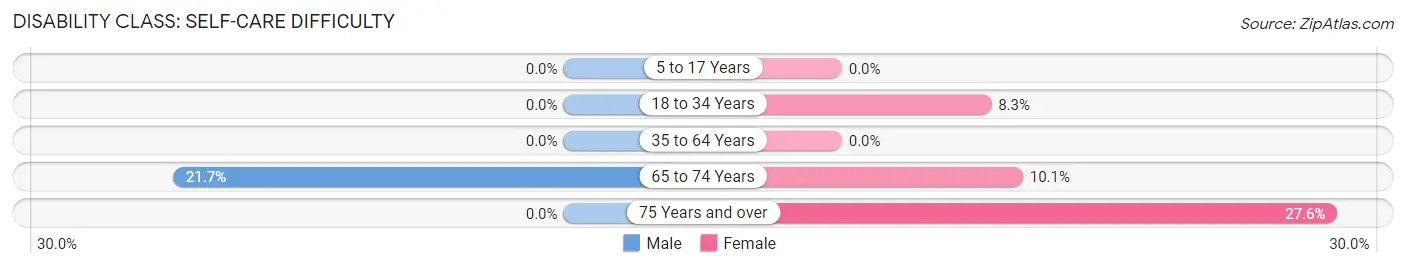
| Age Bracket | Male | Female |
| 5 to 17 Years | 0 (0.0%) | 0 (0.0%) |
| 18 to 34 Years | 0 (0.0%) | 47 (8.3%) |
| 35 to 64 Years | 0 (0.0%) | 0 (0.0%) |
| 65 to 74 Years | 30 (21.7%) | 12 (10.1%) |
| 75 Years and over | 0 (0.0%) | 16 (27.6%) |
Technology Access in San Carlos
Computing Device Access in San Carlos
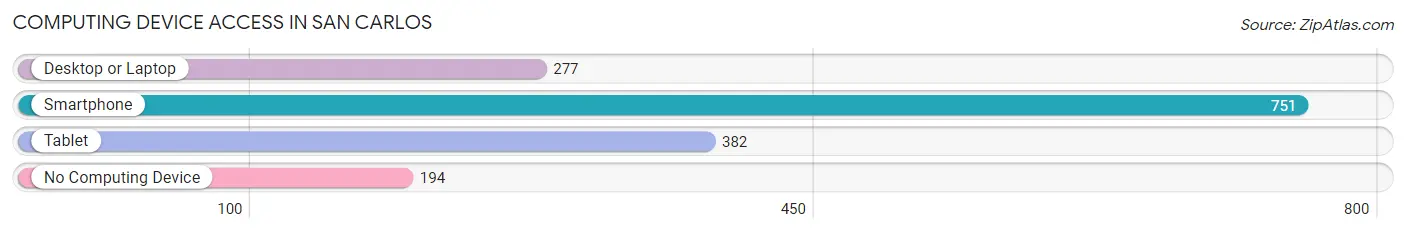
| Device Type | # Households | % Households |
| Desktop or Laptop | 277 | 28.3% |
| Smartphone | 751 | 76.9% |
| Tablet | 382 | 39.1% |
| No Computing Device | 194 | 19.9% |
| Total | 977 | 100.0% |
Internet Access in San Carlos
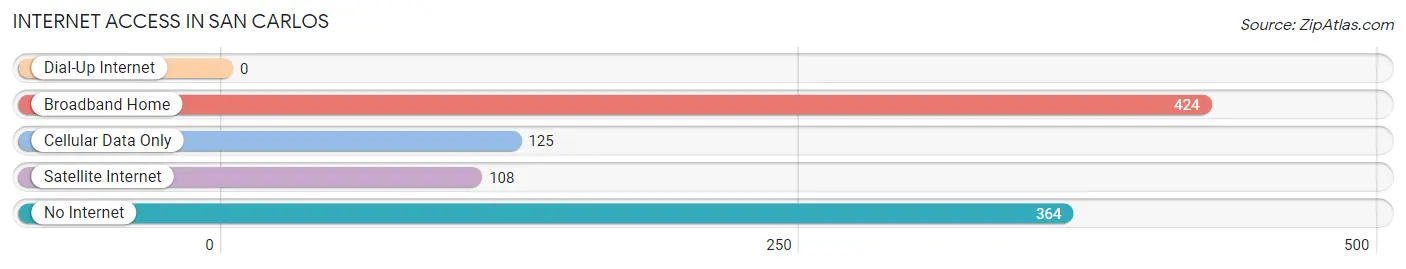
| Internet Type | # Households | % Households |
| Dial-Up Internet | 0 | 0.0% |
| Broadband Home | 424 | 43.4% |
| Cellular Data Only | 125 | 12.8% |
| Satellite Internet | 108 | 11.1% |
| No Internet | 364 | 37.3% |
| Total | 977 | 100.0% |
San Carlos Summary
San Carlos, Texas is a small town located in the western part of the state, in the county of Val Verde. It is situated on the banks of the San Carlos River, and is surrounded by the Chihuahuan Desert. The town has a population of just over 1,000 people, and is known for its rich history and culture.
History
San Carlos was founded in 1883 by a group of settlers from Mexico. The town was originally called San Carlos de la Sierra, and was named after the nearby San Carlos River. The settlers were attracted to the area due to its fertile soil and abundant water supply. The town quickly grew, and by the early 1900s, it had become a thriving agricultural center.
The town was also home to a number of businesses, including a general store, a blacksmith shop, and a saloon. In the early 1900s, the town was also home to a number of churches, including the First Baptist Church of San Carlos, which was founded in 1906.
In the 1920s, the town began to experience a decline in population due to the Great Depression. However, the town was able to survive and eventually began to experience a resurgence in the 1950s. This resurgence was due in part to the construction of a new bridge over the San Carlos River, which allowed for easier access to the town.
Geography
San Carlos is located in the western part of Texas, in the county of Val Verde. It is situated on the banks of the San Carlos River, and is surrounded by the Chihuahuan Desert. The town is located at an elevation of 1,890 feet, and has an average temperature of 73 degrees Fahrenheit.
The town is located near the Big Bend National Park, which is a popular tourist destination. The park is home to a variety of wildlife, including mountain lions, black bears, and bighorn sheep.
Economy
San Carlos is a small town, and its economy is largely based on agriculture. The town is home to a number of farms, which produce a variety of crops, including cotton, corn, and wheat. The town is also home to a number of businesses, including a general store, a blacksmith shop, and a saloon.
The town is also home to a number of tourist attractions, including the Big Bend National Park, which attracts visitors from all over the world. The town is also home to a number of festivals, including the San Carlos Fiesta, which is held every year in April.
Demographics
As of the 2010 census, the population of San Carlos was 1,072. The town is predominantly Hispanic, with 94.3% of the population identifying as such. The median household income in the town is $25,000, and the median age is 33.
Conclusion
San Carlos, Texas is a small town located in the western part of the state, in the county of Val Verde. It is situated on the banks of the San Carlos River, and is surrounded by the Chihuahuan Desert. The town has a rich history and culture, and is home to a number of businesses, farms, and tourist attractions. The town is predominantly Hispanic, with 94.3% of the population identifying as such. The town is also home to a number of festivals, including the San Carlos Fiesta, which is held every year in April.
Common Questions
What is Per Capita Income in San Carlos?
Per Capita income in San Carlos is $15,688.
What is the Median Family Income in San Carlos?
Median Family Income in San Carlos is $54,886.
What is the Median Household income in San Carlos?
Median Household Income in San Carlos is $38,348.
What is Income or Wage Gap in San Carlos?
Income or Wage Gap in San Carlos is 40.3%.
Women in San Carlos earn 59.7 cents for every dollar earned by a man.
What is Inequality or Gini Index in San Carlos?
Inequality or Gini Index in San Carlos is 0.47.
What is the Total Population of San Carlos?
Total Population of San Carlos is 4,069.
What is the Total Male Population of San Carlos?
Total Male Population of San Carlos is 2,019.
What is the Total Female Population of San Carlos?
Total Female Population of San Carlos is 2,050.
What is the Ratio of Males per 100 Females in San Carlos?
There are 98.49 Males per 100 Females in San Carlos.
What is the Ratio of Females per 100 Males in San Carlos?
There are 101.54 Females per 100 Males in San Carlos.
What is the Median Population Age in San Carlos?
Median Population Age in San Carlos is 30.6 Years.
What is the Average Family Size in San Carlos
Average Family Size in San Carlos is 4.4 People.
What is the Average Household Size in San Carlos
Average Household Size in San Carlos is 4.2 People.
How Large is the Labor Force in San Carlos?
There are 1,656 People in the Labor Forcein in San Carlos.
What is the Percentage of People in the Labor Force in San Carlos?
56.6% of People are in the Labor Force in San Carlos.
What is the Unemployment Rate in San Carlos?
Unemployment Rate in San Carlos is 17.7%.