Zip Codes with the Highest Percentage of Population Employed in Food Preparation & Serving in Lenoir City, TN
RELATED REPORTS & OPTIONS
Food Preparation & Serving
Lenoir City
Compare Zip Codes
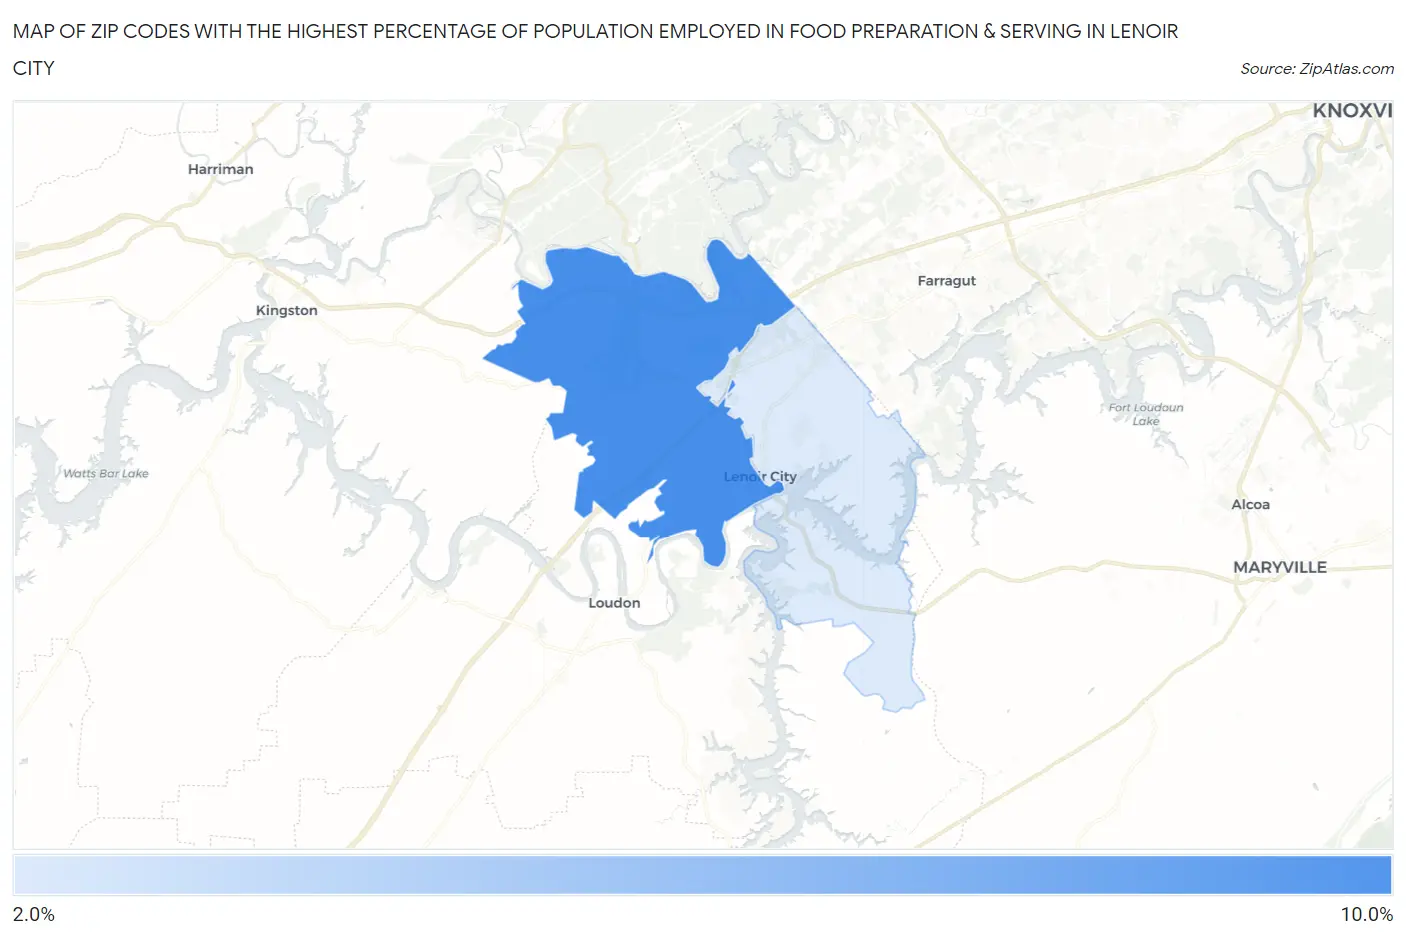
Map of Zip Codes with the Highest Percentage of Population Employed in Food Preparation & Serving in Lenoir City
2.5%
9.3%
Zip Codes with the Highest Percentage of Population Employed in Food Preparation & Serving in Lenoir City, TN
| Zip Code | % Employed | vs State | vs National | |
| 1. | 37771 | 9.3% | 5.4%(+3.92)#56 | 5.3%(+4.05)#3,209 |
| 2. | 37772 | 2.5% | 5.4%(-2.90)#468 | 5.3%(-2.77)#23,111 |
1
Common Questions
What are the Top Zip Codes with the Highest Percentage of Population Employed in Food Preparation & Serving in Lenoir City, TN?
Top Zip Codes with the Highest Percentage of Population Employed in Food Preparation & Serving in Lenoir City, TN are:
What zip code has the Highest Percentage of Population Employed in Food Preparation & Serving in Lenoir City, TN?
37771 has the Highest Percentage of Population Employed in Food Preparation & Serving in Lenoir City, TN with 9.3%.
What is the Percentage of Population Employed in Food Preparation & Serving in Lenoir City, TN?
Percentage of Population Employed in Food Preparation & Serving in Lenoir City is 9.1%.
What is the Percentage of Population Employed in Food Preparation & Serving in Tennessee?
Percentage of Population Employed in Food Preparation & Serving in Tennessee is 5.4%.
What is the Percentage of Population Employed in Food Preparation & Serving in the United States?
Percentage of Population Employed in Food Preparation & Serving in the United States is 5.3%.