Apison, TN Map & Demographics
Apison Map
Apison Overview
$52,892
PER CAPITA INCOME
$104,286
AVG FAMILY INCOME
$86,167
AVG HOUSEHOLD INCOME
62.8%
WAGE / INCOME GAP [ % ]
37.2¢/ $1
WAGE / INCOME GAP [ $ ]
$12,469
FAMILY INCOME DEFICIT
0.51
INEQUALITY / GINI INDEX
4,199
TOTAL POPULATION
1,946
MALE POPULATION
2,253
FEMALE POPULATION
86.37
MALES / 100 FEMALES
115.78
FEMALES / 100 MALES
45.2
MEDIAN AGE
3.0
AVG FAMILY SIZE
2.7
AVG HOUSEHOLD SIZE
2,129
LABOR FORCE [ PEOPLE ]
63.2%
PERCENT IN LABOR FORCE
1.1%
UNEMPLOYMENT RATE
Apison Zip Codes
Apison Area Codes
Income in Apison
Income Overview in Apison
Per Capita Income in Apison is $52,892, while median incomes of families and households are $104,286 and $86,167 respectively.
| Characteristic | Number | Measure |
| Per Capita Income | 4,199 | $52,892 |
| Median Family Income | 1,300 | $104,286 |
| Mean Family Income | 1,300 | $150,796 |
| Median Household Income | 1,552 | $86,167 |
| Mean Household Income | 1,552 | $139,940 |
| Income Deficit | 1,300 | $12,469 |
| Wage / Income Gap (%) | 4,199 | 62.84% |
| Wage / Income Gap ($) | 4,199 | 37.16¢ per $1 |
| Gini / Inequality Index | 4,199 | 0.51 |
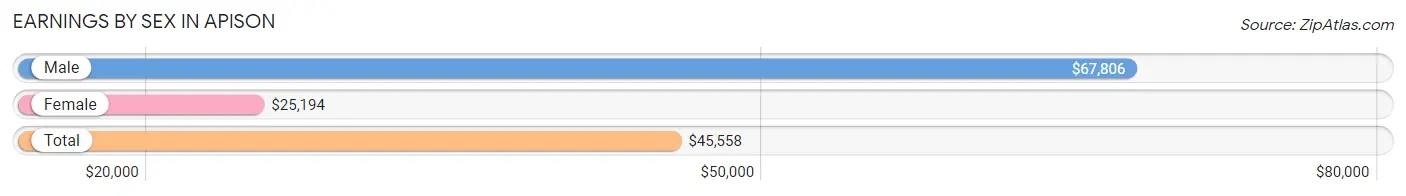
Earnings by Sex in Apison
Average Earnings in Apison are $45,558, $67,806 for men and $25,194 for women, a difference of 62.8%.
| Sex | Number | Average Earnings |
| Male | 1,314 (53.3%) | $67,806 |
| Female | 1,151 (46.7%) | $25,194 |
| Total | 2,465 (100.0%) | $45,558 |
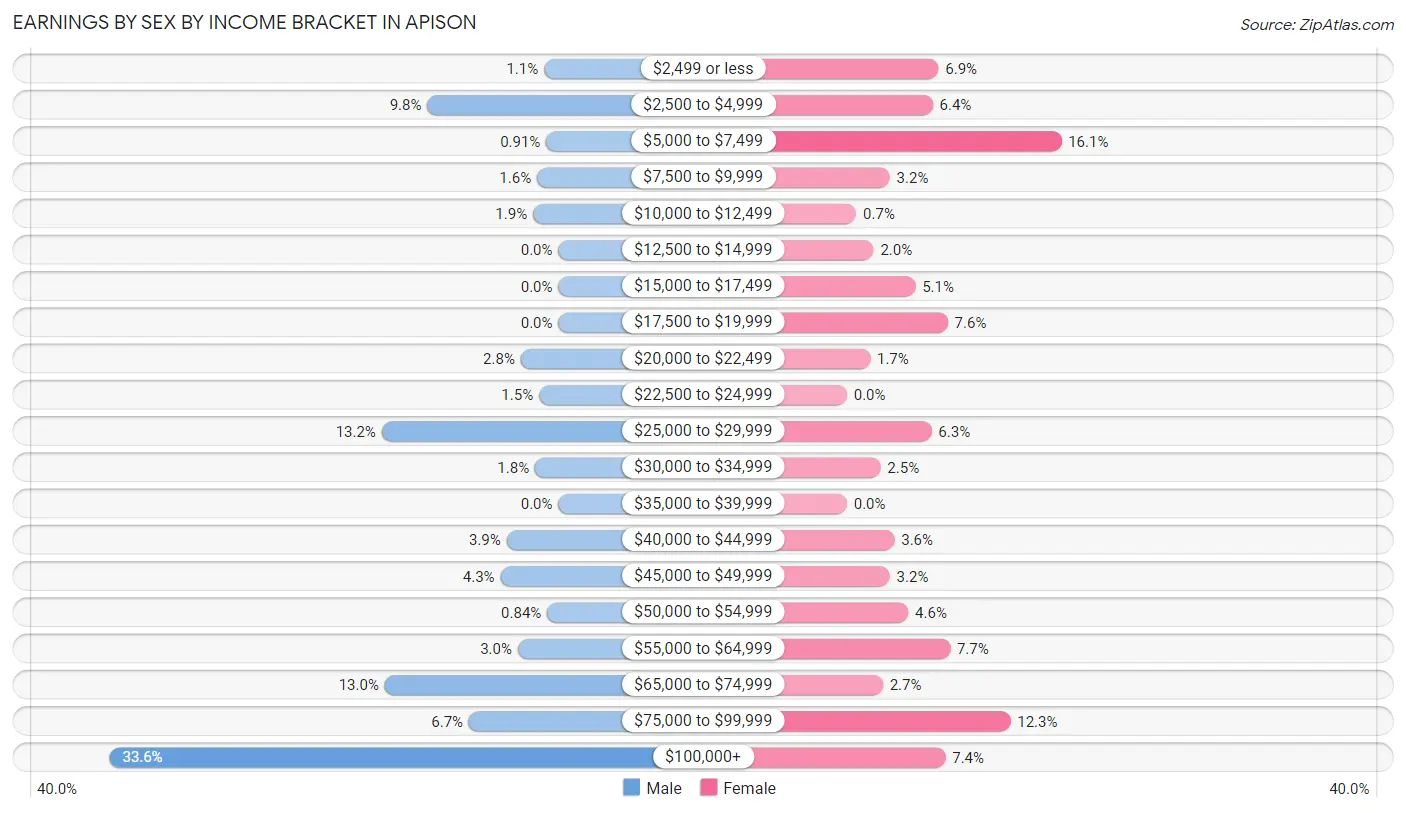
Earnings by Sex by Income Bracket in Apison
The most common earnings brackets in Apison are $100,000+ for men (442 | 33.6%) and $5,000 to $7,499 for women (185 | 16.1%).
| Income | Male | Female |
| $2,499 or less | 14 (1.1%) | 79 (6.9%) |
| $2,500 to $4,999 | 129 (9.8%) | 74 (6.4%) |
| $5,000 to $7,499 | 12 (0.9%) | 185 (16.1%) |
| $7,500 to $9,999 | 21 (1.6%) | 37 (3.2%) |
| $10,000 to $12,499 | 25 (1.9%) | 8 (0.7%) |
| $12,500 to $14,999 | 0 (0.0%) | 23 (2.0%) |
| $15,000 to $17,499 | 0 (0.0%) | 59 (5.1%) |
| $17,500 to $19,999 | 0 (0.0%) | 87 (7.6%) |
| $20,000 to $22,499 | 37 (2.8%) | 20 (1.7%) |
| $22,500 to $24,999 | 19 (1.5%) | 0 (0.0%) |
| $25,000 to $29,999 | 174 (13.2%) | 73 (6.3%) |
| $30,000 to $34,999 | 23 (1.8%) | 29 (2.5%) |
| $35,000 to $39,999 | 0 (0.0%) | 0 (0.0%) |
| $40,000 to $44,999 | 51 (3.9%) | 41 (3.6%) |
| $45,000 to $49,999 | 57 (4.3%) | 37 (3.2%) |
| $50,000 to $54,999 | 11 (0.8%) | 53 (4.6%) |
| $55,000 to $64,999 | 40 (3.0%) | 89 (7.7%) |
| $65,000 to $74,999 | 171 (13.0%) | 31 (2.7%) |
| $75,000 to $99,999 | 88 (6.7%) | 141 (12.2%) |
| $100,000+ | 442 (33.6%) | 85 (7.4%) |
| Total | 1,314 (100.0%) | 1,151 (100.0%) |
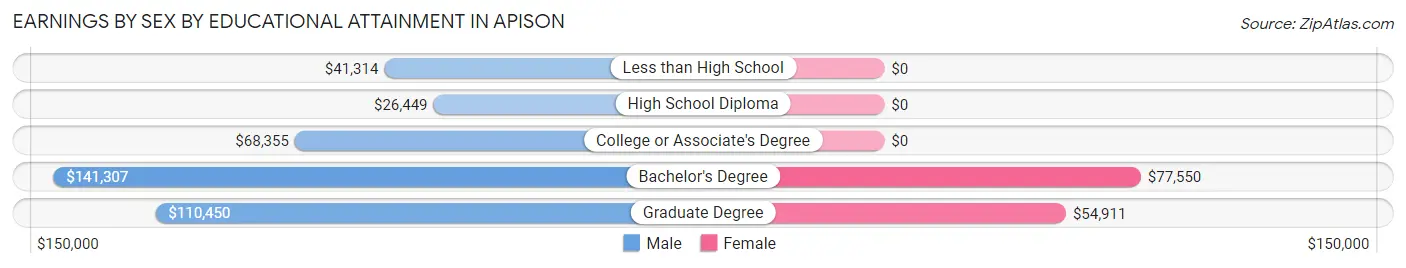
Earnings by Sex by Educational Attainment in Apison
| Educational Attainment | Male Income | Female Income |
| Less than High School | $41,314 | $0 |
| High School Diploma | $26,449 | $0 |
| College or Associate's Degree | $68,355 | $0 |
| Bachelor's Degree | $141,307 | $77,550 |
| Graduate Degree | $110,450 | $54,911 |
| Total | $70,605 | $0 |
Family Income in Apison
Family Income Brackets in Apison
According to the Apison family income data, there are 334 families falling into the $200,000+ income range, which is the most common income bracket and makes up 25.7% of all families. Conversely, the less than $10,000 income bracket is the least frequent group with only 14 families (1.1%) belonging to this category.
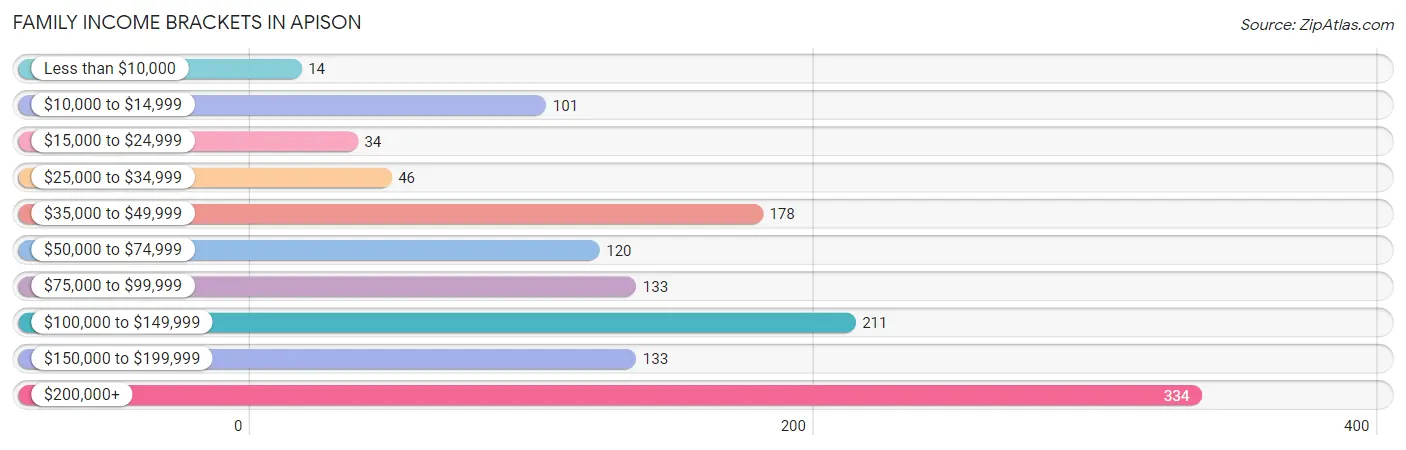
| Income Bracket | # Families | % Families |
| Less than $10,000 | 14 | 1.1% |
| $10,000 to $14,999 | 101 | 7.8% |
| $15,000 to $24,999 | 34 | 2.6% |
| $25,000 to $34,999 | 46 | 3.5% |
| $35,000 to $49,999 | 178 | 13.7% |
| $50,000 to $74,999 | 120 | 9.2% |
| $75,000 to $99,999 | 133 | 10.2% |
| $100,000 to $149,999 | 211 | 16.2% |
| $150,000 to $199,999 | 133 | 10.2% |
| $200,000+ | 334 | 25.7% |
Family Income by Famaliy Size in Apison
4-person families (237 | 18.2%) account for the highest median family income in Apison with $107,250 per family, while 2-person families (636 | 48.9%) have the highest median income of $43,150 per family member.
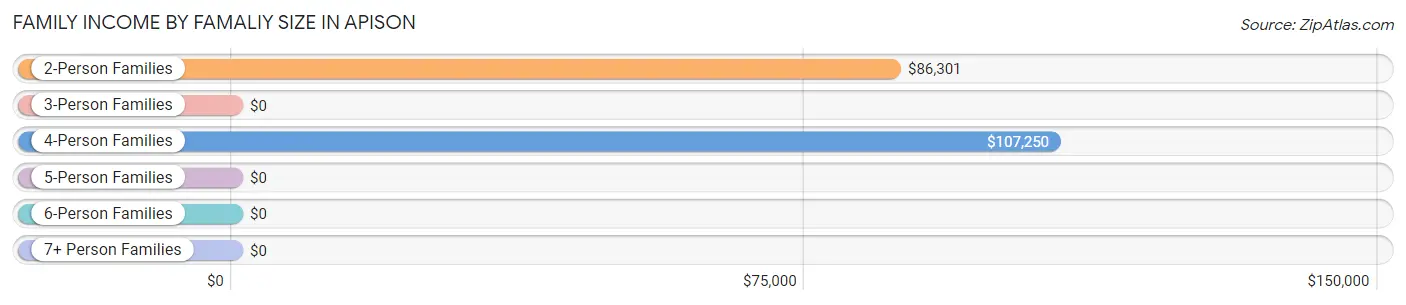
| Income Bracket | # Families | Median Income |
| 2-Person Families | 636 (48.9%) | $86,301 |
| 3-Person Families | 304 (23.4%) | $0 |
| 4-Person Families | 237 (18.2%) | $107,250 |
| 5-Person Families | 82 (6.3%) | $0 |
| 6-Person Families | 23 (1.8%) | $0 |
| 7+ Person Families | 18 (1.4%) | $0 |
| Total | 1,300 (100.0%) | $104,286 |
Family Income by Number of Earners in Apison
The median family income in Apison is $104,286, with families comprising 3+ earners (227) having the highest median family income of $250,001, while families with no earners (134) have the lowest median family income of $46,184, accounting for 17.5% and 10.3% of families, respectively.
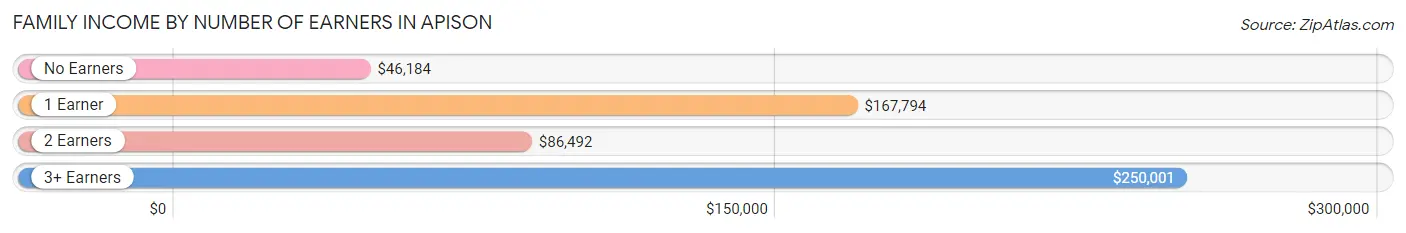
| Number of Earners | # Families | Median Income |
| No Earners | 134 (10.3%) | $46,184 |
| 1 Earner | 328 (25.2%) | $167,794 |
| 2 Earners | 611 (47.0%) | $86,492 |
| 3+ Earners | 227 (17.5%) | $250,001 |
| Total | 1,300 (100.0%) | $104,286 |
Household Income in Apison
Household Income Brackets in Apison
With 359 households falling in the category, the $200,000+ income range is the most frequent in Apison, accounting for 23.1% of all households. In contrast, only 45 households (2.9%) fall into the $25,000 to $34,999 income bracket, making it the least populous group.
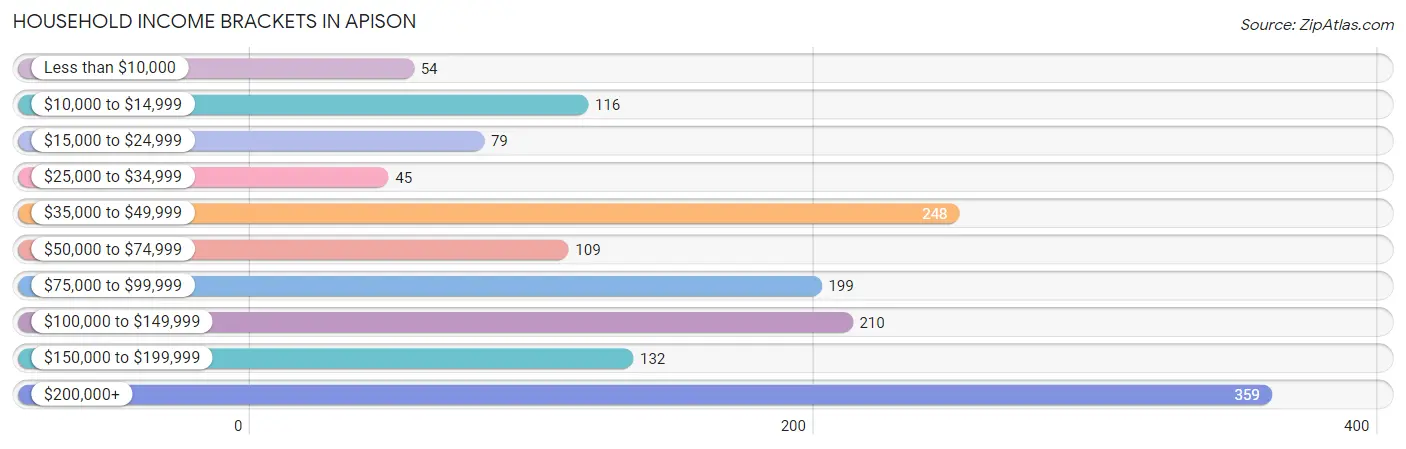
| Income Bracket | # Households | % Households |
| Less than $10,000 | 54 | 3.5% |
| $10,000 to $14,999 | 116 | 7.5% |
| $15,000 to $24,999 | 79 | 5.1% |
| $25,000 to $34,999 | 45 | 2.9% |
| $35,000 to $49,999 | 248 | 16.0% |
| $50,000 to $74,999 | 109 | 7.0% |
| $75,000 to $99,999 | 199 | 12.8% |
| $100,000 to $149,999 | 210 | 13.5% |
| $150,000 to $199,999 | 132 | 8.5% |
| $200,000+ | 359 | 23.1% |
Household Income by Householder Age in Apison
The median household income in Apison is $86,167, with the highest median household income of $145,483 found in the 25 to 44 years age bracket for the primary householder. A total of 279 households (18.0%) fall into this category. Meanwhile, the 15 to 24 years age bracket for the primary householder has the lowest median household income of $0, with 52 households (3.4%) in this group.
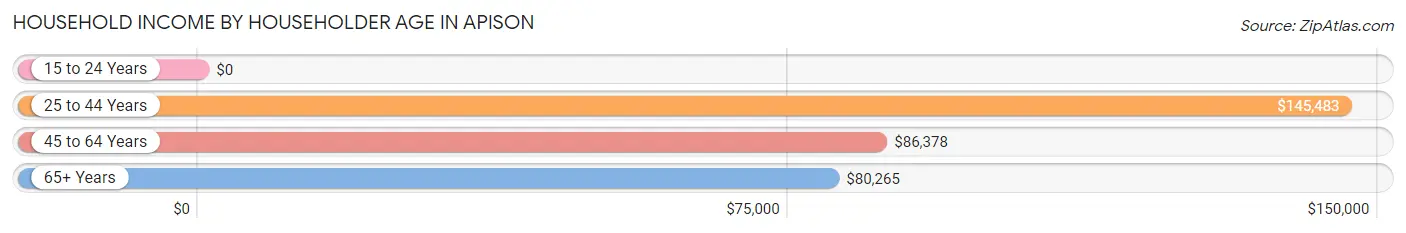
| Income Bracket | # Households | Median Income |
| 15 to 24 Years | 52 (3.4%) | $0 |
| 25 to 44 Years | 279 (18.0%) | $145,483 |
| 45 to 64 Years | 908 (58.5%) | $86,378 |
| 65+ Years | 313 (20.2%) | $80,265 |
| Total | 1,552 (100.0%) | $86,167 |
Poverty in Apison
Income Below Poverty by Sex and Age in Apison
With 9.3% poverty level for males and 19.0% for females among the residents of Apison, 5 year old males and under 5 year old females are the most vulnerable to poverty, with 10 males (28.6%) and 139 females (59.9%) in their respective age groups living below the poverty level.
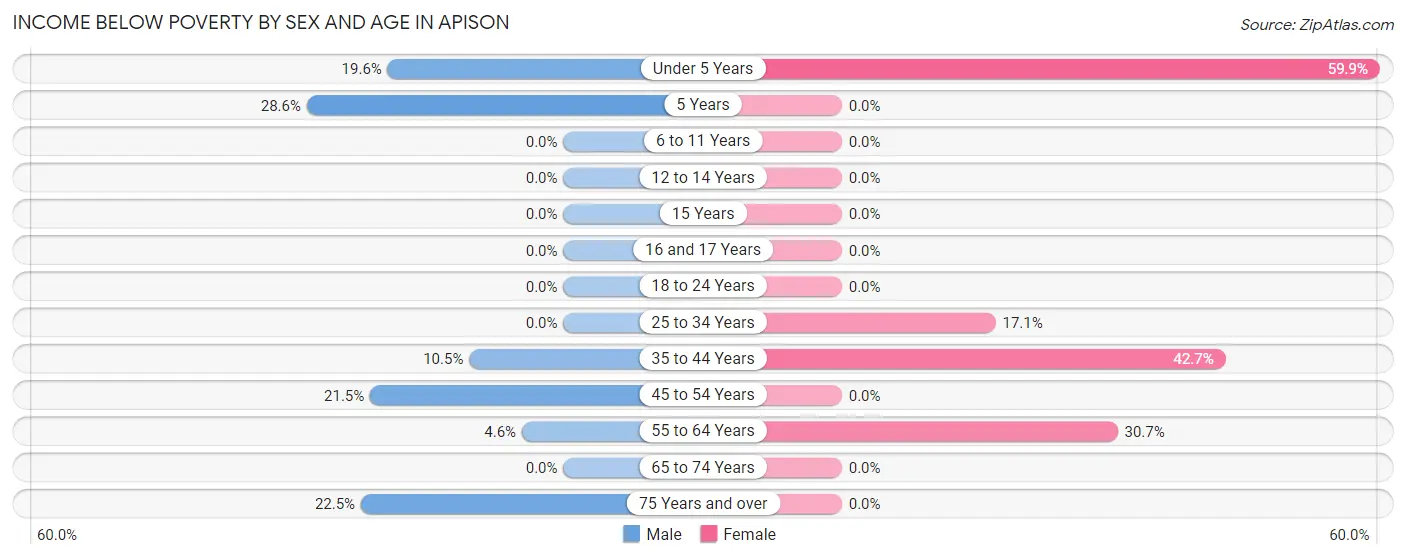
| Age Bracket | Male | Female |
| Under 5 Years | 9 (19.6%) | 139 (59.9%) |
| 5 Years | 10 (28.6%) | 0 (0.0%) |
| 6 to 11 Years | 0 (0.0%) | 0 (0.0%) |
| 12 to 14 Years | 0 (0.0%) | 0 (0.0%) |
| 15 Years | 0 (0.0%) | 0 (0.0%) |
| 16 and 17 Years | 0 (0.0%) | 0 (0.0%) |
| 18 to 24 Years | 0 (0.0%) | 0 (0.0%) |
| 25 to 34 Years | 0 (0.0%) | 19 (17.1%) |
| 35 to 44 Years | 26 (10.5%) | 191 (42.7%) |
| 45 to 54 Years | 102 (21.5%) | 0 (0.0%) |
| 55 to 64 Years | 19 (4.6%) | 78 (30.7%) |
| 65 to 74 Years | 0 (0.0%) | 0 (0.0%) |
| 75 Years and over | 16 (22.5%) | 0 (0.0%) |
| Total | 182 (9.3%) | 427 (19.0%) |
Income Above Poverty by Sex and Age in Apison
According to the poverty statistics in Apison, males aged 6 to 11 years and females aged 5 years are the age groups that are most secure financially, with 100.0% of males and 100.0% of females in these age groups living above the poverty line.
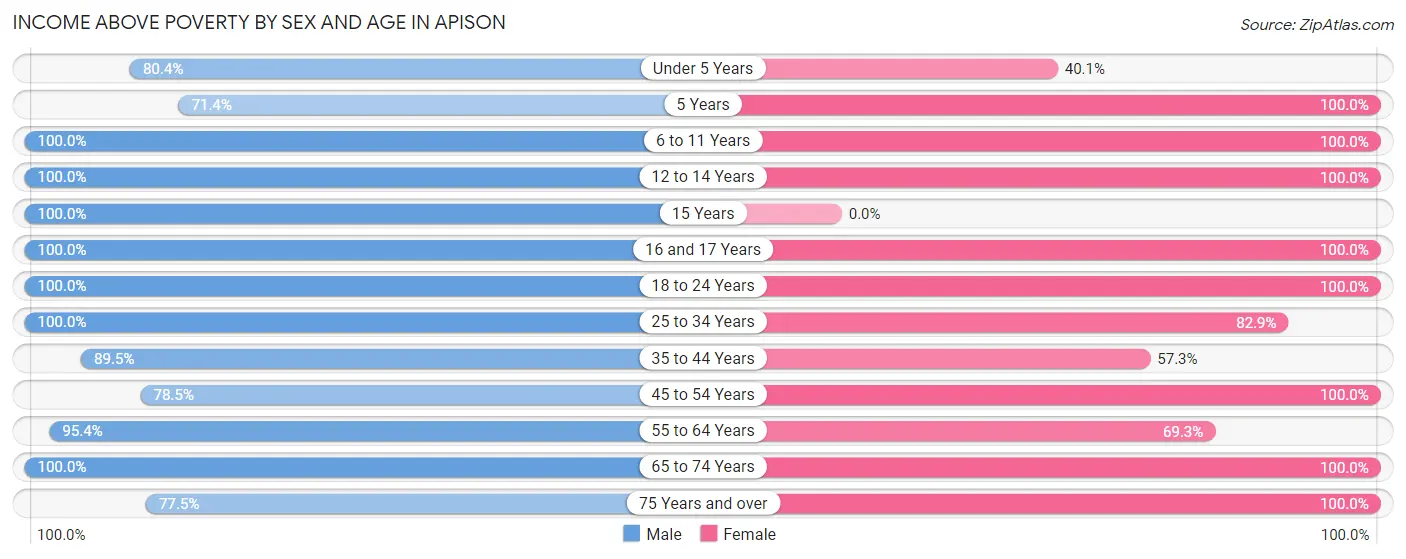
| Age Bracket | Male | Female |
| Under 5 Years | 37 (80.4%) | 93 (40.1%) |
| 5 Years | 25 (71.4%) | 39 (100.0%) |
| 6 to 11 Years | 185 (100.0%) | 103 (100.0%) |
| 12 to 14 Years | 59 (100.0%) | 119 (100.0%) |
| 15 Years | 12 (100.0%) | 0 (0.0%) |
| 16 and 17 Years | 23 (100.0%) | 65 (100.0%) |
| 18 to 24 Years | 187 (100.0%) | 121 (100.0%) |
| 25 to 34 Years | 46 (100.0%) | 92 (82.9%) |
| 35 to 44 Years | 222 (89.5%) | 256 (57.3%) |
| 45 to 54 Years | 372 (78.5%) | 479 (100.0%) |
| 55 to 64 Years | 393 (95.4%) | 176 (69.3%) |
| 65 to 74 Years | 148 (100.0%) | 174 (100.0%) |
| 75 Years and over | 55 (77.5%) | 109 (100.0%) |
| Total | 1,764 (90.6%) | 1,826 (81.0%) |
Income Below Poverty Among Married-Couple Families in Apison
The poverty statistics for married-couple families in Apison show that 10.7% or 127 of the total 1,186 families live below the poverty line. Families with 1 or 2 children have the highest poverty rate of 32.2%, comprising of 127 families. On the other hand, families with no children have the lowest poverty rate of 0.0%, which includes 0 families.
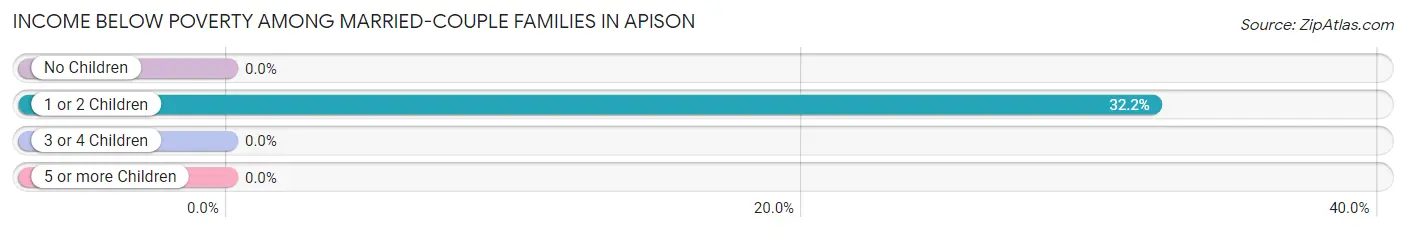
| Children | Above Poverty | Below Poverty |
| No Children | 690 (100.0%) | 0 (0.0%) |
| 1 or 2 Children | 268 (67.8%) | 127 (32.2%) |
| 3 or 4 Children | 83 (100.0%) | 0 (0.0%) |
| 5 or more Children | 18 (100.0%) | 0 (0.0%) |
| Total | 1,059 (89.3%) | 127 (10.7%) |
Income Below Poverty Among Single-Parent Households in Apison
| Children | Single Father | Single Mother |
| No Children | 0 (0.0%) | 0 (0.0%) |
| 1 or 2 Children | 0 (0.0%) | 0 (0.0%) |
| 3 or 4 Children | 0 (0.0%) | 0 (0.0%) |
| 5 or more Children | 0 (0.0%) | 0 (0.0%) |
| Total | 0 (0.0%) | 0 (0.0%) |
Income Below Poverty Among Married-Couple vs Single-Parent Households in Apison
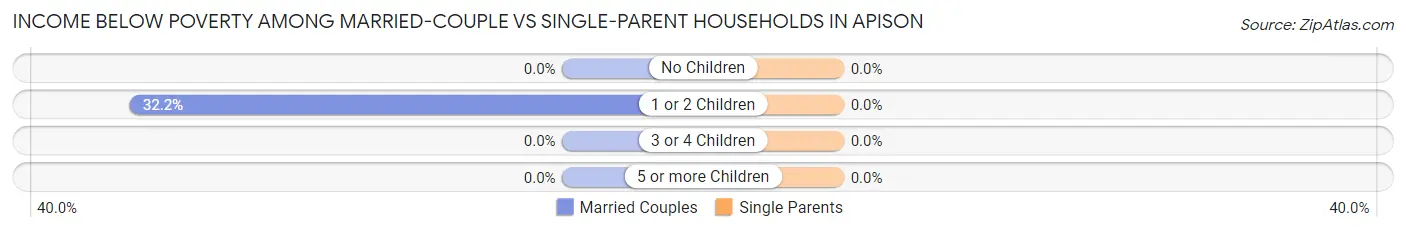
| Children | Married-Couple Families | Single-Parent Households |
| No Children | 0 (0.0%) | 0 (0.0%) |
| 1 or 2 Children | 127 (32.2%) | 0 (0.0%) |
| 3 or 4 Children | 0 (0.0%) | 0 (0.0%) |
| 5 or more Children | 0 (0.0%) | 0 (0.0%) |
| Total | 127 (10.7%) | 0 (0.0%) |
Race in Apison
The most populous races in Apison are White / Caucasian (3,951 | 94.1%), Two or more Races (159 | 3.8%), and Hispanic or Latino (102 | 2.4%).
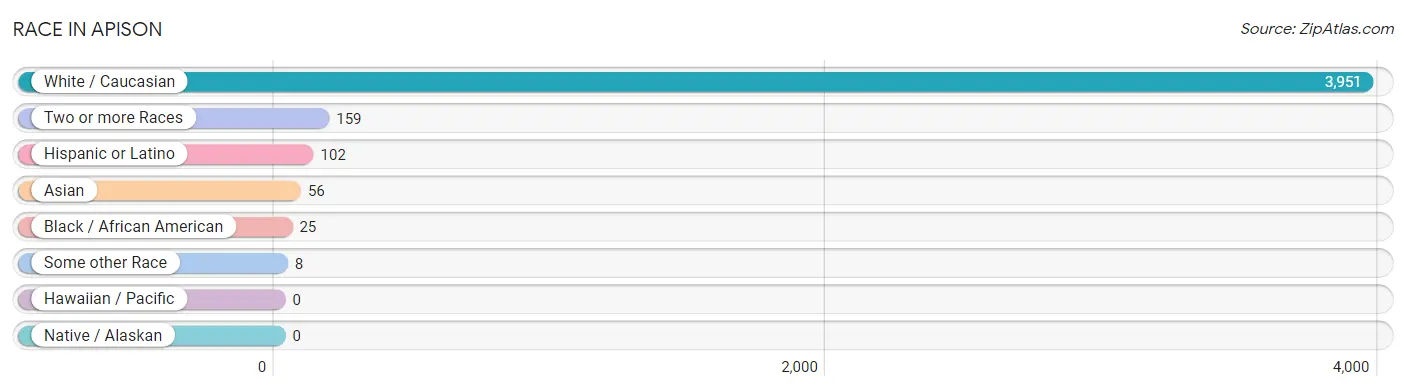
| Race | # Population | % Population |
| Asian | 56 | 1.3% |
| Black / African American | 25 | 0.6% |
| Hawaiian / Pacific | 0 | 0.0% |
| Hispanic or Latino | 102 | 2.4% |
| Native / Alaskan | 0 | 0.0% |
| White / Caucasian | 3,951 | 94.1% |
| Two or more Races | 159 | 3.8% |
| Some other Race | 8 | 0.2% |
| Total | 4,199 | 100.0% |
Ancestry in Apison
The most populous ancestries reported in Apison are American (774 | 18.4%), English (726 | 17.3%), German (404 | 9.6%), Scottish (279 | 6.6%), and Irish (223 | 5.3%), together accounting for 57.3% of all Apison residents.
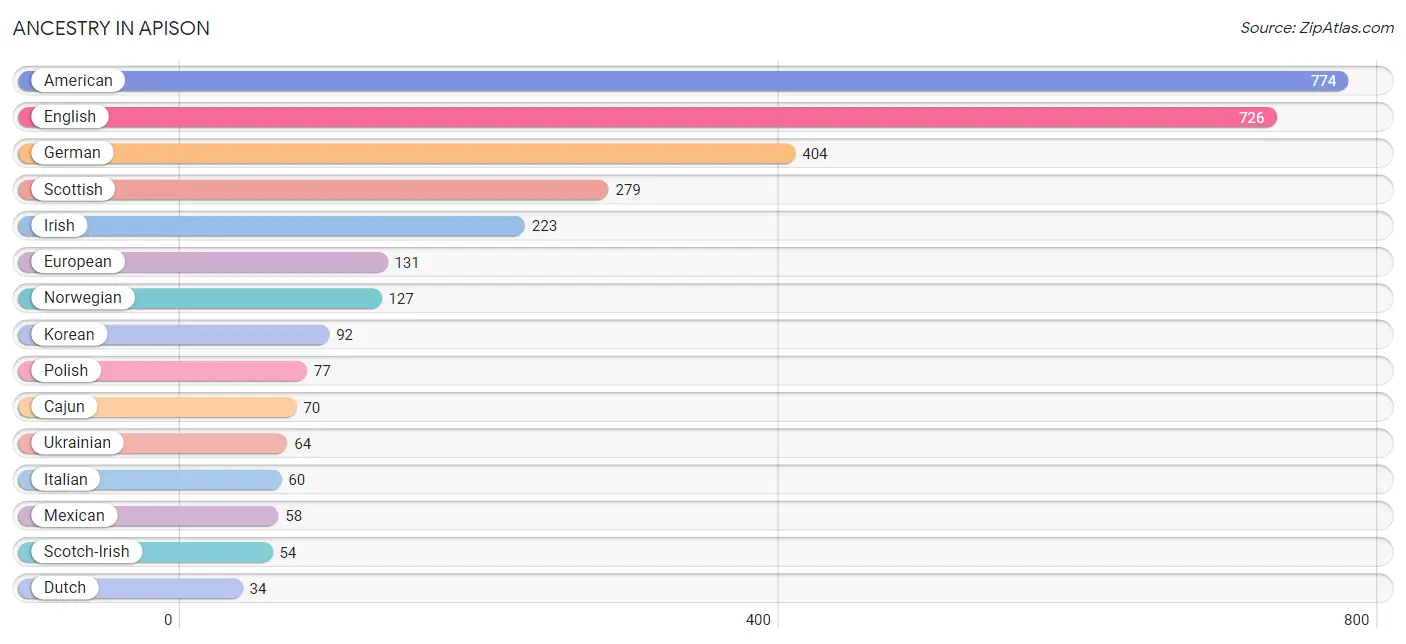
| Ancestry | # Population | % Population |
| American | 774 | 18.4% |
| Arab | 19 | 0.4% |
| British | 32 | 0.8% |
| Burmese | 17 | 0.4% |
| Cajun | 70 | 1.7% |
| Cherokee | 17 | 0.4% |
| Danish | 13 | 0.3% |
| Dutch | 34 | 0.8% |
| Eastern European | 20 | 0.5% |
| English | 726 | 17.3% |
| European | 131 | 3.1% |
| French | 29 | 0.7% |
| French Canadian | 11 | 0.3% |
| German | 404 | 9.6% |
| Irish | 223 | 5.3% |
| Italian | 60 | 1.4% |
| Korean | 92 | 2.2% |
| Latvian | 13 | 0.3% |
| Lebanese | 19 | 0.4% |
| Mexican | 58 | 1.4% |
| Norwegian | 127 | 3.0% |
| Peruvian | 13 | 0.3% |
| Polish | 77 | 1.8% |
| Puerto Rican | 31 | 0.7% |
| Scotch-Irish | 54 | 1.3% |
| Scottish | 279 | 6.6% |
| South American | 13 | 0.3% |
| Swedish | 11 | 0.3% |
| Ukrainian | 64 | 1.5% |
| Yugoslavian | 16 | 0.4% | View All 30 Rows |
Immigrants in Apison
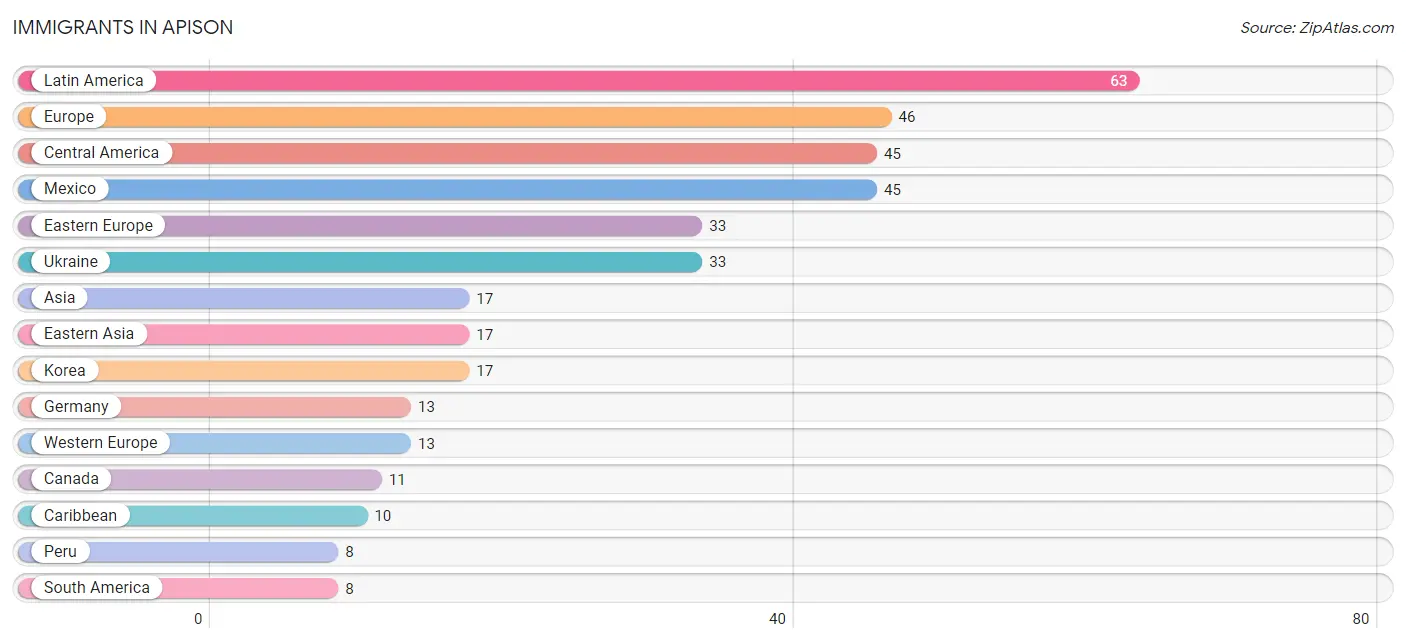
The most numerous immigrant groups reported in Apison came from Latin America (63 | 1.5%), Europe (46 | 1.1%), Central America (45 | 1.1%), Mexico (45 | 1.1%), and Eastern Europe (33 | 0.8%), together accounting for 5.5% of all Apison residents.
| Immigration Origin | # Population | % Population |
| Asia | 17 | 0.4% |
| Canada | 11 | 0.3% |
| Caribbean | 10 | 0.2% |
| Central America | 45 | 1.1% |
| Eastern Asia | 17 | 0.4% |
| Eastern Europe | 33 | 0.8% |
| Europe | 46 | 1.1% |
| Germany | 13 | 0.3% |
| Korea | 17 | 0.4% |
| Latin America | 63 | 1.5% |
| Mexico | 45 | 1.1% |
| Peru | 8 | 0.2% |
| South America | 8 | 0.2% |
| Ukraine | 33 | 0.8% |
| Western Europe | 13 | 0.3% | View All 15 Rows |
Sex and Age in Apison
Sex and Age in Apison
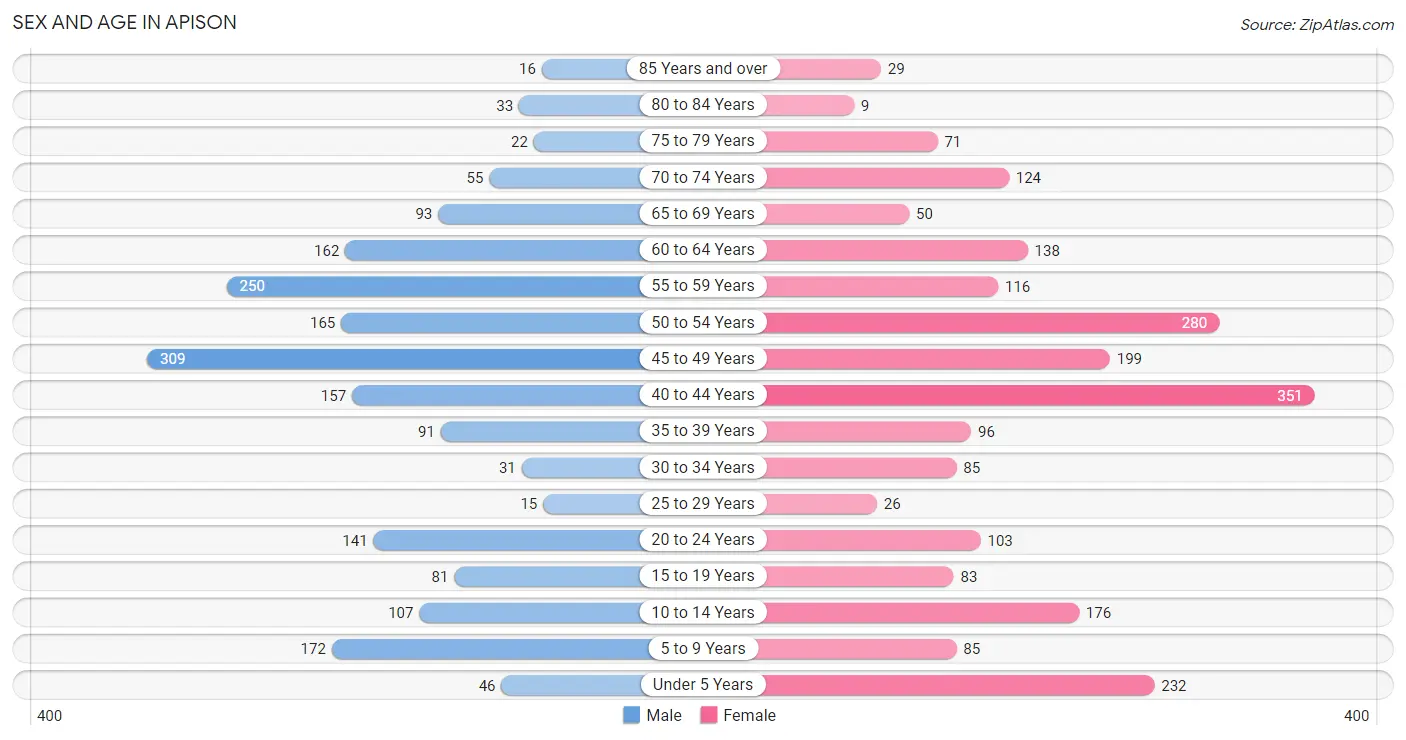
The most populous age groups in Apison are 45 to 49 Years (309 | 15.9%) for men and 40 to 44 Years (351 | 15.6%) for women.
| Age Bracket | Male | Female |
| Under 5 Years | 46 (2.4%) | 232 (10.3%) |
| 5 to 9 Years | 172 (8.8%) | 85 (3.8%) |
| 10 to 14 Years | 107 (5.5%) | 176 (7.8%) |
| 15 to 19 Years | 81 (4.2%) | 83 (3.7%) |
| 20 to 24 Years | 141 (7.2%) | 103 (4.6%) |
| 25 to 29 Years | 15 (0.8%) | 26 (1.1%) |
| 30 to 34 Years | 31 (1.6%) | 85 (3.8%) |
| 35 to 39 Years | 91 (4.7%) | 96 (4.3%) |
| 40 to 44 Years | 157 (8.1%) | 351 (15.6%) |
| 45 to 49 Years | 309 (15.9%) | 199 (8.8%) |
| 50 to 54 Years | 165 (8.5%) | 280 (12.4%) |
| 55 to 59 Years | 250 (12.9%) | 116 (5.1%) |
| 60 to 64 Years | 162 (8.3%) | 138 (6.1%) |
| 65 to 69 Years | 93 (4.8%) | 50 (2.2%) |
| 70 to 74 Years | 55 (2.8%) | 124 (5.5%) |
| 75 to 79 Years | 22 (1.1%) | 71 (3.2%) |
| 80 to 84 Years | 33 (1.7%) | 9 (0.4%) |
| 85 Years and over | 16 (0.8%) | 29 (1.3%) |
| Total | 1,946 (100.0%) | 2,253 (100.0%) |
Families and Households in Apison
Median Family Size in Apison
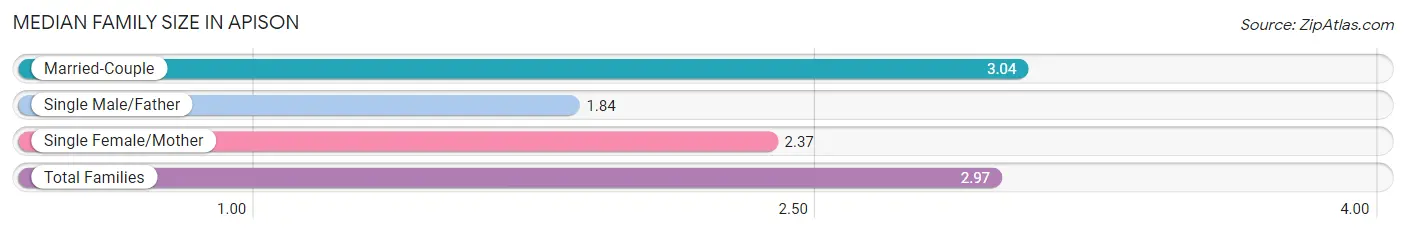
The median family size in Apison is 2.97 persons per family, with married-couple families (1,186 | 91.2%) accounting for the largest median family size of 3.04 persons per family. On the other hand, single male/father families (31 | 2.4%) represent the smallest median family size with 1.84 persons per family.
| Family Type | # Families | Family Size |
| Married-Couple | 1,186 (91.2%) | 3.04 |
| Single Male/Father | 31 (2.4%) | 1.84 |
| Single Female/Mother | 83 (6.4%) | 2.37 |
| Total Families | 1,300 (100.0%) | 2.97 |
Median Household Size in Apison
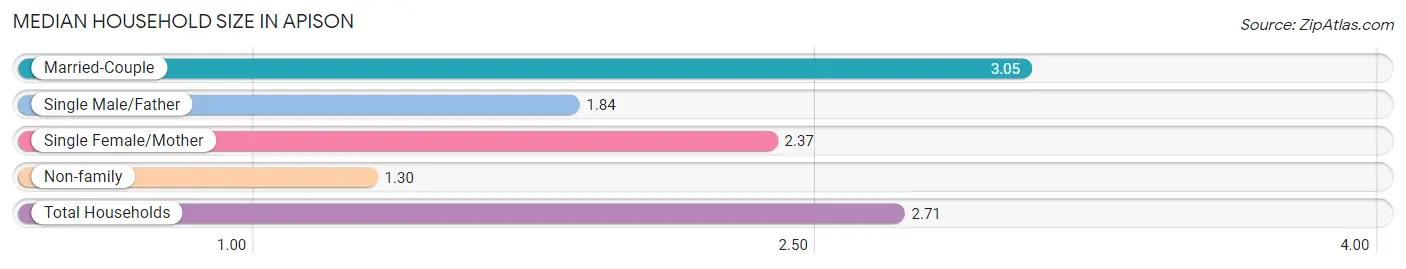
The median household size in Apison is 2.71 persons per household, with married-couple households (1,186 | 76.4%) accounting for the largest median household size of 3.05 persons per household. non-family households (252 | 16.2%) represent the smallest median household size with 1.30 persons per household.
| Household Type | # Households | Household Size |
| Married-Couple | 1,186 (76.4%) | 3.05 |
| Single Male/Father | 31 (2.0%) | 1.84 |
| Single Female/Mother | 83 (5.3%) | 2.37 |
| Non-family | 252 (16.2%) | 1.30 |
| Total Households | 1,552 (100.0%) | 2.71 |
Household Size by Marriage Status in Apison
Out of a total of 1,552 households in Apison, 1,300 (83.8%) are family households, while 252 (16.2%) are nonfamily households. The most numerous type of family households are 2-person households, comprising 625, and the most common type of nonfamily households are 1-person households, comprising 189.
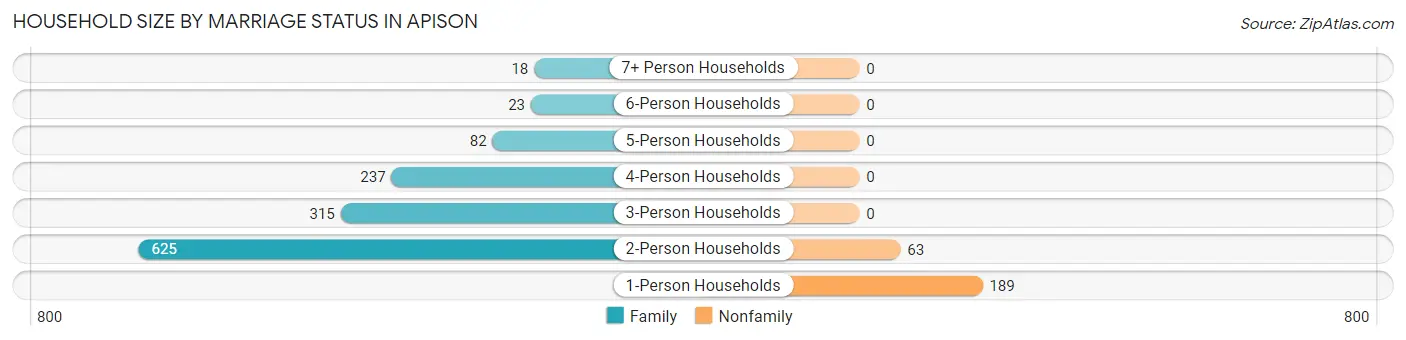
| Household Size | Family Households | Nonfamily Households |
| 1-Person Households | - | 189 (12.2%) |
| 2-Person Households | 625 (40.3%) | 63 (4.1%) |
| 3-Person Households | 315 (20.3%) | 0 (0.0%) |
| 4-Person Households | 237 (15.3%) | 0 (0.0%) |
| 5-Person Households | 82 (5.3%) | 0 (0.0%) |
| 6-Person Households | 23 (1.5%) | 0 (0.0%) |
| 7+ Person Households | 18 (1.2%) | 0 (0.0%) |
| Total | 1,300 (83.8%) | 252 (16.2%) |
Female Fertility in Apison
Fertility by Age in Apison
Average fertility rate in Apison is 32.0 births per 1,000 women. Women in the age bracket of 35 to 50 years have the highest fertility rate with 45.0 births per 1,000 women. Women in the age bracket of 35 to 50 years acount for 100.0% of all women with births.
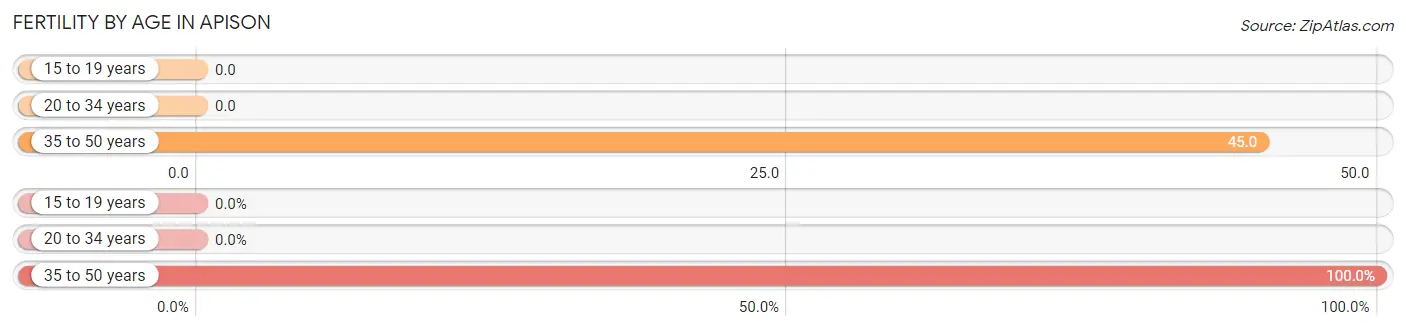
| Age Bracket | Women with Births | Births / 1,000 Women |
| 15 to 19 years | 0 (0.0%) | 0.0 |
| 20 to 34 years | 0 (0.0%) | 0.0 |
| 35 to 50 years | 32 (100.0%) | 45.0 |
| Total | 32 (100.0%) | 32.0 |
Fertility by Age by Marriage Status in Apison
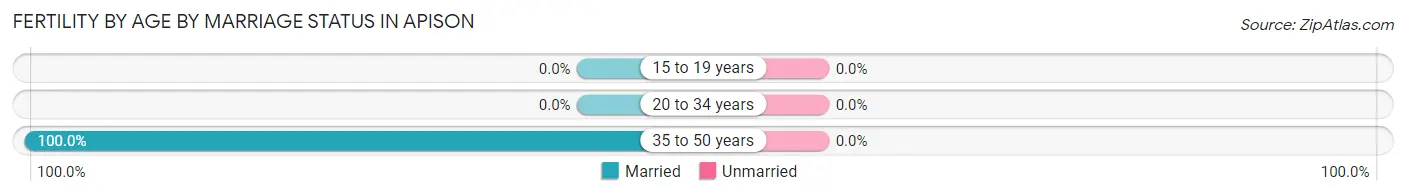
| Age Bracket | Married | Unmarried |
| 15 to 19 years | 0 (0.0%) | 0 (0.0%) |
| 20 to 34 years | 0 (0.0%) | 0 (0.0%) |
| 35 to 50 years | 32 (100.0%) | 0 (0.0%) |
| Total | 32 (100.0%) | 0 (0.0%) |
Fertility by Education in Apison
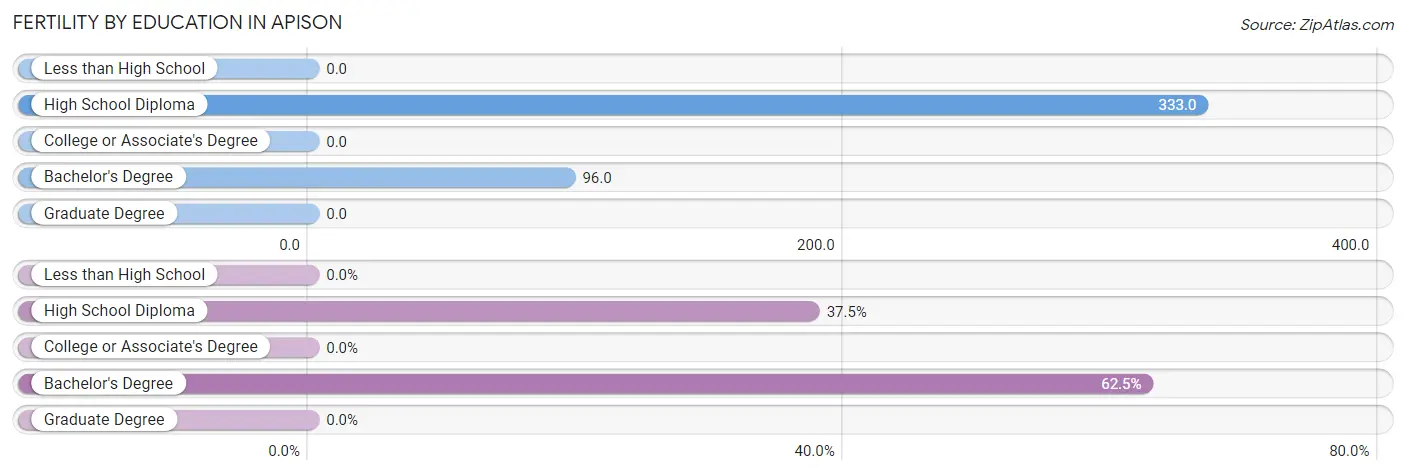
| Educational Attainment | Women with Births | Births / 1,000 Women |
| Less than High School | 0 (0.0%) | 0.0 |
| High School Diploma | 12 (37.5%) | 333.0 |
| College or Associate's Degree | 0 (0.0%) | 0.0 |
| Bachelor's Degree | 20 (62.5%) | 96.0 |
| Graduate Degree | 0 (0.0%) | 0.0 |
| Total | 32 (100.0%) | 32.0 |
Fertility by Education by Marriage Status in Apison
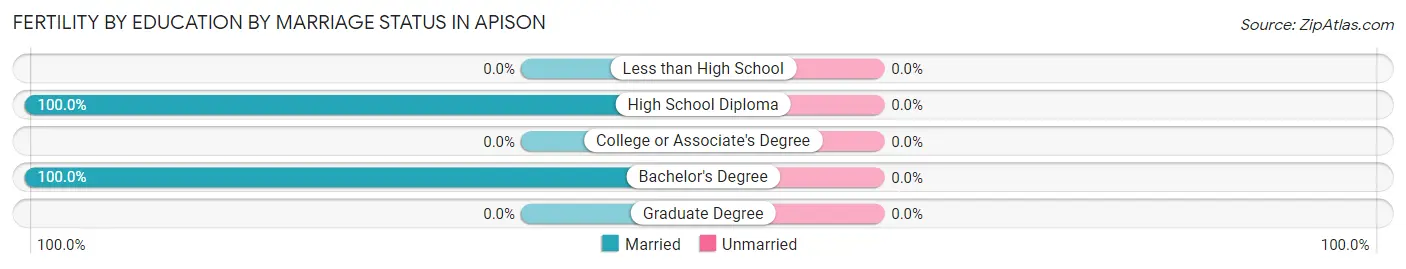
| Educational Attainment | Married | Unmarried |
| Less than High School | 0 (0.0%) | 0 (0.0%) |
| High School Diploma | 12 (100.0%) | 0 (0.0%) |
| College or Associate's Degree | 0 (0.0%) | 0 (0.0%) |
| Bachelor's Degree | 20 (100.0%) | 0 (0.0%) |
| Graduate Degree | 0 (0.0%) | 0 (0.0%) |
| Total | 32 (100.0%) | 0 (0.0%) |
Employment Characteristics in Apison
Employment by Class of Employer in Apison
Among the 2,104 employed individuals in Apison, private company employees (1,456 | 69.2%), self-employed (not incorporated) (355 | 16.9%), and not-for-profit organizations (118 | 5.6%) make up the most common classes of employment.
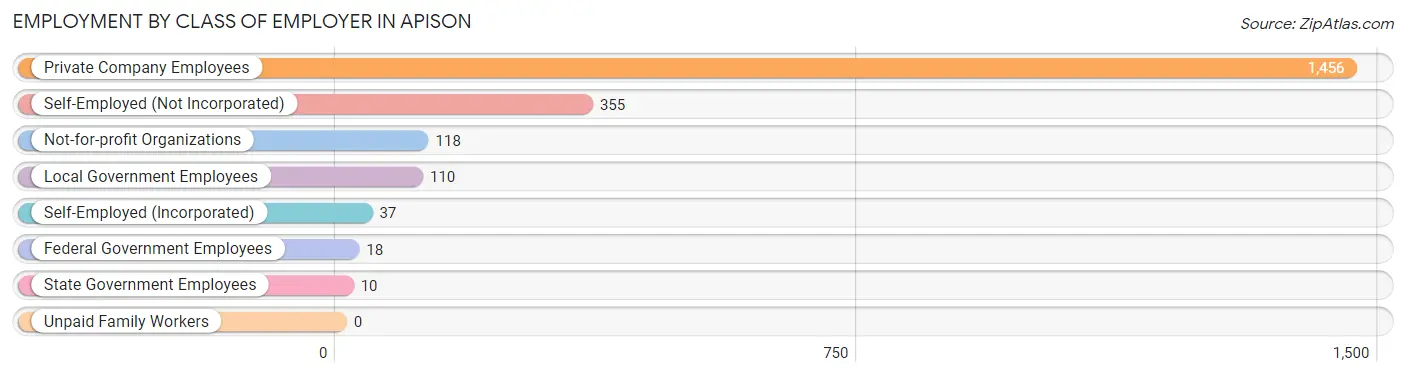
| Employer Class | # Employees | % Employees |
| Private Company Employees | 1,456 | 69.2% |
| Self-Employed (Incorporated) | 37 | 1.8% |
| Self-Employed (Not Incorporated) | 355 | 16.9% |
| Not-for-profit Organizations | 118 | 5.6% |
| Local Government Employees | 110 | 5.2% |
| State Government Employees | 10 | 0.5% |
| Federal Government Employees | 18 | 0.9% |
| Unpaid Family Workers | 0 | 0.0% |
| Total | 2,104 | 100.0% |
Employment Status by Age in Apison
According to the labor force statistics for Apison, out of the total population over 16 years of age (3,369), 63.2% or 2,129 individuals are in the labor force, with 1.1% or 23 of them unemployed. The age group with the highest labor force participation rate is 25 to 29 years, with 100.0% or 41 individuals in the labor force. Within the labor force, the 16 to 19 years age range has the highest percentage of unemployed individuals, with 11.6% or 10 of them being unemployed.
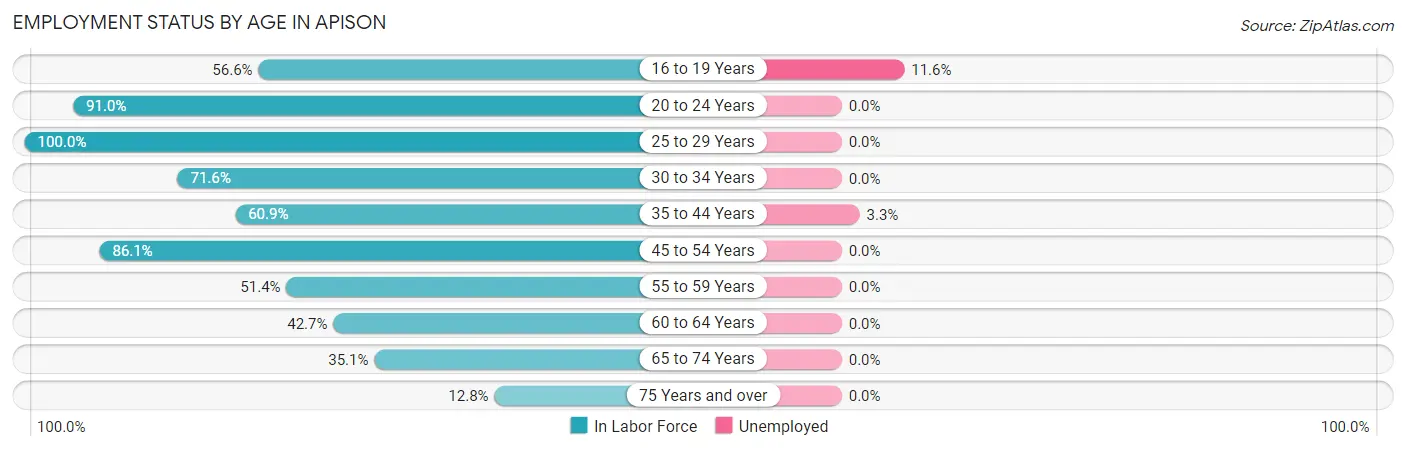
| Age Bracket | In Labor Force | Unemployed |
| 16 to 19 Years | 86 (56.6%) | 10 (11.6%) |
| 20 to 24 Years | 222 (91.0%) | 0 (0.0%) |
| 25 to 29 Years | 41 (100.0%) | 0 (0.0%) |
| 30 to 34 Years | 83 (71.6%) | 0 (0.0%) |
| 35 to 44 Years | 423 (60.9%) | 14 (3.3%) |
| 45 to 54 Years | 821 (86.1%) | 0 (0.0%) |
| 55 to 59 Years | 188 (51.4%) | 0 (0.0%) |
| 60 to 64 Years | 128 (42.7%) | 0 (0.0%) |
| 65 to 74 Years | 113 (35.1%) | 0 (0.0%) |
| 75 Years and over | 23 (12.8%) | 0 (0.0%) |
| Total | 2,129 (63.2%) | 23 (1.1%) |
Employment Status by Educational Attainment in Apison
According to labor force statistics for Apison, 68.2% of individuals (1,685) out of the total population between 25 and 64 years of age (2,471) are in the labor force, with 0.8% or 13 of them being unemployed. The group with the highest labor force participation rate are those with the educational attainment of bachelor's degree or higher, with 83.2% or 790 individuals in the labor force. Within the labor force, individuals with less than high school education have the highest percentage of unemployment, with 19.2% or 14 of them being unemployed.
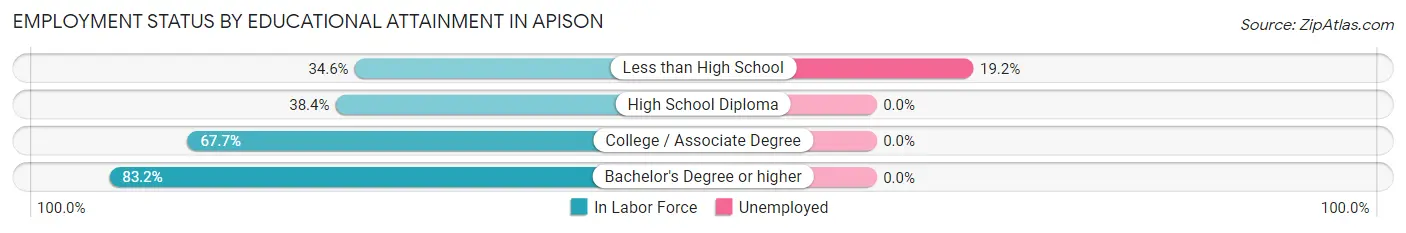
| Educational Attainment | In Labor Force | Unemployed |
| Less than High School | 73 (34.6%) | 41 (19.2%) |
| High School Diploma | 88 (38.4%) | 0 (0.0%) |
| College / Associate Degree | 733 (67.7%) | 0 (0.0%) |
| Bachelor's Degree or higher | 790 (83.2%) | 0 (0.0%) |
| Total | 1,685 (68.2%) | 20 (0.8%) |
Employment Occupations by Sex in Apison
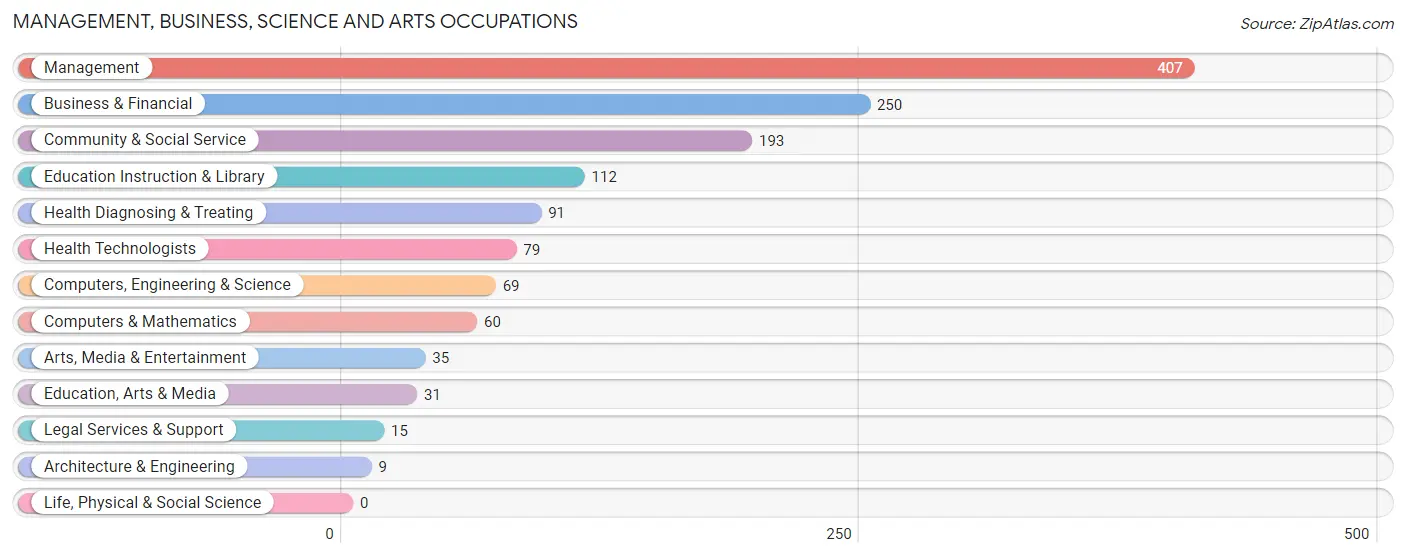
Management, Business, Science and Arts Occupations
The most common Management, Business, Science and Arts occupations in Apison are Management (407 | 19.3%), Business & Financial (250 | 11.9%), Community & Social Service (193 | 9.2%), Education Instruction & Library (112 | 5.3%), and Health Diagnosing & Treating (91 | 4.3%).
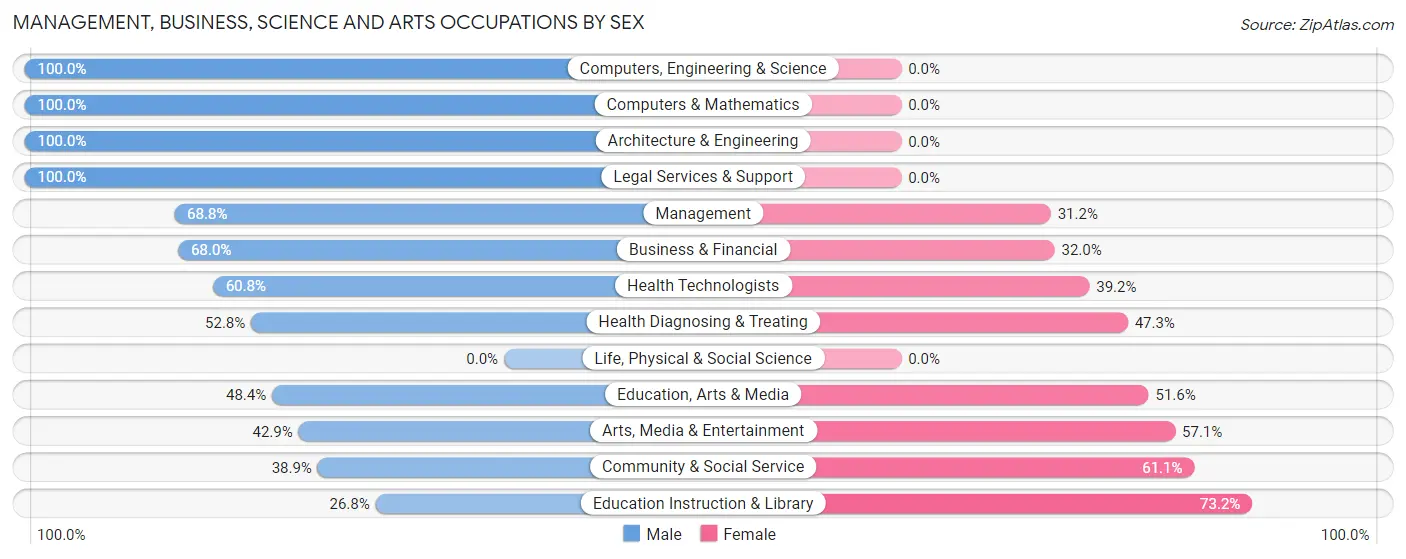
Management, Business, Science and Arts Occupations by Sex
Within the Management, Business, Science and Arts occupations in Apison, the most male-oriented occupations are Computers, Engineering & Science (100.0%), Computers & Mathematics (100.0%), and Architecture & Engineering (100.0%), while the most female-oriented occupations are Education Instruction & Library (73.2%), Community & Social Service (61.1%), and Arts, Media & Entertainment (57.1%).
| Occupation | Male | Female |
| Management | 280 (68.8%) | 127 (31.2%) |
| Business & Financial | 170 (68.0%) | 80 (32.0%) |
| Computers, Engineering & Science | 69 (100.0%) | 0 (0.0%) |
| Computers & Mathematics | 60 (100.0%) | 0 (0.0%) |
| Architecture & Engineering | 9 (100.0%) | 0 (0.0%) |
| Life, Physical & Social Science | 0 (0.0%) | 0 (0.0%) |
| Community & Social Service | 75 (38.9%) | 118 (61.1%) |
| Education, Arts & Media | 15 (48.4%) | 16 (51.6%) |
| Legal Services & Support | 15 (100.0%) | 0 (0.0%) |
| Education Instruction & Library | 30 (26.8%) | 82 (73.2%) |
| Arts, Media & Entertainment | 15 (42.9%) | 20 (57.1%) |
| Health Diagnosing & Treating | 48 (52.7%) | 43 (47.2%) |
| Health Technologists | 48 (60.8%) | 31 (39.2%) |
| Total (Category) | 642 (63.6%) | 368 (36.4%) |
| Total (Overall) | 1,171 (55.7%) | 933 (44.3%) |
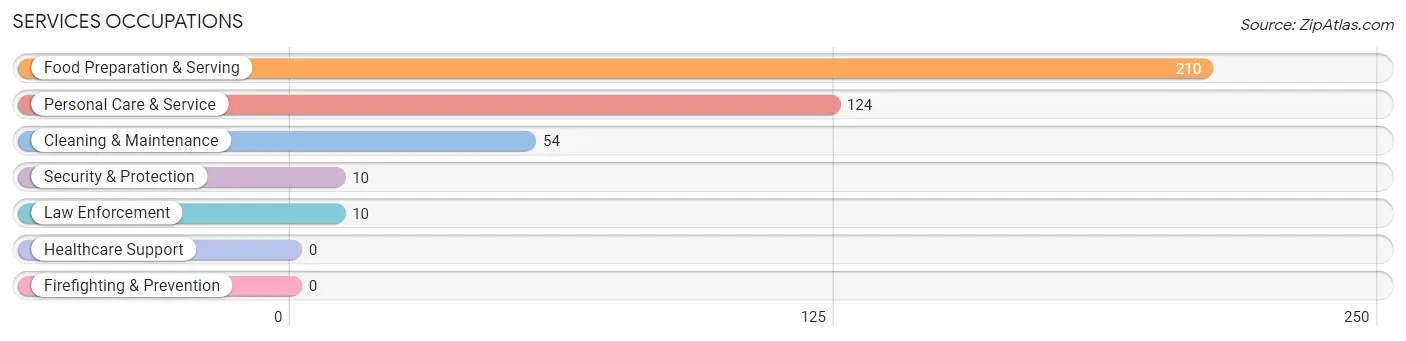
Services Occupations
The most common Services occupations in Apison are Food Preparation & Serving (210 | 10.0%), Personal Care & Service (124 | 5.9%), Cleaning & Maintenance (54 | 2.6%), Security & Protection (10 | 0.5%), and Law Enforcement (10 | 0.5%).
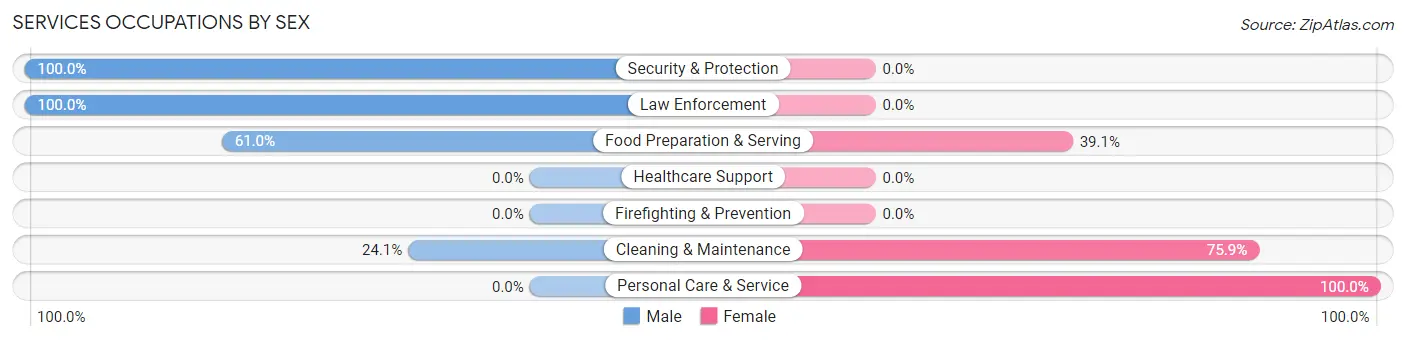
Services Occupations by Sex
Within the Services occupations in Apison, the most male-oriented occupations are Security & Protection (100.0%), Law Enforcement (100.0%), and Food Preparation & Serving (61.0%), while the most female-oriented occupations are Personal Care & Service (100.0%), Cleaning & Maintenance (75.9%), and Food Preparation & Serving (39.1%).
| Occupation | Male | Female |
| Healthcare Support | 0 (0.0%) | 0 (0.0%) |
| Security & Protection | 10 (100.0%) | 0 (0.0%) |
| Firefighting & Prevention | 0 (0.0%) | 0 (0.0%) |
| Law Enforcement | 10 (100.0%) | 0 (0.0%) |
| Food Preparation & Serving | 128 (61.0%) | 82 (39.1%) |
| Cleaning & Maintenance | 13 (24.1%) | 41 (75.9%) |
| Personal Care & Service | 0 (0.0%) | 124 (100.0%) |
| Total (Category) | 151 (37.9%) | 247 (62.1%) |
| Total (Overall) | 1,171 (55.7%) | 933 (44.3%) |
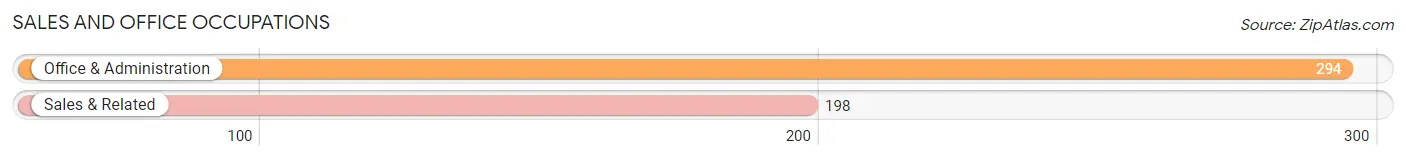
Sales and Office Occupations
The most common Sales and Office occupations in Apison are Office & Administration (294 | 14.0%), and Sales & Related (198 | 9.4%).
Sales and Office Occupations by Sex
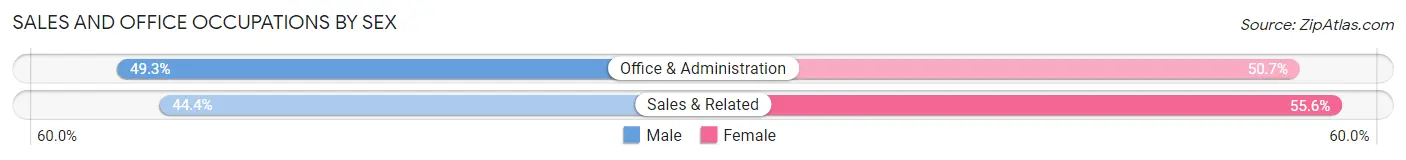
| Occupation | Male | Female |
| Sales & Related | 88 (44.4%) | 110 (55.6%) |
| Office & Administration | 145 (49.3%) | 149 (50.7%) |
| Total (Category) | 233 (47.4%) | 259 (52.6%) |
| Total (Overall) | 1,171 (55.7%) | 933 (44.3%) |
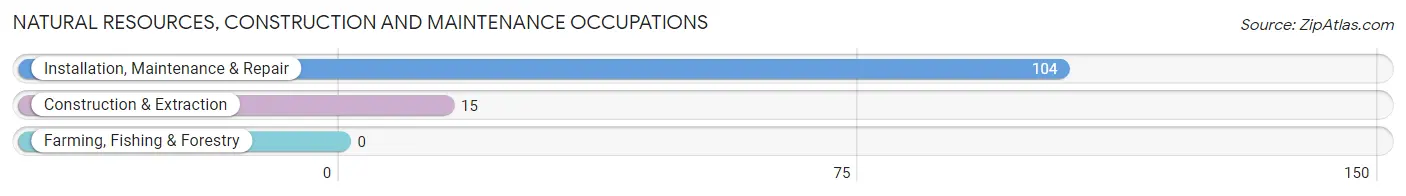
Natural Resources, Construction and Maintenance Occupations
The most common Natural Resources, Construction and Maintenance occupations in Apison are Installation, Maintenance & Repair (104 | 4.9%), and Construction & Extraction (15 | 0.7%).
Natural Resources, Construction and Maintenance Occupations by Sex
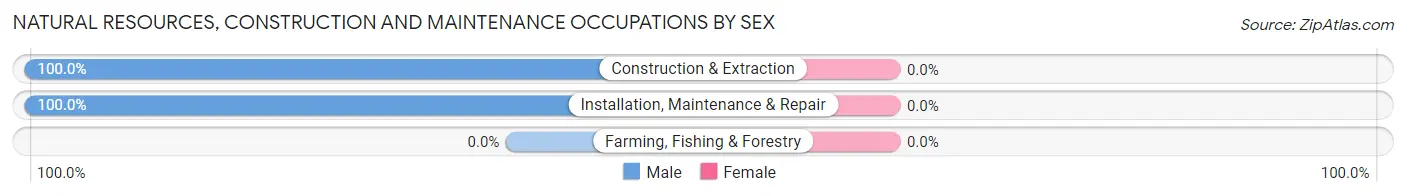
| Occupation | Male | Female |
| Farming, Fishing & Forestry | 0 (0.0%) | 0 (0.0%) |
| Construction & Extraction | 15 (100.0%) | 0 (0.0%) |
| Installation, Maintenance & Repair | 104 (100.0%) | 0 (0.0%) |
| Total (Category) | 119 (100.0%) | 0 (0.0%) |
| Total (Overall) | 1,171 (55.7%) | 933 (44.3%) |
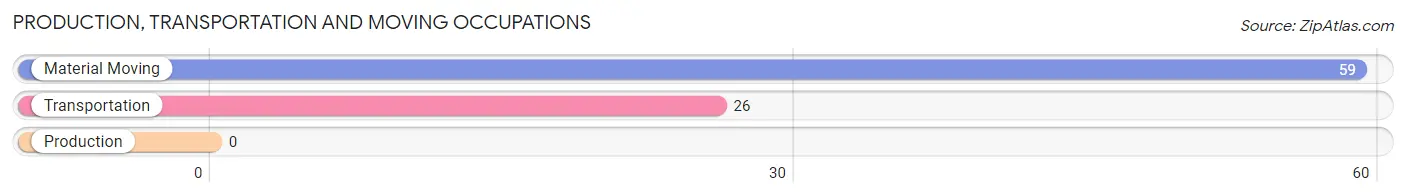
Production, Transportation and Moving Occupations
The most common Production, Transportation and Moving occupations in Apison are Material Moving (59 | 2.8%), and Transportation (26 | 1.2%).
Production, Transportation and Moving Occupations by Sex
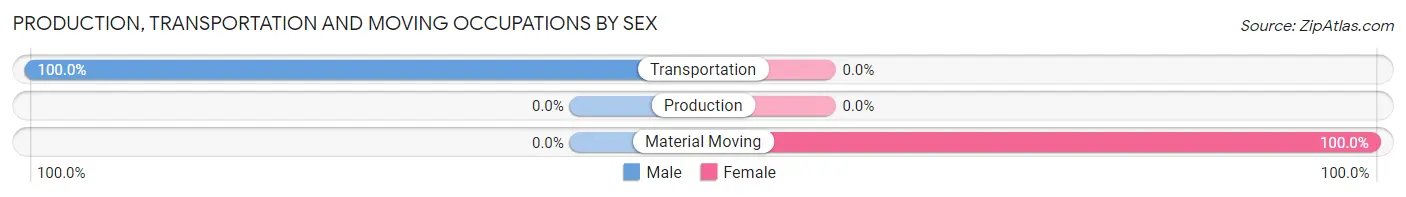
| Occupation | Male | Female |
| Production | 0 (0.0%) | 0 (0.0%) |
| Transportation | 26 (100.0%) | 0 (0.0%) |
| Material Moving | 0 (0.0%) | 59 (100.0%) |
| Total (Category) | 26 (30.6%) | 59 (69.4%) |
| Total (Overall) | 1,171 (55.7%) | 933 (44.3%) |
Employment Industries by Sex in Apison
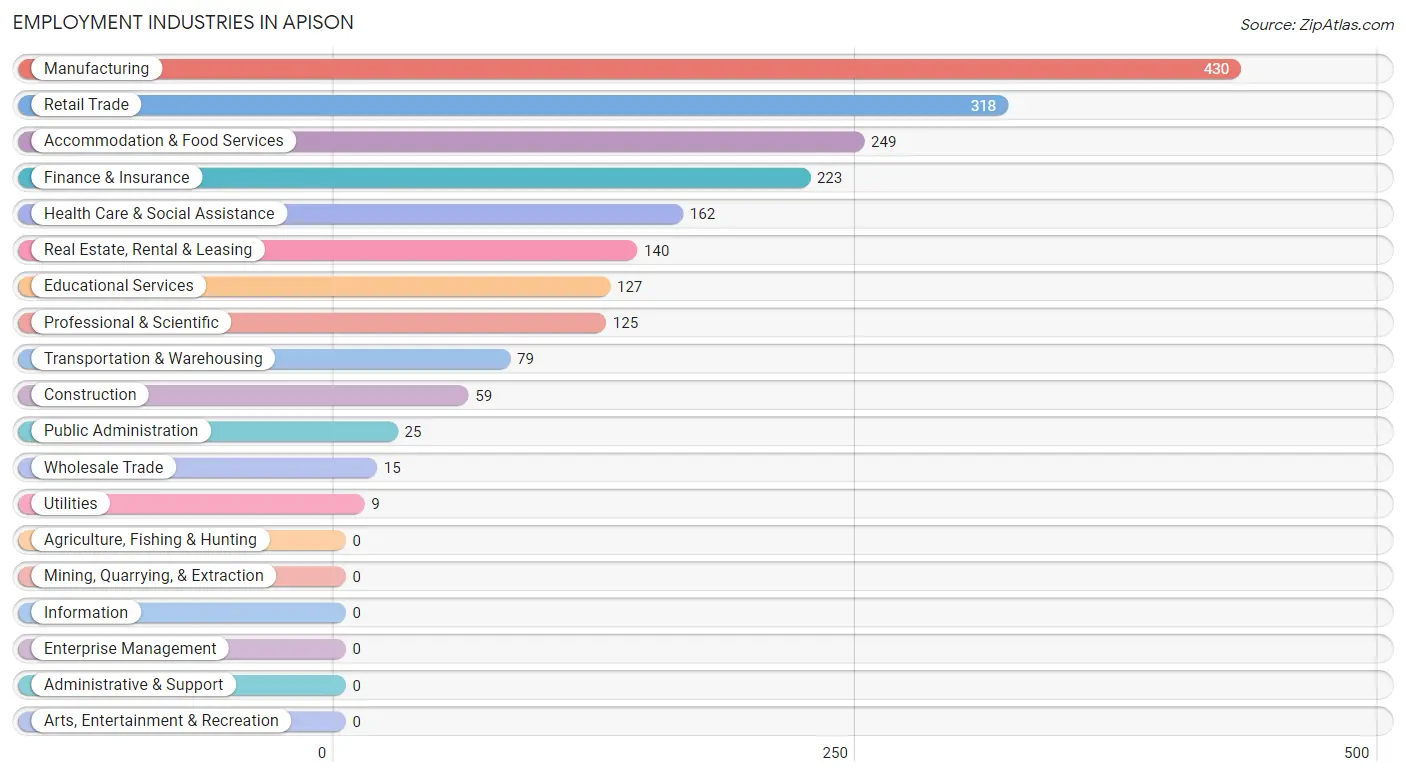
Employment Industries in Apison
The major employment industries in Apison include Manufacturing (430 | 20.4%), Retail Trade (318 | 15.1%), Accommodation & Food Services (249 | 11.8%), Finance & Insurance (223 | 10.6%), and Health Care & Social Assistance (162 | 7.7%).
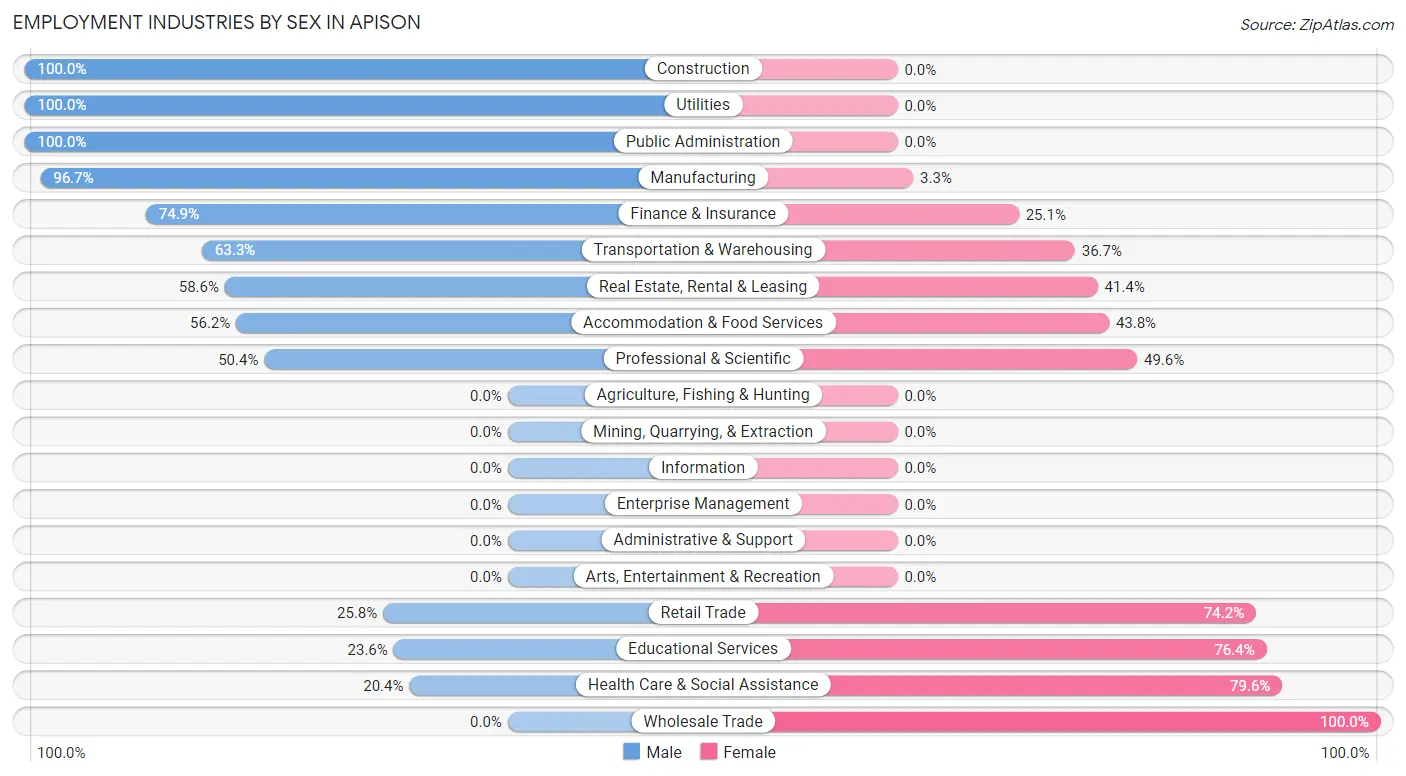
Employment Industries by Sex in Apison
The Apison industries that see more men than women are Construction (100.0%), Utilities (100.0%), and Public Administration (100.0%), whereas the industries that tend to have a higher number of women are Wholesale Trade (100.0%), Health Care & Social Assistance (79.6%), and Educational Services (76.4%).
| Industry | Male | Female |
| Agriculture, Fishing & Hunting | 0 (0.0%) | 0 (0.0%) |
| Mining, Quarrying, & Extraction | 0 (0.0%) | 0 (0.0%) |
| Construction | 59 (100.0%) | 0 (0.0%) |
| Manufacturing | 416 (96.7%) | 14 (3.3%) |
| Wholesale Trade | 0 (0.0%) | 15 (100.0%) |
| Retail Trade | 82 (25.8%) | 236 (74.2%) |
| Transportation & Warehousing | 50 (63.3%) | 29 (36.7%) |
| Utilities | 9 (100.0%) | 0 (0.0%) |
| Information | 0 (0.0%) | 0 (0.0%) |
| Finance & Insurance | 167 (74.9%) | 56 (25.1%) |
| Real Estate, Rental & Leasing | 82 (58.6%) | 58 (41.4%) |
| Professional & Scientific | 63 (50.4%) | 62 (49.6%) |
| Enterprise Management | 0 (0.0%) | 0 (0.0%) |
| Administrative & Support | 0 (0.0%) | 0 (0.0%) |
| Educational Services | 30 (23.6%) | 97 (76.4%) |
| Health Care & Social Assistance | 33 (20.4%) | 129 (79.6%) |
| Arts, Entertainment & Recreation | 0 (0.0%) | 0 (0.0%) |
| Accommodation & Food Services | 140 (56.2%) | 109 (43.8%) |
| Public Administration | 25 (100.0%) | 0 (0.0%) |
| Total | 1,171 (55.7%) | 933 (44.3%) |
Education in Apison
School Enrollment in Apison
The most common levels of schooling among the 972 students in Apison are college / undergraduate (247 | 25.4%), elementary school (226 | 23.3%), and middle school (220 | 22.6%).
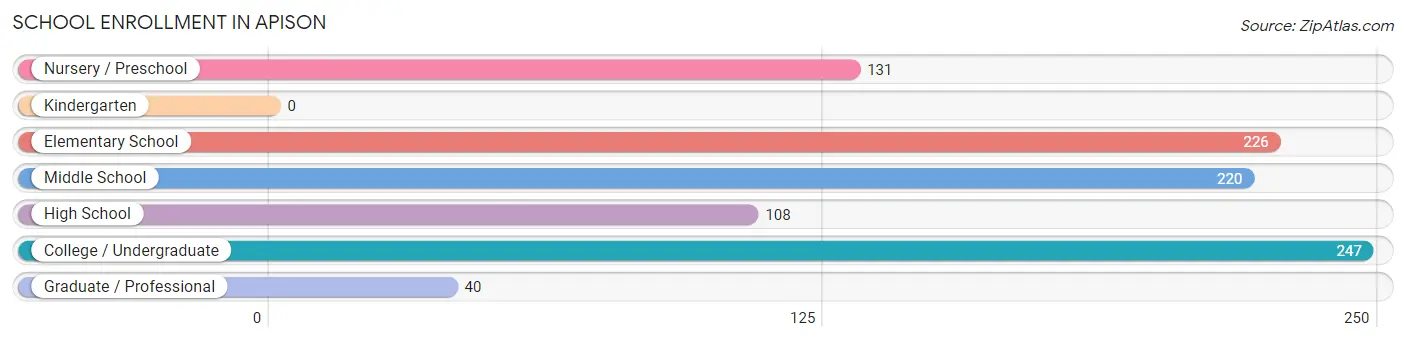
| School Level | # Students | % Students |
| Nursery / Preschool | 131 | 13.5% |
| Kindergarten | 0 | 0.0% |
| Elementary School | 226 | 23.3% |
| Middle School | 220 | 22.6% |
| High School | 108 | 11.1% |
| College / Undergraduate | 247 | 25.4% |
| Graduate / Professional | 40 | 4.1% |
| Total | 972 | 100.0% |
School Enrollment by Age by Funding Source in Apison
Out of a total of 972 students who are enrolled in schools in Apison, 211 (21.7%) attend a private institution, while the remaining 761 (78.3%) are enrolled in public schools. The age group of 3 to 4 year olds has the highest likelihood of being enrolled in private schools, with 67 (100.0% in the age bracket) enrolled. Conversely, the age group of 18 to 19 year olds has the lowest likelihood of being enrolled in a private school, with 55 (100.0% in the age bracket) attending a public institution.
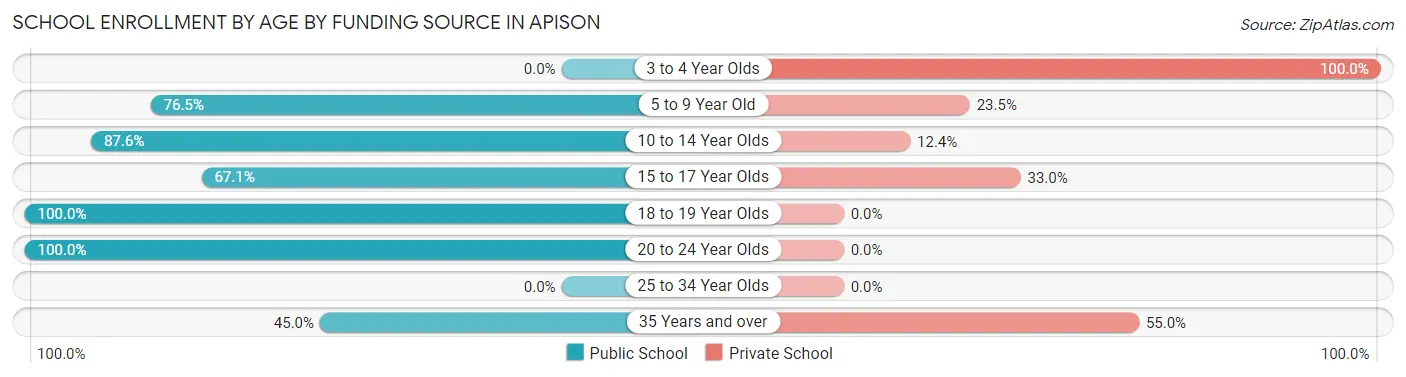
| Age Bracket | Public School | Private School |
| 3 to 4 Year Olds | 0 (0.0%) | 67 (100.0%) |
| 5 to 9 Year Old | 189 (76.5%) | 58 (23.5%) |
| 10 to 14 Year Olds | 248 (87.6%) | 35 (12.4%) |
| 15 to 17 Year Olds | 59 (67.0%) | 29 (33.0%) |
| 18 to 19 Year Olds | 55 (100.0%) | 0 (0.0%) |
| 20 to 24 Year Olds | 192 (100.0%) | 0 (0.0%) |
| 25 to 34 Year Olds | 0 (0.0%) | 0 (0.0%) |
| 35 Years and over | 18 (45.0%) | 22 (55.0%) |
| Total | 761 (78.3%) | 211 (21.7%) |
Educational Attainment by Field of Study in Apison
Business (264 | 21.7%), arts & humanities (143 | 11.7%), education (137 | 11.2%), multidisciplinary studies (116 | 9.5%), and science & technology (95 | 7.8%) are the most common fields of study among 1,219 individuals in Apison who have obtained a bachelor's degree or higher.
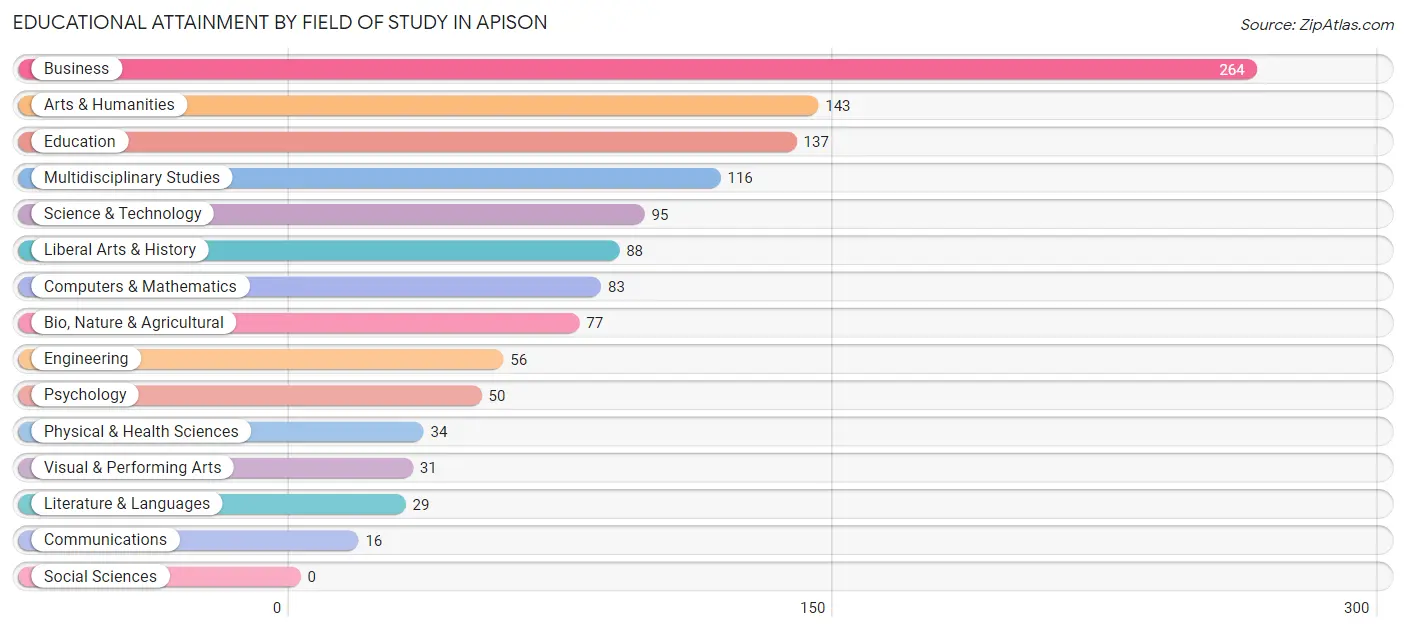
| Field of Study | # Graduates | % Graduates |
| Computers & Mathematics | 83 | 6.8% |
| Bio, Nature & Agricultural | 77 | 6.3% |
| Physical & Health Sciences | 34 | 2.8% |
| Psychology | 50 | 4.1% |
| Social Sciences | 0 | 0.0% |
| Engineering | 56 | 4.6% |
| Multidisciplinary Studies | 116 | 9.5% |
| Science & Technology | 95 | 7.8% |
| Business | 264 | 21.7% |
| Education | 137 | 11.2% |
| Literature & Languages | 29 | 2.4% |
| Liberal Arts & History | 88 | 7.2% |
| Visual & Performing Arts | 31 | 2.5% |
| Communications | 16 | 1.3% |
| Arts & Humanities | 143 | 11.7% |
| Total | 1,219 | 100.0% |
Transportation & Commute in Apison
Vehicle Availability by Sex in Apison
The most prevalent vehicle ownership categories in Apison are males with 2 vehicles (379, accounting for 32.4%) and females with 2 vehicles (293, making up 40.6%).
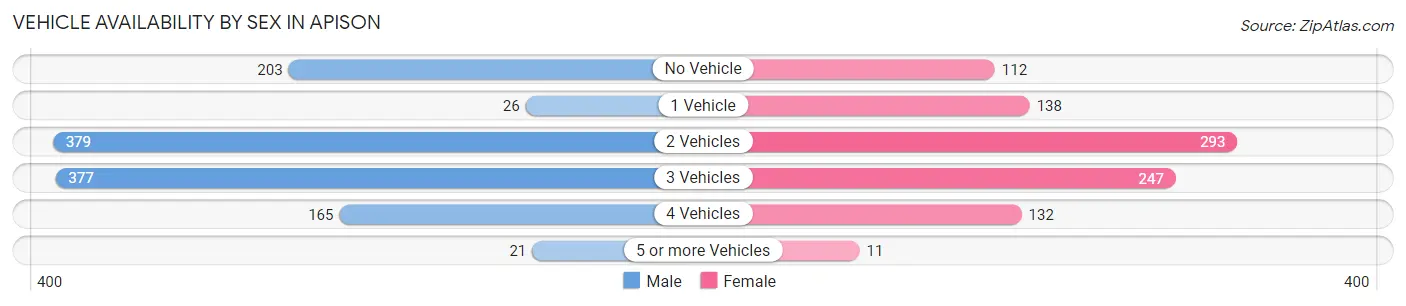
| Vehicles Available | Male | Female |
| No Vehicle | 203 (17.3%) | 112 (12.0%) |
| 1 Vehicle | 26 (2.2%) | 138 (14.8%) |
| 2 Vehicles | 379 (32.4%) | 293 (31.4%) |
| 3 Vehicles | 377 (32.2%) | 247 (26.5%) |
| 4 Vehicles | 165 (14.1%) | 132 (14.1%) |
| 5 or more Vehicles | 21 (1.8%) | 11 (1.2%) |
| Total | 1,171 (100.0%) | 933 (100.0%) |
Commute Time in Apison
The most frequently occuring commute durations in Apison are 15 to 19 minutes (342 commuters, 17.9%), 20 to 24 minutes (311 commuters, 16.3%), and 30 to 34 minutes (265 commuters, 13.9%).
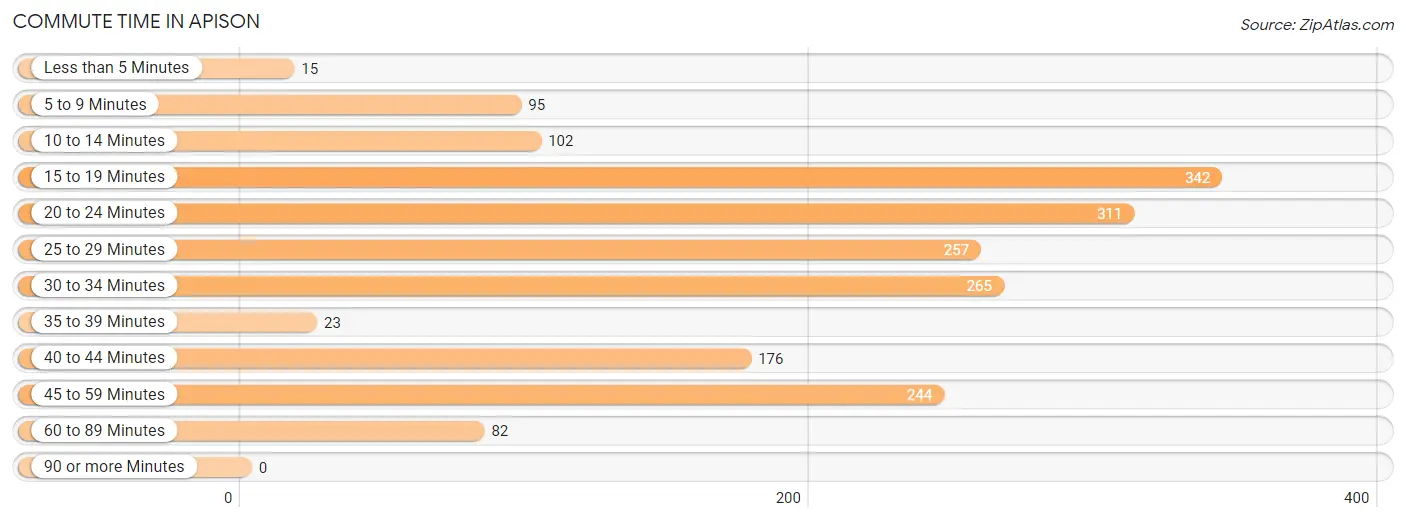
| Commute Time | # Commuters | % Commuters |
| Less than 5 Minutes | 15 | 0.8% |
| 5 to 9 Minutes | 95 | 5.0% |
| 10 to 14 Minutes | 102 | 5.3% |
| 15 to 19 Minutes | 342 | 17.9% |
| 20 to 24 Minutes | 311 | 16.3% |
| 25 to 29 Minutes | 257 | 13.4% |
| 30 to 34 Minutes | 265 | 13.9% |
| 35 to 39 Minutes | 23 | 1.2% |
| 40 to 44 Minutes | 176 | 9.2% |
| 45 to 59 Minutes | 244 | 12.8% |
| 60 to 89 Minutes | 82 | 4.3% |
| 90 or more Minutes | 0 | 0.0% |
Commute Time by Sex in Apison
The most common commute times in Apison are 45 to 59 minutes (185 commuters, 17.6%) for males and 15 to 19 minutes (216 commuters, 25.0%) for females.
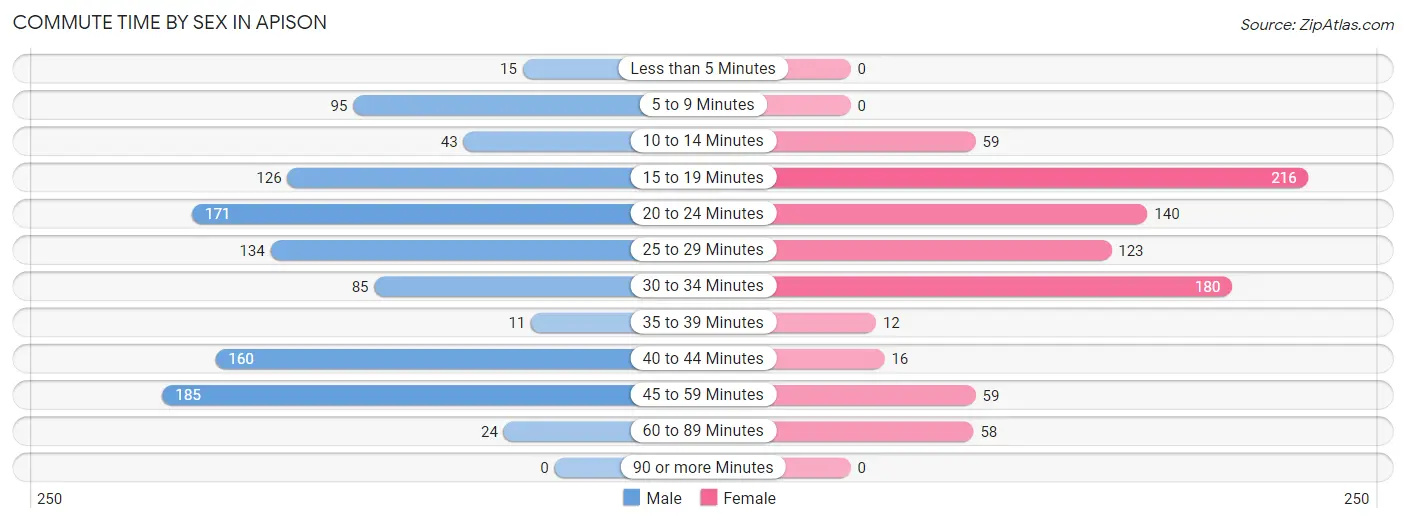
| Commute Time | Male | Female |
| Less than 5 Minutes | 15 (1.4%) | 0 (0.0%) |
| 5 to 9 Minutes | 95 (9.1%) | 0 (0.0%) |
| 10 to 14 Minutes | 43 (4.1%) | 59 (6.8%) |
| 15 to 19 Minutes | 126 (12.0%) | 216 (25.0%) |
| 20 to 24 Minutes | 171 (16.3%) | 140 (16.2%) |
| 25 to 29 Minutes | 134 (12.8%) | 123 (14.2%) |
| 30 to 34 Minutes | 85 (8.1%) | 180 (20.9%) |
| 35 to 39 Minutes | 11 (1.1%) | 12 (1.4%) |
| 40 to 44 Minutes | 160 (15.2%) | 16 (1.8%) |
| 45 to 59 Minutes | 185 (17.6%) | 59 (6.8%) |
| 60 to 89 Minutes | 24 (2.3%) | 58 (6.7%) |
| 90 or more Minutes | 0 (0.0%) | 0 (0.0%) |
Time of Departure to Work by Sex in Apison
The most frequent times of departure to work in Apison are 12:00 PM to 3:59 PM (345, 32.9%) for males and 9:00 AM to 9:59 AM (152, 17.6%) for females.
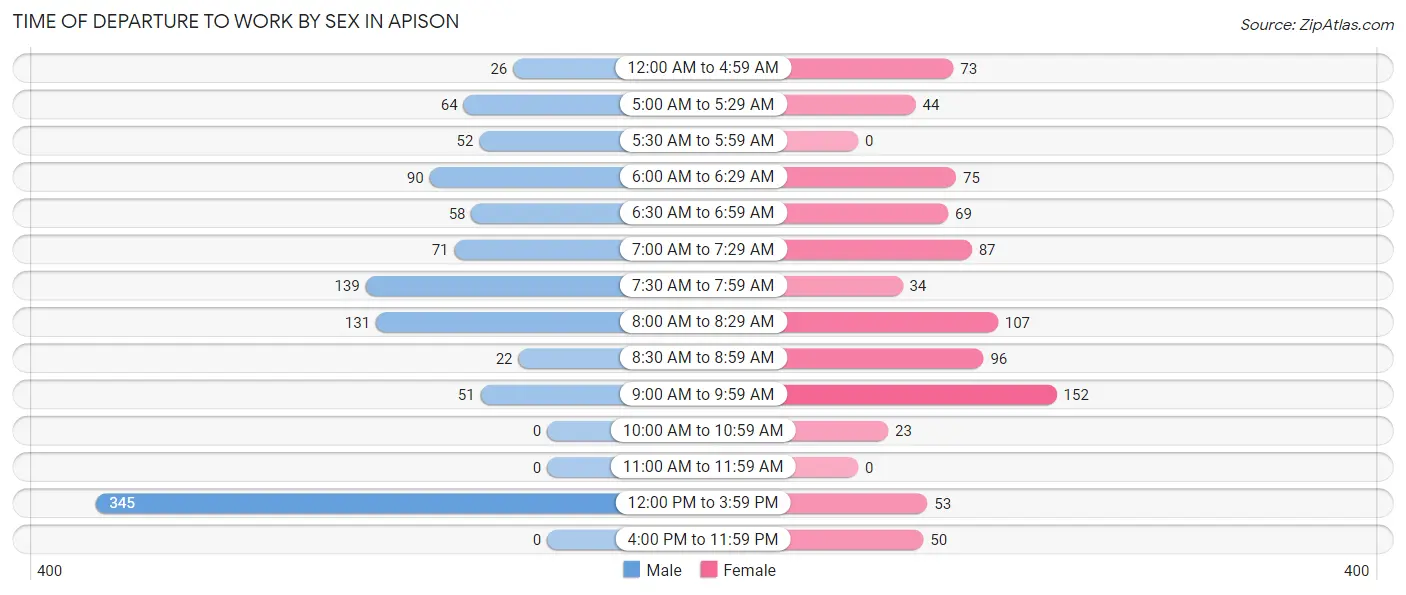
| Time of Departure | Male | Female |
| 12:00 AM to 4:59 AM | 26 (2.5%) | 73 (8.5%) |
| 5:00 AM to 5:29 AM | 64 (6.1%) | 44 (5.1%) |
| 5:30 AM to 5:59 AM | 52 (5.0%) | 0 (0.0%) |
| 6:00 AM to 6:29 AM | 90 (8.6%) | 75 (8.7%) |
| 6:30 AM to 6:59 AM | 58 (5.5%) | 69 (8.0%) |
| 7:00 AM to 7:29 AM | 71 (6.8%) | 87 (10.1%) |
| 7:30 AM to 7:59 AM | 139 (13.3%) | 34 (3.9%) |
| 8:00 AM to 8:29 AM | 131 (12.5%) | 107 (12.4%) |
| 8:30 AM to 8:59 AM | 22 (2.1%) | 96 (11.1%) |
| 9:00 AM to 9:59 AM | 51 (4.9%) | 152 (17.6%) |
| 10:00 AM to 10:59 AM | 0 (0.0%) | 23 (2.7%) |
| 11:00 AM to 11:59 AM | 0 (0.0%) | 0 (0.0%) |
| 12:00 PM to 3:59 PM | 345 (32.9%) | 53 (6.1%) |
| 4:00 PM to 11:59 PM | 0 (0.0%) | 50 (5.8%) |
| Total | 1,049 (100.0%) | 863 (100.0%) |
Housing Occupancy in Apison
Occupancy by Ownership in Apison
Of the total 1,552 dwellings in Apison, owner-occupied units account for 1,240 (79.9%), while renter-occupied units make up 312 (20.1%).
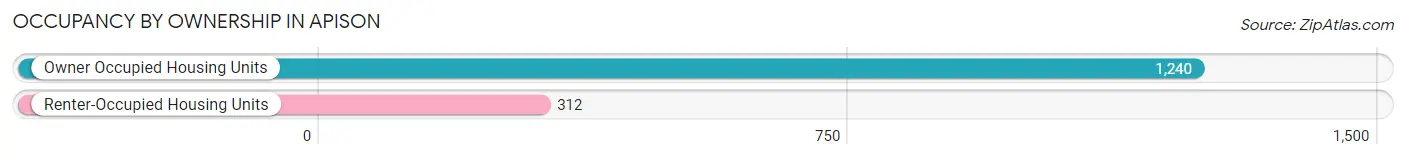
| Occupancy | # Housing Units | % Housing Units |
| Owner Occupied Housing Units | 1,240 | 79.9% |
| Renter-Occupied Housing Units | 312 | 20.1% |
| Total Occupied Housing Units | 1,552 | 100.0% |
Occupancy by Household Size in Apison
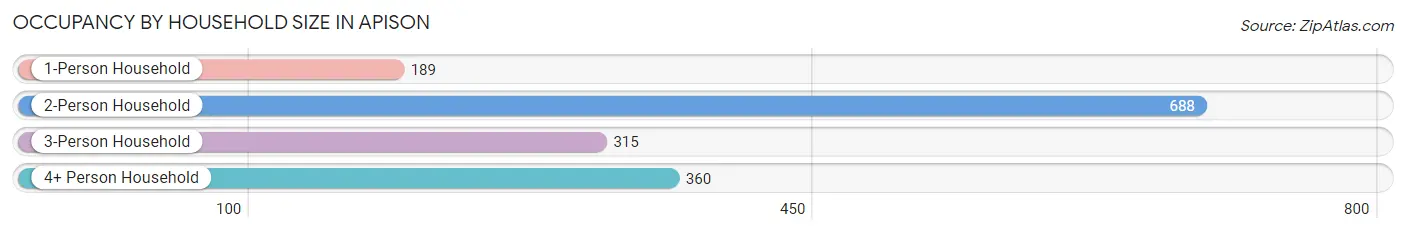
| Household Size | # Housing Units | % Housing Units |
| 1-Person Household | 189 | 12.2% |
| 2-Person Household | 688 | 44.3% |
| 3-Person Household | 315 | 20.3% |
| 4+ Person Household | 360 | 23.2% |
| Total Housing Units | 1,552 | 100.0% |
Occupancy by Ownership by Household Size in Apison
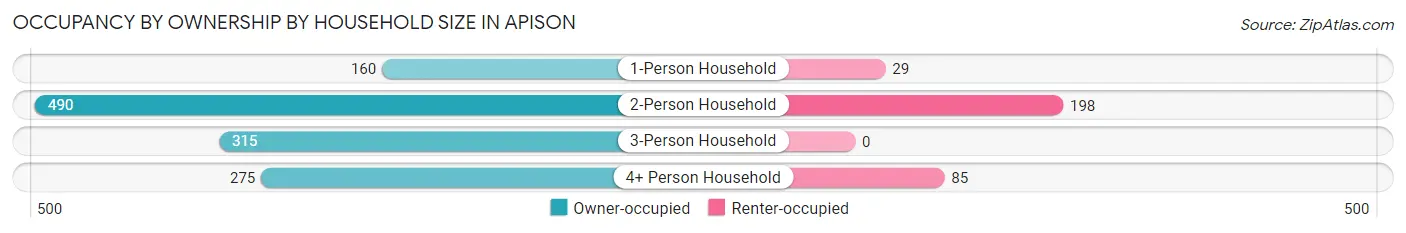
| Household Size | Owner-occupied | Renter-occupied |
| 1-Person Household | 160 (84.7%) | 29 (15.3%) |
| 2-Person Household | 490 (71.2%) | 198 (28.8%) |
| 3-Person Household | 315 (100.0%) | 0 (0.0%) |
| 4+ Person Household | 275 (76.4%) | 85 (23.6%) |
| Total Housing Units | 1,240 (79.9%) | 312 (20.1%) |
Occupancy by Educational Attainment in Apison
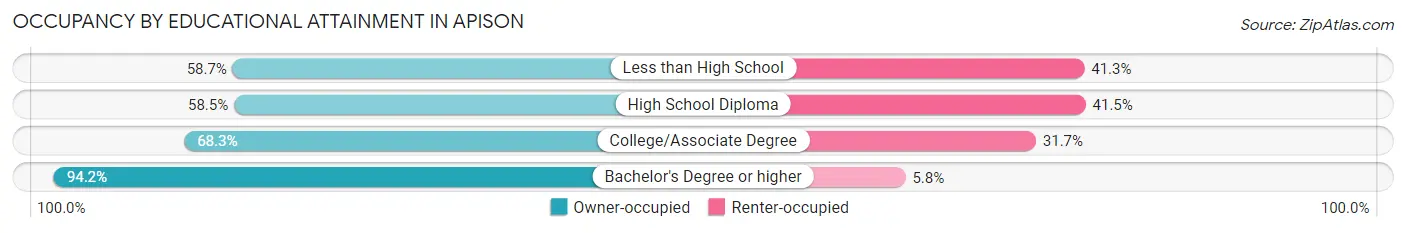
| Household Size | Owner-occupied | Renter-occupied |
| Less than High School | 84 (58.7%) | 59 (41.3%) |
| High School Diploma | 69 (58.5%) | 49 (41.5%) |
| College/Associate Degree | 341 (68.3%) | 158 (31.7%) |
| Bachelor's Degree or higher | 746 (94.2%) | 46 (5.8%) |
Occupancy by Age of Householder in Apison
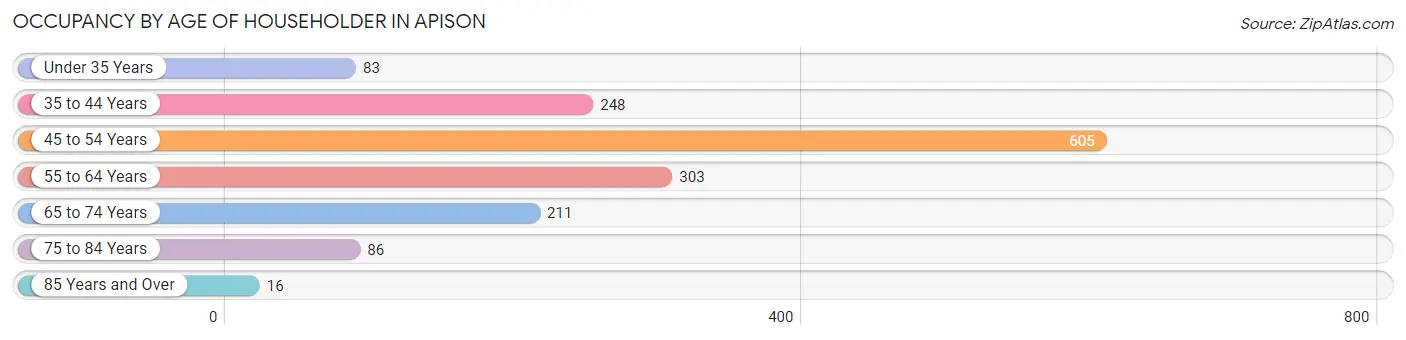
| Age Bracket | # Households | % Households |
| Under 35 Years | 83 | 5.3% |
| 35 to 44 Years | 248 | 16.0% |
| 45 to 54 Years | 605 | 39.0% |
| 55 to 64 Years | 303 | 19.5% |
| 65 to 74 Years | 211 | 13.6% |
| 75 to 84 Years | 86 | 5.5% |
| 85 Years and Over | 16 | 1.0% |
| Total | 1,552 | 100.0% |
Housing Finances in Apison
Median Income by Occupancy in Apison
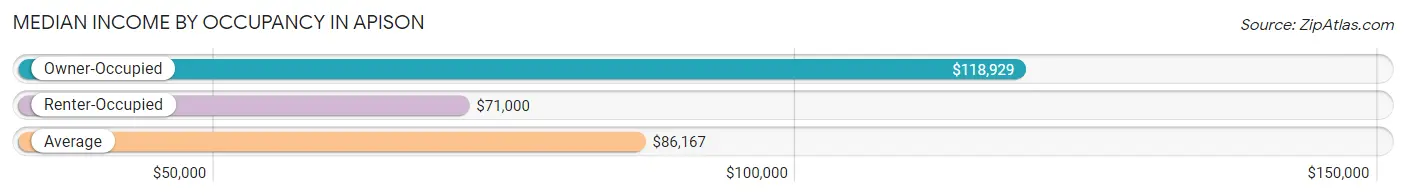
| Occupancy Type | # Households | Median Income |
| Owner-Occupied | 1,240 (79.9%) | $118,929 |
| Renter-Occupied | 312 (20.1%) | $71,000 |
| Average | 1,552 (100.0%) | $86,167 |
Occupancy by Householder Income Bracket in Apison
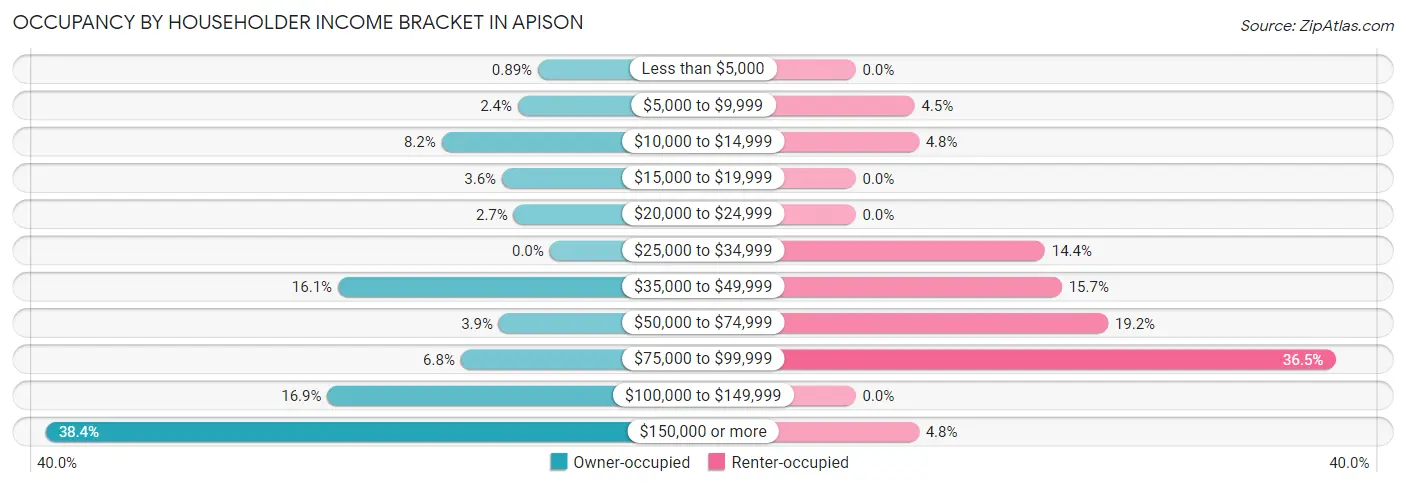
| Income Bracket | Owner-occupied | Renter-occupied |
| Less than $5,000 | 11 (0.9%) | 0 (0.0%) |
| $5,000 to $9,999 | 30 (2.4%) | 14 (4.5%) |
| $10,000 to $14,999 | 102 (8.2%) | 15 (4.8%) |
| $15,000 to $19,999 | 45 (3.6%) | 0 (0.0%) |
| $20,000 to $24,999 | 34 (2.7%) | 0 (0.0%) |
| $25,000 to $34,999 | 0 (0.0%) | 45 (14.4%) |
| $35,000 to $49,999 | 200 (16.1%) | 49 (15.7%) |
| $50,000 to $74,999 | 48 (3.9%) | 60 (19.2%) |
| $75,000 to $99,999 | 84 (6.8%) | 114 (36.5%) |
| $100,000 to $149,999 | 210 (16.9%) | 0 (0.0%) |
| $150,000 or more | 476 (38.4%) | 15 (4.8%) |
| Total | 1,240 (100.0%) | 312 (100.0%) |
Monthly Housing Cost Tiers in Apison
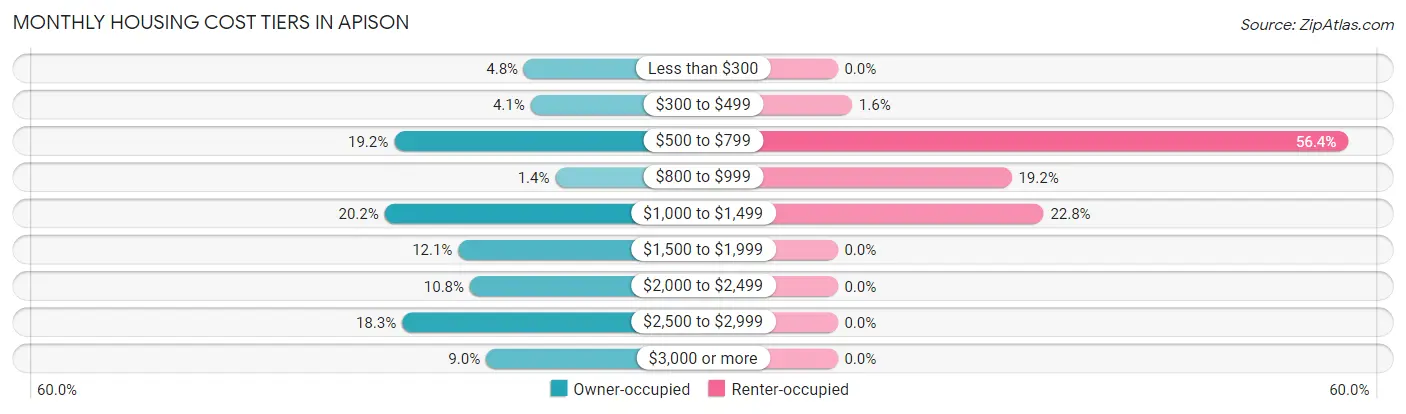
| Monthly Cost | Owner-occupied | Renter-occupied |
| Less than $300 | 60 (4.8%) | 0 (0.0%) |
| $300 to $499 | 51 (4.1%) | 5 (1.6%) |
| $500 to $799 | 238 (19.2%) | 176 (56.4%) |
| $800 to $999 | 17 (1.4%) | 60 (19.2%) |
| $1,000 to $1,499 | 251 (20.2%) | 71 (22.8%) |
| $1,500 to $1,999 | 150 (12.1%) | 0 (0.0%) |
| $2,000 to $2,499 | 134 (10.8%) | 0 (0.0%) |
| $2,500 to $2,999 | 227 (18.3%) | 0 (0.0%) |
| $3,000 or more | 112 (9.0%) | 0 (0.0%) |
| Total | 1,240 (100.0%) | 312 (100.0%) |
Physical Housing Characteristics in Apison
Housing Structures in Apison
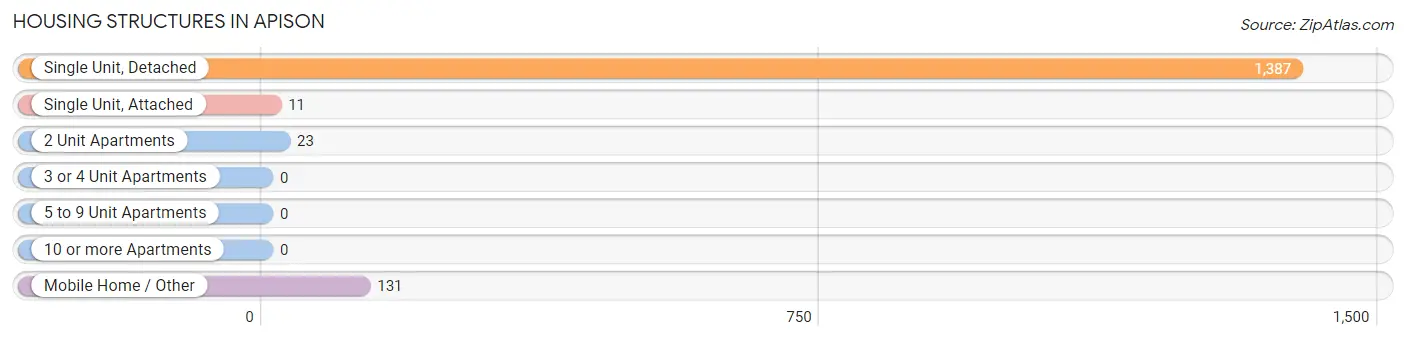
| Structure Type | # Housing Units | % Housing Units |
| Single Unit, Detached | 1,387 | 89.4% |
| Single Unit, Attached | 11 | 0.7% |
| 2 Unit Apartments | 23 | 1.5% |
| 3 or 4 Unit Apartments | 0 | 0.0% |
| 5 to 9 Unit Apartments | 0 | 0.0% |
| 10 or more Apartments | 0 | 0.0% |
| Mobile Home / Other | 131 | 8.4% |
| Total | 1,552 | 100.0% |
Housing Structures by Occupancy in Apison
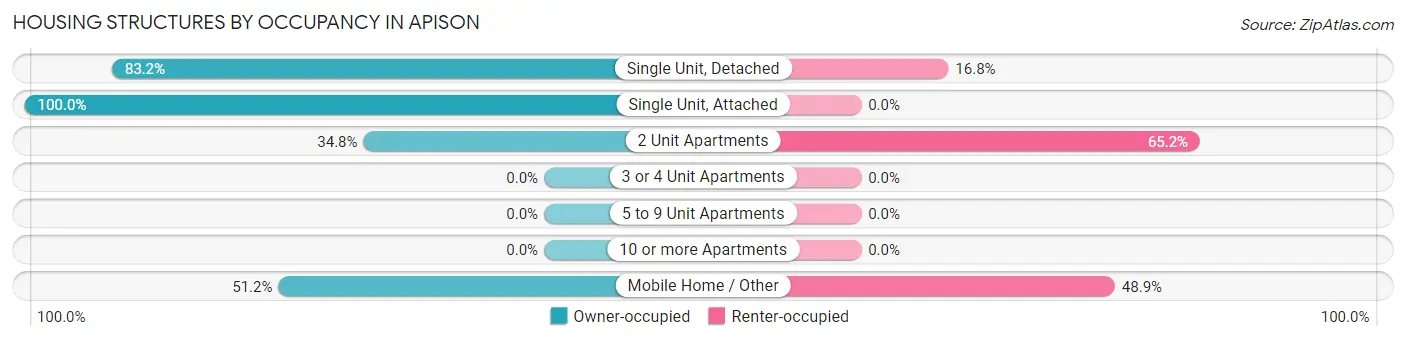
| Structure Type | Owner-occupied | Renter-occupied |
| Single Unit, Detached | 1,154 (83.2%) | 233 (16.8%) |
| Single Unit, Attached | 11 (100.0%) | 0 (0.0%) |
| 2 Unit Apartments | 8 (34.8%) | 15 (65.2%) |
| 3 or 4 Unit Apartments | 0 (0.0%) | 0 (0.0%) |
| 5 to 9 Unit Apartments | 0 (0.0%) | 0 (0.0%) |
| 10 or more Apartments | 0 (0.0%) | 0 (0.0%) |
| Mobile Home / Other | 67 (51.1%) | 64 (48.8%) |
| Total | 1,240 (79.9%) | 312 (20.1%) |
Housing Structures by Number of Rooms in Apison
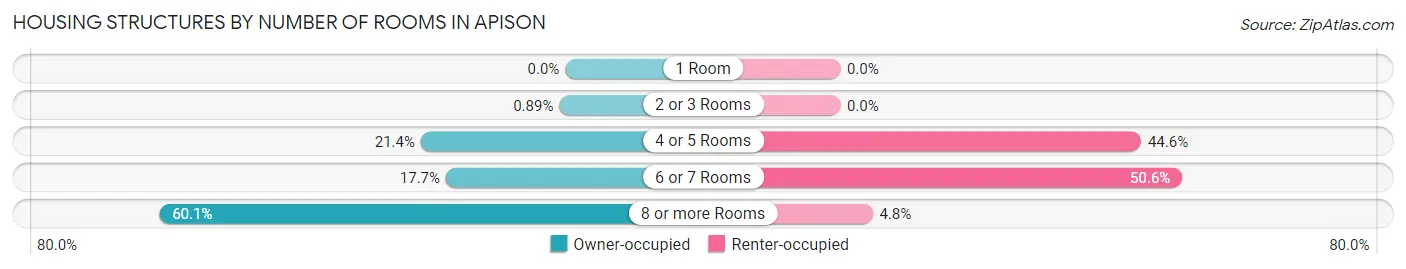
| Number of Rooms | Owner-occupied | Renter-occupied |
| 1 Room | 0 (0.0%) | 0 (0.0%) |
| 2 or 3 Rooms | 11 (0.9%) | 0 (0.0%) |
| 4 or 5 Rooms | 265 (21.4%) | 139 (44.6%) |
| 6 or 7 Rooms | 219 (17.7%) | 158 (50.6%) |
| 8 or more Rooms | 745 (60.1%) | 15 (4.8%) |
| Total | 1,240 (100.0%) | 312 (100.0%) |
Housing Structure by Heating Type in Apison
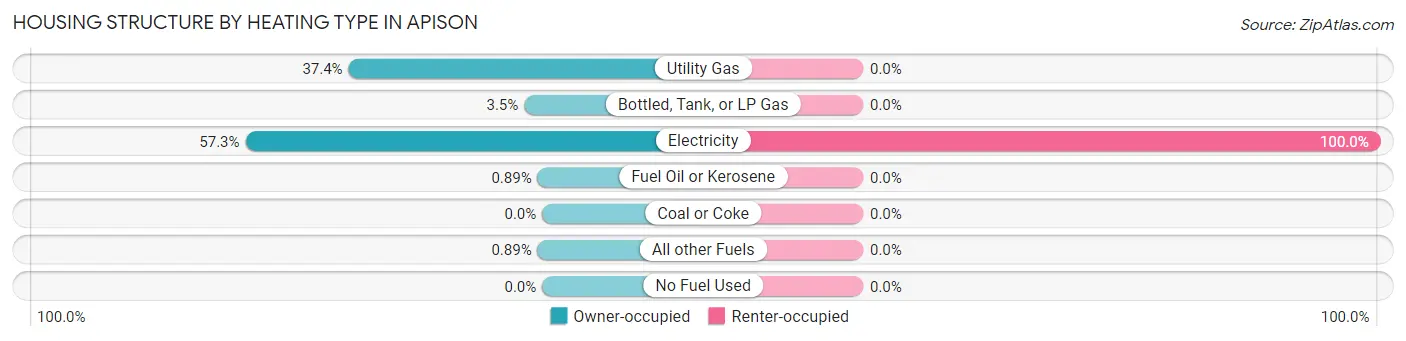
| Heating Type | Owner-occupied | Renter-occupied |
| Utility Gas | 464 (37.4%) | 0 (0.0%) |
| Bottled, Tank, or LP Gas | 43 (3.5%) | 0 (0.0%) |
| Electricity | 711 (57.3%) | 312 (100.0%) |
| Fuel Oil or Kerosene | 11 (0.9%) | 0 (0.0%) |
| Coal or Coke | 0 (0.0%) | 0 (0.0%) |
| All other Fuels | 11 (0.9%) | 0 (0.0%) |
| No Fuel Used | 0 (0.0%) | 0 (0.0%) |
| Total | 1,240 (100.0%) | 312 (100.0%) |
Household Vehicle Usage in Apison
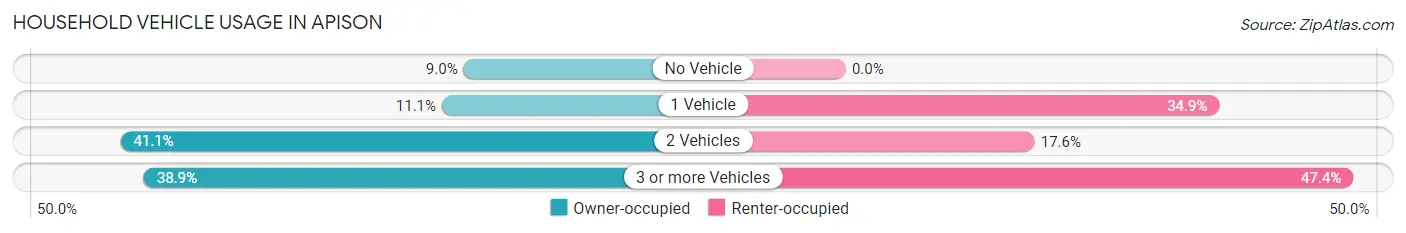
| Vehicles per Household | Owner-occupied | Renter-occupied |
| No Vehicle | 112 (9.0%) | 0 (0.0%) |
| 1 Vehicle | 137 (11.1%) | 109 (34.9%) |
| 2 Vehicles | 509 (41.0%) | 55 (17.6%) |
| 3 or more Vehicles | 482 (38.9%) | 148 (47.4%) |
| Total | 1,240 (100.0%) | 312 (100.0%) |
Real Estate & Mortgages in Apison
Real Estate and Mortgage Overview in Apison
| Characteristic | Without Mortgage | With Mortgage |
| Housing Units | 328 | 912 |
| Median Property Value | $305,300 | $369,400 |
| Median Household Income | - | - |
| Monthly Housing Costs | $552 | $112 |
| Real Estate Taxes | $2,383 | $34 |
Property Value by Mortgage Status in Apison
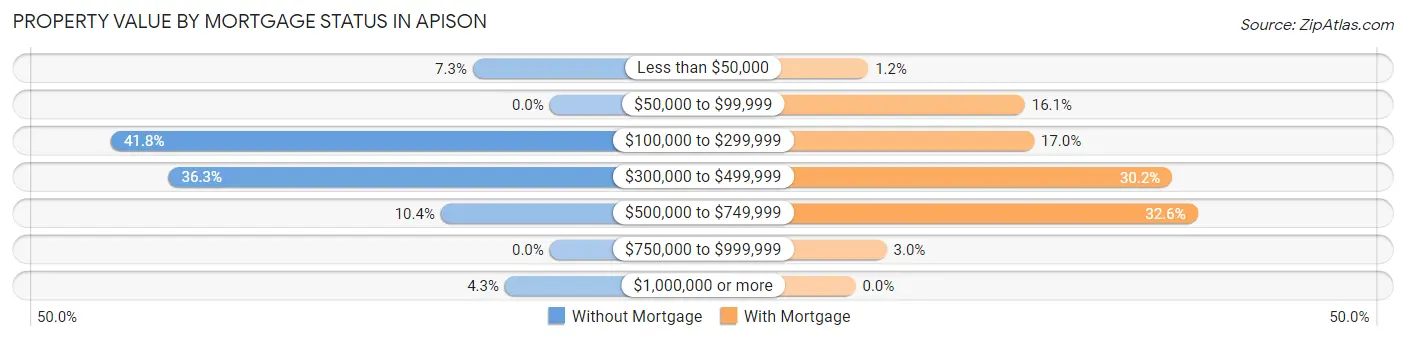
| Property Value | Without Mortgage | With Mortgage |
| Less than $50,000 | 24 (7.3%) | 11 (1.2%) |
| $50,000 to $99,999 | 0 (0.0%) | 147 (16.1%) |
| $100,000 to $299,999 | 137 (41.8%) | 155 (17.0%) |
| $300,000 to $499,999 | 119 (36.3%) | 275 (30.1%) |
| $500,000 to $749,999 | 34 (10.4%) | 297 (32.6%) |
| $750,000 to $999,999 | 0 (0.0%) | 27 (3.0%) |
| $1,000,000 or more | 14 (4.3%) | 0 (0.0%) |
| Total | 328 (100.0%) | 912 (100.0%) |
Household Income by Mortgage Status in Apison
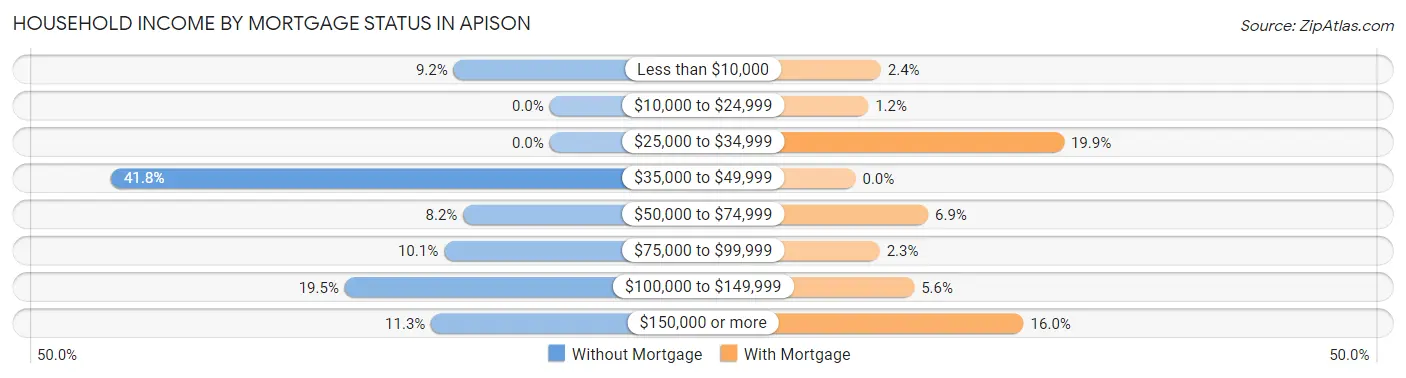
| Household Income | Without Mortgage | With Mortgage |
| Less than $10,000 | 30 (9.1%) | 22 (2.4%) |
| $10,000 to $24,999 | 0 (0.0%) | 11 (1.2%) |
| $25,000 to $34,999 | 0 (0.0%) | 181 (19.9%) |
| $35,000 to $49,999 | 137 (41.8%) | 0 (0.0%) |
| $50,000 to $74,999 | 27 (8.2%) | 63 (6.9%) |
| $75,000 to $99,999 | 33 (10.1%) | 21 (2.3%) |
| $100,000 to $149,999 | 64 (19.5%) | 51 (5.6%) |
| $150,000 or more | 37 (11.3%) | 146 (16.0%) |
| Total | 328 (100.0%) | 912 (100.0%) |
Property Value to Household Income Ratio in Apison
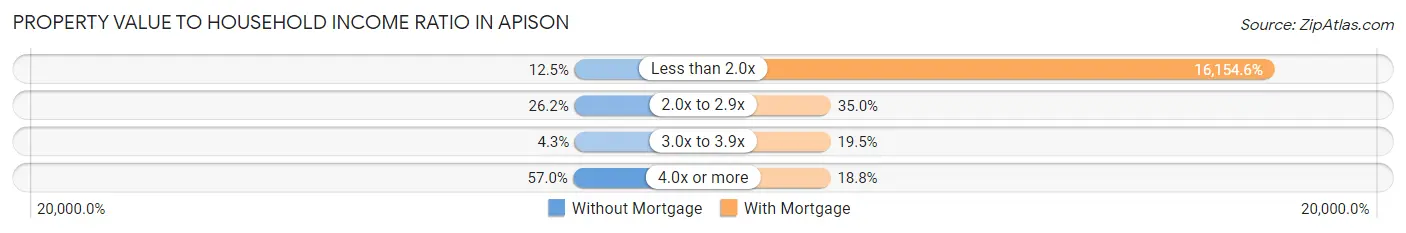
| Value-to-Income Ratio | Without Mortgage | With Mortgage |
| Less than 2.0x | 41 (12.5%) | 147,330 (16,154.6%) |
| 2.0x to 2.9x | 86 (26.2%) | 319 (35.0%) |
| 3.0x to 3.9x | 14 (4.3%) | 178 (19.5%) |
| 4.0x or more | 187 (57.0%) | 171 (18.8%) |
| Total | 328 (100.0%) | 912 (100.0%) |
Real Estate Taxes by Mortgage Status in Apison
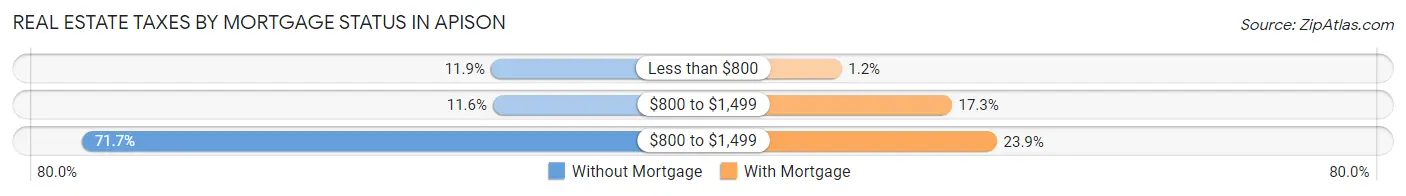
| Property Taxes | Without Mortgage | With Mortgage |
| Less than $800 | 39 (11.9%) | 11 (1.2%) |
| $800 to $1,499 | 38 (11.6%) | 158 (17.3%) |
| $800 to $1,499 | 235 (71.7%) | 218 (23.9%) |
| Total | 328 (100.0%) | 912 (100.0%) |
Health & Disability in Apison
Health Insurance Coverage by Age in Apison
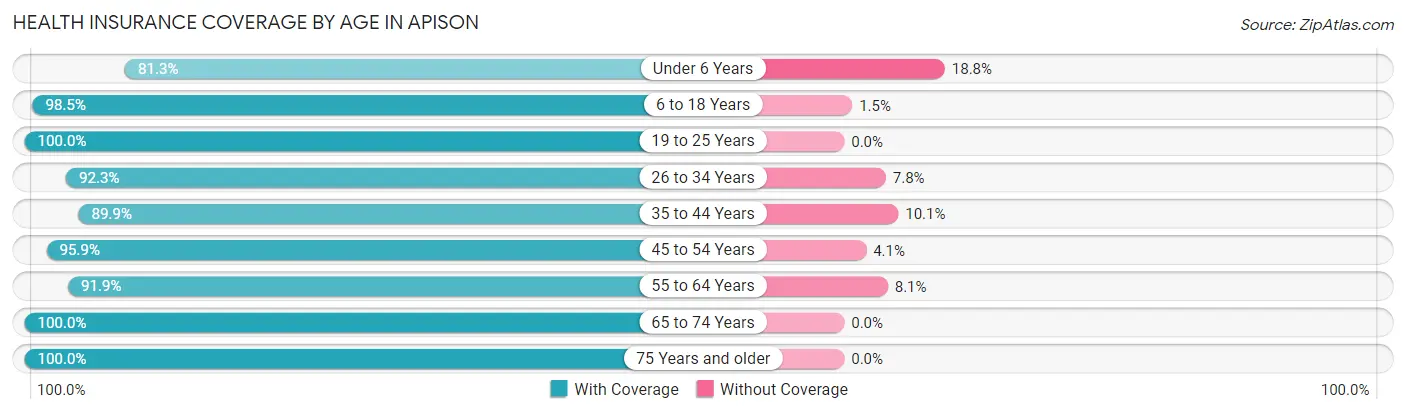
| Age Bracket | With Coverage | Without Coverage |
| Under 6 Years | 286 (81.2%) | 66 (18.8%) |
| 6 to 18 Years | 601 (98.5%) | 9 (1.5%) |
| 19 to 25 Years | 279 (100.0%) | 0 (0.0%) |
| 26 to 34 Years | 131 (92.2%) | 11 (7.7%) |
| 35 to 44 Years | 625 (89.9%) | 70 (10.1%) |
| 45 to 54 Years | 914 (95.9%) | 39 (4.1%) |
| 55 to 64 Years | 612 (91.9%) | 54 (8.1%) |
| 65 to 74 Years | 322 (100.0%) | 0 (0.0%) |
| 75 Years and older | 180 (100.0%) | 0 (0.0%) |
| Total | 3,950 (94.1%) | 249 (5.9%) |
Health Insurance Coverage by Citizenship Status in Apison
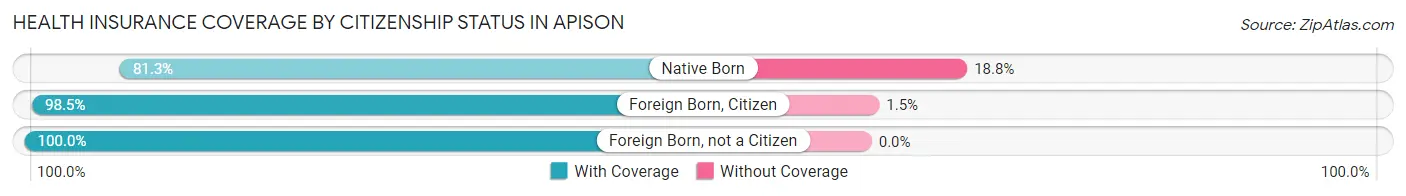
| Citizenship Status | With Coverage | Without Coverage |
| Native Born | 286 (81.2%) | 66 (18.8%) |
| Foreign Born, Citizen | 601 (98.5%) | 9 (1.5%) |
| Foreign Born, not a Citizen | 279 (100.0%) | 0 (0.0%) |
Health Insurance Coverage by Household Income in Apison
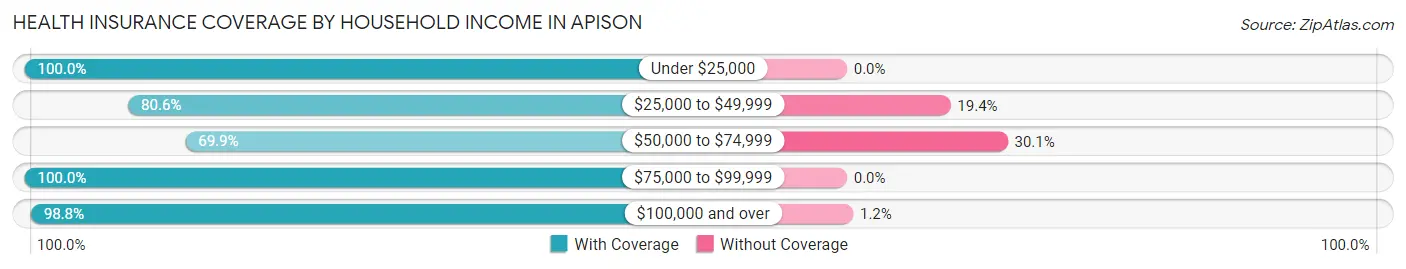
| Household Income | With Coverage | Without Coverage |
| Under $25,000 | 663 (100.0%) | 0 (0.0%) |
| $25,000 to $49,999 | 490 (80.6%) | 118 (19.4%) |
| $50,000 to $74,999 | 246 (69.9%) | 106 (30.1%) |
| $75,000 to $99,999 | 438 (100.0%) | 0 (0.0%) |
| $100,000 and over | 2,113 (98.8%) | 25 (1.2%) |
Public vs Private Health Insurance Coverage by Age in Apison
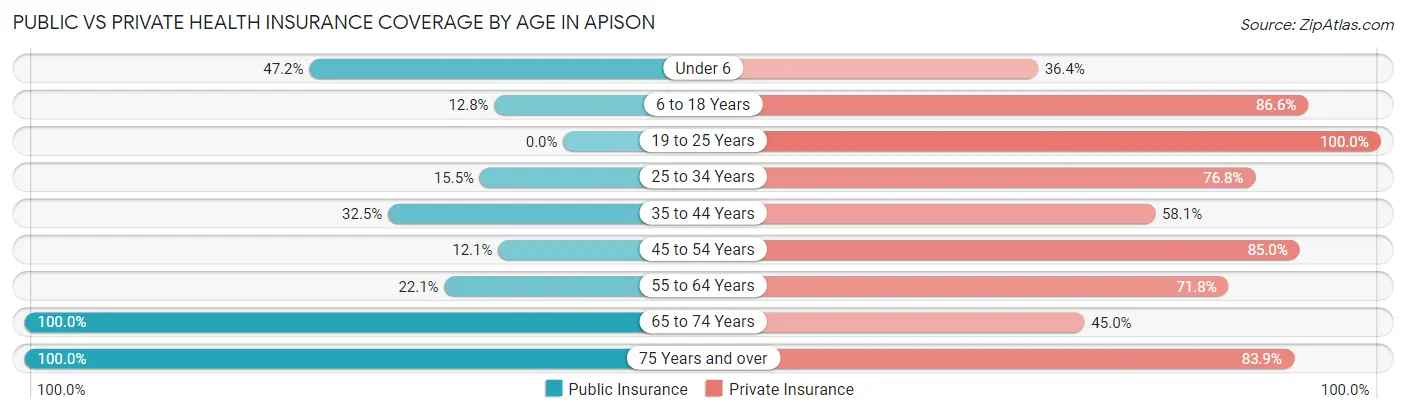
| Age Bracket | Public Insurance | Private Insurance |
| Under 6 | 166 (47.2%) | 128 (36.4%) |
| 6 to 18 Years | 78 (12.8%) | 528 (86.6%) |
| 19 to 25 Years | 0 (0.0%) | 279 (100.0%) |
| 25 to 34 Years | 22 (15.5%) | 109 (76.8%) |
| 35 to 44 Years | 226 (32.5%) | 404 (58.1%) |
| 45 to 54 Years | 115 (12.1%) | 810 (85.0%) |
| 55 to 64 Years | 147 (22.1%) | 478 (71.8%) |
| 65 to 74 Years | 322 (100.0%) | 145 (45.0%) |
| 75 Years and over | 180 (100.0%) | 151 (83.9%) |
| Total | 1,256 (29.9%) | 3,032 (72.2%) |
Disability Status by Sex by Age in Apison
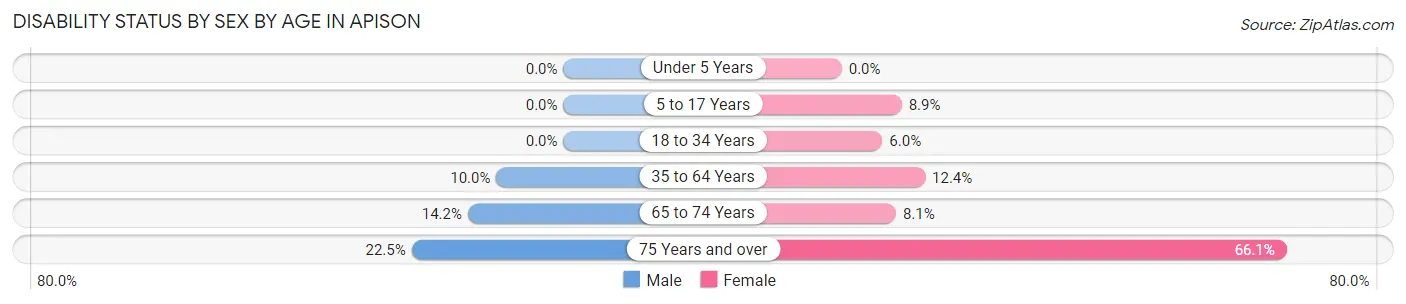
| Age Bracket | Male | Female |
| Under 5 Years | 0 (0.0%) | 0 (0.0%) |
| 5 to 17 Years | 0 (0.0%) | 29 (8.9%) |
| 18 to 34 Years | 0 (0.0%) | 14 (6.0%) |
| 35 to 64 Years | 113 (10.0%) | 146 (12.4%) |
| 65 to 74 Years | 21 (14.2%) | 14 (8.1%) |
| 75 Years and over | 16 (22.5%) | 72 (66.1%) |
Disability Class by Sex by Age in Apison
Disability Class: Hearing Difficulty
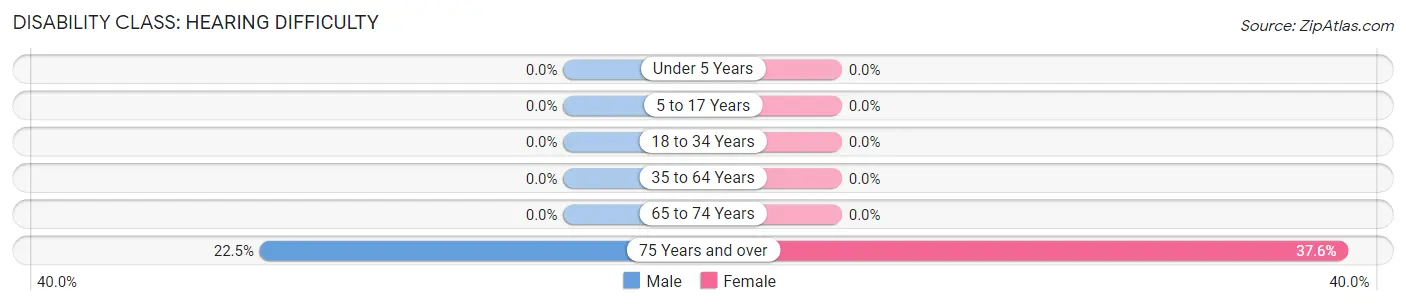
| Age Bracket | Male | Female |
| Under 5 Years | 0 (0.0%) | 0 (0.0%) |
| 5 to 17 Years | 0 (0.0%) | 0 (0.0%) |
| 18 to 34 Years | 0 (0.0%) | 0 (0.0%) |
| 35 to 64 Years | 0 (0.0%) | 0 (0.0%) |
| 65 to 74 Years | 0 (0.0%) | 0 (0.0%) |
| 75 Years and over | 16 (22.5%) | 41 (37.6%) |
Disability Class: Vision Difficulty
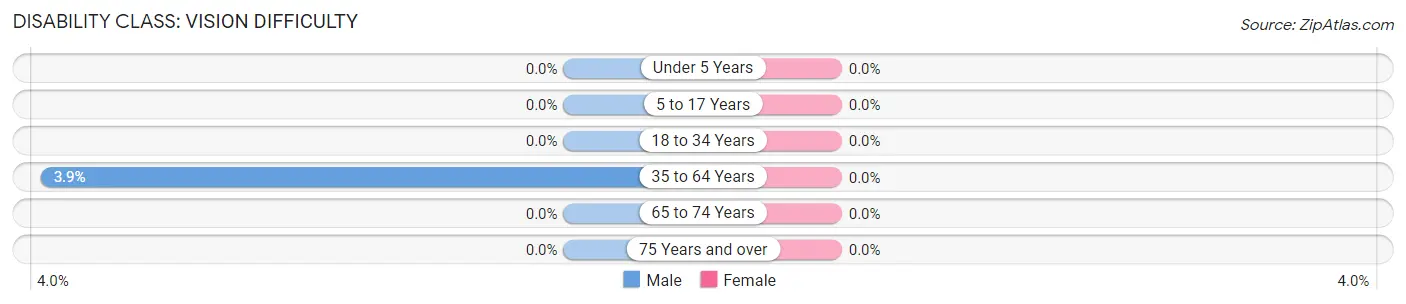
| Age Bracket | Male | Female |
| Under 5 Years | 0 (0.0%) | 0 (0.0%) |
| 5 to 17 Years | 0 (0.0%) | 0 (0.0%) |
| 18 to 34 Years | 0 (0.0%) | 0 (0.0%) |
| 35 to 64 Years | 44 (3.9%) | 0 (0.0%) |
| 65 to 74 Years | 0 (0.0%) | 0 (0.0%) |
| 75 Years and over | 0 (0.0%) | 0 (0.0%) |
Disability Class: Cognitive Difficulty
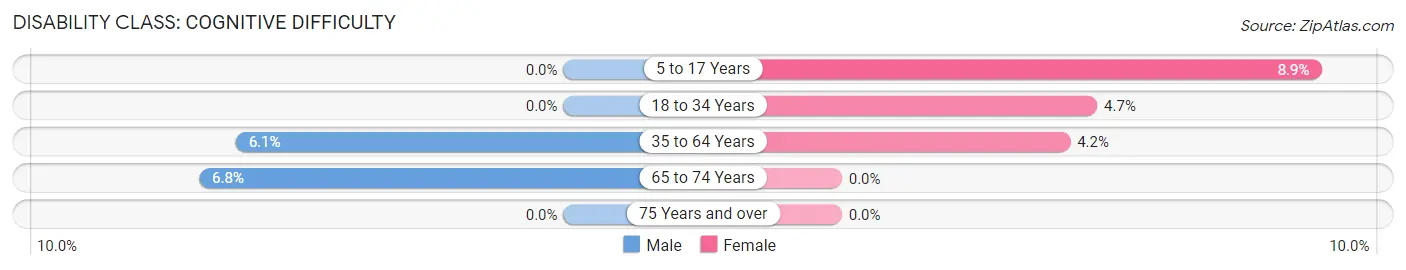
| Age Bracket | Male | Female |
| 5 to 17 Years | 0 (0.0%) | 29 (8.9%) |
| 18 to 34 Years | 0 (0.0%) | 11 (4.7%) |
| 35 to 64 Years | 69 (6.1%) | 50 (4.2%) |
| 65 to 74 Years | 10 (6.8%) | 0 (0.0%) |
| 75 Years and over | 0 (0.0%) | 0 (0.0%) |
Disability Class: Ambulatory Difficulty
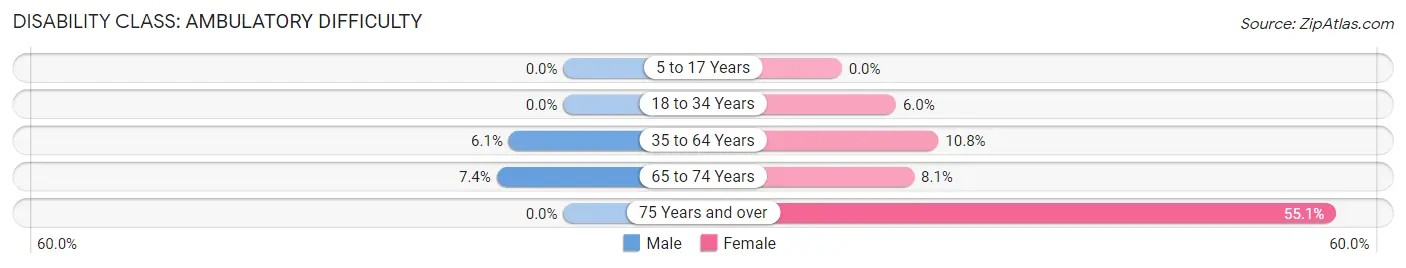
| Age Bracket | Male | Female |
| 5 to 17 Years | 0 (0.0%) | 0 (0.0%) |
| 18 to 34 Years | 0 (0.0%) | 14 (6.0%) |
| 35 to 64 Years | 69 (6.1%) | 127 (10.8%) |
| 65 to 74 Years | 11 (7.4%) | 14 (8.1%) |
| 75 Years and over | 0 (0.0%) | 60 (55.0%) |
Disability Class: Self-Care Difficulty
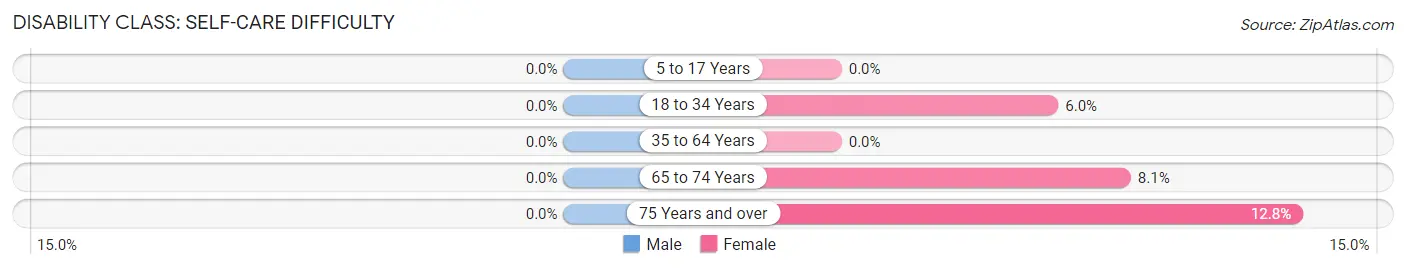
| Age Bracket | Male | Female |
| 5 to 17 Years | 0 (0.0%) | 0 (0.0%) |
| 18 to 34 Years | 0 (0.0%) | 14 (6.0%) |
| 35 to 64 Years | 0 (0.0%) | 0 (0.0%) |
| 65 to 74 Years | 0 (0.0%) | 14 (8.1%) |
| 75 Years and over | 0 (0.0%) | 14 (12.8%) |
Technology Access in Apison
Computing Device Access in Apison
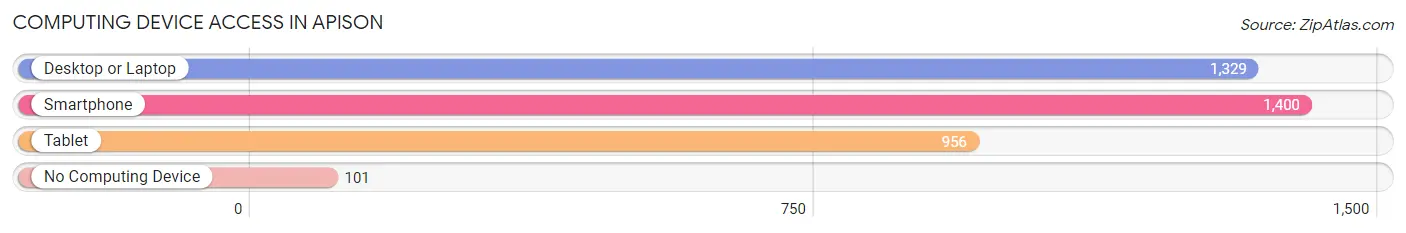
| Device Type | # Households | % Households |
| Desktop or Laptop | 1,329 | 85.6% |
| Smartphone | 1,400 | 90.2% |
| Tablet | 956 | 61.6% |
| No Computing Device | 101 | 6.5% |
| Total | 1,552 | 100.0% |
Internet Access in Apison
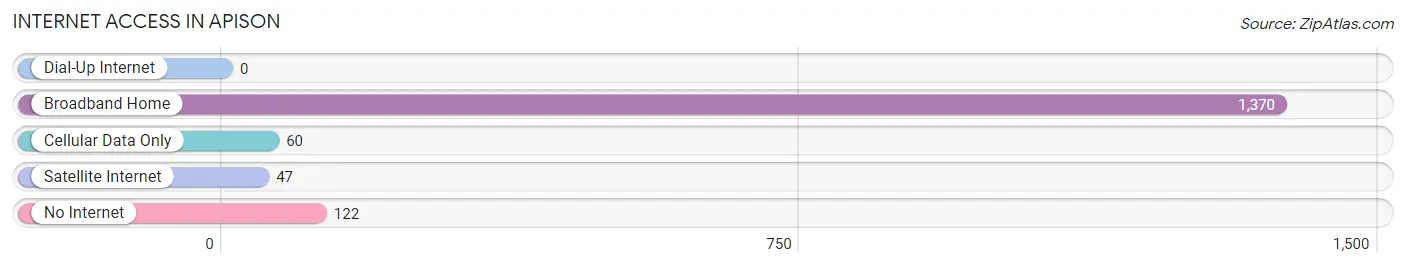
| Internet Type | # Households | % Households |
| Dial-Up Internet | 0 | 0.0% |
| Broadband Home | 1,370 | 88.3% |
| Cellular Data Only | 60 | 3.9% |
| Satellite Internet | 47 | 3.0% |
| No Internet | 122 | 7.9% |
| Total | 1,552 | 100.0% |
Apison Summary
Apison is a small unincorporated community located in Hamilton County, Tennessee. It is situated in the southeastern part of the county, approximately 15 miles east of Chattanooga. The population of Apison was estimated to be 1,845 in 2019.
History
Apison was first settled in the early 1800s by a group of settlers from North Carolina. The community was originally known as "Apison Station" due to its location on the railroad line that ran from Chattanooga to Knoxville. The name Apison is derived from the Cherokee word "apisunee," which means "a place of plenty."
The first post office in Apison was established in 1854. The community was officially incorporated in 1872. During the late 19th century, Apison was a thriving agricultural community, with many of its residents working in the local cotton and tobacco industries.
Geography
Apison is located in southeastern Hamilton County, approximately 15 miles east of Chattanooga. The community is situated in the foothills of the Appalachian Mountains, with elevations ranging from 800 to 1,000 feet above sea level. The area is characterized by rolling hills and valleys, with the Apison Creek running through the center of the community.
The climate in Apison is humid subtropical, with hot, humid summers and mild winters. The average annual temperature is around 60 degrees Fahrenheit, with average highs in the summer reaching the mid-80s and average lows in the winter reaching the mid-30s.
Economy
The economy of Apison is largely based on agriculture and manufacturing. The area is home to several large farms, which produce a variety of crops, including corn, soybeans, wheat, and hay. The community is also home to several manufacturing companies, including a furniture factory and a plastics plant.
In addition to agriculture and manufacturing, Apison is home to several small businesses, including restaurants, retail stores, and service providers. The community is also home to a number of churches, schools, and other organizations.
Demographics
As of 2019, the population of Apison was estimated to be 1,845. The racial makeup of the community is predominantly white (94.3%), with small percentages of African American (2.7%), Hispanic (1.3%), and Asian (1.2%) residents. The median household income in Apison is $50,945, which is slightly higher than the median income for Hamilton County ($50,717). The median age in Apison is 40.3, which is slightly lower than the median age for Hamilton County (41.2).
Common Questions
What is Per Capita Income in Apison?
Per Capita income in Apison is $52,892.
What is the Median Family Income in Apison?
Median Family Income in Apison is $104,286.
What is the Median Household income in Apison?
Median Household Income in Apison is $86,167.
What is Income or Wage Gap in Apison?
Income or Wage Gap in Apison is 62.8%.
Women in Apison earn 37.2 cents for every dollar earned by a man.
What is Family Income Deficit in Apison?
Family Income Deficit in Apison is $12,469.
Families that are below poverty line in Apison earn $12,469 less on average than the poverty threshold level.
What is Inequality or Gini Index in Apison?
Inequality or Gini Index in Apison is 0.51.
What is the Total Population of Apison?
Total Population of Apison is 4,199.
What is the Total Male Population of Apison?
Total Male Population of Apison is 1,946.
What is the Total Female Population of Apison?
Total Female Population of Apison is 2,253.
What is the Ratio of Males per 100 Females in Apison?
There are 86.37 Males per 100 Females in Apison.
What is the Ratio of Females per 100 Males in Apison?
There are 115.78 Females per 100 Males in Apison.
What is the Median Population Age in Apison?
Median Population Age in Apison is 45.2 Years.
What is the Average Family Size in Apison
Average Family Size in Apison is 3.0 People.
What is the Average Household Size in Apison
Average Household Size in Apison is 2.7 People.
How Large is the Labor Force in Apison?
There are 2,129 People in the Labor Forcein in Apison.
What is the Percentage of People in the Labor Force in Apison?
63.2% of People are in the Labor Force in Apison.
What is the Unemployment Rate in Apison?
Unemployment Rate in Apison is 1.1%.