Zip Codes with the Highest Percentage of Population Employed in Food Preparation & Serving in Tennessee
RELATED REPORTS & OPTIONS
Food Preparation & Serving
Tennessee
Compare Zip Codes
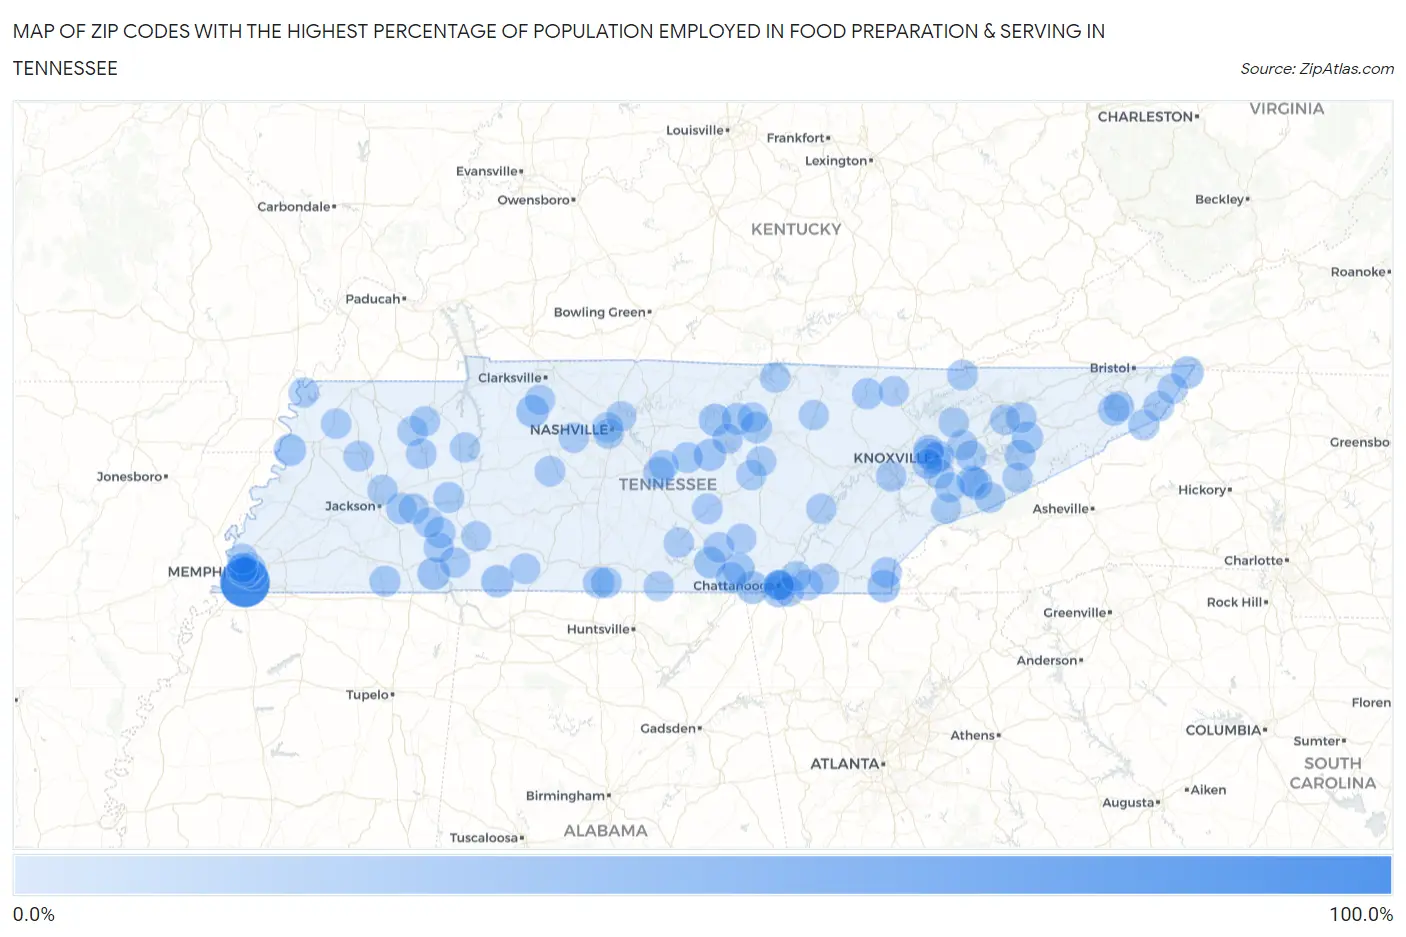
Map of Zip Codes with the Highest Percentage of Population Employed in Food Preparation & Serving in Tennessee
0.0%
100.0%
Zip Codes with the Highest Percentage of Population Employed in Food Preparation & Serving in Tennessee
| Zip Code | % Employed | vs State | vs National | |
| 1. | 38132 | 100.0% | 5.4%(+94.6)#1 | 5.3%(+94.7)#10 |
| 2. | 37340 | 18.9% | 5.4%(+13.5)#2 | 5.3%(+13.6)#572 |
| 3. | 37326 | 18.5% | 5.4%(+13.1)#3 | 5.3%(+13.2)#609 |
| 4. | 38452 | 18.3% | 5.4%(+12.9)#4 | 5.3%(+13.0)#628 |
| 5. | 38376 | 18.2% | 5.4%(+12.8)#5 | 5.3%(+12.9)#640 |
| 6. | 37165 | 18.2% | 5.4%(+12.8)#6 | 5.3%(+12.9)#642 |
| 7. | 37680 | 18.1% | 5.4%(+12.7)#7 | 5.3%(+12.9)#645 |
| 8. | 38560 | 17.5% | 5.4%(+12.1)#8 | 5.3%(+12.2)#709 |
| 9. | 37863 | 17.3% | 5.4%(+11.8)#9 | 5.3%(+12.0)#723 |
| 10. | 37059 | 16.8% | 5.4%(+11.4)#10 | 5.3%(+11.5)#762 |
| 11. | 38030 | 16.4% | 5.4%(+11.0)#11 | 5.3%(+11.1)#807 |
| 12. | 37410 | 16.4% | 5.4%(+11.0)#12 | 5.3%(+11.1)#809 |
| 13. | 37374 | 16.1% | 5.4%(+10.7)#13 | 5.3%(+10.8)#854 |
| 14. | 37383 | 14.9% | 5.4%(+9.49)#14 | 5.3%(+9.63)#993 |
| 15. | 38545 | 14.2% | 5.4%(+8.83)#15 | 5.3%(+8.96)#1,111 |
| 16. | 38505 | 14.0% | 5.4%(+8.59)#16 | 5.3%(+8.73)#1,157 |
| 17. | 38455 | 13.5% | 5.4%(+8.09)#17 | 5.3%(+8.23)#1,272 |
| 18. | 37614 | 13.3% | 5.4%(+7.92)#18 | 5.3%(+8.05)#1,304 |
| 19. | 37713 | 13.1% | 5.4%(+7.65)#19 | 5.3%(+7.79)#1,374 |
| 20. | 37862 | 13.0% | 5.4%(+7.62)#20 | 5.3%(+7.75)#1,385 |
| 21. | 37132 | 12.3% | 5.4%(+6.91)#21 | 5.3%(+7.04)#1,561 |
| 22. | 38061 | 12.0% | 5.4%(+6.59)#22 | 5.3%(+6.72)#1,657 |
| 23. | 37755 | 12.0% | 5.4%(+6.54)#23 | 5.3%(+6.68)#1,679 |
| 24. | 37916 | 11.8% | 5.4%(+6.38)#24 | 5.3%(+6.52)#1,735 |
| 25. | 38313 | 11.8% | 5.4%(+6.36)#25 | 5.3%(+6.49)#1,741 |
| 26. | 37380 | 11.7% | 5.4%(+6.27)#26 | 5.3%(+6.40)#1,783 |
| 27. | 38371 | 11.4% | 5.4%(+5.94)#27 | 5.3%(+6.08)#1,889 |
| 28. | 38449 | 11.2% | 5.4%(+5.79)#28 | 5.3%(+5.93)#1,953 |
| 29. | 37821 | 11.1% | 5.4%(+5.67)#29 | 5.3%(+5.81)#2,017 |
| 30. | 37016 | 11.0% | 5.4%(+5.59)#30 | 5.3%(+5.73)#2,053 |
| 31. | 37687 | 10.9% | 5.4%(+5.46)#31 | 5.3%(+5.59)#2,119 |
| 32. | 38328 | 10.9% | 5.4%(+5.45)#32 | 5.3%(+5.58)#2,122 |
| 33. | 37738 | 10.8% | 5.4%(+5.36)#33 | 5.3%(+5.49)#2,165 |
| 34. | 37315 | 10.7% | 5.4%(+5.29)#34 | 5.3%(+5.43)#2,204 |
| 35. | 37724 | 10.7% | 5.4%(+5.29)#35 | 5.3%(+5.42)#2,205 |
| 36. | 37915 | 10.7% | 5.4%(+5.24)#36 | 5.3%(+5.37)#2,228 |
| 37. | 37912 | 10.6% | 5.4%(+5.15)#37 | 5.3%(+5.29)#2,291 |
| 38. | 38382 | 10.6% | 5.4%(+5.15)#38 | 5.3%(+5.28)#2,296 |
| 39. | 37860 | 10.4% | 5.4%(+5.01)#39 | 5.3%(+5.15)#2,357 |
| 40. | 37366 | 10.4% | 5.4%(+5.01)#40 | 5.3%(+5.14)#2,360 |
| 41. | 37764 | 10.4% | 5.4%(+4.97)#41 | 5.3%(+5.10)#2,377 |
| 42. | 37333 | 10.3% | 5.4%(+4.86)#42 | 5.3%(+4.99)#2,439 |
| 43. | 37311 | 10.3% | 5.4%(+4.85)#43 | 5.3%(+4.99)#2,440 |
| 44. | 37408 | 10.2% | 5.4%(+4.75)#44 | 5.3%(+4.88)#2,502 |
| 45. | 37403 | 9.9% | 5.4%(+4.52)#45 | 5.3%(+4.66)#2,675 |
| 46. | 38344 | 9.9% | 5.4%(+4.49)#46 | 5.3%(+4.63)#2,697 |
| 47. | 37208 | 9.9% | 5.4%(+4.49)#47 | 5.3%(+4.62)#2,701 |
| 48. | 37921 | 9.9% | 5.4%(+4.46)#48 | 5.3%(+4.59)#2,729 |
| 49. | 37640 | 9.8% | 5.4%(+4.39)#49 | 5.3%(+4.53)#2,786 |
| 50. | 37098 | 9.6% | 5.4%(+4.22)#50 | 5.3%(+4.35)#2,935 |
| 51. | 37601 | 9.6% | 5.4%(+4.19)#51 | 5.3%(+4.32)#2,964 |
| 52. | 38152 | 9.4% | 5.4%(+3.99)#52 | 5.3%(+4.13)#3,127 |
| 53. | 38582 | 9.4% | 5.4%(+3.98)#53 | 5.3%(+4.11)#3,144 |
| 54. | 38372 | 9.4% | 5.4%(+3.94)#54 | 5.3%(+4.07)#3,182 |
| 55. | 37357 | 9.3% | 5.4%(+3.92)#55 | 5.3%(+4.06)#3,195 |
| 56. | 37771 | 9.3% | 5.4%(+3.92)#56 | 5.3%(+4.05)#3,209 |
| 57. | 37412 | 9.3% | 5.4%(+3.87)#57 | 5.3%(+4.00)#3,246 |
| 58. | 38345 | 9.3% | 5.4%(+3.85)#58 | 5.3%(+3.98)#3,265 |
| 59. | 38486 | 9.2% | 5.4%(+3.83)#59 | 5.3%(+3.96)#3,280 |
| 60. | 37416 | 9.1% | 5.4%(+3.68)#60 | 5.3%(+3.82)#3,413 |
| 61. | 38112 | 9.1% | 5.4%(+3.68)#61 | 5.3%(+3.81)#3,417 |
| 62. | 38259 | 9.0% | 5.4%(+3.61)#62 | 5.3%(+3.74)#3,500 |
| 63. | 38361 | 8.9% | 5.4%(+3.53)#63 | 5.3%(+3.66)#3,577 |
| 64. | 37871 | 8.9% | 5.4%(+3.52)#64 | 5.3%(+3.66)#3,582 |
| 65. | 37779 | 8.9% | 5.4%(+3.51)#65 | 5.3%(+3.65)#3,589 |
| 66. | 38368 | 8.9% | 5.4%(+3.51)#66 | 5.3%(+3.64)#3,595 |
| 67. | 38108 | 8.8% | 5.4%(+3.41)#67 | 5.3%(+3.54)#3,690 |
| 68. | 38501 | 8.8% | 5.4%(+3.39)#68 | 5.3%(+3.52)#3,720 |
| 69. | 38541 | 8.8% | 5.4%(+3.39)#69 | 5.3%(+3.52)#3,722 |
| 70. | 37683 | 8.8% | 5.4%(+3.34)#70 | 5.3%(+3.47)#3,778 |
| 71. | 37847 | 8.8% | 5.4%(+3.33)#71 | 5.3%(+3.47)#3,780 |
| 72. | 37082 | 8.7% | 5.4%(+3.32)#72 | 5.3%(+3.45)#3,803 |
| 73. | 37814 | 8.7% | 5.4%(+3.25)#73 | 5.3%(+3.38)#3,898 |
| 74. | 37052 | 8.6% | 5.4%(+3.21)#74 | 5.3%(+3.34)#3,929 |
| 75. | 38362 | 8.6% | 5.4%(+3.18)#75 | 5.3%(+3.32)#3,962 |
| 76. | 37722 | 8.6% | 5.4%(+3.18)#76 | 5.3%(+3.31)#3,972 |
| 77. | 38201 | 8.6% | 5.4%(+3.16)#77 | 5.3%(+3.30)#3,988 |
| 78. | 38105 | 8.5% | 5.4%(+3.11)#78 | 5.3%(+3.24)#4,045 |
| 79. | 37130 | 8.5% | 5.4%(+3.04)#79 | 5.3%(+3.17)#4,111 |
| 80. | 37328 | 8.5% | 5.4%(+3.03)#80 | 5.3%(+3.17)#4,114 |
| 81. | 37212 | 8.4% | 5.4%(+3.02)#81 | 5.3%(+3.15)#4,129 |
| 82. | 37853 | 8.4% | 5.4%(+3.01)#82 | 5.3%(+3.14)#4,142 |
| 83. | 38104 | 8.4% | 5.4%(+2.99)#83 | 5.3%(+3.12)#4,167 |
| 84. | 38231 | 8.4% | 5.4%(+2.96)#84 | 5.3%(+3.09)#4,202 |
| 85. | 37115 | 8.3% | 5.4%(+2.90)#85 | 5.3%(+3.03)#4,294 |
| 86. | 37919 | 8.3% | 5.4%(+2.90)#86 | 5.3%(+3.03)#4,295 |
| 87. | 37388 | 8.3% | 5.4%(+2.89)#87 | 5.3%(+3.02)#4,315 |
| 88. | 38127 | 8.3% | 5.4%(+2.88)#88 | 5.3%(+3.01)#4,323 |
| 89. | 38565 | 8.3% | 5.4%(+2.85)#89 | 5.3%(+2.98)#4,351 |
| 90. | 37882 | 8.2% | 5.4%(+2.81)#90 | 5.3%(+2.94)#4,400 |
| 91. | 37402 | 8.2% | 5.4%(+2.80)#91 | 5.3%(+2.93)#4,410 |
| 92. | 38320 | 8.2% | 5.4%(+2.73)#92 | 5.3%(+2.87)#4,510 |
| 93. | 38425 | 8.1% | 5.4%(+2.72)#93 | 5.3%(+2.85)#4,524 |
| 94. | 38107 | 8.1% | 5.4%(+2.71)#94 | 5.3%(+2.84)#4,545 |
| 95. | 37886 | 8.1% | 5.4%(+2.68)#95 | 5.3%(+2.81)#4,580 |
| 96. | 37339 | 8.1% | 5.4%(+2.67)#96 | 5.3%(+2.80)#4,589 |
| 97. | 38579 | 8.1% | 5.4%(+2.65)#97 | 5.3%(+2.78)#4,628 |
| 98. | 38583 | 8.0% | 5.4%(+2.62)#98 | 5.3%(+2.75)#4,670 |
| 99. | 38079 | 8.0% | 5.4%(+2.62)#99 | 5.3%(+2.75)#4,677 |
| 100. | 37332 | 8.0% | 5.4%(+2.61)#100 | 5.3%(+2.74)#4,691 |
Common Questions
What are the Top 10 Zip Codes with the Highest Percentage of Population Employed in Food Preparation & Serving in Tennessee?
Top 10 Zip Codes with the Highest Percentage of Population Employed in Food Preparation & Serving in Tennessee are:
What zip code has the Highest Percentage of Population Employed in Food Preparation & Serving in Tennessee?
38132 has the Highest Percentage of Population Employed in Food Preparation & Serving in Tennessee with 100.0%.
What is the Percentage of Population Employed in Food Preparation & Serving in the State of Tennessee?
Percentage of Population Employed in Food Preparation & Serving in Tennessee is 5.4%.
What is the Percentage of Population Employed in Food Preparation & Serving in the United States?
Percentage of Population Employed in Food Preparation & Serving in the United States is 5.3%.