New Tazewell, TN Map & Demographics
New Tazewell Map
New Tazewell Overview
$27,348
PER CAPITA INCOME
$68,839
AVG FAMILY INCOME
$44,286
AVG HOUSEHOLD INCOME
32.2%
WAGE / INCOME GAP [ % ]
67.8¢/ $1
WAGE / INCOME GAP [ $ ]
0.44
INEQUALITY / GINI INDEX
2,780
TOTAL POPULATION
1,225
MALE POPULATION
1,555
FEMALE POPULATION
78.78
MALES / 100 FEMALES
126.94
FEMALES / 100 MALES
46.2
MEDIAN AGE
2.9
AVG FAMILY SIZE
2.2
AVG HOUSEHOLD SIZE
1,346
LABOR FORCE [ PEOPLE ]
58.4%
PERCENT IN LABOR FORCE
2.7%
UNEMPLOYMENT RATE
New Tazewell Zip Codes
New Tazewell Area Codes
Income in New Tazewell
Income Overview in New Tazewell
Per Capita Income in New Tazewell is $27,348, while median incomes of families and households are $68,839 and $44,286 respectively.
| Characteristic | Number | Measure |
| Per Capita Income | 2,780 | $27,348 |
| Median Family Income | 703 | $68,839 |
| Mean Family Income | 703 | $81,301 |
| Median Household Income | 1,222 | $44,286 |
| Mean Household Income | 1,222 | $59,001 |
| Income Deficit | 703 | $0 |
| Wage / Income Gap (%) | 2,780 | 32.17% |
| Wage / Income Gap ($) | 2,780 | 67.83¢ per $1 |
| Gini / Inequality Index | 2,780 | 0.44 |
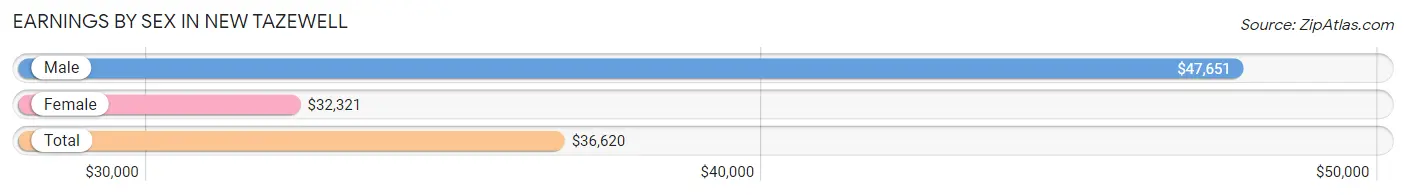
Earnings by Sex in New Tazewell
Average Earnings in New Tazewell are $36,620, $47,651 for men and $32,321 for women, a difference of 32.2%.
| Sex | Number | Average Earnings |
| Male | 674 (49.0%) | $47,651 |
| Female | 702 (51.0%) | $32,321 |
| Total | 1,376 (100.0%) | $36,620 |
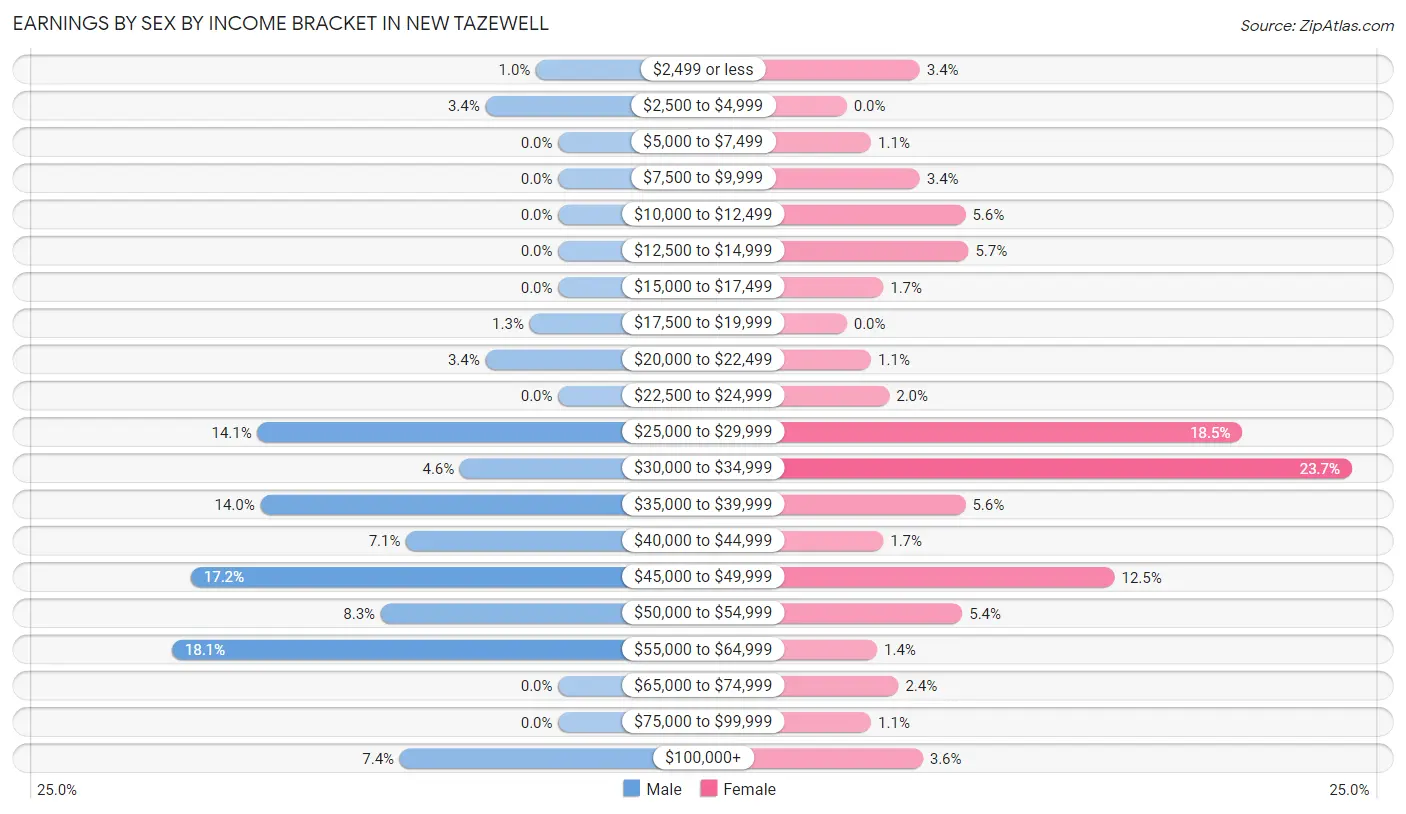
Earnings by Sex by Income Bracket in New Tazewell
The most common earnings brackets in New Tazewell are $55,000 to $64,999 for men (122 | 18.1%) and $30,000 to $34,999 for women (166 | 23.6%).
| Income | Male | Female |
| $2,499 or less | 7 (1.0%) | 24 (3.4%) |
| $2,500 to $4,999 | 23 (3.4%) | 0 (0.0%) |
| $5,000 to $7,499 | 0 (0.0%) | 8 (1.1%) |
| $7,500 to $9,999 | 0 (0.0%) | 24 (3.4%) |
| $10,000 to $12,499 | 0 (0.0%) | 39 (5.6%) |
| $12,500 to $14,999 | 0 (0.0%) | 40 (5.7%) |
| $15,000 to $17,499 | 0 (0.0%) | 12 (1.7%) |
| $17,500 to $19,999 | 9 (1.3%) | 0 (0.0%) |
| $20,000 to $22,499 | 23 (3.4%) | 8 (1.1%) |
| $22,500 to $24,999 | 0 (0.0%) | 14 (2.0%) |
| $25,000 to $29,999 | 95 (14.1%) | 130 (18.5%) |
| $30,000 to $34,999 | 31 (4.6%) | 166 (23.6%) |
| $35,000 to $39,999 | 94 (14.0%) | 39 (5.6%) |
| $40,000 to $44,999 | 48 (7.1%) | 12 (1.7%) |
| $45,000 to $49,999 | 116 (17.2%) | 88 (12.5%) |
| $50,000 to $54,999 | 56 (8.3%) | 38 (5.4%) |
| $55,000 to $64,999 | 122 (18.1%) | 10 (1.4%) |
| $65,000 to $74,999 | 0 (0.0%) | 17 (2.4%) |
| $75,000 to $99,999 | 0 (0.0%) | 8 (1.1%) |
| $100,000+ | 50 (7.4%) | 25 (3.6%) |
| Total | 674 (100.0%) | 702 (100.0%) |
Earnings by Sex by Educational Attainment in New Tazewell
Average earnings in New Tazewell are $47,985 for men and $33,048 for women, a difference of 31.1%. Men with an educational attainment of college or associate's degree enjoy the highest average annual earnings of $55,647, while those with high school diploma education earn the least with $41,801. Women with an educational attainment of less than high school earn the most with the average annual earnings of $33,453, while those with college or associate's degree education have the smallest earnings of $29,167.

| Educational Attainment | Male Income | Female Income |
| Less than High School | - | - |
| High School Diploma | $41,801 | $30,417 |
| College or Associate's Degree | $55,647 | $29,167 |
| Bachelor's Degree | - | - |
| Graduate Degree | - | - |
| Total | $47,985 | $33,048 |
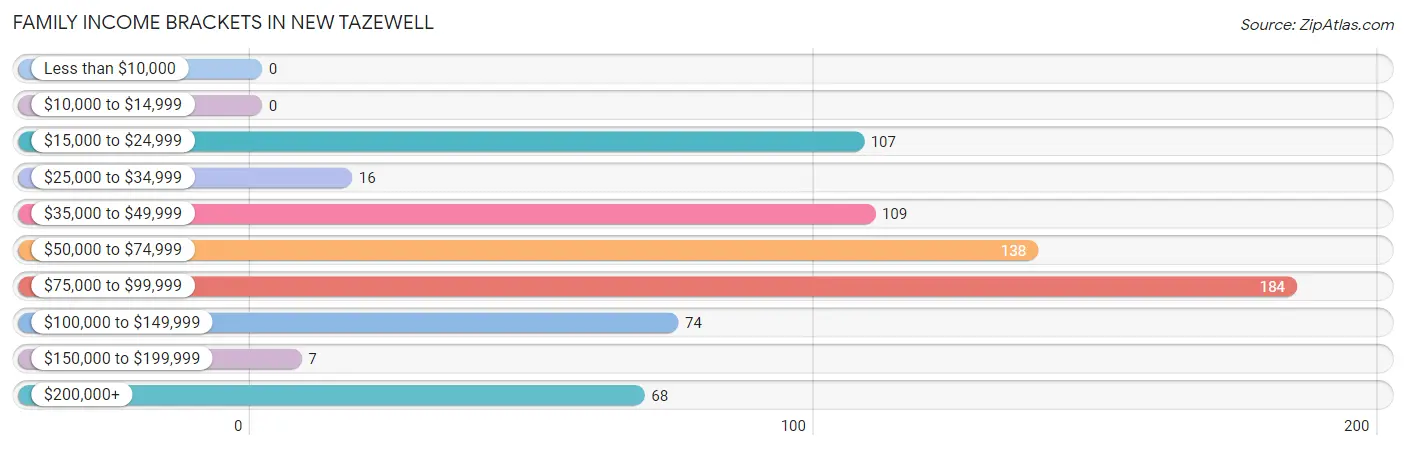
Family Income in New Tazewell
Family Income Brackets in New Tazewell
According to the New Tazewell family income data, there are 184 families falling into the $75,000 to $99,999 income range, which is the most common income bracket and makes up 26.2% of all families.
| Income Bracket | # Families | % Families |
| Less than $10,000 | 0 | 0.0% |
| $10,000 to $14,999 | 0 | 0.0% |
| $15,000 to $24,999 | 107 | 15.2% |
| $25,000 to $34,999 | 16 | 2.3% |
| $35,000 to $49,999 | 109 | 15.5% |
| $50,000 to $74,999 | 138 | 19.6% |
| $75,000 to $99,999 | 184 | 26.2% |
| $100,000 to $149,999 | 74 | 10.5% |
| $150,000 to $199,999 | 7 | 1.0% |
| $200,000+ | 68 | 9.7% |
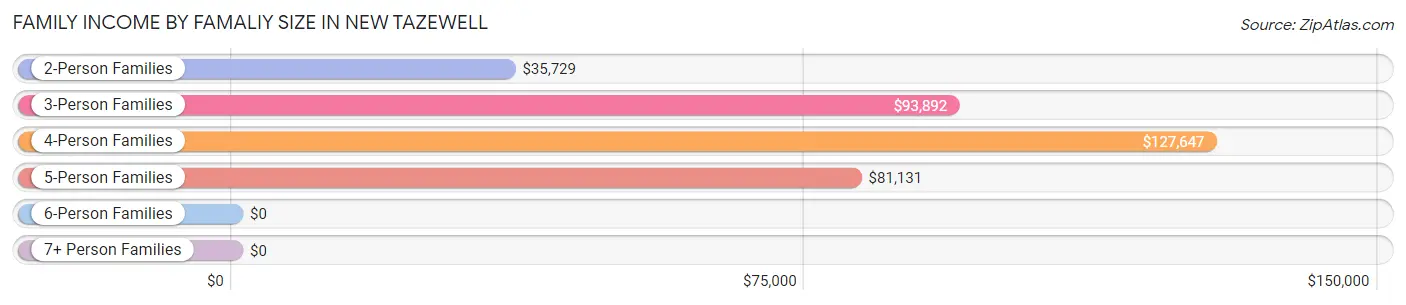
Family Income by Famaliy Size in New Tazewell
4-person families (114 | 16.2%) account for the highest median family income in New Tazewell with $127,647 per family, while 4-person families (114 | 16.2%) have the highest median income of $31,912 per family member.
| Income Bracket | # Families | Median Income |
| 2-Person Families | 236 (33.6%) | $35,729 |
| 3-Person Families | 185 (26.3%) | $93,892 |
| 4-Person Families | 114 (16.2%) | $127,647 |
| 5-Person Families | 93 (13.2%) | $81,131 |
| 6-Person Families | 75 (10.7%) | $0 |
| 7+ Person Families | 0 (0.0%) | $0 |
| Total | 703 (100.0%) | $68,839 |
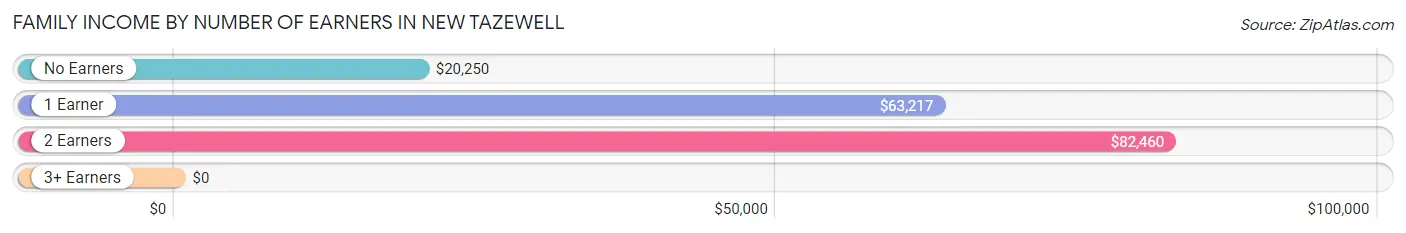
Family Income by Number of Earners in New Tazewell
| Number of Earners | # Families | Median Income |
| No Earners | 145 (20.6%) | $20,250 |
| 1 Earner | 207 (29.4%) | $63,217 |
| 2 Earners | 190 (27.0%) | $82,460 |
| 3+ Earners | 161 (22.9%) | $0 |
| Total | 703 (100.0%) | $68,839 |
Household Income in New Tazewell
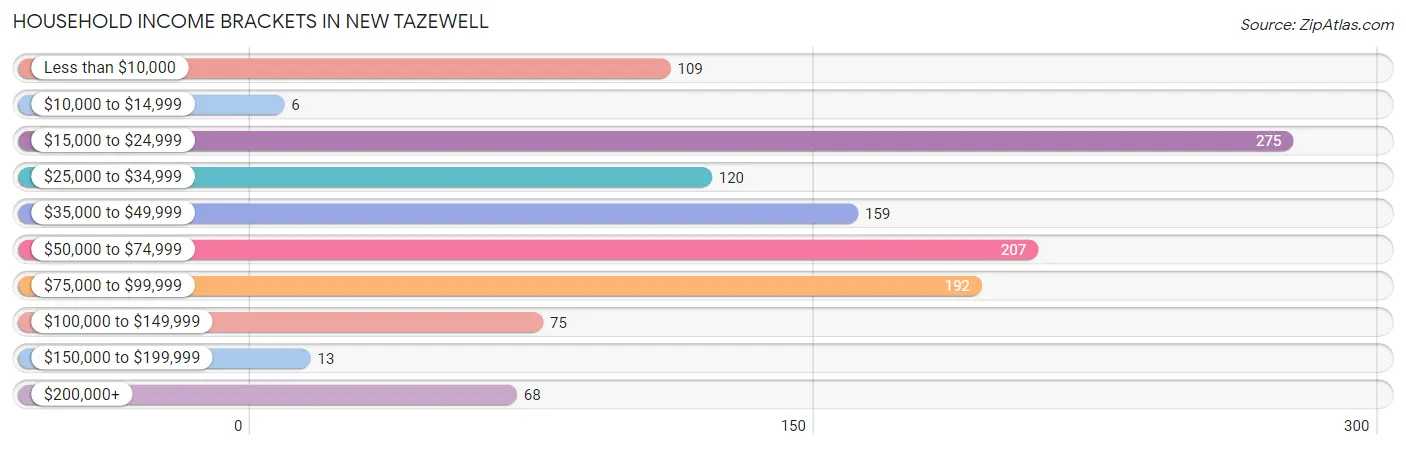
Household Income Brackets in New Tazewell
With 275 households falling in the category, the $15,000 to $24,999 income range is the most frequent in New Tazewell, accounting for 22.5% of all households. In contrast, only 6 households (0.5%) fall into the $10,000 to $14,999 income bracket, making it the least populous group.
| Income Bracket | # Households | % Households |
| Less than $10,000 | 109 | 8.9% |
| $10,000 to $14,999 | 6 | 0.5% |
| $15,000 to $24,999 | 275 | 22.5% |
| $25,000 to $34,999 | 120 | 9.8% |
| $35,000 to $49,999 | 159 | 13.0% |
| $50,000 to $74,999 | 207 | 16.9% |
| $75,000 to $99,999 | 192 | 15.7% |
| $100,000 to $149,999 | 75 | 6.1% |
| $150,000 to $199,999 | 13 | 1.1% |
| $200,000+ | 68 | 5.6% |
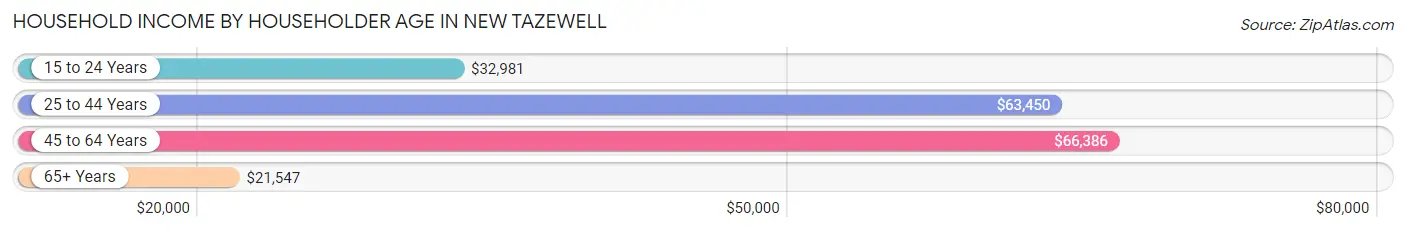
Household Income by Householder Age in New Tazewell
The median household income in New Tazewell is $44,286, with the highest median household income of $66,386 found in the 45 to 64 years age bracket for the primary householder. A total of 465 households (38.1%) fall into this category. Meanwhile, the 65+ years age bracket for the primary householder has the lowest median household income of $21,547, with 429 households (35.1%) in this group.
| Income Bracket | # Households | Median Income |
| 15 to 24 Years | 21 (1.7%) | $32,981 |
| 25 to 44 Years | 307 (25.1%) | $63,450 |
| 45 to 64 Years | 465 (38.1%) | $66,386 |
| 65+ Years | 429 (35.1%) | $21,547 |
| Total | 1,222 (100.0%) | $44,286 |
Poverty in New Tazewell
Income Below Poverty by Sex and Age in New Tazewell
With 3.7% poverty level for males and 16.3% for females among the residents of New Tazewell, 65 to 74 year old males and 75 year old and over females are the most vulnerable to poverty, with 29 males (25.0%) and 100 females (42.9%) in their respective age groups living below the poverty level.
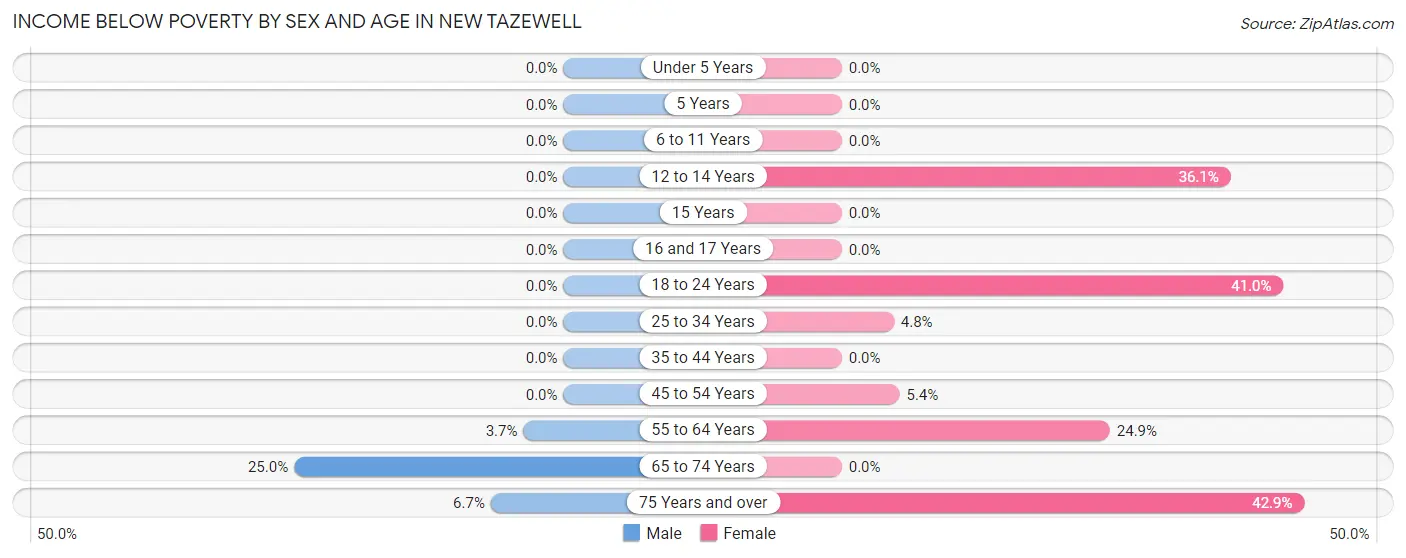
| Age Bracket | Male | Female |
| Under 5 Years | 0 (0.0%) | 0 (0.0%) |
| 5 Years | 0 (0.0%) | 0 (0.0%) |
| 6 to 11 Years | 0 (0.0%) | 0 (0.0%) |
| 12 to 14 Years | 0 (0.0%) | 48 (36.1%) |
| 15 Years | 0 (0.0%) | 0 (0.0%) |
| 16 and 17 Years | 0 (0.0%) | 0 (0.0%) |
| 18 to 24 Years | 0 (0.0%) | 25 (41.0%) |
| 25 to 34 Years | 0 (0.0%) | 10 (4.8%) |
| 35 to 44 Years | 0 (0.0%) | 0 (0.0%) |
| 45 to 54 Years | 0 (0.0%) | 12 (5.4%) |
| 55 to 64 Years | 8 (3.7%) | 50 (24.9%) |
| 65 to 74 Years | 29 (25.0%) | 0 (0.0%) |
| 75 Years and over | 6 (6.7%) | 100 (42.9%) |
| Total | 43 (3.7%) | 245 (16.3%) |
Income Above Poverty by Sex and Age in New Tazewell
According to the poverty statistics in New Tazewell, males aged under 5 years and females aged under 5 years are the age groups that are most secure financially, with 100.0% of males and 100.0% of females in these age groups living above the poverty line.
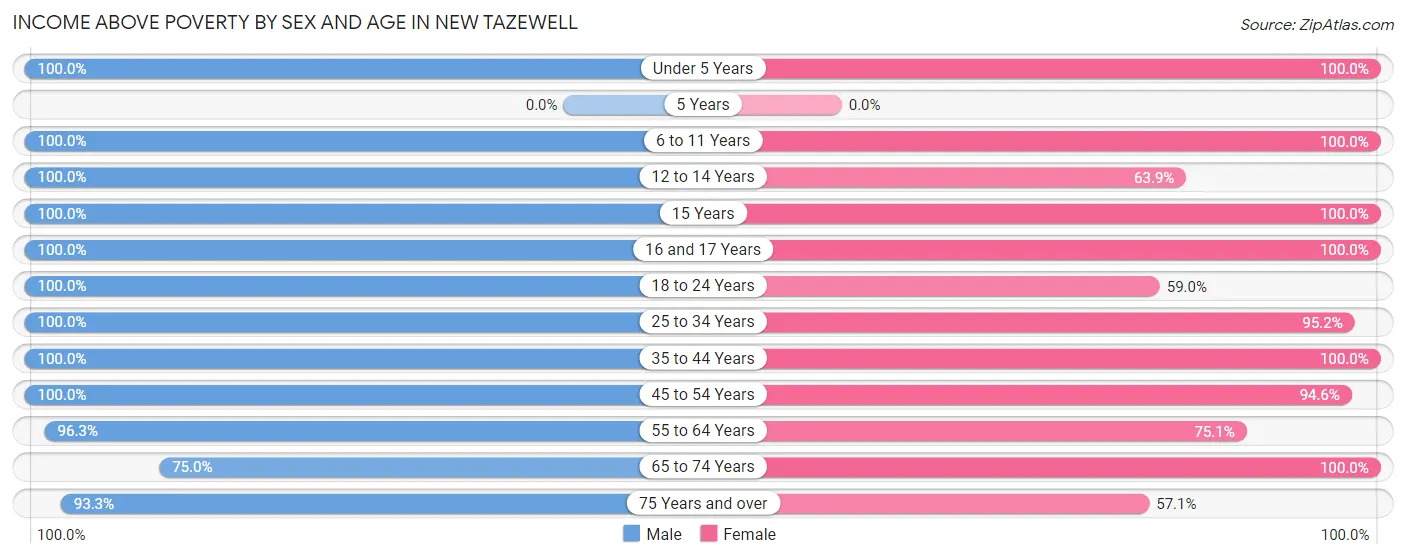
| Age Bracket | Male | Female |
| Under 5 Years | 84 (100.0%) | 88 (100.0%) |
| 5 Years | 0 (0.0%) | 0 (0.0%) |
| 6 to 11 Years | 13 (100.0%) | 115 (100.0%) |
| 12 to 14 Years | 15 (100.0%) | 85 (63.9%) |
| 15 Years | 3 (100.0%) | 25 (100.0%) |
| 16 and 17 Years | 49 (100.0%) | 24 (100.0%) |
| 18 to 24 Years | 43 (100.0%) | 36 (59.0%) |
| 25 to 34 Years | 156 (100.0%) | 197 (95.2%) |
| 35 to 44 Years | 195 (100.0%) | 102 (100.0%) |
| 45 to 54 Years | 174 (100.0%) | 212 (94.6%) |
| 55 to 64 Years | 207 (96.3%) | 151 (75.1%) |
| 65 to 74 Years | 87 (75.0%) | 88 (100.0%) |
| 75 Years and over | 83 (93.3%) | 133 (57.1%) |
| Total | 1,109 (96.3%) | 1,256 (83.7%) |
Income Below Poverty Among Married-Couple Families in New Tazewell
The poverty statistics for married-couple families in New Tazewell show that 2.4% or 12 of the total 502 families live below the poverty line. Families with no children have the highest poverty rate of 7.0%, comprising of 12 families. On the other hand, families with 1 or 2 children have the lowest poverty rate of 0.0%, which includes 0 families.
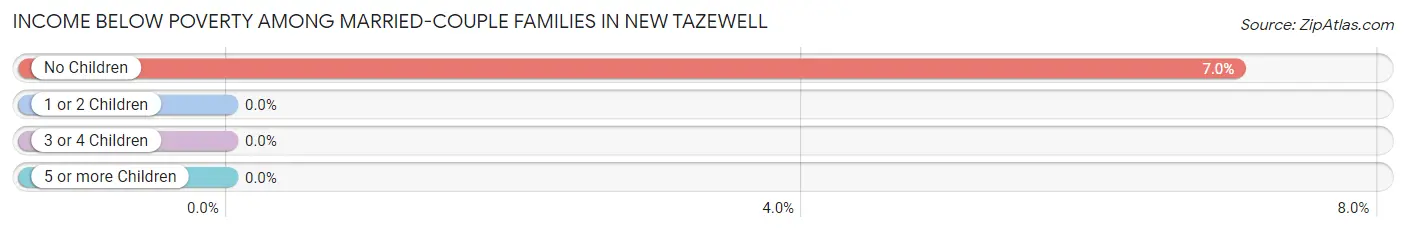
| Children | Above Poverty | Below Poverty |
| No Children | 159 (93.0%) | 12 (7.0%) |
| 1 or 2 Children | 193 (100.0%) | 0 (0.0%) |
| 3 or 4 Children | 138 (100.0%) | 0 (0.0%) |
| 5 or more Children | 0 (0.0%) | 0 (0.0%) |
| Total | 490 (97.6%) | 12 (2.4%) |
Income Below Poverty Among Single-Parent Households in New Tazewell
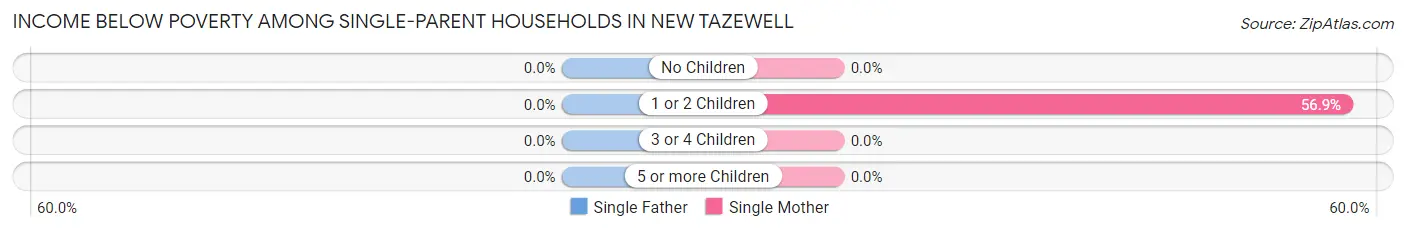
| Children | Single Father | Single Mother |
| No Children | 0 (0.0%) | 0 (0.0%) |
| 1 or 2 Children | 0 (0.0%) | 70 (56.9%) |
| 3 or 4 Children | 0 (0.0%) | 0 (0.0%) |
| 5 or more Children | 0 (0.0%) | 0 (0.0%) |
| Total | 0 (0.0%) | 70 (41.9%) |
Income Below Poverty Among Married-Couple vs Single-Parent Households in New Tazewell
The poverty data for New Tazewell shows that 12 of the married-couple family households (2.4%) and 70 of the single-parent households (34.8%) are living below the poverty level. Within the married-couple family households, those with no children have the highest poverty rate, with 12 households (7.0%) falling below the poverty line. Among the single-parent households, those with 1 or 2 children have the highest poverty rate, with 70 household (44.6%) living below poverty.
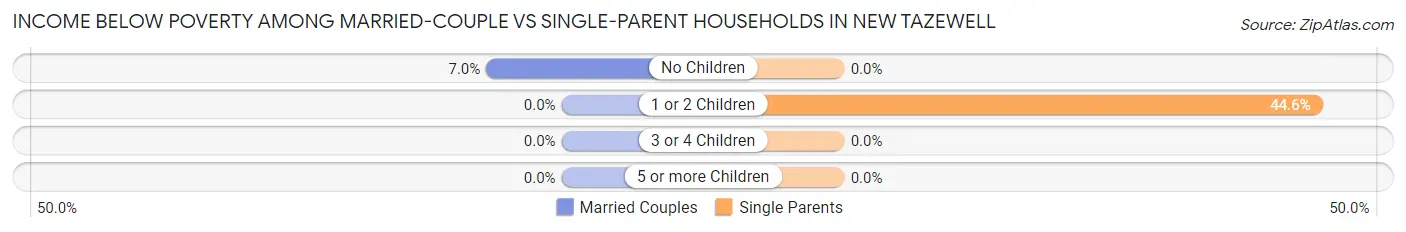
| Children | Married-Couple Families | Single-Parent Households |
| No Children | 12 (7.0%) | 0 (0.0%) |
| 1 or 2 Children | 0 (0.0%) | 70 (44.6%) |
| 3 or 4 Children | 0 (0.0%) | 0 (0.0%) |
| 5 or more Children | 0 (0.0%) | 0 (0.0%) |
| Total | 12 (2.4%) | 70 (34.8%) |
Race in New Tazewell
The most populous races in New Tazewell are White / Caucasian (2,684 | 96.6%), Black / African American (56 | 2.0%), and Two or more Races (21 | 0.8%).
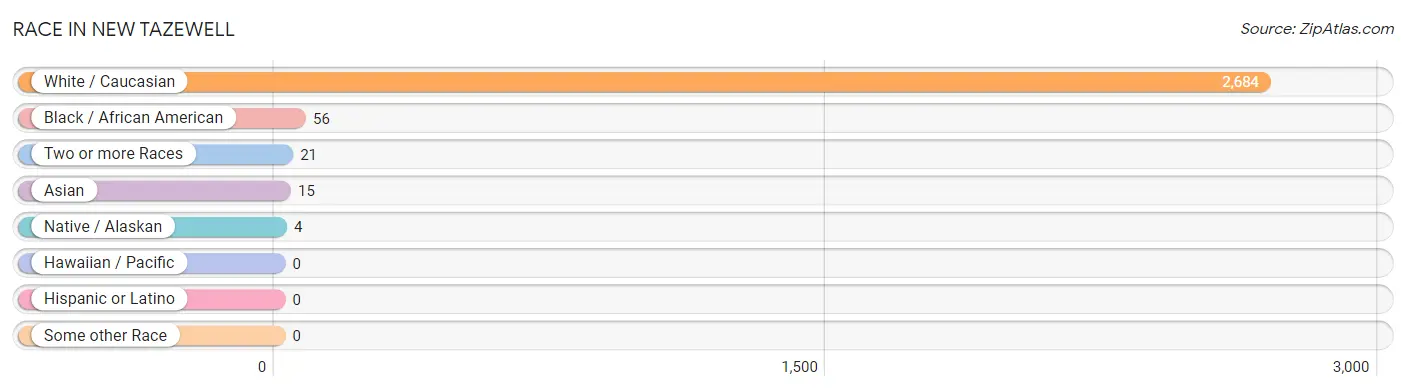
| Race | # Population | % Population |
| Asian | 15 | 0.5% |
| Black / African American | 56 | 2.0% |
| Hawaiian / Pacific | 0 | 0.0% |
| Hispanic or Latino | 0 | 0.0% |
| Native / Alaskan | 4 | 0.1% |
| White / Caucasian | 2,684 | 96.6% |
| Two or more Races | 21 | 0.8% |
| Some other Race | 0 | 0.0% |
| Total | 2,780 | 100.0% |
Ancestry in New Tazewell
The most populous ancestries reported in New Tazewell are English (362 | 13.0%), Irish (308 | 11.1%), German (305 | 11.0%), American (200 | 7.2%), and Scottish (125 | 4.5%), together accounting for 46.8% of all New Tazewell residents.
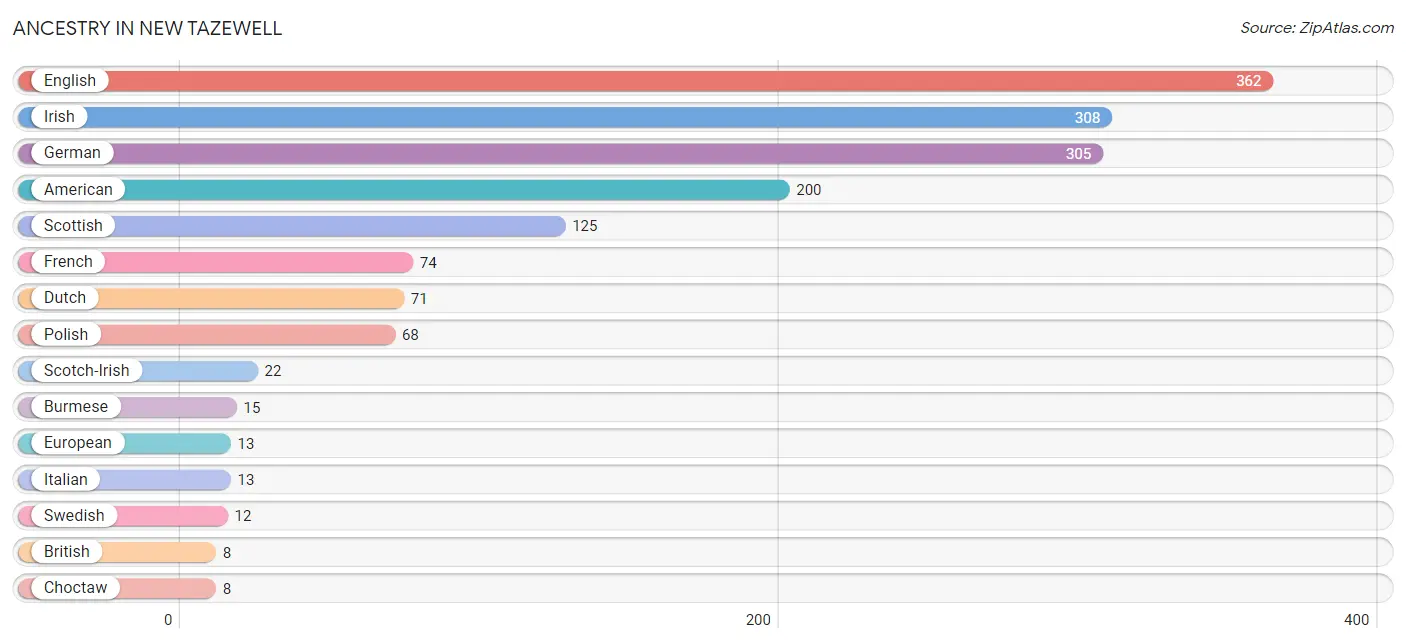
| Ancestry | # Population | % Population |
| African | 5 | 0.2% |
| American | 200 | 7.2% |
| Apache | 4 | 0.1% |
| British | 8 | 0.3% |
| Burmese | 15 | 0.5% |
| Choctaw | 8 | 0.3% |
| Dutch | 71 | 2.5% |
| English | 362 | 13.0% |
| European | 13 | 0.5% |
| French | 74 | 2.7% |
| German | 305 | 11.0% |
| Irish | 308 | 11.1% |
| Italian | 13 | 0.5% |
| Polish | 68 | 2.5% |
| Scotch-Irish | 22 | 0.8% |
| Scottish | 125 | 4.5% |
| Subsaharan African | 5 | 0.2% |
| Swedish | 12 | 0.4% | View All 18 Rows |
Immigrants in New Tazewell
The most numerous immigrant groups reported in New Tazewell came from Asia (15 | 0.5%), Eastern Asia (15 | 0.5%), and Korea (15 | 0.5%), together accounting for 1.6% of all New Tazewell residents.
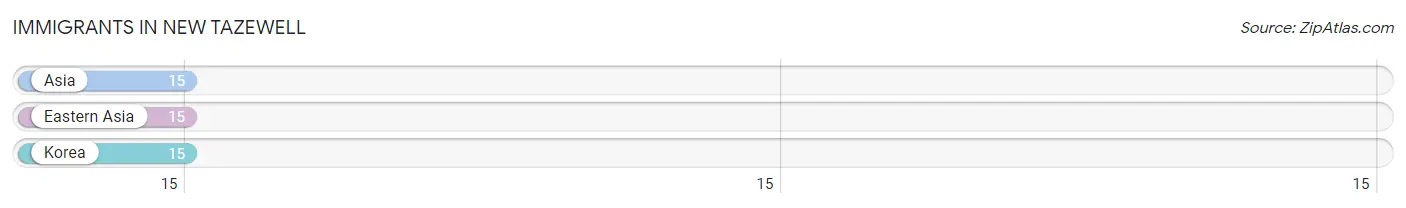
| Immigration Origin | # Population | % Population |
| Asia | 15 | 0.5% |
| Eastern Asia | 15 | 0.5% |
| Korea | 15 | 0.5% | View All 3 Rows |
Sex and Age in New Tazewell
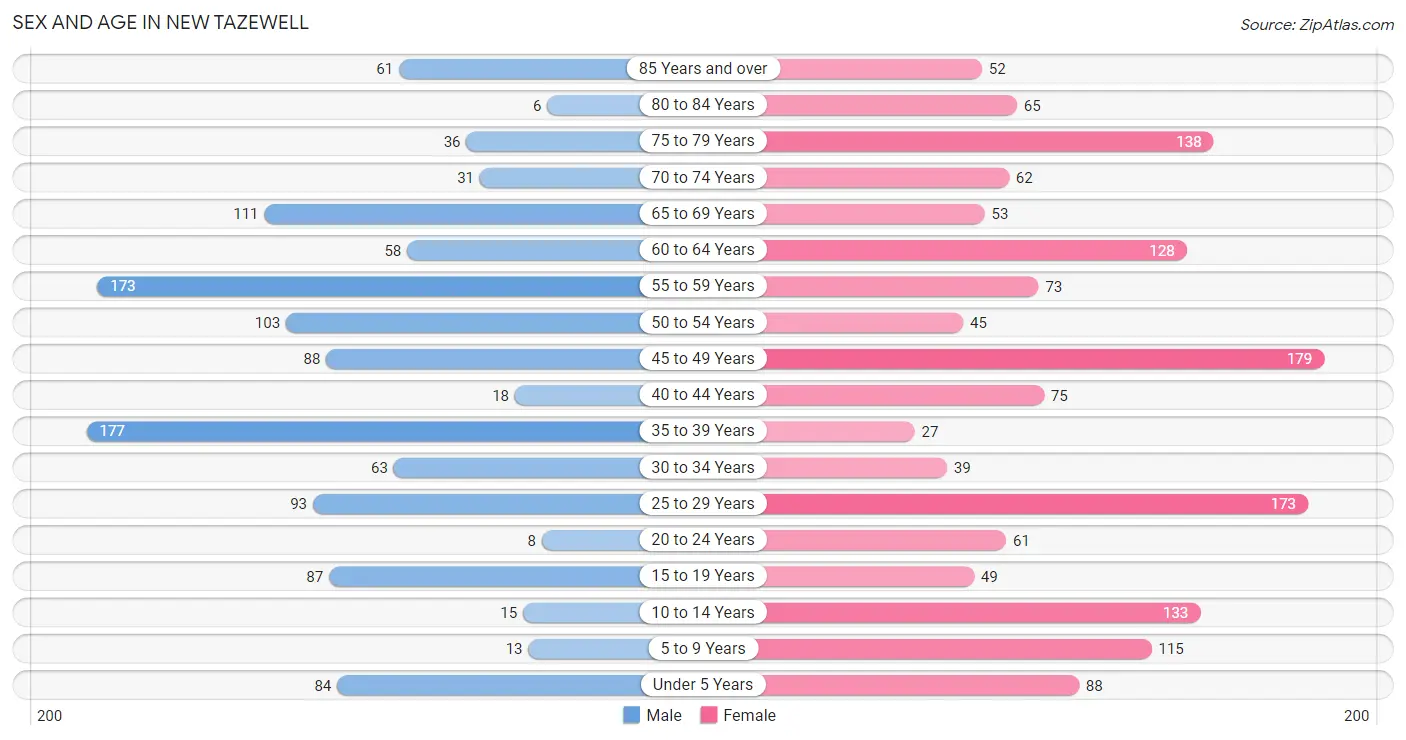
Sex and Age in New Tazewell
The most populous age groups in New Tazewell are 35 to 39 Years (177 | 14.4%) for men and 45 to 49 Years (179 | 11.5%) for women.
| Age Bracket | Male | Female |
| Under 5 Years | 84 (6.9%) | 88 (5.7%) |
| 5 to 9 Years | 13 (1.1%) | 115 (7.4%) |
| 10 to 14 Years | 15 (1.2%) | 133 (8.6%) |
| 15 to 19 Years | 87 (7.1%) | 49 (3.2%) |
| 20 to 24 Years | 8 (0.6%) | 61 (3.9%) |
| 25 to 29 Years | 93 (7.6%) | 173 (11.1%) |
| 30 to 34 Years | 63 (5.1%) | 39 (2.5%) |
| 35 to 39 Years | 177 (14.4%) | 27 (1.7%) |
| 40 to 44 Years | 18 (1.5%) | 75 (4.8%) |
| 45 to 49 Years | 88 (7.2%) | 179 (11.5%) |
| 50 to 54 Years | 103 (8.4%) | 45 (2.9%) |
| 55 to 59 Years | 173 (14.1%) | 73 (4.7%) |
| 60 to 64 Years | 58 (4.7%) | 128 (8.2%) |
| 65 to 69 Years | 111 (9.1%) | 53 (3.4%) |
| 70 to 74 Years | 31 (2.5%) | 62 (4.0%) |
| 75 to 79 Years | 36 (2.9%) | 138 (8.9%) |
| 80 to 84 Years | 6 (0.5%) | 65 (4.2%) |
| 85 Years and over | 61 (5.0%) | 52 (3.3%) |
| Total | 1,225 (100.0%) | 1,555 (100.0%) |
Families and Households in New Tazewell
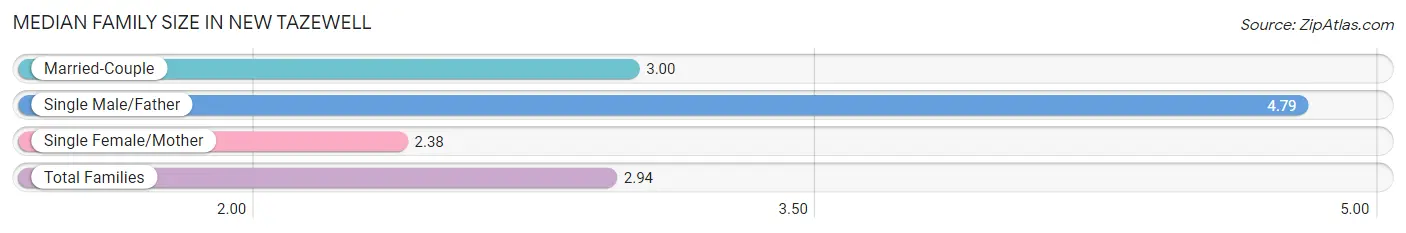
Median Family Size in New Tazewell
The median family size in New Tazewell is 2.94 persons per family, with single male/father families (34 | 4.8%) accounting for the largest median family size of 4.79 persons per family. On the other hand, single female/mother families (167 | 23.8%) represent the smallest median family size with 2.38 persons per family.
| Family Type | # Families | Family Size |
| Married-Couple | 502 (71.4%) | 3.00 |
| Single Male/Father | 34 (4.8%) | 4.79 |
| Single Female/Mother | 167 (23.8%) | 2.38 |
| Total Families | 703 (100.0%) | 2.94 |
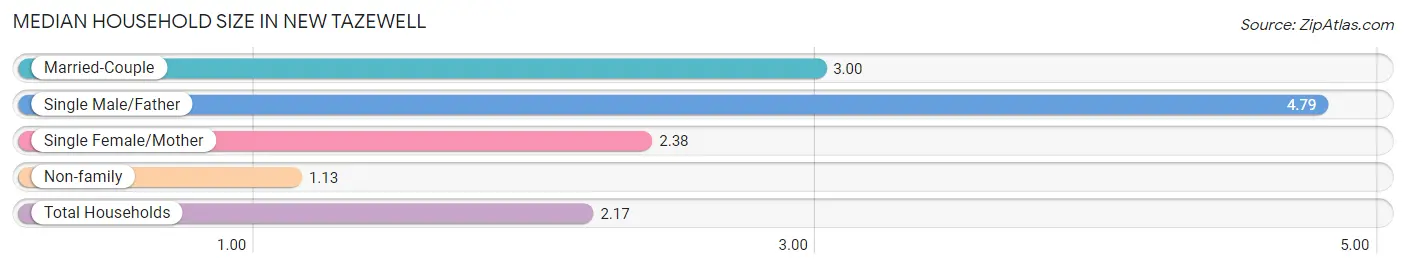
Median Household Size in New Tazewell
The median household size in New Tazewell is 2.17 persons per household, with single male/father households (34 | 2.8%) accounting for the largest median household size of 4.79 persons per household. non-family households (519 | 42.5%) represent the smallest median household size with 1.13 persons per household.
| Household Type | # Households | Household Size |
| Married-Couple | 502 (41.1%) | 3.00 |
| Single Male/Father | 34 (2.8%) | 4.79 |
| Single Female/Mother | 167 (13.7%) | 2.38 |
| Non-family | 519 (42.5%) | 1.13 |
| Total Households | 1,222 (100.0%) | 2.17 |
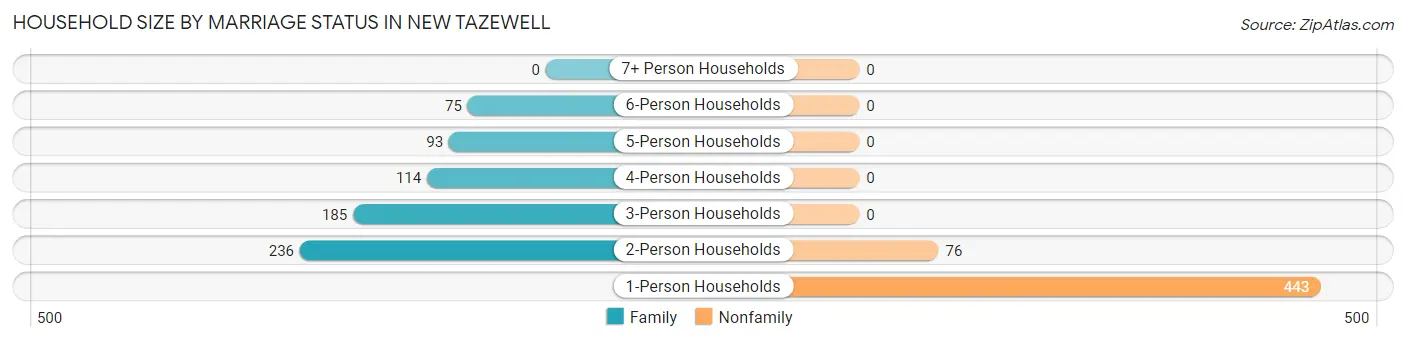
Household Size by Marriage Status in New Tazewell
Out of a total of 1,222 households in New Tazewell, 703 (57.5%) are family households, while 519 (42.5%) are nonfamily households. The most numerous type of family households are 2-person households, comprising 236, and the most common type of nonfamily households are 1-person households, comprising 443.
| Household Size | Family Households | Nonfamily Households |
| 1-Person Households | - | 443 (36.2%) |
| 2-Person Households | 236 (19.3%) | 76 (6.2%) |
| 3-Person Households | 185 (15.1%) | 0 (0.0%) |
| 4-Person Households | 114 (9.3%) | 0 (0.0%) |
| 5-Person Households | 93 (7.6%) | 0 (0.0%) |
| 6-Person Households | 75 (6.1%) | 0 (0.0%) |
| 7+ Person Households | 0 (0.0%) | 0 (0.0%) |
| Total | 703 (57.5%) | 519 (42.5%) |
Female Fertility in New Tazewell
Fertility by Age in New Tazewell
Average fertility rate in New Tazewell is 86.0 births per 1,000 women. Women in the age bracket of 20 to 34 years have the highest fertility rate with 201.0 births per 1,000 women. Women in the age bracket of 20 to 34 years acount for 100.0% of all women with births.
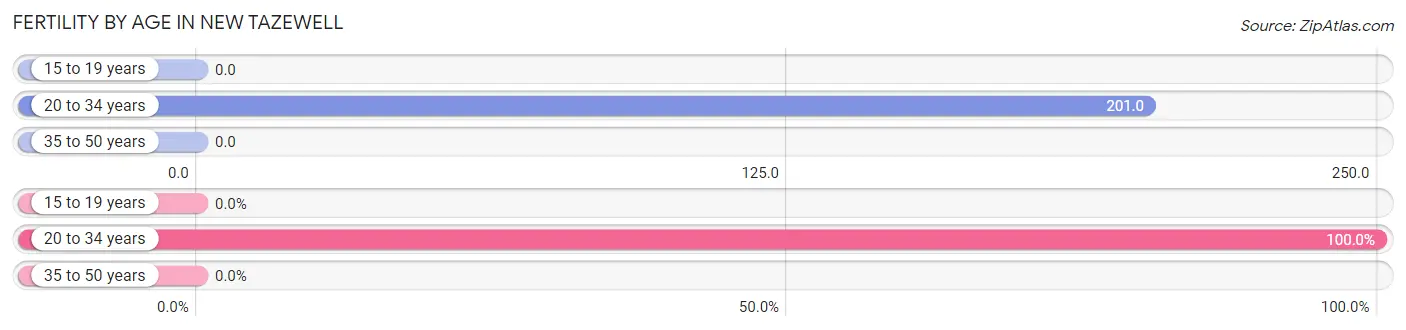
| Age Bracket | Women with Births | Births / 1,000 Women |
| 15 to 19 years | 0 (0.0%) | 0.0 |
| 20 to 34 years | 55 (100.0%) | 201.0 |
| 35 to 50 years | 0 (0.0%) | 0.0 |
| Total | 55 (100.0%) | 86.0 |
Fertility by Age by Marriage Status in New Tazewell
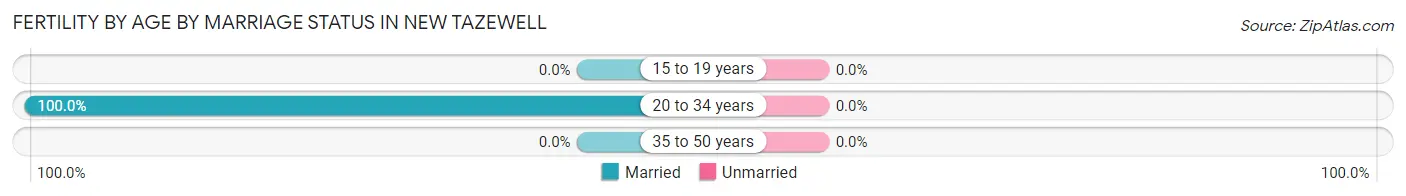
| Age Bracket | Married | Unmarried |
| 15 to 19 years | 0 (0.0%) | 0 (0.0%) |
| 20 to 34 years | 55 (100.0%) | 0 (0.0%) |
| 35 to 50 years | 0 (0.0%) | 0 (0.0%) |
| Total | 55 (100.0%) | 0 (0.0%) |
Fertility by Education in New Tazewell
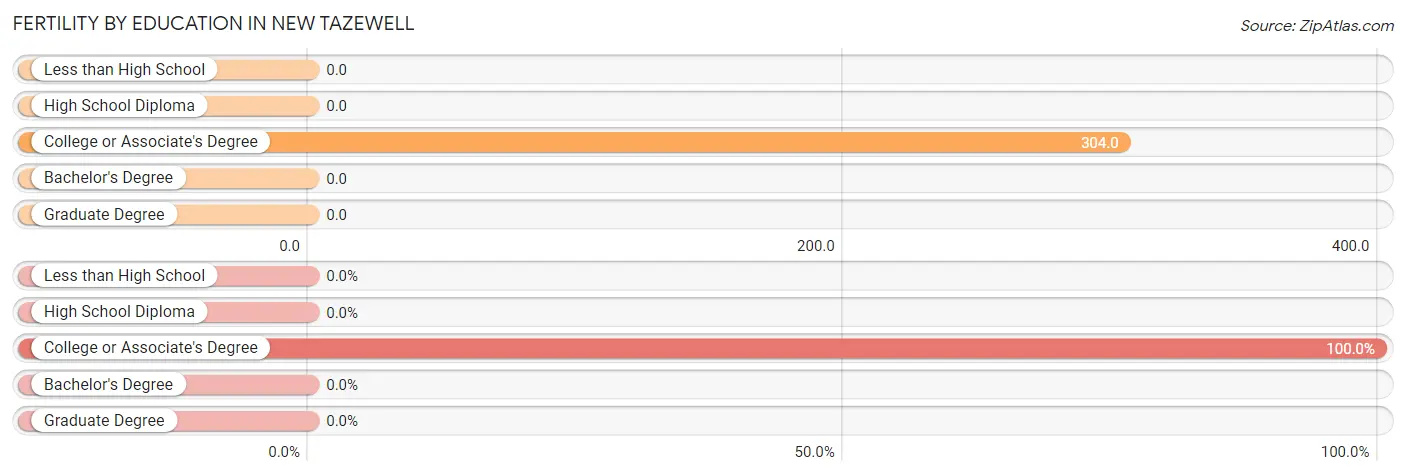
| Educational Attainment | Women with Births | Births / 1,000 Women |
| Less than High School | 0 (0.0%) | 0.0 |
| High School Diploma | 0 (0.0%) | 0.0 |
| College or Associate's Degree | 55 (100.0%) | 304.0 |
| Bachelor's Degree | 0 (0.0%) | 0.0 |
| Graduate Degree | 0 (0.0%) | 0.0 |
| Total | 55 (100.0%) | 86.0 |
Fertility by Education by Marriage Status in New Tazewell
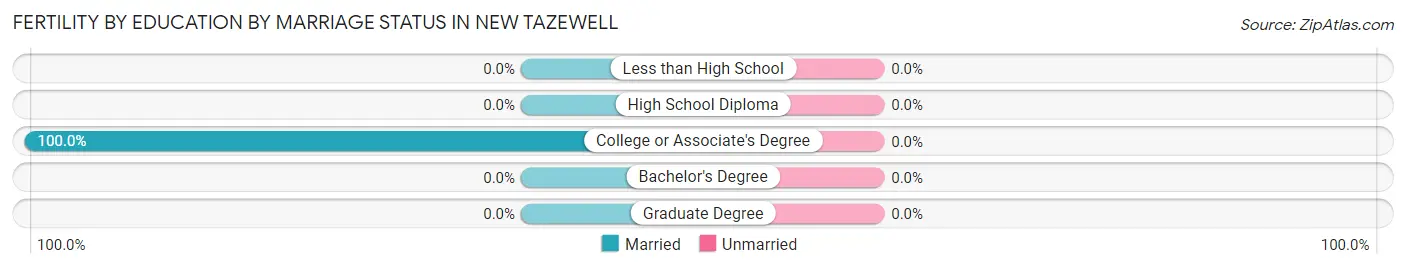
| Educational Attainment | Married | Unmarried |
| Less than High School | 0 (0.0%) | 0 (0.0%) |
| High School Diploma | 0 (0.0%) | 0 (0.0%) |
| College or Associate's Degree | 55 (100.0%) | 0 (0.0%) |
| Bachelor's Degree | 0 (0.0%) | 0 (0.0%) |
| Graduate Degree | 0 (0.0%) | 0 (0.0%) |
| Total | 55 (100.0%) | 0 (0.0%) |
Employment Characteristics in New Tazewell
Employment by Class of Employer in New Tazewell
Among the 1,309 employed individuals in New Tazewell, private company employees (1,121 | 85.6%), not-for-profit organizations (88 | 6.7%), and local government employees (47 | 3.6%) make up the most common classes of employment.
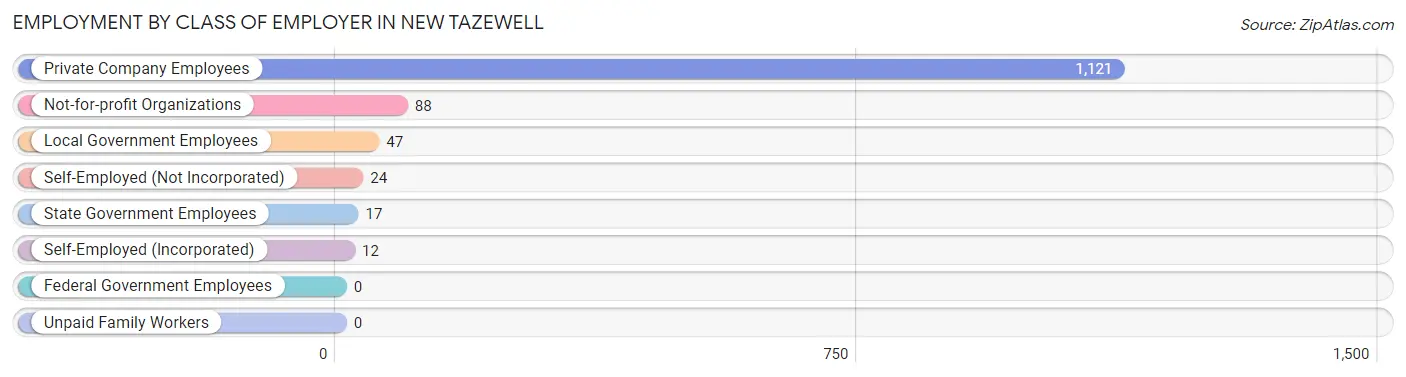
| Employer Class | # Employees | % Employees |
| Private Company Employees | 1,121 | 85.6% |
| Self-Employed (Incorporated) | 12 | 0.9% |
| Self-Employed (Not Incorporated) | 24 | 1.8% |
| Not-for-profit Organizations | 88 | 6.7% |
| Local Government Employees | 47 | 3.6% |
| State Government Employees | 17 | 1.3% |
| Federal Government Employees | 0 | 0.0% |
| Unpaid Family Workers | 0 | 0.0% |
| Total | 1,309 | 100.0% |
Employment Status by Age in New Tazewell
According to the labor force statistics for New Tazewell, out of the total population over 16 years of age (2,304), 58.4% or 1,346 individuals are in the labor force, with 2.7% or 36 of them unemployed. The age group with the highest labor force participation rate is 30 to 34 years, with 100.0% or 102 individuals in the labor force. Within the labor force, the 16 to 19 years age range has the highest percentage of unemployed individuals, with 48.9% or 23 of them being unemployed.
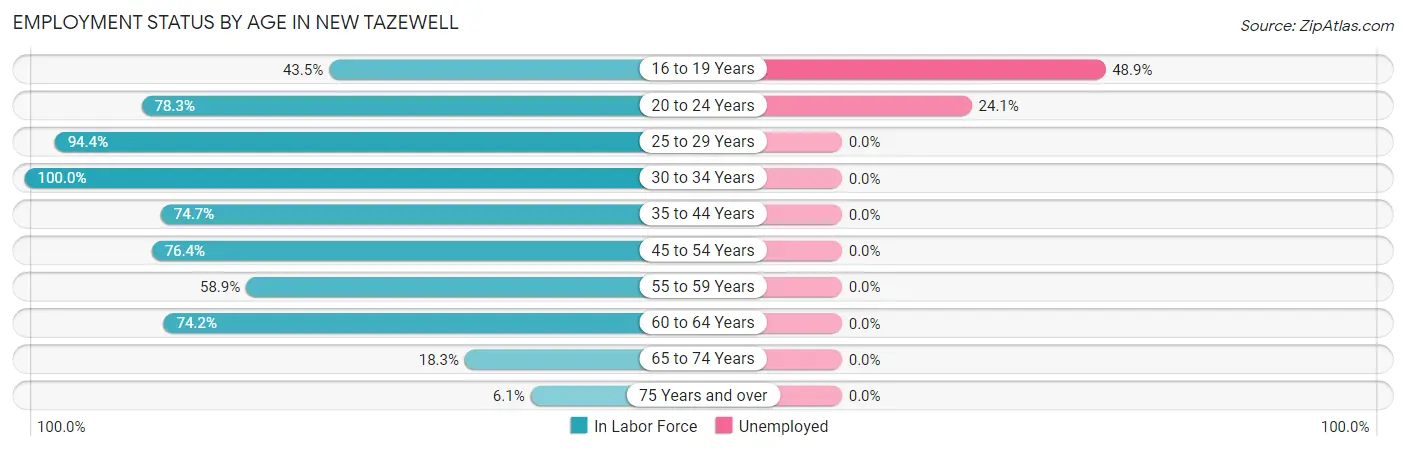
| Age Bracket | In Labor Force | Unemployed |
| 16 to 19 Years | 47 (43.5%) | 23 (48.9%) |
| 20 to 24 Years | 54 (78.3%) | 13 (24.1%) |
| 25 to 29 Years | 251 (94.4%) | 0 (0.0%) |
| 30 to 34 Years | 102 (100.0%) | 0 (0.0%) |
| 35 to 44 Years | 222 (74.7%) | 0 (0.0%) |
| 45 to 54 Years | 317 (76.4%) | 0 (0.0%) |
| 55 to 59 Years | 145 (58.9%) | 0 (0.0%) |
| 60 to 64 Years | 138 (74.2%) | 0 (0.0%) |
| 65 to 74 Years | 47 (18.3%) | 0 (0.0%) |
| 75 Years and over | 22 (6.1%) | 0 (0.0%) |
| Total | 1,346 (58.4%) | 36 (2.7%) |
Employment Status by Educational Attainment in New Tazewell

| Educational Attainment | In Labor Force | Unemployed |
| Less than High School | 73 (34.1%) | 0 (0.0%) |
| High School Diploma | 619 (77.5%) | 0 (0.0%) |
| College / Associate Degree | 318 (97.0%) | 0 (0.0%) |
| Bachelor's Degree or higher | 165 (96.5%) | 0 (0.0%) |
| Total | 1,175 (77.7%) | 0 (0.0%) |
Employment Occupations by Sex in New Tazewell
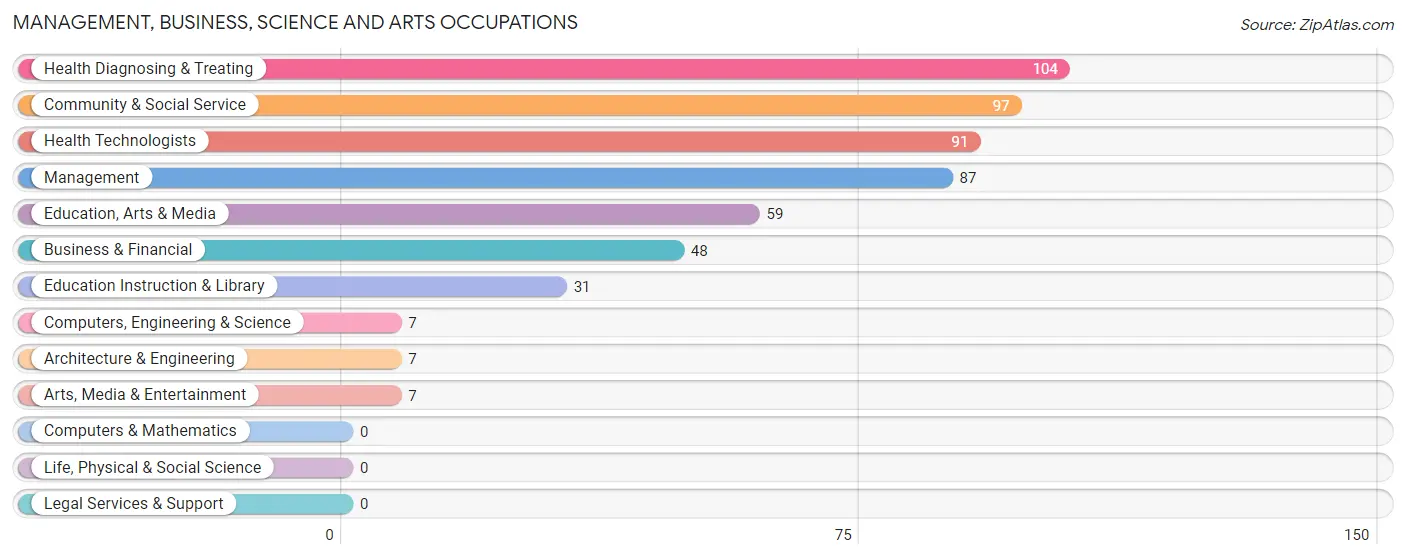
Management, Business, Science and Arts Occupations
The most common Management, Business, Science and Arts occupations in New Tazewell are Health Diagnosing & Treating (104 | 7.9%), Community & Social Service (97 | 7.4%), Health Technologists (91 | 7.0%), Management (87 | 6.7%), and Education, Arts & Media (59 | 4.5%).
Management, Business, Science and Arts Occupations by Sex
Within the Management, Business, Science and Arts occupations in New Tazewell, the most male-oriented occupations are Computers, Engineering & Science (100.0%), Architecture & Engineering (100.0%), and Education Instruction & Library (100.0%), while the most female-oriented occupations are Business & Financial (100.0%), Education, Arts & Media (83.1%), and Health Technologists (74.7%).
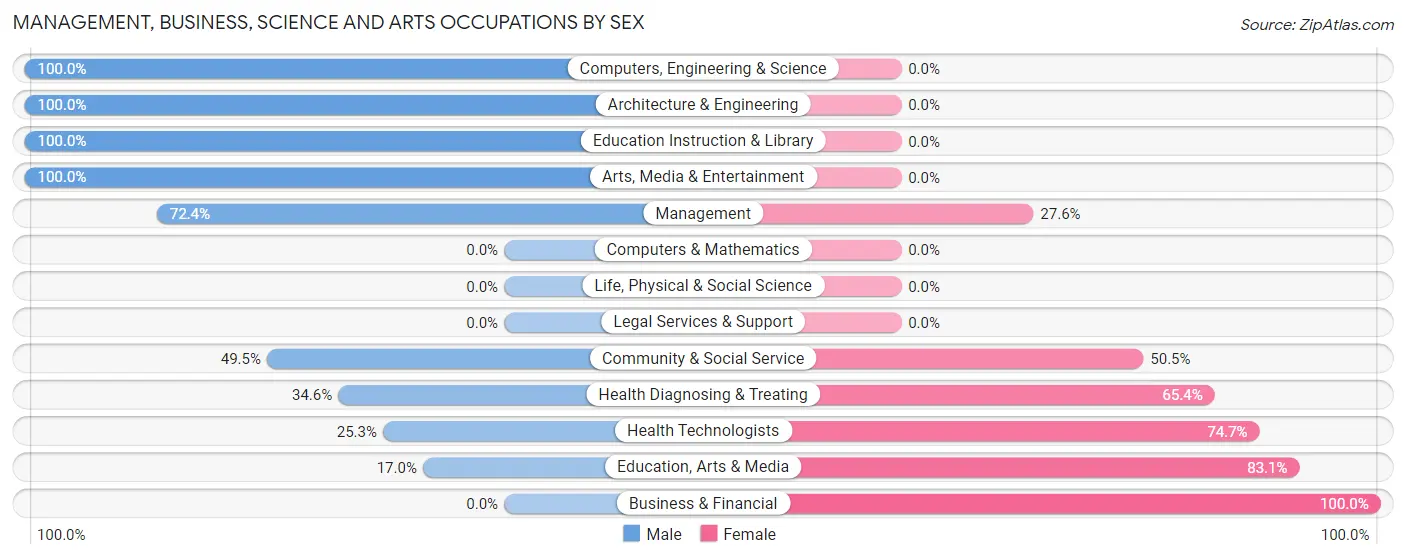
| Occupation | Male | Female |
| Management | 63 (72.4%) | 24 (27.6%) |
| Business & Financial | 0 (0.0%) | 48 (100.0%) |
| Computers, Engineering & Science | 7 (100.0%) | 0 (0.0%) |
| Computers & Mathematics | 0 (0.0%) | 0 (0.0%) |
| Architecture & Engineering | 7 (100.0%) | 0 (0.0%) |
| Life, Physical & Social Science | 0 (0.0%) | 0 (0.0%) |
| Community & Social Service | 48 (49.5%) | 49 (50.5%) |
| Education, Arts & Media | 10 (17.0%) | 49 (83.1%) |
| Legal Services & Support | 0 (0.0%) | 0 (0.0%) |
| Education Instruction & Library | 31 (100.0%) | 0 (0.0%) |
| Arts, Media & Entertainment | 7 (100.0%) | 0 (0.0%) |
| Health Diagnosing & Treating | 36 (34.6%) | 68 (65.4%) |
| Health Technologists | 23 (25.3%) | 68 (74.7%) |
| Total (Category) | 154 (44.9%) | 189 (55.1%) |
| Total (Overall) | 642 (49.0%) | 667 (50.9%) |
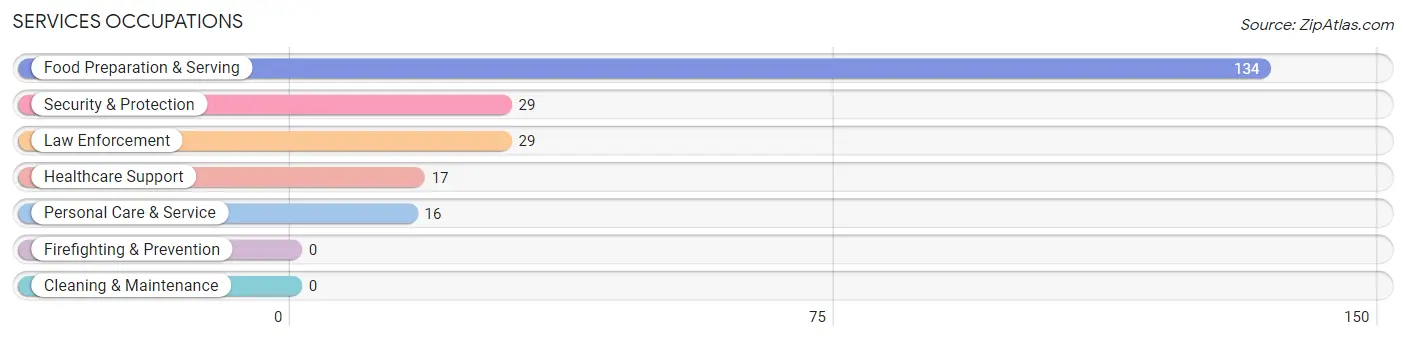
Services Occupations
The most common Services occupations in New Tazewell are Food Preparation & Serving (134 | 10.2%), Security & Protection (29 | 2.2%), Law Enforcement (29 | 2.2%), Healthcare Support (17 | 1.3%), and Personal Care & Service (16 | 1.2%).
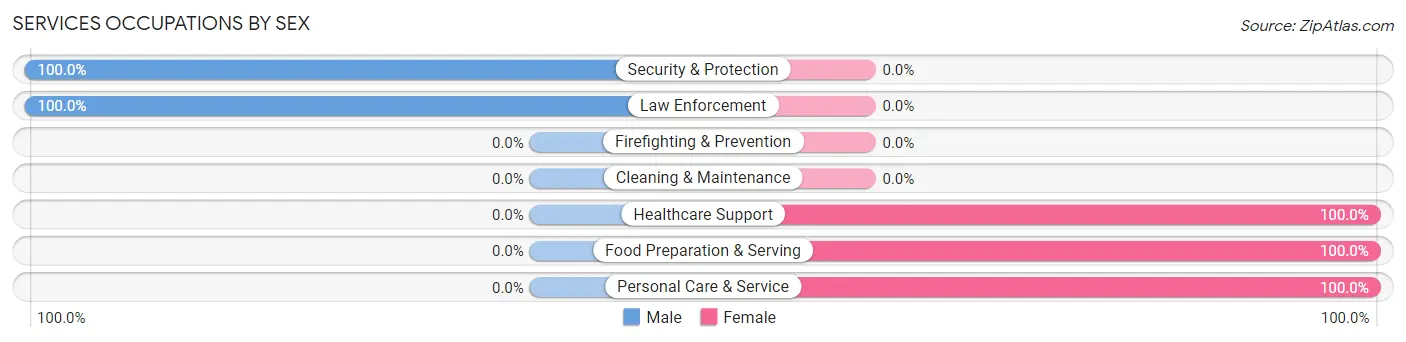
Services Occupations by Sex
Within the Services occupations in New Tazewell, the most male-oriented occupations are Security & Protection (100.0%), and Law Enforcement (100.0%), while the most female-oriented occupations are Healthcare Support (100.0%), Food Preparation & Serving (100.0%), and Personal Care & Service (100.0%).
| Occupation | Male | Female |
| Healthcare Support | 0 (0.0%) | 17 (100.0%) |
| Security & Protection | 29 (100.0%) | 0 (0.0%) |
| Firefighting & Prevention | 0 (0.0%) | 0 (0.0%) |
| Law Enforcement | 29 (100.0%) | 0 (0.0%) |
| Food Preparation & Serving | 0 (0.0%) | 134 (100.0%) |
| Cleaning & Maintenance | 0 (0.0%) | 0 (0.0%) |
| Personal Care & Service | 0 (0.0%) | 16 (100.0%) |
| Total (Category) | 29 (14.8%) | 167 (85.2%) |
| Total (Overall) | 642 (49.0%) | 667 (50.9%) |
Sales and Office Occupations
The most common Sales and Office occupations in New Tazewell are Office & Administration (80 | 6.1%), and Sales & Related (43 | 3.3%).

Sales and Office Occupations by Sex

| Occupation | Male | Female |
| Sales & Related | 0 (0.0%) | 43 (100.0%) |
| Office & Administration | 0 (0.0%) | 80 (100.0%) |
| Total (Category) | 0 (0.0%) | 123 (100.0%) |
| Total (Overall) | 642 (49.0%) | 667 (50.9%) |
Natural Resources, Construction and Maintenance Occupations
The most common Natural Resources, Construction and Maintenance occupations in New Tazewell are , and Installation, Maintenance & Repair (56 | 4.3%).

Natural Resources, Construction and Maintenance Occupations by Sex

| Occupation | Male | Female |
| Farming, Fishing & Forestry | 0 (0.0%) | 0 (0.0%) |
| Construction & Extraction | 0 (0.0%) | 0 (0.0%) |
| Installation, Maintenance & Repair | 56 (100.0%) | 0 (0.0%) |
| Total (Category) | 56 (100.0%) | 0 (0.0%) |
| Total (Overall) | 642 (49.0%) | 667 (50.9%) |
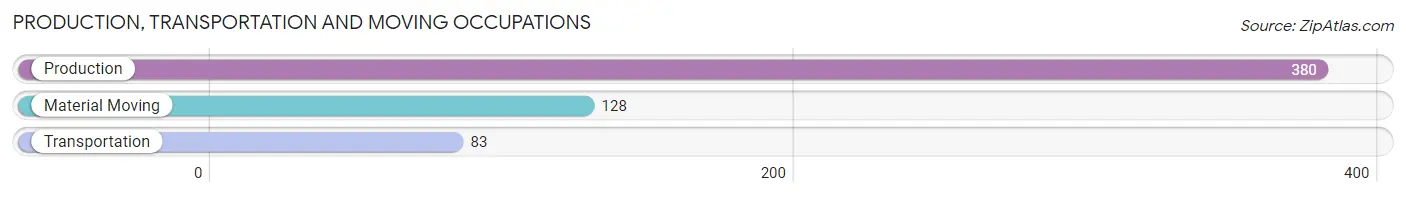
Production, Transportation and Moving Occupations
The most common Production, Transportation and Moving occupations in New Tazewell are Production (380 | 29.0%), Material Moving (128 | 9.8%), and Transportation (83 | 6.3%).
Production, Transportation and Moving Occupations by Sex

| Occupation | Male | Female |
| Production | 249 (65.5%) | 131 (34.5%) |
| Transportation | 83 (100.0%) | 0 (0.0%) |
| Material Moving | 71 (55.5%) | 57 (44.5%) |
| Total (Category) | 403 (68.2%) | 188 (31.8%) |
| Total (Overall) | 642 (49.0%) | 667 (50.9%) |
Employment Industries by Sex in New Tazewell
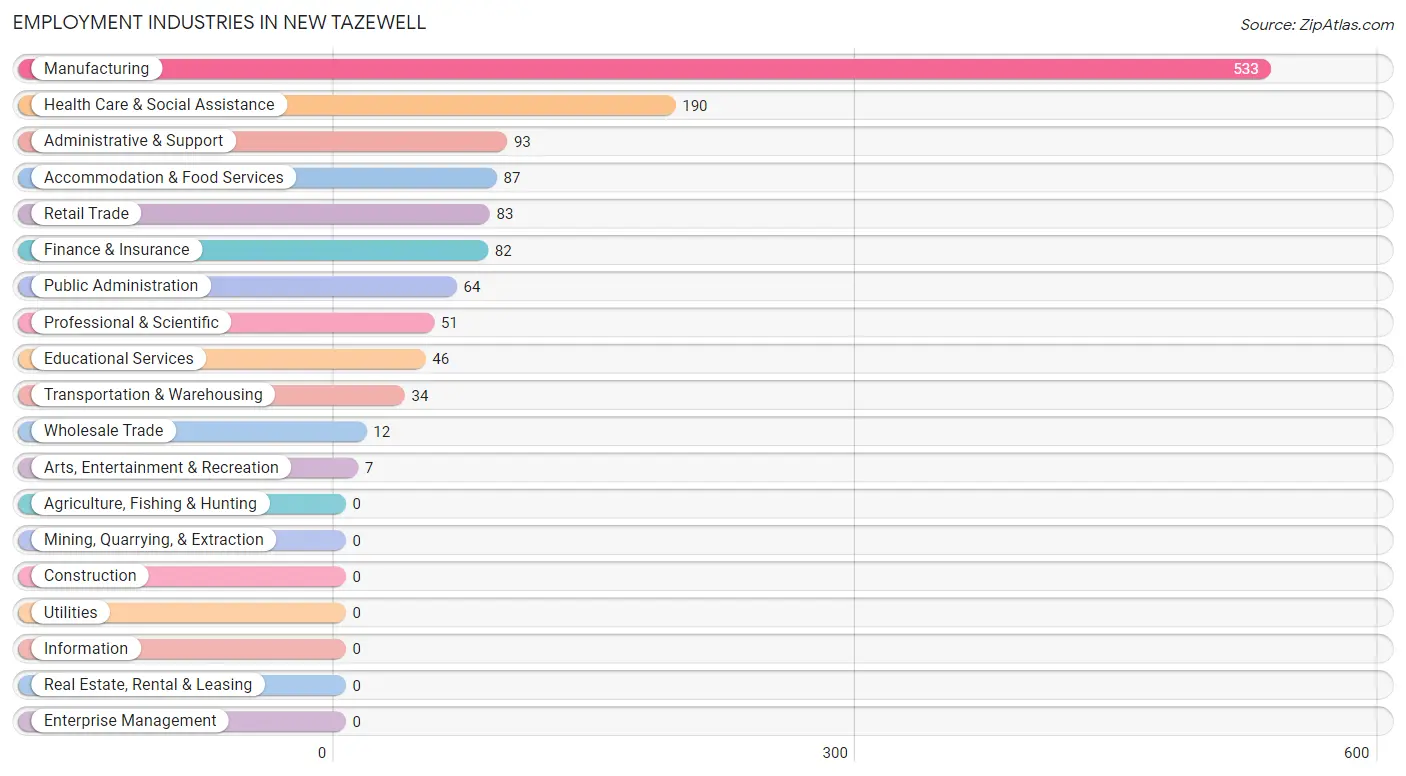
Employment Industries in New Tazewell
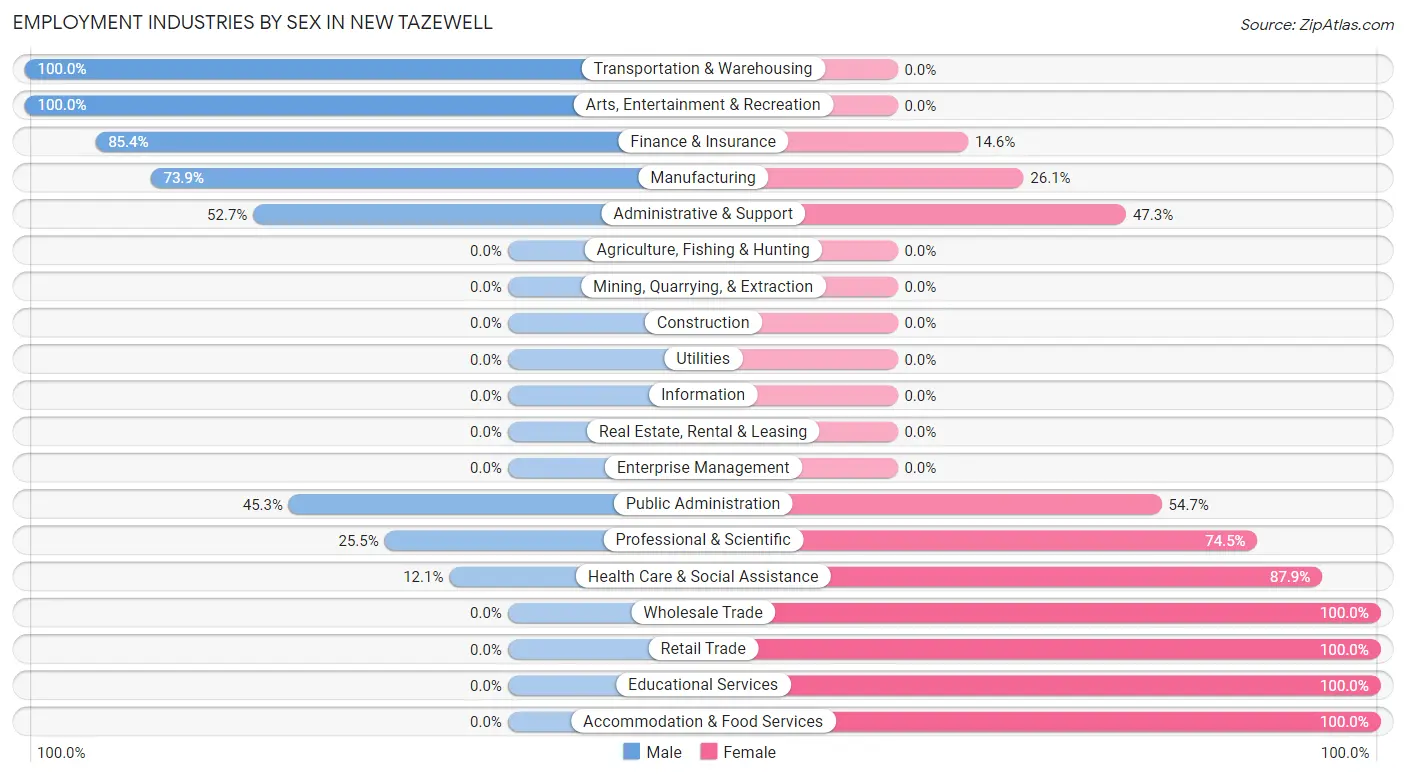
The major employment industries in New Tazewell include Manufacturing (533 | 40.7%), Health Care & Social Assistance (190 | 14.5%), Administrative & Support (93 | 7.1%), Accommodation & Food Services (87 | 6.7%), and Retail Trade (83 | 6.3%).
Employment Industries by Sex in New Tazewell
The New Tazewell industries that see more men than women are Transportation & Warehousing (100.0%), Arts, Entertainment & Recreation (100.0%), and Finance & Insurance (85.4%), whereas the industries that tend to have a higher number of women are Wholesale Trade (100.0%), Retail Trade (100.0%), and Educational Services (100.0%).
| Industry | Male | Female |
| Agriculture, Fishing & Hunting | 0 (0.0%) | 0 (0.0%) |
| Mining, Quarrying, & Extraction | 0 (0.0%) | 0 (0.0%) |
| Construction | 0 (0.0%) | 0 (0.0%) |
| Manufacturing | 394 (73.9%) | 139 (26.1%) |
| Wholesale Trade | 0 (0.0%) | 12 (100.0%) |
| Retail Trade | 0 (0.0%) | 83 (100.0%) |
| Transportation & Warehousing | 34 (100.0%) | 0 (0.0%) |
| Utilities | 0 (0.0%) | 0 (0.0%) |
| Information | 0 (0.0%) | 0 (0.0%) |
| Finance & Insurance | 70 (85.4%) | 12 (14.6%) |
| Real Estate, Rental & Leasing | 0 (0.0%) | 0 (0.0%) |
| Professional & Scientific | 13 (25.5%) | 38 (74.5%) |
| Enterprise Management | 0 (0.0%) | 0 (0.0%) |
| Administrative & Support | 49 (52.7%) | 44 (47.3%) |
| Educational Services | 0 (0.0%) | 46 (100.0%) |
| Health Care & Social Assistance | 23 (12.1%) | 167 (87.9%) |
| Arts, Entertainment & Recreation | 7 (100.0%) | 0 (0.0%) |
| Accommodation & Food Services | 0 (0.0%) | 87 (100.0%) |
| Public Administration | 29 (45.3%) | 35 (54.7%) |
| Total | 642 (49.0%) | 667 (50.9%) |
Education in New Tazewell
School Enrollment in New Tazewell
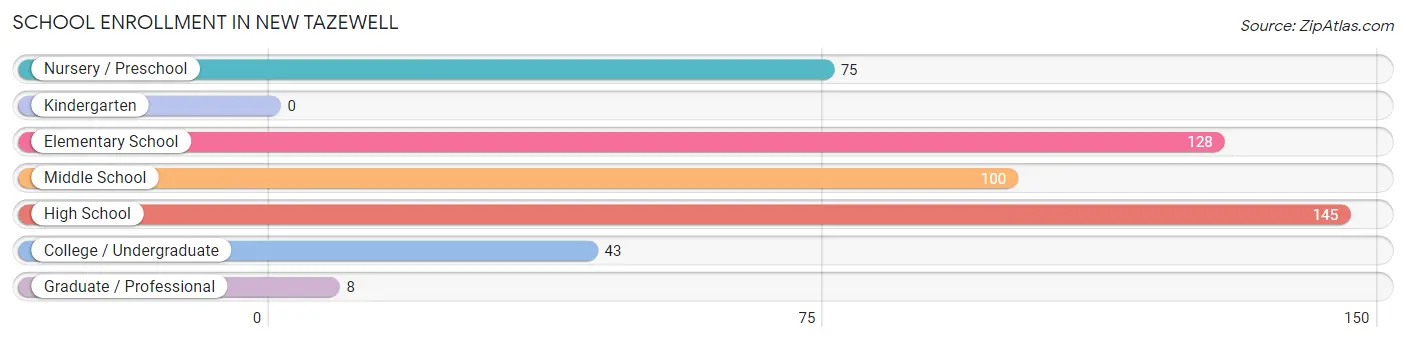
The most common levels of schooling among the 499 students in New Tazewell are high school (145 | 29.1%), elementary school (128 | 25.7%), and middle school (100 | 20.0%).
| School Level | # Students | % Students |
| Nursery / Preschool | 75 | 15.0% |
| Kindergarten | 0 | 0.0% |
| Elementary School | 128 | 25.7% |
| Middle School | 100 | 20.0% |
| High School | 145 | 29.1% |
| College / Undergraduate | 43 | 8.6% |
| Graduate / Professional | 8 | 1.6% |
| Total | 499 | 100.0% |
School Enrollment by Age by Funding Source in New Tazewell
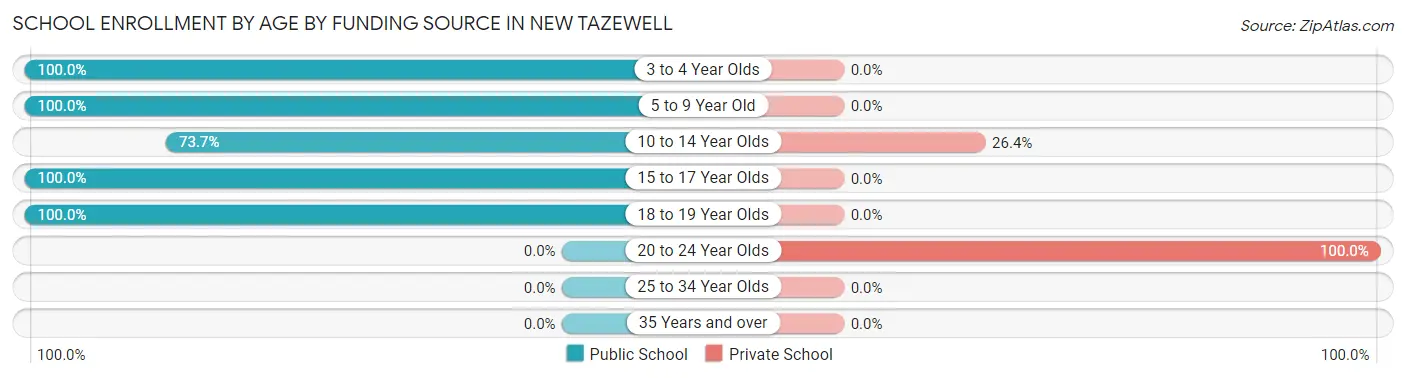
Out of a total of 499 students who are enrolled in schools in New Tazewell, 78 (15.6%) attend a private institution, while the remaining 421 (84.4%) are enrolled in public schools. The age group of 20 to 24 year olds has the highest likelihood of being enrolled in private schools, with 39 (100.0% in the age bracket) enrolled. Conversely, the age group of 3 to 4 year olds has the lowest likelihood of being enrolled in a private school, with 75 (100.0% in the age bracket) attending a public institution.
| Age Bracket | Public School | Private School |
| 3 to 4 Year Olds | 75 (100.0%) | 0 (0.0%) |
| 5 to 9 Year Old | 128 (100.0%) | 0 (0.0%) |
| 10 to 14 Year Olds | 109 (73.7%) | 39 (26.4%) |
| 15 to 17 Year Olds | 74 (100.0%) | 0 (0.0%) |
| 18 to 19 Year Olds | 35 (100.0%) | 0 (0.0%) |
| 20 to 24 Year Olds | 0 (0.0%) | 39 (100.0%) |
| 25 to 34 Year Olds | 0 (0.0%) | 0 (0.0%) |
| 35 Years and over | 0 (0.0%) | 0 (0.0%) |
| Total | 421 (84.4%) | 78 (15.6%) |
Educational Attainment by Field of Study in New Tazewell
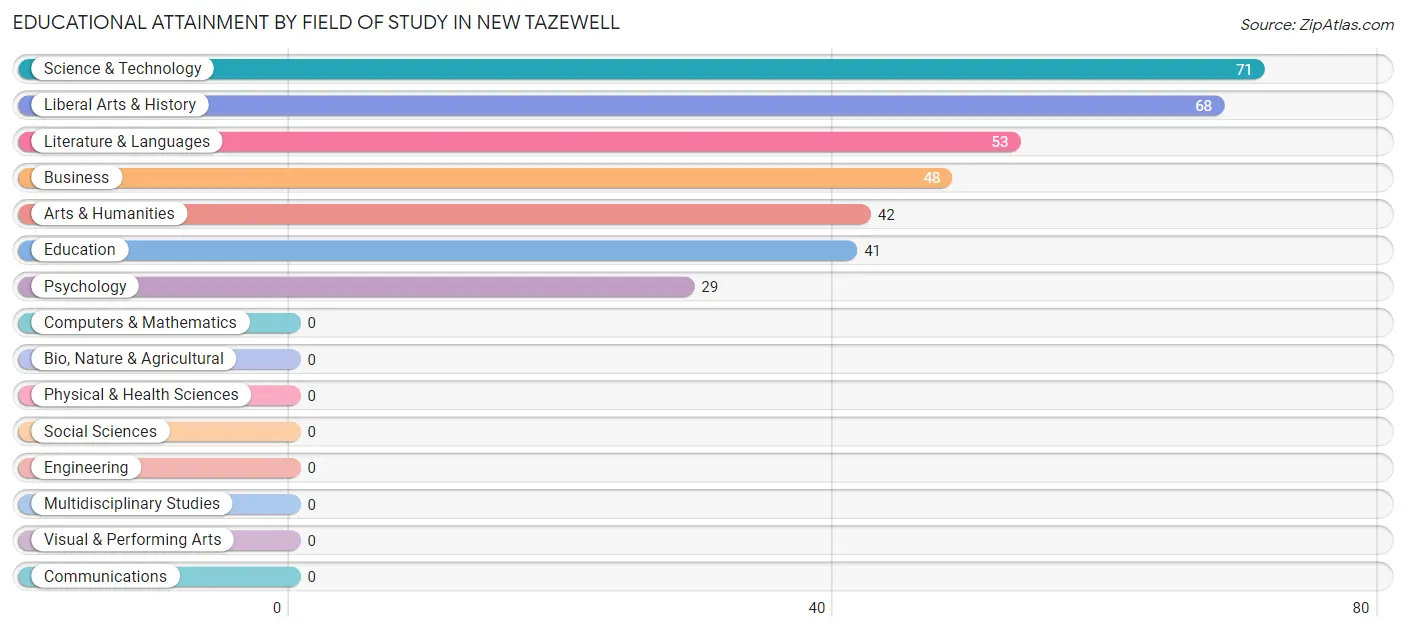
Science & technology (71 | 20.2%), liberal arts & history (68 | 19.3%), literature & languages (53 | 15.1%), business (48 | 13.6%), and arts & humanities (42 | 11.9%) are the most common fields of study among 352 individuals in New Tazewell who have obtained a bachelor's degree or higher.
| Field of Study | # Graduates | % Graduates |
| Computers & Mathematics | 0 | 0.0% |
| Bio, Nature & Agricultural | 0 | 0.0% |
| Physical & Health Sciences | 0 | 0.0% |
| Psychology | 29 | 8.2% |
| Social Sciences | 0 | 0.0% |
| Engineering | 0 | 0.0% |
| Multidisciplinary Studies | 0 | 0.0% |
| Science & Technology | 71 | 20.2% |
| Business | 48 | 13.6% |
| Education | 41 | 11.7% |
| Literature & Languages | 53 | 15.1% |
| Liberal Arts & History | 68 | 19.3% |
| Visual & Performing Arts | 0 | 0.0% |
| Communications | 0 | 0.0% |
| Arts & Humanities | 42 | 11.9% |
| Total | 352 | 100.0% |
Transportation & Commute in New Tazewell
Vehicle Availability by Sex in New Tazewell
The most prevalent vehicle ownership categories in New Tazewell are males with 3 vehicles (270, accounting for 42.1%) and females with 3 vehicles (195, making up 40.5%).
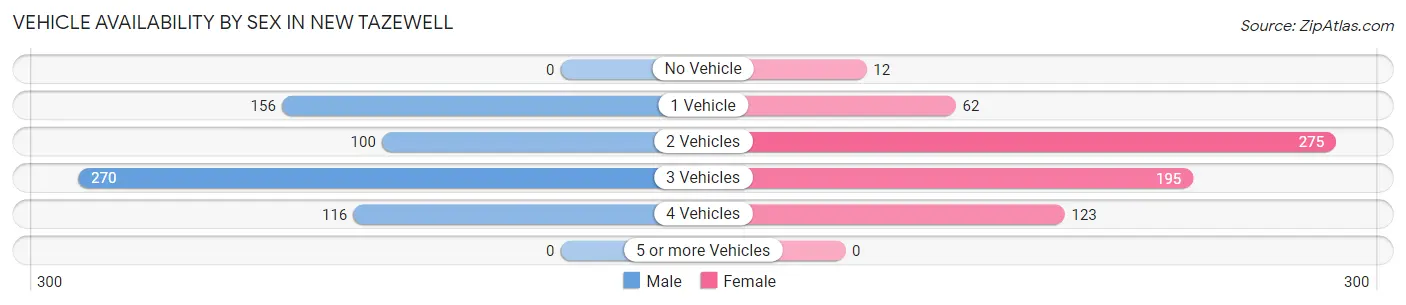
| Vehicles Available | Male | Female |
| No Vehicle | 0 (0.0%) | 12 (1.8%) |
| 1 Vehicle | 156 (24.3%) | 62 (9.3%) |
| 2 Vehicles | 100 (15.6%) | 275 (41.2%) |
| 3 Vehicles | 270 (42.1%) | 195 (29.2%) |
| 4 Vehicles | 116 (18.1%) | 123 (18.4%) |
| 5 or more Vehicles | 0 (0.0%) | 0 (0.0%) |
| Total | 642 (100.0%) | 667 (100.0%) |
Commute Time in New Tazewell
The most frequently occuring commute durations in New Tazewell are 10 to 14 minutes (369 commuters, 28.3%), 5 to 9 minutes (304 commuters, 23.4%), and 15 to 19 minutes (255 commuters, 19.6%).
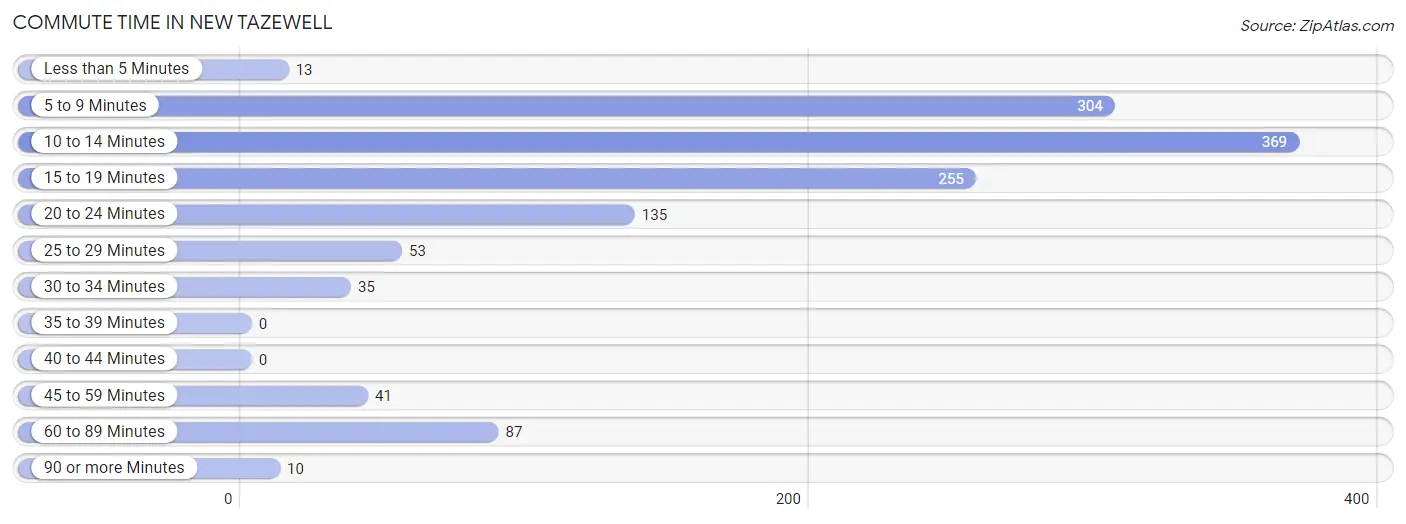
| Commute Time | # Commuters | % Commuters |
| Less than 5 Minutes | 13 | 1.0% |
| 5 to 9 Minutes | 304 | 23.4% |
| 10 to 14 Minutes | 369 | 28.3% |
| 15 to 19 Minutes | 255 | 19.6% |
| 20 to 24 Minutes | 135 | 10.4% |
| 25 to 29 Minutes | 53 | 4.1% |
| 30 to 34 Minutes | 35 | 2.7% |
| 35 to 39 Minutes | 0 | 0.0% |
| 40 to 44 Minutes | 0 | 0.0% |
| 45 to 59 Minutes | 41 | 3.2% |
| 60 to 89 Minutes | 87 | 6.7% |
| 90 or more Minutes | 10 | 0.8% |
Commute Time by Sex in New Tazewell
The most common commute times in New Tazewell are 15 to 19 minutes (163 commuters, 25.7%) for males and 10 to 14 minutes (249 commuters, 37.3%) for females.
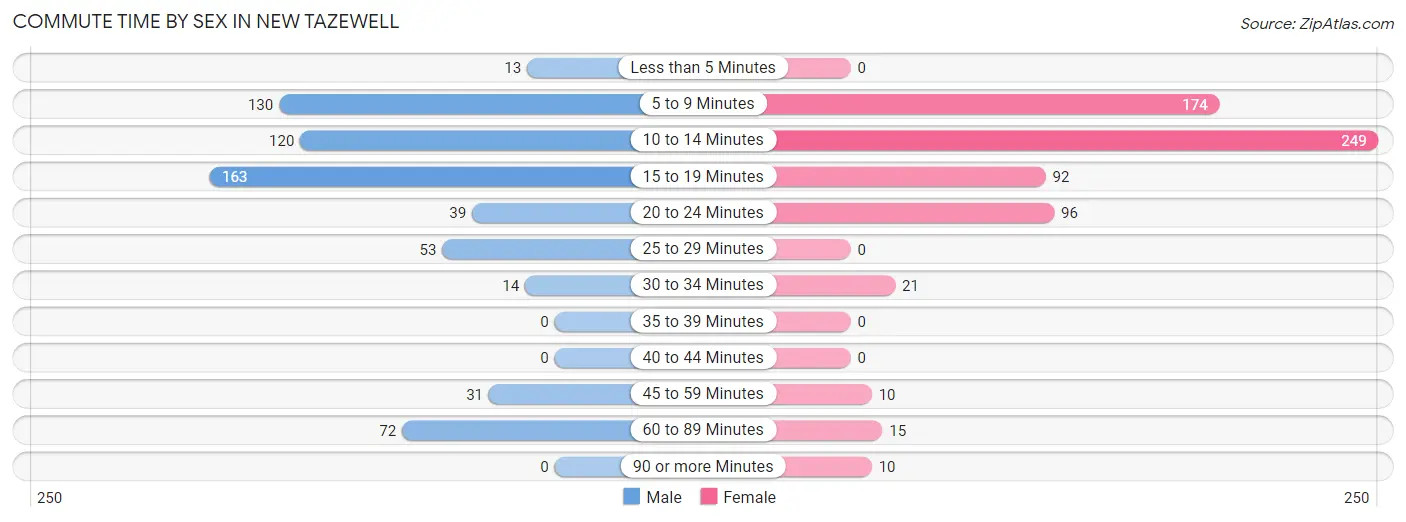
| Commute Time | Male | Female |
| Less than 5 Minutes | 13 (2.1%) | 0 (0.0%) |
| 5 to 9 Minutes | 130 (20.5%) | 174 (26.1%) |
| 10 to 14 Minutes | 120 (18.9%) | 249 (37.3%) |
| 15 to 19 Minutes | 163 (25.7%) | 92 (13.8%) |
| 20 to 24 Minutes | 39 (6.1%) | 96 (14.4%) |
| 25 to 29 Minutes | 53 (8.4%) | 0 (0.0%) |
| 30 to 34 Minutes | 14 (2.2%) | 21 (3.2%) |
| 35 to 39 Minutes | 0 (0.0%) | 0 (0.0%) |
| 40 to 44 Minutes | 0 (0.0%) | 0 (0.0%) |
| 45 to 59 Minutes | 31 (4.9%) | 10 (1.5%) |
| 60 to 89 Minutes | 72 (11.3%) | 15 (2.2%) |
| 90 or more Minutes | 0 (0.0%) | 10 (1.5%) |
Time of Departure to Work by Sex in New Tazewell
The most frequent times of departure to work in New Tazewell are 12:00 PM to 3:59 PM (176, 27.7%) for males and 7:30 AM to 7:59 AM (156, 23.4%) for females.
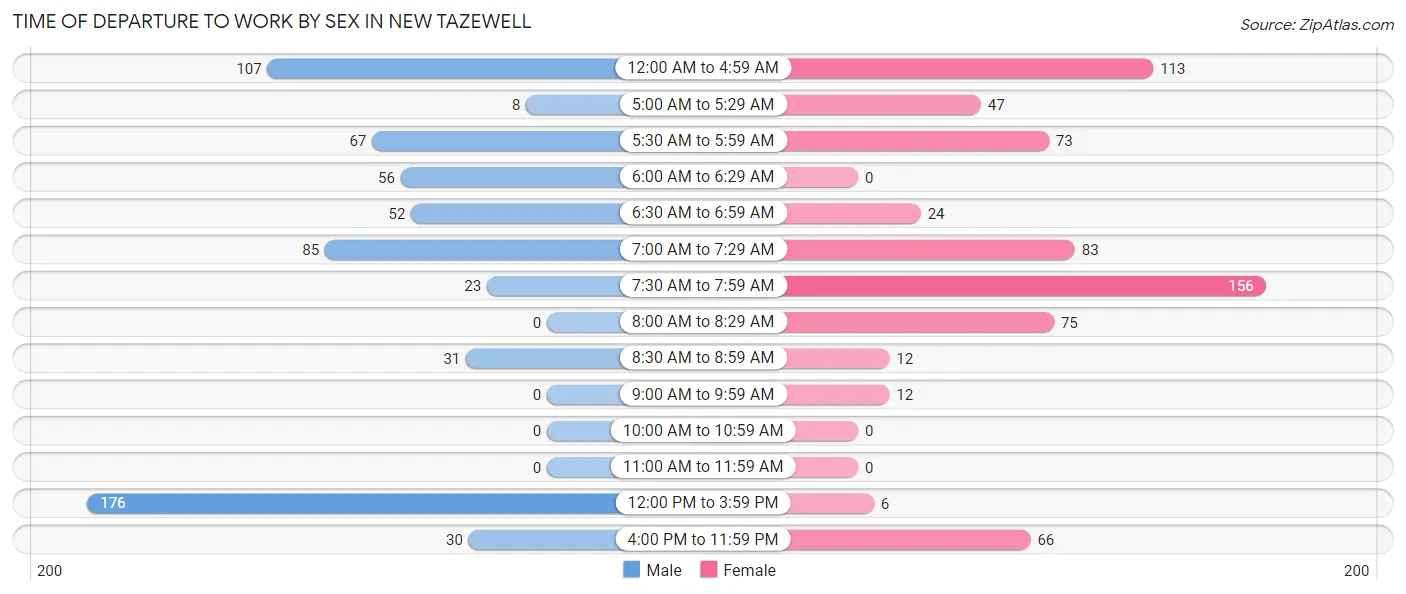
| Time of Departure | Male | Female |
| 12:00 AM to 4:59 AM | 107 (16.9%) | 113 (16.9%) |
| 5:00 AM to 5:29 AM | 8 (1.3%) | 47 (7.0%) |
| 5:30 AM to 5:59 AM | 67 (10.5%) | 73 (10.9%) |
| 6:00 AM to 6:29 AM | 56 (8.8%) | 0 (0.0%) |
| 6:30 AM to 6:59 AM | 52 (8.2%) | 24 (3.6%) |
| 7:00 AM to 7:29 AM | 85 (13.4%) | 83 (12.4%) |
| 7:30 AM to 7:59 AM | 23 (3.6%) | 156 (23.4%) |
| 8:00 AM to 8:29 AM | 0 (0.0%) | 75 (11.2%) |
| 8:30 AM to 8:59 AM | 31 (4.9%) | 12 (1.8%) |
| 9:00 AM to 9:59 AM | 0 (0.0%) | 12 (1.8%) |
| 10:00 AM to 10:59 AM | 0 (0.0%) | 0 (0.0%) |
| 11:00 AM to 11:59 AM | 0 (0.0%) | 0 (0.0%) |
| 12:00 PM to 3:59 PM | 176 (27.7%) | 6 (0.9%) |
| 4:00 PM to 11:59 PM | 30 (4.7%) | 66 (9.9%) |
| Total | 635 (100.0%) | 667 (100.0%) |
Housing Occupancy in New Tazewell
Occupancy by Ownership in New Tazewell
Of the total 1,222 dwellings in New Tazewell, owner-occupied units account for 571 (46.7%), while renter-occupied units make up 651 (53.3%).
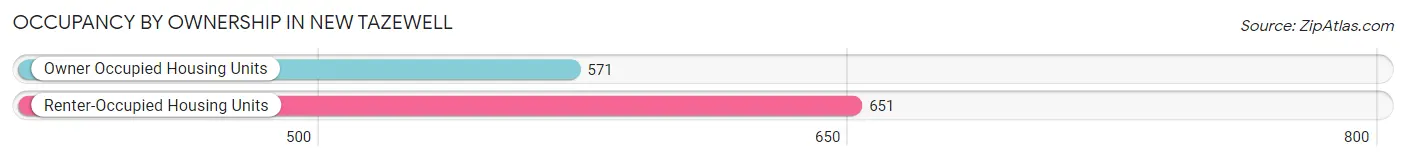
| Occupancy | # Housing Units | % Housing Units |
| Owner Occupied Housing Units | 571 | 46.7% |
| Renter-Occupied Housing Units | 651 | 53.3% |
| Total Occupied Housing Units | 1,222 | 100.0% |
Occupancy by Household Size in New Tazewell
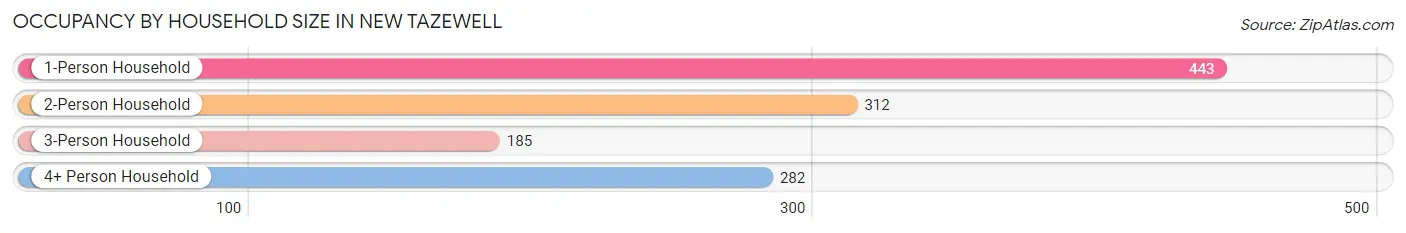
| Household Size | # Housing Units | % Housing Units |
| 1-Person Household | 443 | 36.2% |
| 2-Person Household | 312 | 25.5% |
| 3-Person Household | 185 | 15.1% |
| 4+ Person Household | 282 | 23.1% |
| Total Housing Units | 1,222 | 100.0% |
Occupancy by Ownership by Household Size in New Tazewell
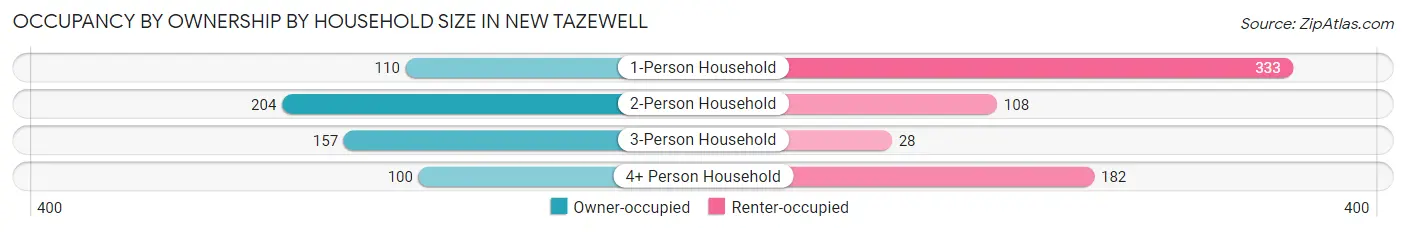
| Household Size | Owner-occupied | Renter-occupied |
| 1-Person Household | 110 (24.8%) | 333 (75.2%) |
| 2-Person Household | 204 (65.4%) | 108 (34.6%) |
| 3-Person Household | 157 (84.9%) | 28 (15.1%) |
| 4+ Person Household | 100 (35.5%) | 182 (64.5%) |
| Total Housing Units | 571 (46.7%) | 651 (53.3%) |
Occupancy by Educational Attainment in New Tazewell

| Household Size | Owner-occupied | Renter-occupied |
| Less than High School | 26 (9.3%) | 254 (90.7%) |
| High School Diploma | 257 (51.1%) | 246 (48.9%) |
| College/Associate Degree | 119 (61.3%) | 75 (38.7%) |
| Bachelor's Degree or higher | 169 (69.0%) | 76 (31.0%) |
Occupancy by Age of Householder in New Tazewell
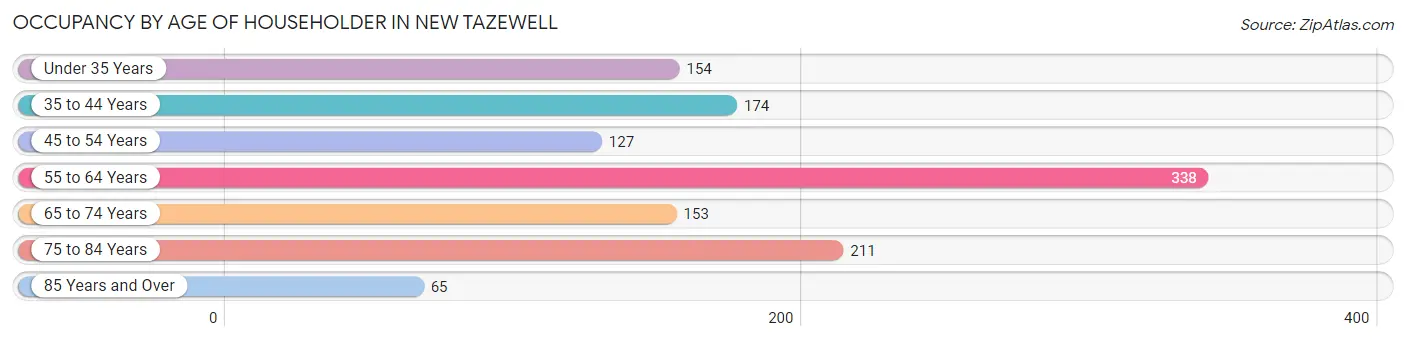
| Age Bracket | # Households | % Households |
| Under 35 Years | 154 | 12.6% |
| 35 to 44 Years | 174 | 14.2% |
| 45 to 54 Years | 127 | 10.4% |
| 55 to 64 Years | 338 | 27.7% |
| 65 to 74 Years | 153 | 12.5% |
| 75 to 84 Years | 211 | 17.3% |
| 85 Years and Over | 65 | 5.3% |
| Total | 1,222 | 100.0% |
Housing Finances in New Tazewell
Median Income by Occupancy in New Tazewell
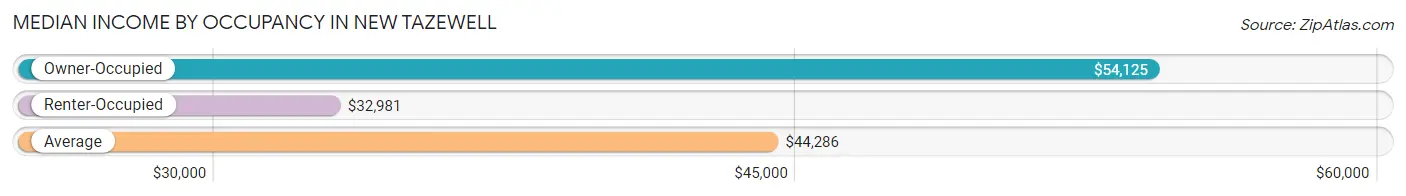
| Occupancy Type | # Households | Median Income |
| Owner-Occupied | 571 (46.7%) | $54,125 |
| Renter-Occupied | 651 (53.3%) | $32,981 |
| Average | 1,222 (100.0%) | $44,286 |
Occupancy by Householder Income Bracket in New Tazewell
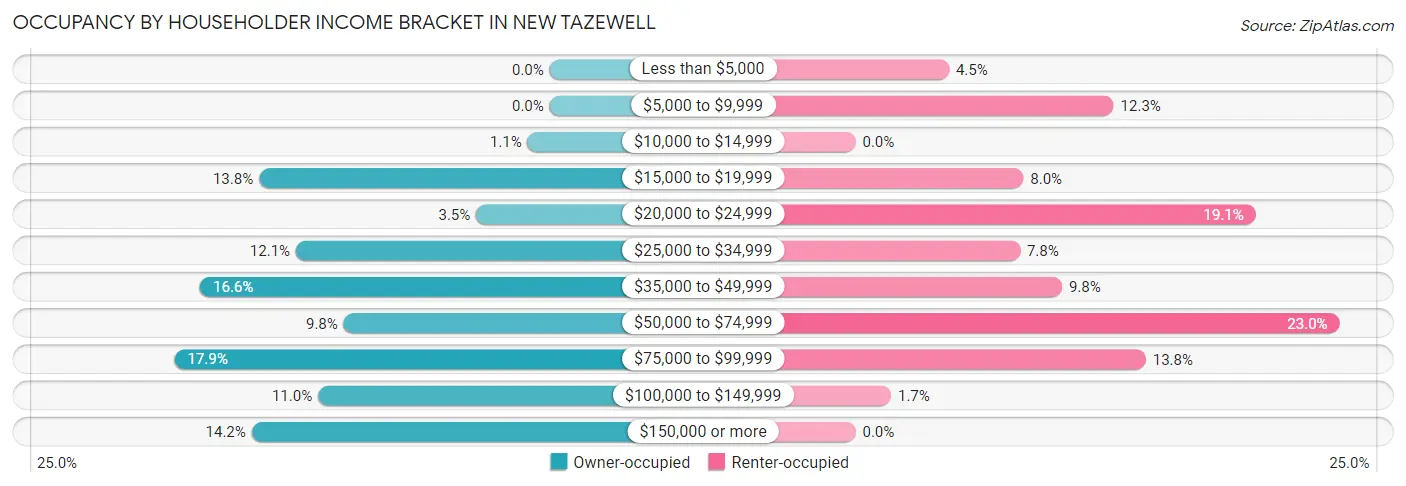
| Income Bracket | Owner-occupied | Renter-occupied |
| Less than $5,000 | 0 (0.0%) | 29 (4.4%) |
| $5,000 to $9,999 | 0 (0.0%) | 80 (12.3%) |
| $10,000 to $14,999 | 6 (1.1%) | 0 (0.0%) |
| $15,000 to $19,999 | 79 (13.8%) | 52 (8.0%) |
| $20,000 to $24,999 | 20 (3.5%) | 124 (19.1%) |
| $25,000 to $34,999 | 69 (12.1%) | 51 (7.8%) |
| $35,000 to $49,999 | 95 (16.6%) | 64 (9.8%) |
| $50,000 to $74,999 | 56 (9.8%) | 150 (23.0%) |
| $75,000 to $99,999 | 102 (17.9%) | 90 (13.8%) |
| $100,000 to $149,999 | 63 (11.0%) | 11 (1.7%) |
| $150,000 or more | 81 (14.2%) | 0 (0.0%) |
| Total | 571 (100.0%) | 651 (100.0%) |
Monthly Housing Cost Tiers in New Tazewell
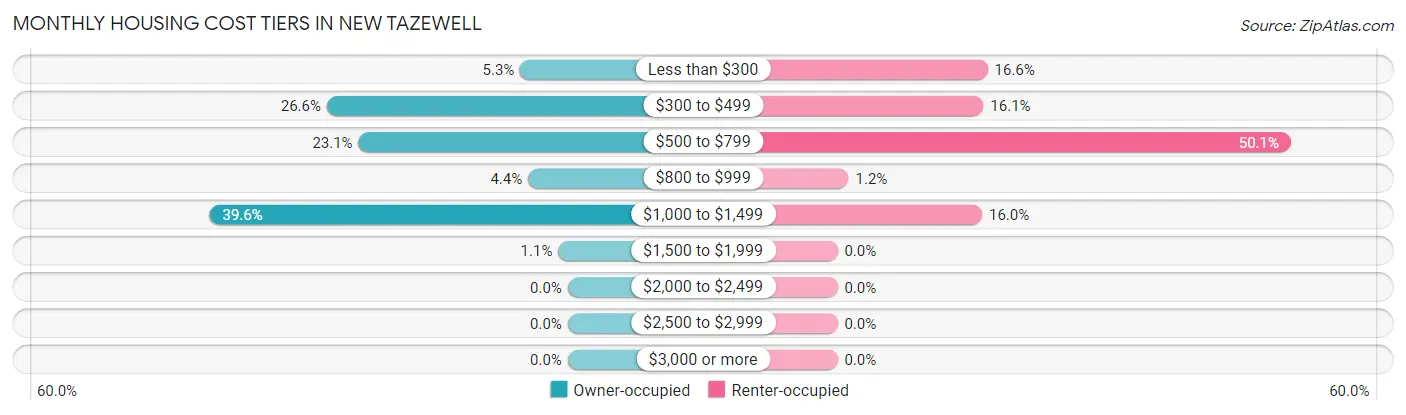
| Monthly Cost | Owner-occupied | Renter-occupied |
| Less than $300 | 30 (5.2%) | 108 (16.6%) |
| $300 to $499 | 152 (26.6%) | 105 (16.1%) |
| $500 to $799 | 132 (23.1%) | 326 (50.1%) |
| $800 to $999 | 25 (4.4%) | 8 (1.2%) |
| $1,000 to $1,499 | 226 (39.6%) | 104 (16.0%) |
| $1,500 to $1,999 | 6 (1.1%) | 0 (0.0%) |
| $2,000 to $2,499 | 0 (0.0%) | 0 (0.0%) |
| $2,500 to $2,999 | 0 (0.0%) | 0 (0.0%) |
| $3,000 or more | 0 (0.0%) | 0 (0.0%) |
| Total | 571 (100.0%) | 651 (100.0%) |
Physical Housing Characteristics in New Tazewell
Housing Structures in New Tazewell
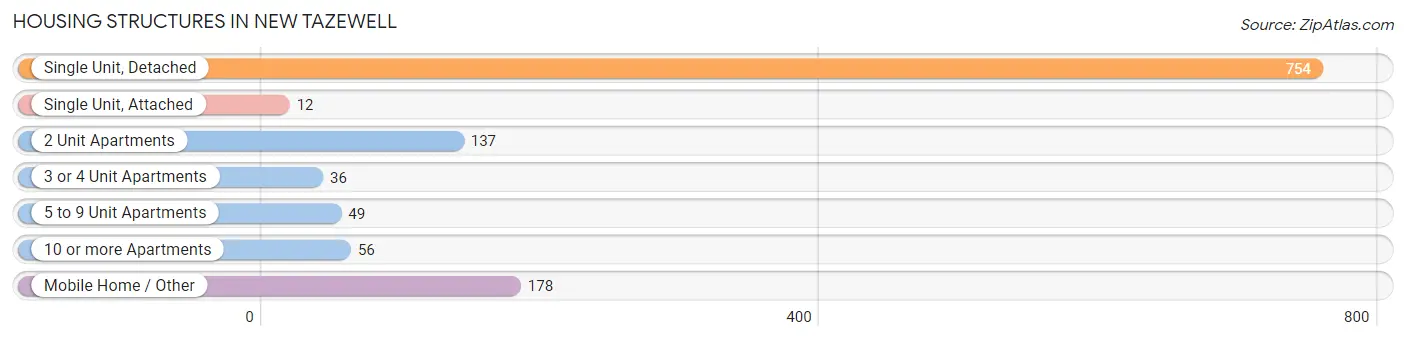
| Structure Type | # Housing Units | % Housing Units |
| Single Unit, Detached | 754 | 61.7% |
| Single Unit, Attached | 12 | 1.0% |
| 2 Unit Apartments | 137 | 11.2% |
| 3 or 4 Unit Apartments | 36 | 2.9% |
| 5 to 9 Unit Apartments | 49 | 4.0% |
| 10 or more Apartments | 56 | 4.6% |
| Mobile Home / Other | 178 | 14.6% |
| Total | 1,222 | 100.0% |
Housing Structures by Occupancy in New Tazewell
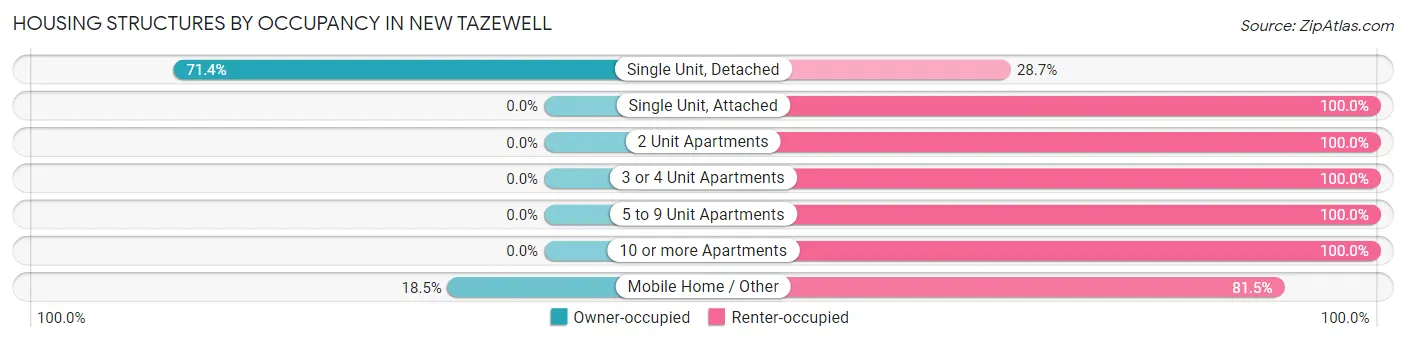
| Structure Type | Owner-occupied | Renter-occupied |
| Single Unit, Detached | 538 (71.4%) | 216 (28.6%) |
| Single Unit, Attached | 0 (0.0%) | 12 (100.0%) |
| 2 Unit Apartments | 0 (0.0%) | 137 (100.0%) |
| 3 or 4 Unit Apartments | 0 (0.0%) | 36 (100.0%) |
| 5 to 9 Unit Apartments | 0 (0.0%) | 49 (100.0%) |
| 10 or more Apartments | 0 (0.0%) | 56 (100.0%) |
| Mobile Home / Other | 33 (18.5%) | 145 (81.5%) |
| Total | 571 (46.7%) | 651 (53.3%) |
Housing Structures by Number of Rooms in New Tazewell
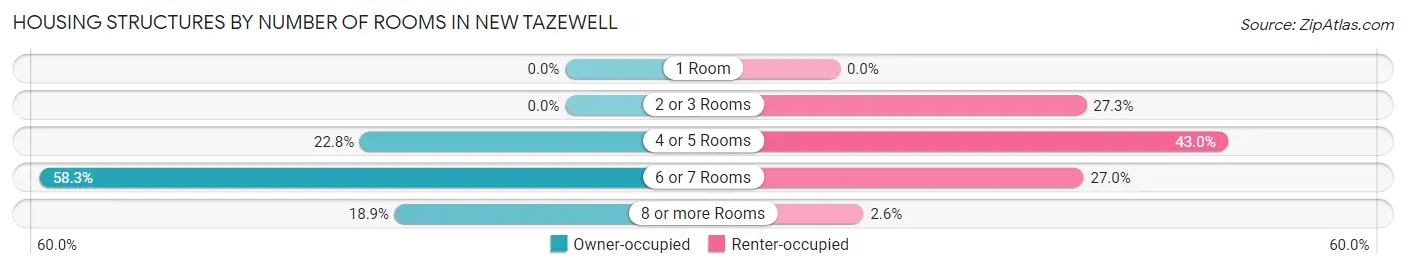
| Number of Rooms | Owner-occupied | Renter-occupied |
| 1 Room | 0 (0.0%) | 0 (0.0%) |
| 2 or 3 Rooms | 0 (0.0%) | 178 (27.3%) |
| 4 or 5 Rooms | 130 (22.8%) | 280 (43.0%) |
| 6 or 7 Rooms | 333 (58.3%) | 176 (27.0%) |
| 8 or more Rooms | 108 (18.9%) | 17 (2.6%) |
| Total | 571 (100.0%) | 651 (100.0%) |
Housing Structure by Heating Type in New Tazewell
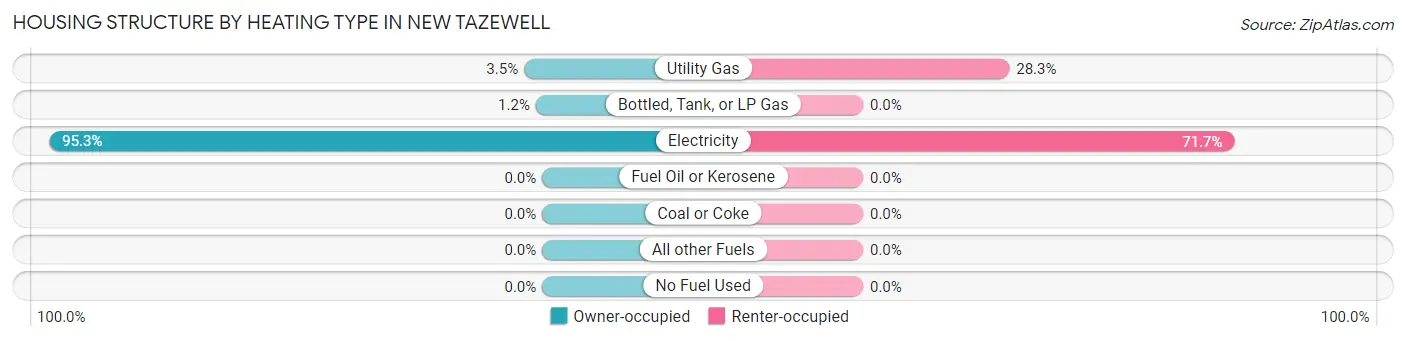
| Heating Type | Owner-occupied | Renter-occupied |
| Utility Gas | 20 (3.5%) | 184 (28.3%) |
| Bottled, Tank, or LP Gas | 7 (1.2%) | 0 (0.0%) |
| Electricity | 544 (95.3%) | 467 (71.7%) |
| Fuel Oil or Kerosene | 0 (0.0%) | 0 (0.0%) |
| Coal or Coke | 0 (0.0%) | 0 (0.0%) |
| All other Fuels | 0 (0.0%) | 0 (0.0%) |
| No Fuel Used | 0 (0.0%) | 0 (0.0%) |
| Total | 571 (100.0%) | 651 (100.0%) |
Household Vehicle Usage in New Tazewell
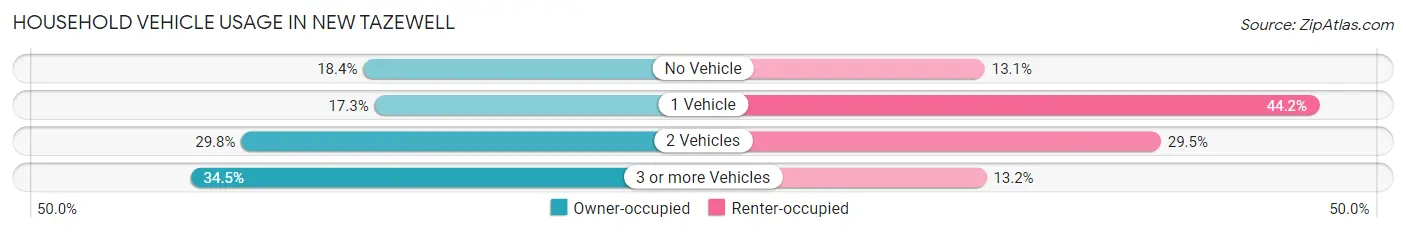
| Vehicles per Household | Owner-occupied | Renter-occupied |
| No Vehicle | 105 (18.4%) | 85 (13.1%) |
| 1 Vehicle | 99 (17.3%) | 288 (44.2%) |
| 2 Vehicles | 170 (29.8%) | 192 (29.5%) |
| 3 or more Vehicles | 197 (34.5%) | 86 (13.2%) |
| Total | 571 (100.0%) | 651 (100.0%) |
Real Estate & Mortgages in New Tazewell
Real Estate and Mortgage Overview in New Tazewell
| Characteristic | Without Mortgage | With Mortgage |
| Housing Units | 214 | 357 |
| Median Property Value | $152,200 | $163,900 |
| Median Household Income | - | - |
| Monthly Housing Costs | $387 | $0 |
| Real Estate Taxes | $614 | $12 |
Property Value by Mortgage Status in New Tazewell
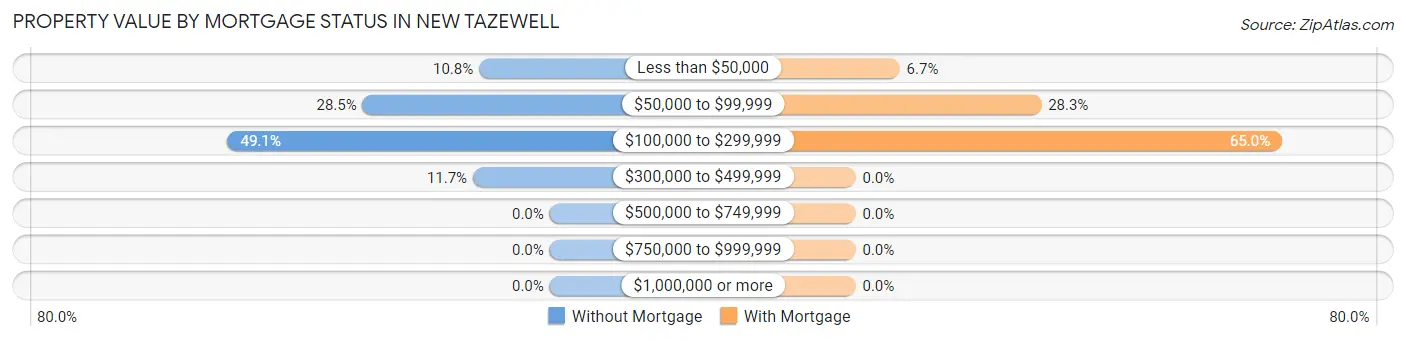
| Property Value | Without Mortgage | With Mortgage |
| Less than $50,000 | 23 (10.7%) | 24 (6.7%) |
| $50,000 to $99,999 | 61 (28.5%) | 101 (28.3%) |
| $100,000 to $299,999 | 105 (49.1%) | 232 (65.0%) |
| $300,000 to $499,999 | 25 (11.7%) | 0 (0.0%) |
| $500,000 to $749,999 | 0 (0.0%) | 0 (0.0%) |
| $750,000 to $999,999 | 0 (0.0%) | 0 (0.0%) |
| $1,000,000 or more | 0 (0.0%) | 0 (0.0%) |
| Total | 214 (100.0%) | 357 (100.0%) |
Household Income by Mortgage Status in New Tazewell
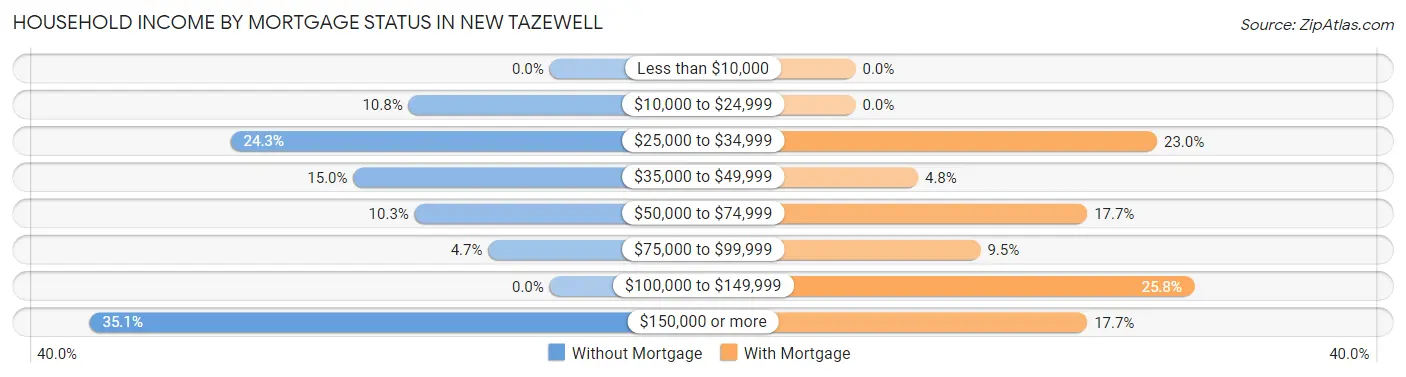
| Household Income | Without Mortgage | With Mortgage |
| Less than $10,000 | 0 (0.0%) | 0 (0.0%) |
| $10,000 to $24,999 | 23 (10.7%) | 0 (0.0%) |
| $25,000 to $34,999 | 52 (24.3%) | 82 (23.0%) |
| $35,000 to $49,999 | 32 (14.9%) | 17 (4.8%) |
| $50,000 to $74,999 | 22 (10.3%) | 63 (17.6%) |
| $75,000 to $99,999 | 10 (4.7%) | 34 (9.5%) |
| $100,000 to $149,999 | 0 (0.0%) | 92 (25.8%) |
| $150,000 or more | 75 (35.0%) | 63 (17.6%) |
| Total | 214 (100.0%) | 357 (100.0%) |
Property Value to Household Income Ratio in New Tazewell
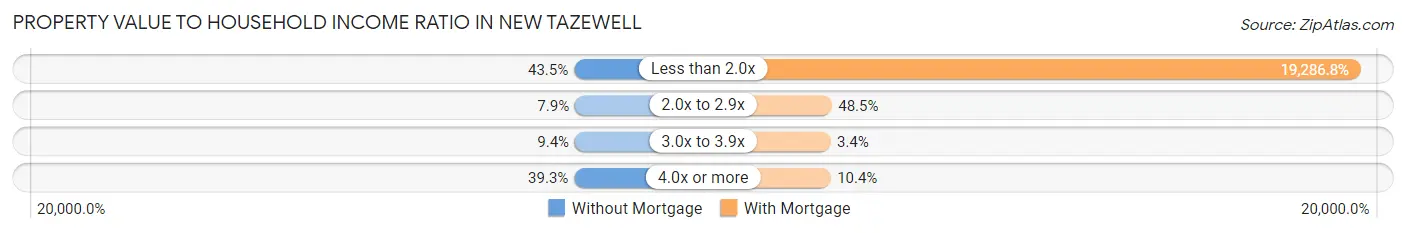
| Value-to-Income Ratio | Without Mortgage | With Mortgage |
| Less than 2.0x | 93 (43.5%) | 68,854 (19,286.8%) |
| 2.0x to 2.9x | 17 (7.9%) | 173 (48.5%) |
| 3.0x to 3.9x | 20 (9.3%) | 12 (3.4%) |
| 4.0x or more | 84 (39.3%) | 37 (10.4%) |
| Total | 214 (100.0%) | 357 (100.0%) |
Real Estate Taxes by Mortgage Status in New Tazewell

| Property Taxes | Without Mortgage | With Mortgage |
| Less than $800 | 131 (61.2%) | 0 (0.0%) |
| $800 to $1,499 | 66 (30.8%) | 211 (59.1%) |
| $800 to $1,499 | 0 (0.0%) | 128 (35.8%) |
| Total | 214 (100.0%) | 357 (100.0%) |
Health & Disability in New Tazewell
Health Insurance Coverage by Age in New Tazewell

| Age Bracket | With Coverage | Without Coverage |
| Under 6 Years | 172 (100.0%) | 0 (0.0%) |
| 6 to 18 Years | 400 (97.1%) | 12 (2.9%) |
| 19 to 25 Years | 168 (92.3%) | 14 (7.7%) |
| 26 to 34 Years | 240 (96.0%) | 10 (4.0%) |
| 35 to 44 Years | 259 (87.2%) | 38 (12.8%) |
| 45 to 54 Years | 373 (93.7%) | 25 (6.3%) |
| 55 to 64 Years | 406 (97.6%) | 10 (2.4%) |
| 65 to 74 Years | 204 (100.0%) | 0 (0.0%) |
| 75 Years and older | 322 (100.0%) | 0 (0.0%) |
| Total | 2,544 (95.9%) | 109 (4.1%) |
Health Insurance Coverage by Citizenship Status in New Tazewell

| Citizenship Status | With Coverage | Without Coverage |
| Native Born | 172 (100.0%) | 0 (0.0%) |
| Foreign Born, Citizen | 400 (97.1%) | 12 (2.9%) |
| Foreign Born, not a Citizen | 168 (92.3%) | 14 (7.7%) |
Health Insurance Coverage by Household Income in New Tazewell

| Household Income | With Coverage | Without Coverage |
| Under $25,000 | 472 (94.2%) | 29 (5.8%) |
| $25,000 to $49,999 | 542 (98.2%) | 10 (1.8%) |
| $50,000 to $74,999 | 490 (100.0%) | 0 (0.0%) |
| $75,000 to $99,999 | 474 (89.3%) | 57 (10.7%) |
| $100,000 and over | 566 (97.8%) | 13 (2.2%) |
Public vs Private Health Insurance Coverage by Age in New Tazewell
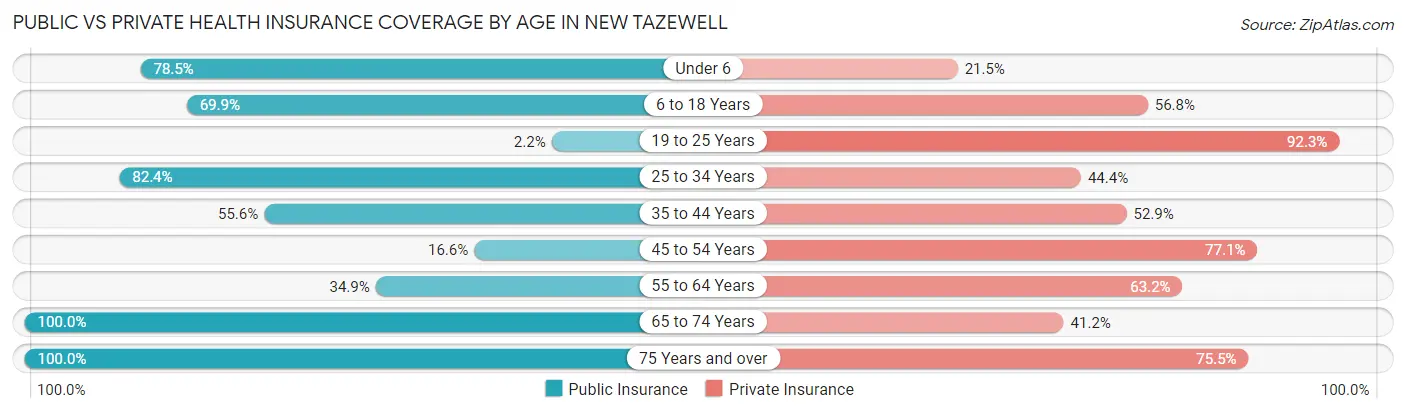
| Age Bracket | Public Insurance | Private Insurance |
| Under 6 | 135 (78.5%) | 37 (21.5%) |
| 6 to 18 Years | 288 (69.9%) | 234 (56.8%) |
| 19 to 25 Years | 4 (2.2%) | 168 (92.3%) |
| 25 to 34 Years | 206 (82.4%) | 111 (44.4%) |
| 35 to 44 Years | 165 (55.6%) | 157 (52.9%) |
| 45 to 54 Years | 66 (16.6%) | 307 (77.1%) |
| 55 to 64 Years | 145 (34.9%) | 263 (63.2%) |
| 65 to 74 Years | 204 (100.0%) | 84 (41.2%) |
| 75 Years and over | 322 (100.0%) | 243 (75.5%) |
| Total | 1,535 (57.9%) | 1,604 (60.5%) |
Disability Status by Sex by Age in New Tazewell
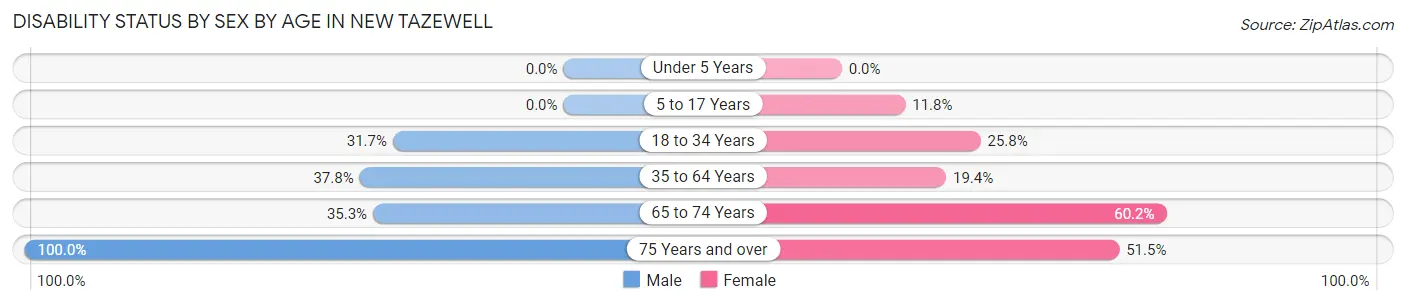
| Age Bracket | Male | Female |
| Under 5 Years | 0 (0.0%) | 0 (0.0%) |
| 5 to 17 Years | 0 (0.0%) | 35 (11.8%) |
| 18 to 34 Years | 63 (31.7%) | 69 (25.8%) |
| 35 to 64 Years | 221 (37.8%) | 102 (19.4%) |
| 65 to 74 Years | 41 (35.3%) | 53 (60.2%) |
| 75 Years and over | 89 (100.0%) | 120 (51.5%) |
Disability Class by Sex by Age in New Tazewell
Disability Class: Hearing Difficulty
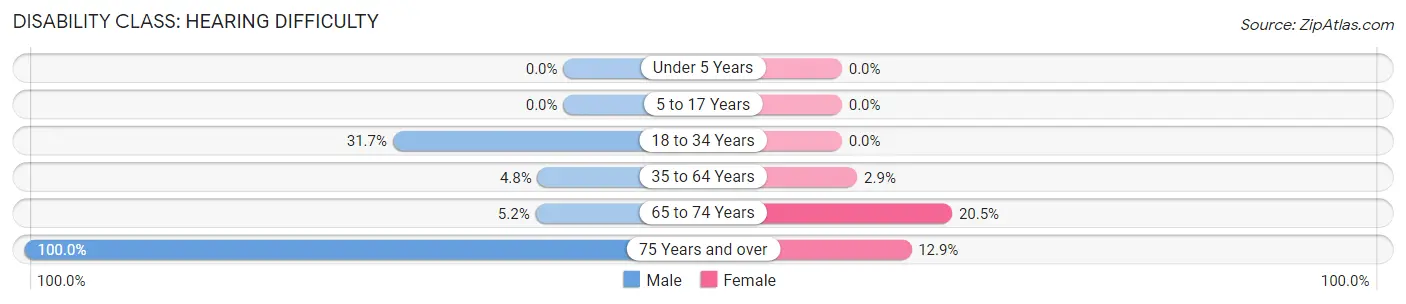
| Age Bracket | Male | Female |
| Under 5 Years | 0 (0.0%) | 0 (0.0%) |
| 5 to 17 Years | 0 (0.0%) | 0 (0.0%) |
| 18 to 34 Years | 63 (31.7%) | 0 (0.0%) |
| 35 to 64 Years | 28 (4.8%) | 15 (2.9%) |
| 65 to 74 Years | 6 (5.2%) | 18 (20.4%) |
| 75 Years and over | 89 (100.0%) | 30 (12.9%) |
Disability Class: Vision Difficulty
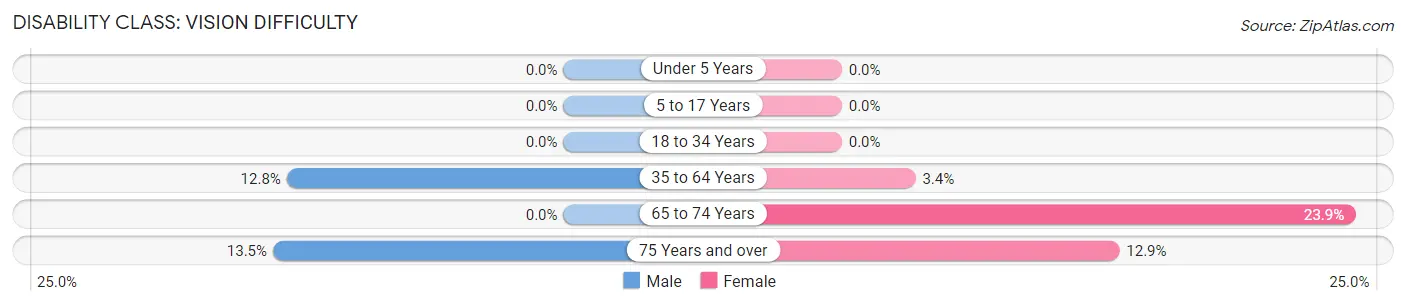
| Age Bracket | Male | Female |
| Under 5 Years | 0 (0.0%) | 0 (0.0%) |
| 5 to 17 Years | 0 (0.0%) | 0 (0.0%) |
| 18 to 34 Years | 0 (0.0%) | 0 (0.0%) |
| 35 to 64 Years | 75 (12.8%) | 18 (3.4%) |
| 65 to 74 Years | 0 (0.0%) | 21 (23.9%) |
| 75 Years and over | 12 (13.5%) | 30 (12.9%) |
Disability Class: Cognitive Difficulty
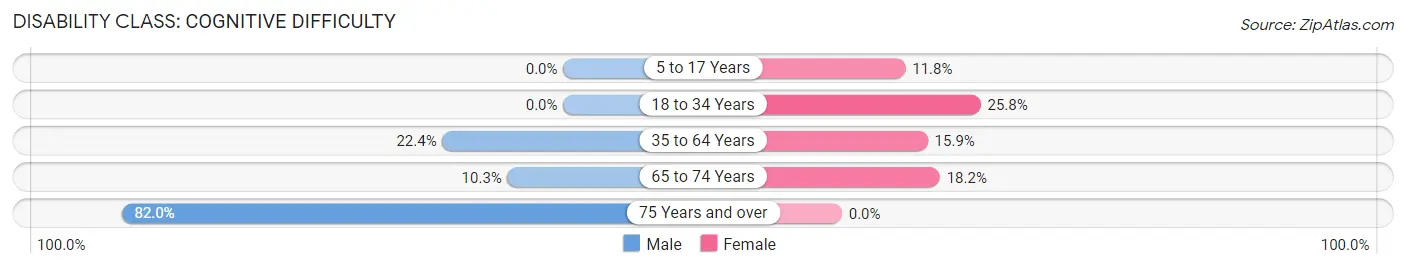
| Age Bracket | Male | Female |
| 5 to 17 Years | 0 (0.0%) | 35 (11.8%) |
| 18 to 34 Years | 0 (0.0%) | 69 (25.8%) |
| 35 to 64 Years | 131 (22.4%) | 84 (15.9%) |
| 65 to 74 Years | 12 (10.3%) | 16 (18.2%) |
| 75 Years and over | 73 (82.0%) | 0 (0.0%) |
Disability Class: Ambulatory Difficulty

| Age Bracket | Male | Female |
| 5 to 17 Years | 0 (0.0%) | 0 (0.0%) |
| 18 to 34 Years | 0 (0.0%) | 0 (0.0%) |
| 35 to 64 Years | 167 (28.6%) | 68 (12.9%) |
| 65 to 74 Years | 29 (25.0%) | 0 (0.0%) |
| 75 Years and over | 61 (68.5%) | 120 (51.5%) |
Disability Class: Self-Care Difficulty

| Age Bracket | Male | Female |
| 5 to 17 Years | 0 (0.0%) | 0 (0.0%) |
| 18 to 34 Years | 0 (0.0%) | 0 (0.0%) |
| 35 to 64 Years | 74 (12.7%) | 17 (3.2%) |
| 65 to 74 Years | 0 (0.0%) | 0 (0.0%) |
| 75 Years and over | 61 (68.5%) | 10 (4.3%) |
Technology Access in New Tazewell
Computing Device Access in New Tazewell
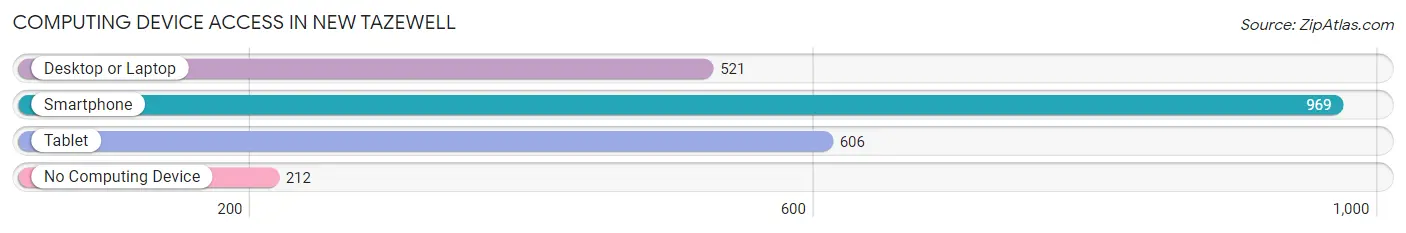
| Device Type | # Households | % Households |
| Desktop or Laptop | 521 | 42.6% |
| Smartphone | 969 | 79.3% |
| Tablet | 606 | 49.6% |
| No Computing Device | 212 | 17.3% |
| Total | 1,222 | 100.0% |
Internet Access in New Tazewell
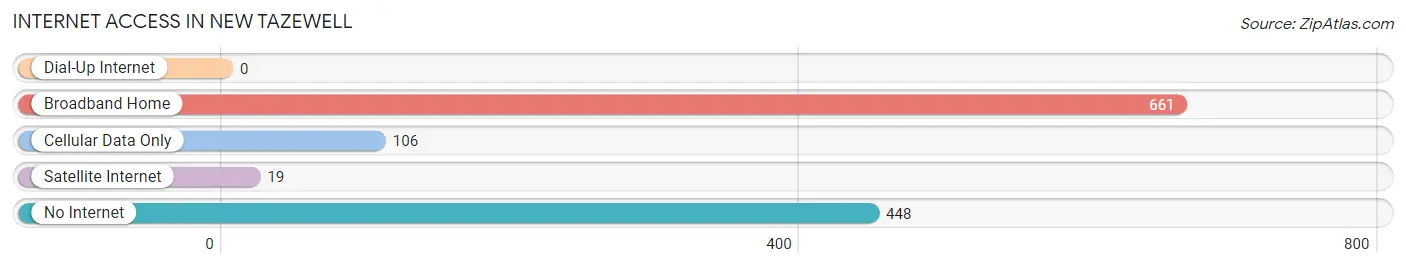
| Internet Type | # Households | % Households |
| Dial-Up Internet | 0 | 0.0% |
| Broadband Home | 661 | 54.1% |
| Cellular Data Only | 106 | 8.7% |
| Satellite Internet | 19 | 1.5% |
| No Internet | 448 | 36.7% |
| Total | 1,222 | 100.0% |
New Tazewell Summary
Tazewell, Tennessee is a small town located in Claiborne County, in the northeastern corner of the state. It is situated on the banks of the Clinch River, and is surrounded by the Cumberland Mountains. The town was founded in 1807, and has a population of approximately 2,000 people.
History
Tazewell was founded in 1807 by William Tazewell, a Revolutionary War veteran. He named the town after his father, who had served in the Continental Army. The town was originally known as Tazewellville, but the name was changed to Tazewell in 1820.
The town was an important stop on the stagecoach route between Knoxville and Cumberland Gap. It was also a major trading center for the surrounding area. In the late 1800s, the town was home to several factories, including a cotton mill, a woolen mill, and a tannery.
Tazewell was also the site of a major Civil War battle in 1863. The Battle of Tazewell was fought between Union and Confederate forces, and resulted in a Confederate victory.
Geography
Tazewell is located in the northeastern corner of Tennessee, in Claiborne County. It is situated on the banks of the Clinch River, and is surrounded by the Cumberland Mountains. The town is located about 25 miles from Knoxville, and about 50 miles from Cumberland Gap.
The town has a total area of 1.3 square miles, all of which is land. The elevation of the town is 1,068 feet above sea level.
Economy
Tazewell’s economy is largely based on agriculture and tourism. The town is home to several farms, which produce a variety of crops, including corn, soybeans, and hay. The town is also home to several tourist attractions, including the Tazewell County Museum, the Tazewell County Historical Society, and the Tazewell County Fairgrounds.
The town is also home to several small businesses, including restaurants, shops, and a hardware store.
Demographics
As of the 2010 census, Tazewell had a population of 2,000 people. The racial makeup of the town was 97.5% White, 0.5% African American, 0.3% Native American, 0.2% Asian, and 1.5% from other races.
The median household income in Tazewell was $30,000, and the median family income was $35,000. The per capita income was $15,000. About 15.5% of the population was below the poverty line.
Conclusion
Tazewell, Tennessee is a small town located in Claiborne County, in the northeastern corner of the state. It was founded in 1807, and has a population of approximately 2,000 people. The town’s economy is largely based on agriculture and tourism, and it is home to several tourist attractions. The town has a diverse population, with a median household income of $30,000. Tazewell is an important part of Tennessee’s history, and is a great place to visit and explore.
Common Questions
What is Per Capita Income in New Tazewell?
Per Capita income in New Tazewell is $27,348.
What is the Median Family Income in New Tazewell?
Median Family Income in New Tazewell is $68,839.
What is the Median Household income in New Tazewell?
Median Household Income in New Tazewell is $44,286.
What is Income or Wage Gap in New Tazewell?
Income or Wage Gap in New Tazewell is 32.2%.
Women in New Tazewell earn 67.8 cents for every dollar earned by a man.
What is Inequality or Gini Index in New Tazewell?
Inequality or Gini Index in New Tazewell is 0.44.
What is the Total Population of New Tazewell?
Total Population of New Tazewell is 2,780.
What is the Total Male Population of New Tazewell?
Total Male Population of New Tazewell is 1,225.
What is the Total Female Population of New Tazewell?
Total Female Population of New Tazewell is 1,555.
What is the Ratio of Males per 100 Females in New Tazewell?
There are 78.78 Males per 100 Females in New Tazewell.
What is the Ratio of Females per 100 Males in New Tazewell?
There are 126.94 Females per 100 Males in New Tazewell.
What is the Median Population Age in New Tazewell?
Median Population Age in New Tazewell is 46.2 Years.
What is the Average Family Size in New Tazewell
Average Family Size in New Tazewell is 2.9 People.
What is the Average Household Size in New Tazewell
Average Household Size in New Tazewell is 2.2 People.
How Large is the Labor Force in New Tazewell?
There are 1,346 People in the Labor Forcein in New Tazewell.
What is the Percentage of People in the Labor Force in New Tazewell?
58.4% of People are in the Labor Force in New Tazewell.
What is the Unemployment Rate in New Tazewell?
Unemployment Rate in New Tazewell is 2.7%.