East Ridge, TN Map & Demographics
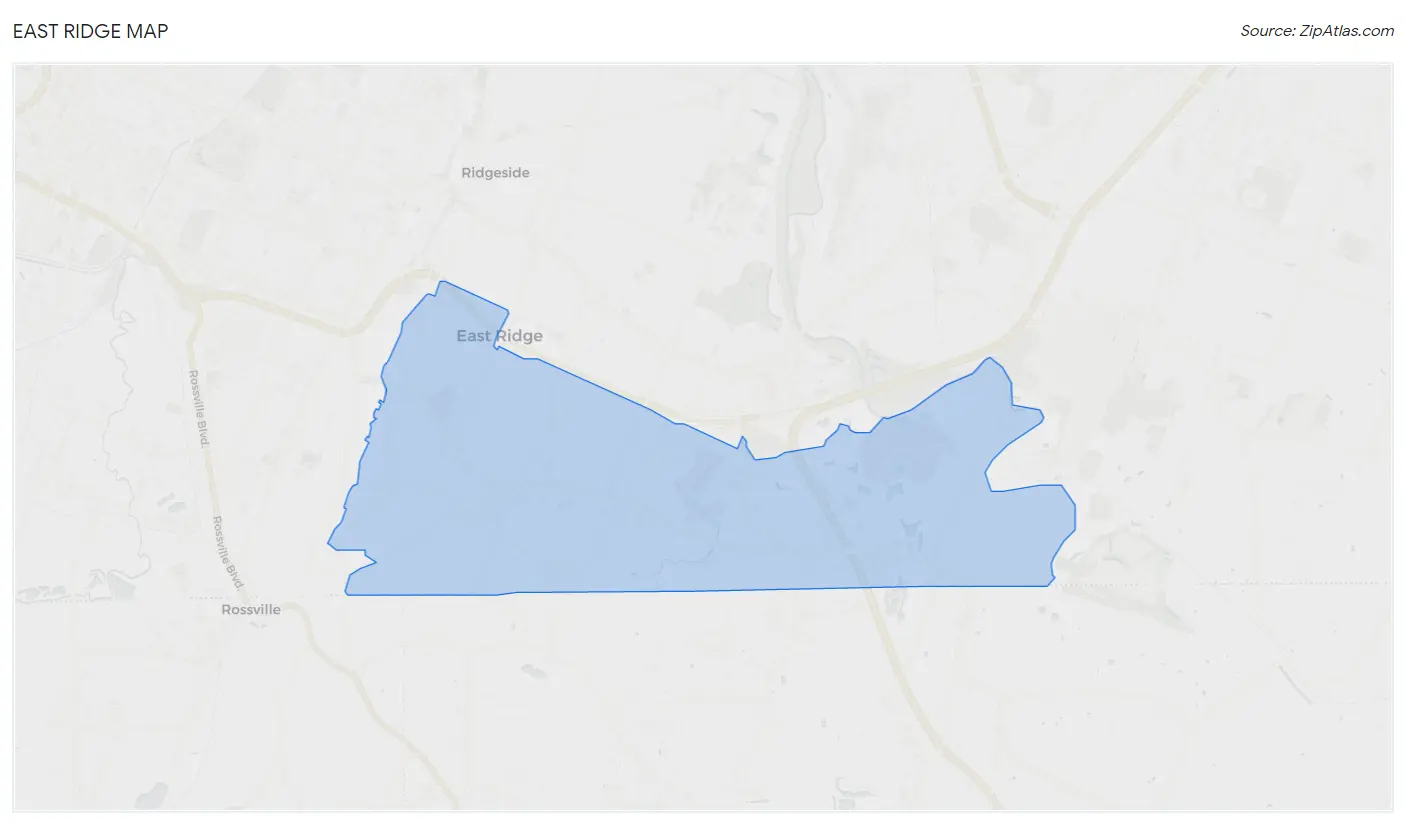
East Ridge Map
East Ridge Overview
$30,355
PER CAPITA INCOME
$64,696
AVG FAMILY INCOME
$53,103
AVG HOUSEHOLD INCOME
21.6%
WAGE / INCOME GAP [ % ]
78.4¢/ $1
WAGE / INCOME GAP [ $ ]
$9,773
FAMILY INCOME DEFICIT
0.41
INEQUALITY / GINI INDEX
22,040
TOTAL POPULATION
10,703
MALE POPULATION
11,337
FEMALE POPULATION
94.41
MALES / 100 FEMALES
105.92
FEMALES / 100 MALES
39.6
MEDIAN AGE
2.9
AVG FAMILY SIZE
2.3
AVG HOUSEHOLD SIZE
12,222
LABOR FORCE [ PEOPLE ]
66.7%
PERCENT IN LABOR FORCE
6.5%
UNEMPLOYMENT RATE
East Ridge Area Codes
Income in East Ridge
Income Overview in East Ridge
Per Capita Income in East Ridge is $30,355, while median incomes of families and households are $64,696 and $53,103 respectively.
| Characteristic | Number | Measure |
| Per Capita Income | 22,040 | $30,355 |
| Median Family Income | 5,517 | $64,696 |
| Mean Family Income | 5,517 | $77,285 |
| Median Household Income | 9,558 | $53,103 |
| Mean Household Income | 9,558 | $66,648 |
| Income Deficit | 5,517 | $9,773 |
| Wage / Income Gap (%) | 22,040 | 21.64% |
| Wage / Income Gap ($) | 22,040 | 78.36¢ per $1 |
| Gini / Inequality Index | 22,040 | 0.41 |
Earnings by Sex in East Ridge
Average Earnings in East Ridge are $35,662, $41,369 for men and $32,416 for women, a difference of 21.6%.
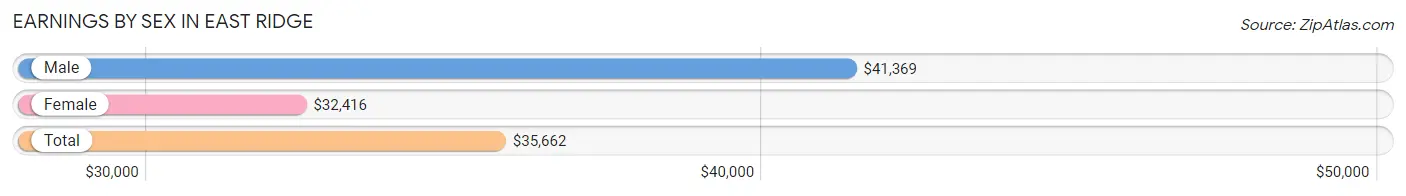
| Sex | Number | Average Earnings |
| Male | 6,165 (50.1%) | $41,369 |
| Female | 6,127 (49.8%) | $32,416 |
| Total | 12,292 (100.0%) | $35,662 |
Earnings by Sex by Income Bracket in East Ridge
The most common earnings brackets in East Ridge are $100,000+ for men (529 | 8.6%) and $30,000 to $34,999 for women (925 | 15.1%).
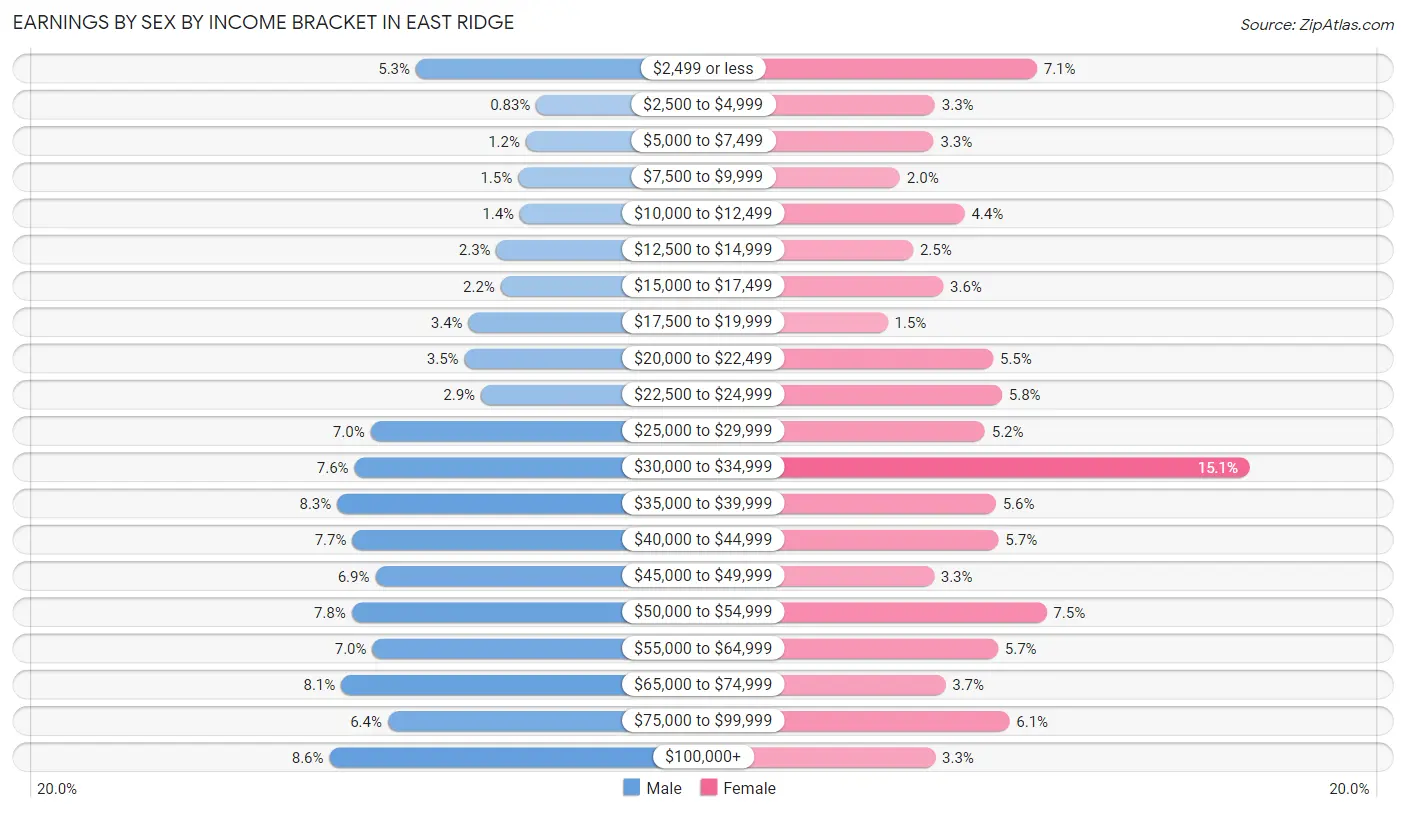
| Income | Male | Female |
| $2,499 or less | 329 (5.3%) | 436 (7.1%) |
| $2,500 to $4,999 | 51 (0.8%) | 202 (3.3%) |
| $5,000 to $7,499 | 75 (1.2%) | 199 (3.3%) |
| $7,500 to $9,999 | 93 (1.5%) | 122 (2.0%) |
| $10,000 to $12,499 | 89 (1.4%) | 270 (4.4%) |
| $12,500 to $14,999 | 143 (2.3%) | 152 (2.5%) |
| $15,000 to $17,499 | 133 (2.2%) | 221 (3.6%) |
| $17,500 to $19,999 | 208 (3.4%) | 94 (1.5%) |
| $20,000 to $22,499 | 217 (3.5%) | 336 (5.5%) |
| $22,500 to $24,999 | 179 (2.9%) | 356 (5.8%) |
| $25,000 to $29,999 | 434 (7.0%) | 317 (5.2%) |
| $30,000 to $34,999 | 471 (7.6%) | 925 (15.1%) |
| $35,000 to $39,999 | 511 (8.3%) | 342 (5.6%) |
| $40,000 to $44,999 | 476 (7.7%) | 348 (5.7%) |
| $45,000 to $49,999 | 423 (6.9%) | 200 (3.3%) |
| $50,000 to $54,999 | 478 (7.7%) | 458 (7.5%) |
| $55,000 to $64,999 | 430 (7.0%) | 347 (5.7%) |
| $65,000 to $74,999 | 502 (8.1%) | 226 (3.7%) |
| $75,000 to $99,999 | 394 (6.4%) | 373 (6.1%) |
| $100,000+ | 529 (8.6%) | 203 (3.3%) |
| Total | 6,165 (100.0%) | 6,127 (100.0%) |
Earnings by Sex by Educational Attainment in East Ridge
Average earnings in East Ridge are $43,270 for men and $33,797 for women, a difference of 21.9%. Men with an educational attainment of graduate degree enjoy the highest average annual earnings of $80,428, while those with less than high school education earn the least with $35,966. Women with an educational attainment of graduate degree earn the most with the average annual earnings of $47,444, while those with less than high school education have the smallest earnings of $23,086.
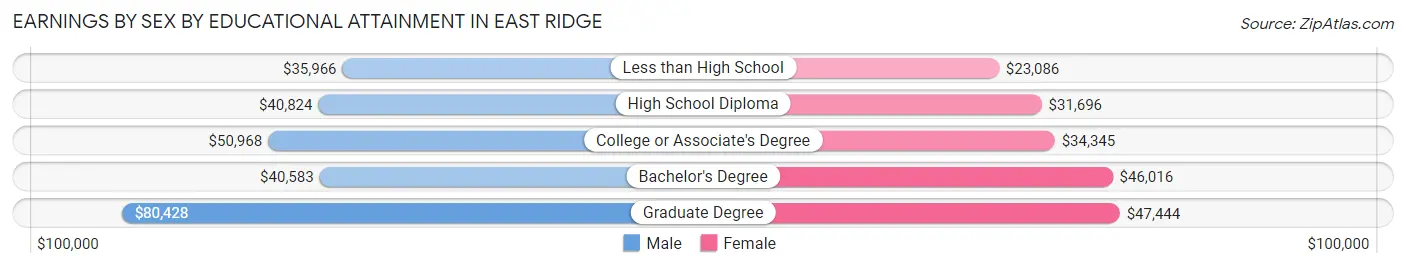
| Educational Attainment | Male Income | Female Income |
| Less than High School | $35,966 | $23,086 |
| High School Diploma | $40,824 | $31,696 |
| College or Associate's Degree | $50,968 | $34,345 |
| Bachelor's Degree | $40,583 | $46,016 |
| Graduate Degree | $80,428 | $47,444 |
| Total | $43,270 | $33,797 |
Family Income in East Ridge
Family Income Brackets in East Ridge
According to the East Ridge family income data, there are 1,197 families falling into the $50,000 to $74,999 income range, which is the most common income bracket and makes up 21.7% of all families. Conversely, the $10,000 to $14,999 income bracket is the least frequent group with only 116 families (2.1%) belonging to this category.
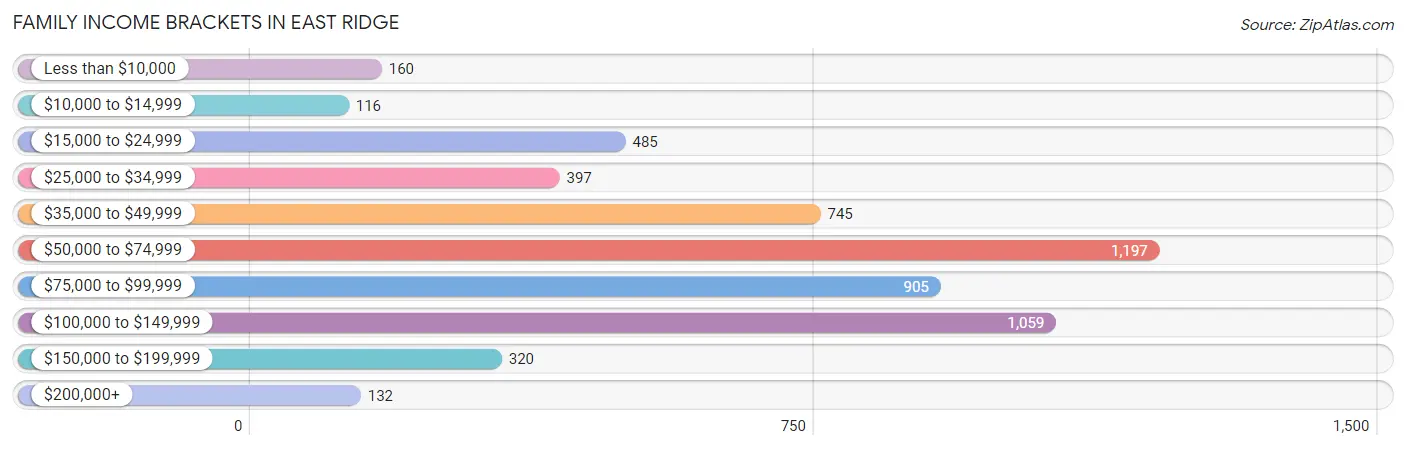
| Income Bracket | # Families | % Families |
| Less than $10,000 | 160 | 2.9% |
| $10,000 to $14,999 | 116 | 2.1% |
| $15,000 to $24,999 | 485 | 8.8% |
| $25,000 to $34,999 | 397 | 7.2% |
| $35,000 to $49,999 | 745 | 13.5% |
| $50,000 to $74,999 | 1,197 | 21.7% |
| $75,000 to $99,999 | 905 | 16.4% |
| $100,000 to $149,999 | 1,059 | 19.2% |
| $150,000 to $199,999 | 320 | 5.8% |
| $200,000+ | 132 | 2.4% |
Family Income by Famaliy Size in East Ridge
6-person families (156 | 2.8%) account for the highest median family income in East Ridge with $102,716 per family, while 2-person families (3,002 | 54.4%) have the highest median income of $28,194 per family member.
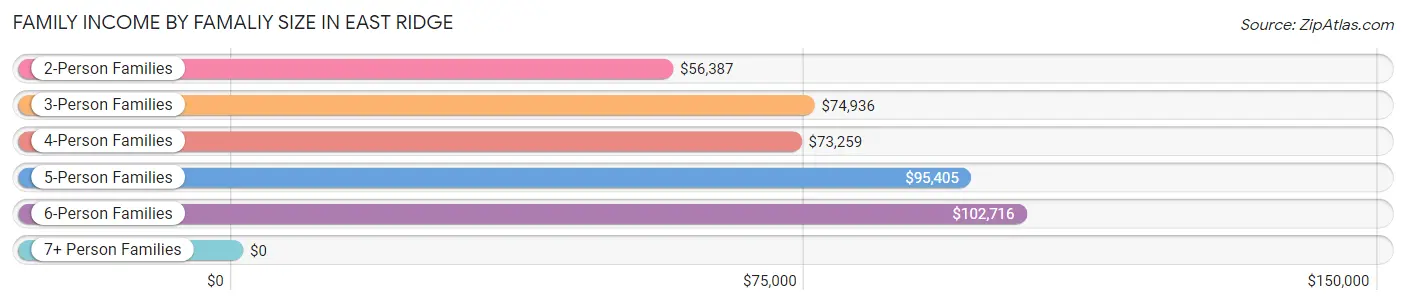
| Income Bracket | # Families | Median Income |
| 2-Person Families | 3,002 (54.4%) | $56,387 |
| 3-Person Families | 1,534 (27.8%) | $74,936 |
| 4-Person Families | 527 (9.6%) | $73,259 |
| 5-Person Families | 209 (3.8%) | $95,405 |
| 6-Person Families | 156 (2.8%) | $102,716 |
| 7+ Person Families | 89 (1.6%) | $0 |
| Total | 5,517 (100.0%) | $64,696 |
Family Income by Number of Earners in East Ridge
The median family income in East Ridge is $64,696, with families comprising 3+ earners (577) having the highest median family income of $109,261, while families with no earners (740) have the lowest median family income of $38,333, accounting for 10.5% and 13.4% of families, respectively.
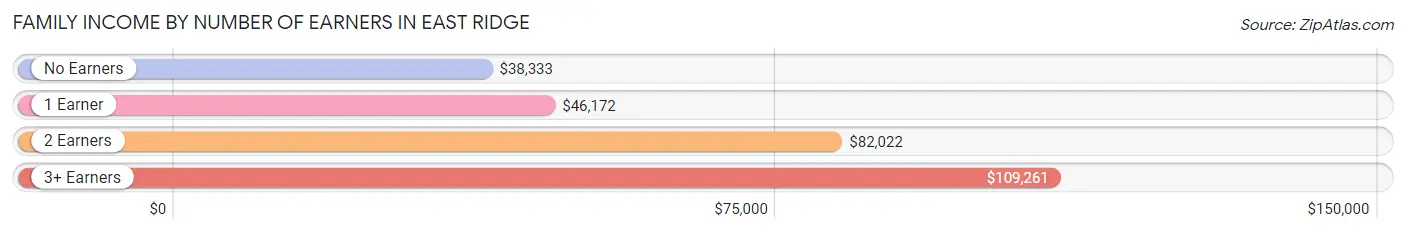
| Number of Earners | # Families | Median Income |
| No Earners | 740 (13.4%) | $38,333 |
| 1 Earner | 2,020 (36.6%) | $46,172 |
| 2 Earners | 2,180 (39.5%) | $82,022 |
| 3+ Earners | 577 (10.5%) | $109,261 |
| Total | 5,517 (100.0%) | $64,696 |
Household Income in East Ridge
Household Income Brackets in East Ridge
With 1,845 households falling in the category, the $50,000 to $74,999 income range is the most frequent in East Ridge, accounting for 19.3% of all households. In contrast, only 172 households (1.8%) fall into the $200,000+ income bracket, making it the least populous group.
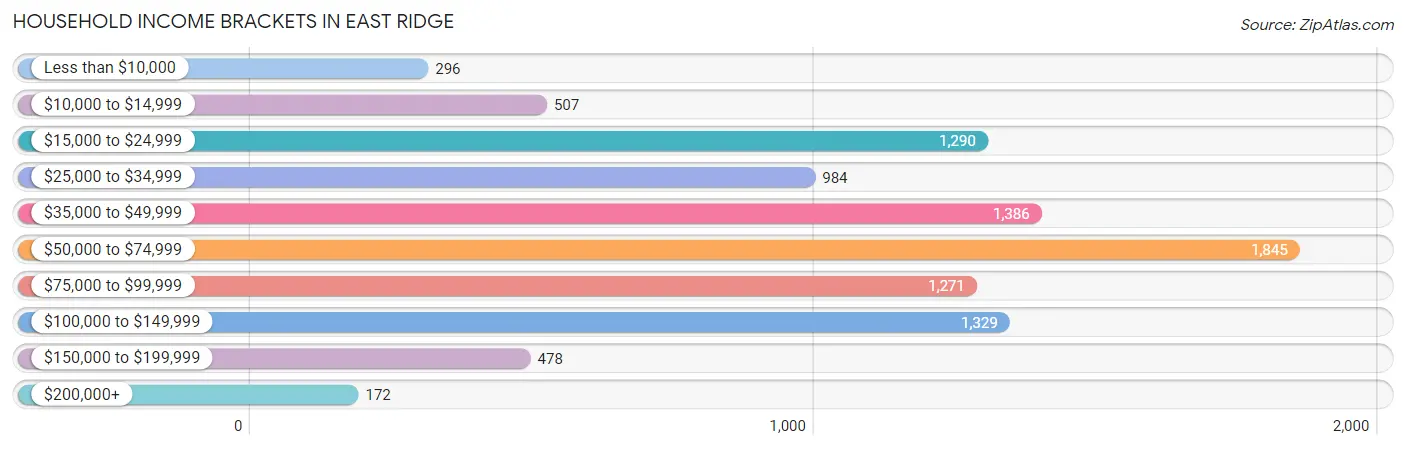
| Income Bracket | # Households | % Households |
| Less than $10,000 | 296 | 3.1% |
| $10,000 to $14,999 | 507 | 5.3% |
| $15,000 to $24,999 | 1,290 | 13.5% |
| $25,000 to $34,999 | 984 | 10.3% |
| $35,000 to $49,999 | 1,386 | 14.5% |
| $50,000 to $74,999 | 1,845 | 19.3% |
| $75,000 to $99,999 | 1,271 | 13.3% |
| $100,000 to $149,999 | 1,329 | 13.9% |
| $150,000 to $199,999 | 478 | 5.0% |
| $200,000+ | 172 | 1.8% |
Household Income by Householder Age in East Ridge
The median household income in East Ridge is $53,103, with the highest median household income of $62,894 found in the 25 to 44 years age bracket for the primary householder. A total of 3,503 households (36.6%) fall into this category. Meanwhile, the 15 to 24 years age bracket for the primary householder has the lowest median household income of $33,971, with 334 households (3.5%) in this group.
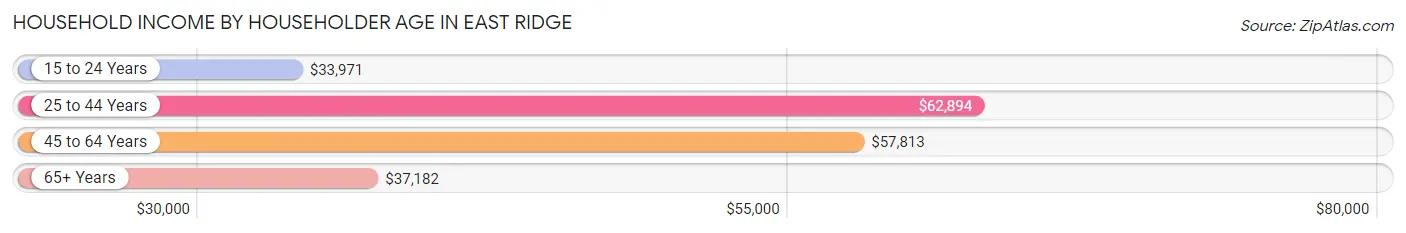
| Income Bracket | # Households | Median Income |
| 15 to 24 Years | 334 (3.5%) | $33,971 |
| 25 to 44 Years | 3,503 (36.6%) | $62,894 |
| 45 to 64 Years | 3,035 (31.8%) | $57,813 |
| 65+ Years | 2,686 (28.1%) | $37,182 |
| Total | 9,558 (100.0%) | $53,103 |
Poverty in East Ridge
Income Below Poverty by Sex and Age in East Ridge
With 16.1% poverty level for males and 15.4% for females among the residents of East Ridge, under 5 year old males and 16 and 17 year old females are the most vulnerable to poverty, with 196 males (32.8%) and 153 females (52.9%) in their respective age groups living below the poverty level.
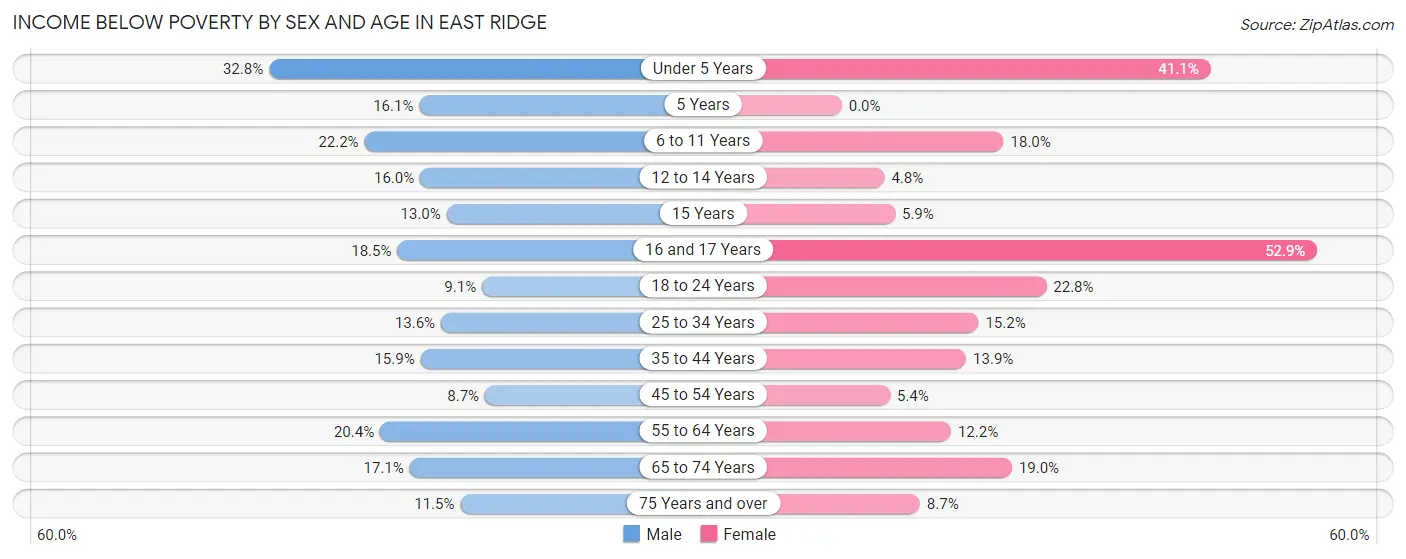
| Age Bracket | Male | Female |
| Under 5 Years | 196 (32.8%) | 200 (41.1%) |
| 5 Years | 13 (16.1%) | 0 (0.0%) |
| 6 to 11 Years | 181 (22.2%) | 104 (18.0%) |
| 12 to 14 Years | 53 (16.0%) | 15 (4.8%) |
| 15 Years | 13 (13.0%) | 9 (5.9%) |
| 16 and 17 Years | 44 (18.5%) | 153 (52.9%) |
| 18 to 24 Years | 62 (9.1%) | 210 (22.8%) |
| 25 to 34 Years | 271 (13.6%) | 266 (15.2%) |
| 35 to 44 Years | 201 (15.9%) | 188 (13.9%) |
| 45 to 54 Years | 107 (8.7%) | 80 (5.4%) |
| 55 to 64 Years | 282 (20.4%) | 192 (12.2%) |
| 65 to 74 Years | 196 (17.1%) | 205 (19.0%) |
| 75 Years and over | 89 (11.5%) | 92 (8.7%) |
| Total | 1,708 (16.1%) | 1,714 (15.4%) |
Income Above Poverty by Sex and Age in East Ridge
According to the poverty statistics in East Ridge, males aged 45 to 54 years and females aged 5 years are the age groups that are most secure financially, with 91.3% of males and 100.0% of females in these age groups living above the poverty line.
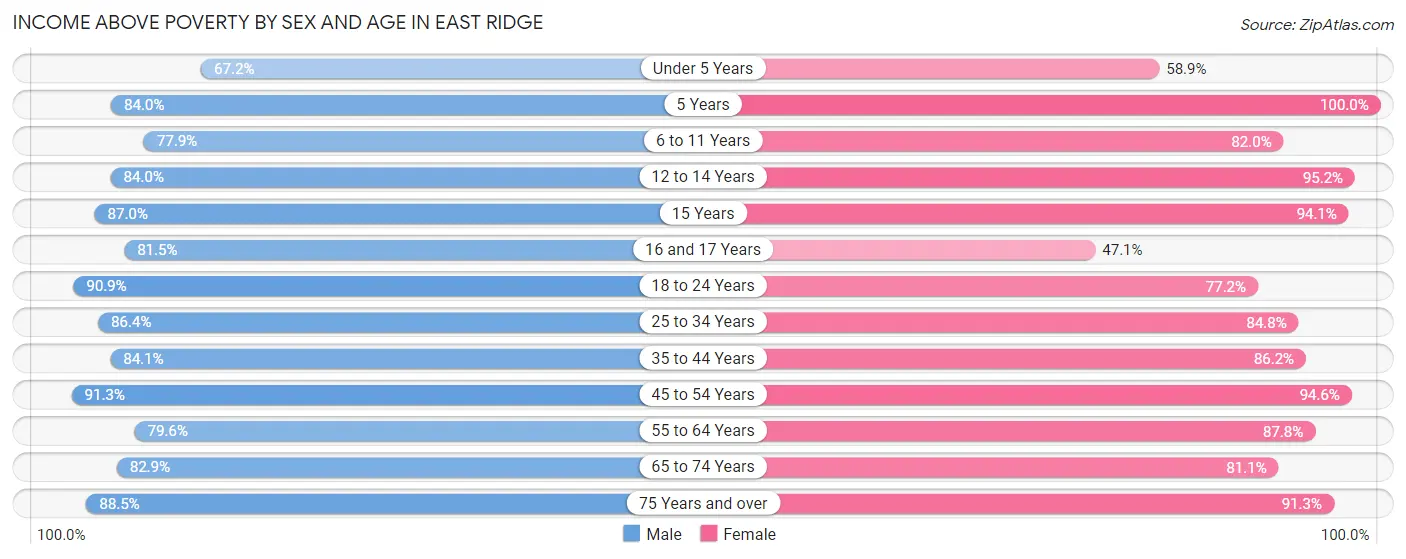
| Age Bracket | Male | Female |
| Under 5 Years | 402 (67.2%) | 287 (58.9%) |
| 5 Years | 68 (84.0%) | 38 (100.0%) |
| 6 to 11 Years | 636 (77.8%) | 473 (82.0%) |
| 12 to 14 Years | 279 (84.0%) | 300 (95.2%) |
| 15 Years | 87 (87.0%) | 143 (94.1%) |
| 16 and 17 Years | 194 (81.5%) | 136 (47.1%) |
| 18 to 24 Years | 622 (90.9%) | 712 (77.2%) |
| 25 to 34 Years | 1,717 (86.4%) | 1,482 (84.8%) |
| 35 to 44 Years | 1,062 (84.1%) | 1,169 (86.2%) |
| 45 to 54 Years | 1,119 (91.3%) | 1,412 (94.6%) |
| 55 to 64 Years | 1,099 (79.6%) | 1,387 (87.8%) |
| 65 to 74 Years | 949 (82.9%) | 877 (81.0%) |
| 75 Years and over | 686 (88.5%) | 966 (91.3%) |
| Total | 8,920 (83.9%) | 9,382 (84.6%) |
Income Below Poverty Among Married-Couple Families in East Ridge
The poverty statistics for married-couple families in East Ridge show that 10.6% or 413 of the total 3,877 families live below the poverty line. Families with 5 or more children have the highest poverty rate of 100.0%, comprising of 47 families. On the other hand, families with no children have the lowest poverty rate of 8.5%, which includes 231 families.
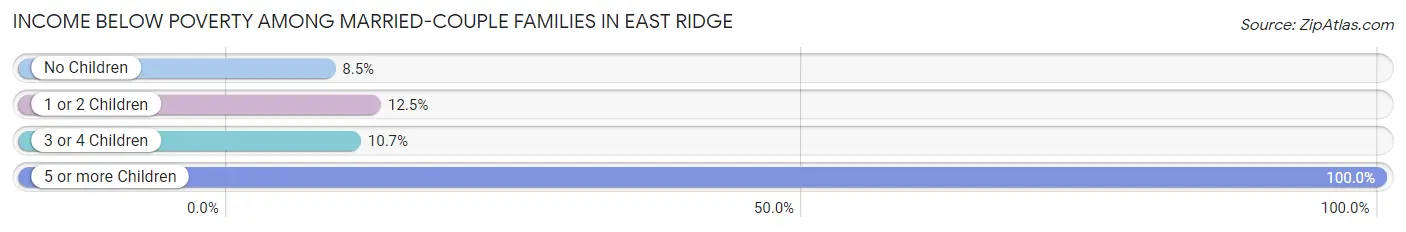
| Children | Above Poverty | Below Poverty |
| No Children | 2,496 (91.5%) | 231 (8.5%) |
| 1 or 2 Children | 851 (87.5%) | 121 (12.4%) |
| 3 or 4 Children | 117 (89.3%) | 14 (10.7%) |
| 5 or more Children | 0 (0.0%) | 47 (100.0%) |
| Total | 3,464 (89.3%) | 413 (10.6%) |
Income Below Poverty Among Single-Parent Households in East Ridge
According to the poverty data in East Ridge, 16.4% or 60 single-father households and 12.6% or 160 single-mother households are living below the poverty line. Among single-father households, those with 3 or 4 children have the highest poverty rate, with 12 households (100.0%) experiencing poverty. Likewise, among single-mother households, those with 3 or 4 children have the highest poverty rate, with 8 households (26.7%) falling below the poverty line.
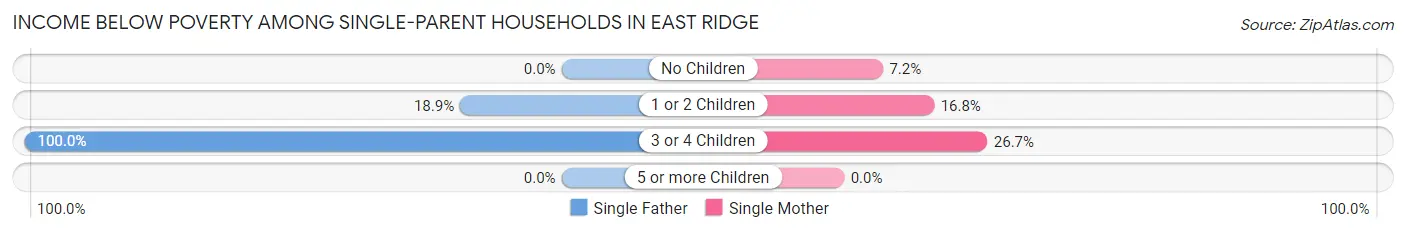
| Children | Single Father | Single Mother |
| No Children | 0 (0.0%) | 43 (7.2%) |
| 1 or 2 Children | 48 (18.9%) | 109 (16.8%) |
| 3 or 4 Children | 12 (100.0%) | 8 (26.7%) |
| 5 or more Children | 0 (0.0%) | 0 (0.0%) |
| Total | 60 (16.4%) | 160 (12.6%) |
Income Below Poverty Among Married-Couple vs Single-Parent Households in East Ridge
The poverty data for East Ridge shows that 413 of the married-couple family households (10.6%) and 220 of the single-parent households (13.4%) are living below the poverty level. Within the married-couple family households, those with 5 or more children have the highest poverty rate, with 47 households (100.0%) falling below the poverty line. Among the single-parent households, those with 3 or 4 children have the highest poverty rate, with 20 household (47.6%) living below poverty.
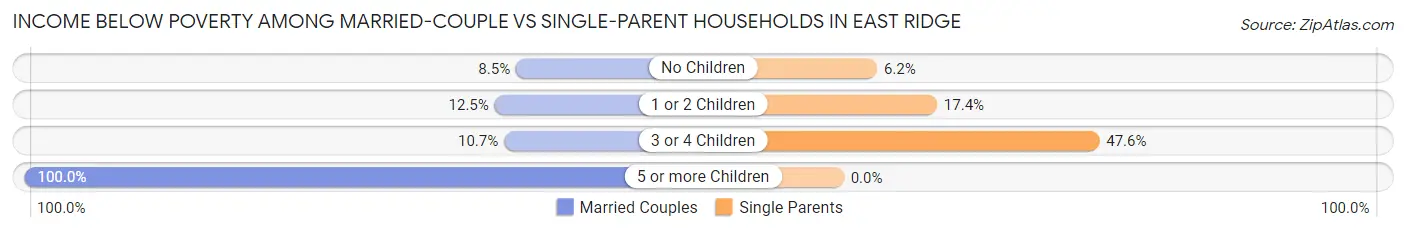
| Children | Married-Couple Families | Single-Parent Households |
| No Children | 231 (8.5%) | 43 (6.2%) |
| 1 or 2 Children | 121 (12.4%) | 157 (17.4%) |
| 3 or 4 Children | 14 (10.7%) | 20 (47.6%) |
| 5 or more Children | 47 (100.0%) | 0 (0.0%) |
| Total | 413 (10.6%) | 220 (13.4%) |
Race in East Ridge
The most populous races in East Ridge are White / Caucasian (16,832 | 76.4%), Hispanic or Latino (2,939 | 13.3%), and Black / African American (2,763 | 12.5%).
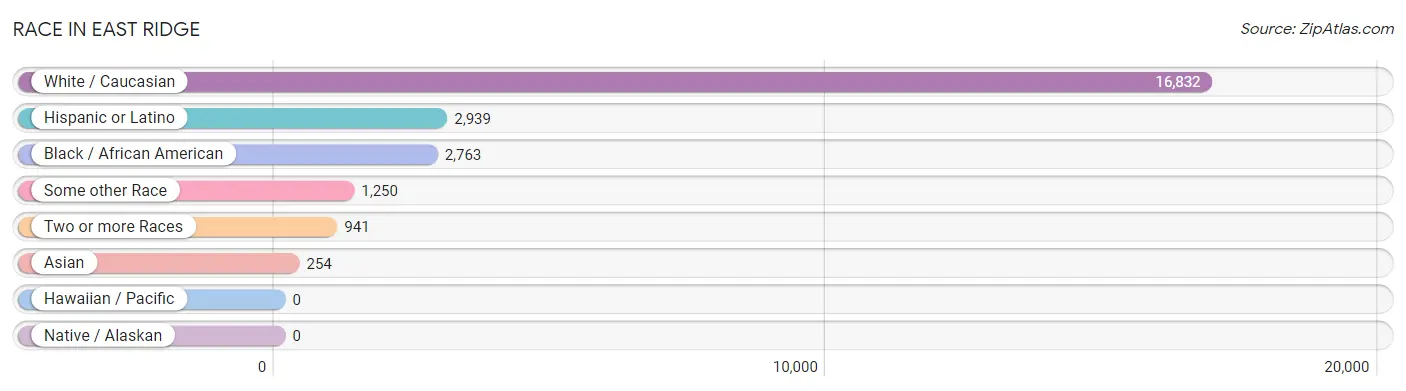
| Race | # Population | % Population |
| Asian | 254 | 1.1% |
| Black / African American | 2,763 | 12.5% |
| Hawaiian / Pacific | 0 | 0.0% |
| Hispanic or Latino | 2,939 | 13.3% |
| Native / Alaskan | 0 | 0.0% |
| White / Caucasian | 16,832 | 76.4% |
| Two or more Races | 941 | 4.3% |
| Some other Race | 1,250 | 5.7% |
| Total | 22,040 | 100.0% |
Ancestry in East Ridge
The most populous ancestries reported in East Ridge are English (2,242 | 10.2%), American (2,154 | 9.8%), German (2,152 | 9.8%), Irish (1,947 | 8.8%), and Mexican (1,766 | 8.0%), together accounting for 46.5% of all East Ridge residents.
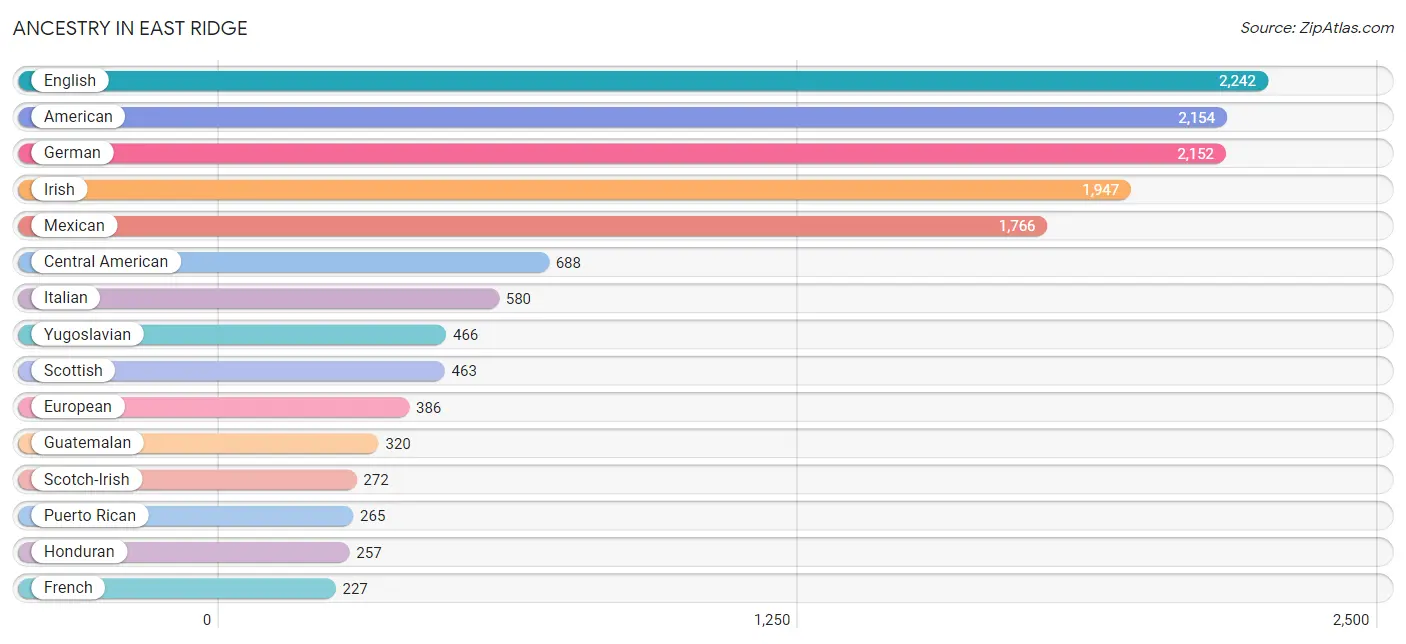
| Ancestry | # Population | % Population |
| African | 73 | 0.3% |
| American | 2,154 | 9.8% |
| Arab | 28 | 0.1% |
| Argentinean | 56 | 0.3% |
| Australian | 2 | 0.0% |
| Austrian | 16 | 0.1% |
| Belgian | 9 | 0.0% |
| Bhutanese | 7 | 0.0% |
| British | 28 | 0.1% |
| Burmese | 42 | 0.2% |
| Central American | 688 | 3.1% |
| Cherokee | 74 | 0.3% |
| Chippewa | 9 | 0.0% |
| Choctaw | 4 | 0.0% |
| Costa Rican | 23 | 0.1% |
| Dutch | 150 | 0.7% |
| Dutch West Indian | 34 | 0.2% |
| Eastern European | 72 | 0.3% |
| Egyptian | 22 | 0.1% |
| English | 2,242 | 10.2% |
| European | 386 | 1.8% |
| French | 227 | 1.0% |
| French Canadian | 108 | 0.5% |
| German | 2,152 | 9.8% |
| Greek | 54 | 0.3% |
| Guatemalan | 320 | 1.5% |
| Honduran | 257 | 1.2% |
| Hungarian | 56 | 0.3% |
| Indian (Asian) | 3 | 0.0% |
| Iranian | 20 | 0.1% |
| Irish | 1,947 | 8.8% |
| Italian | 580 | 2.6% |
| Korean | 143 | 0.6% |
| Luxembourger | 13 | 0.1% |
| Maltese | 20 | 0.1% |
| Menominee | 2 | 0.0% |
| Mexican | 1,766 | 8.0% |
| Native Hawaiian | 9 | 0.0% |
| New Zealander | 16 | 0.1% |
| Norwegian | 41 | 0.2% |
| Panamanian | 3 | 0.0% |
| Polish | 167 | 0.8% |
| Puerto Rican | 265 | 1.2% |
| Russian | 13 | 0.1% |
| Salvadoran | 85 | 0.4% |
| Samoan | 22 | 0.1% |
| Scandinavian | 46 | 0.2% |
| Scotch-Irish | 272 | 1.2% |
| Scottish | 463 | 2.1% |
| Serbian | 4 | 0.0% |
| South American | 56 | 0.3% |
| Sri Lankan | 29 | 0.1% |
| Subsaharan African | 81 | 0.4% |
| Swedish | 21 | 0.1% |
| Swiss | 60 | 0.3% |
| Syrian | 6 | 0.0% |
| Thai | 92 | 0.4% |
| Ugandan | 8 | 0.0% |
| Ukrainian | 4 | 0.0% |
| Welsh | 49 | 0.2% |
| Yugoslavian | 466 | 2.1% | View All 61 Rows |
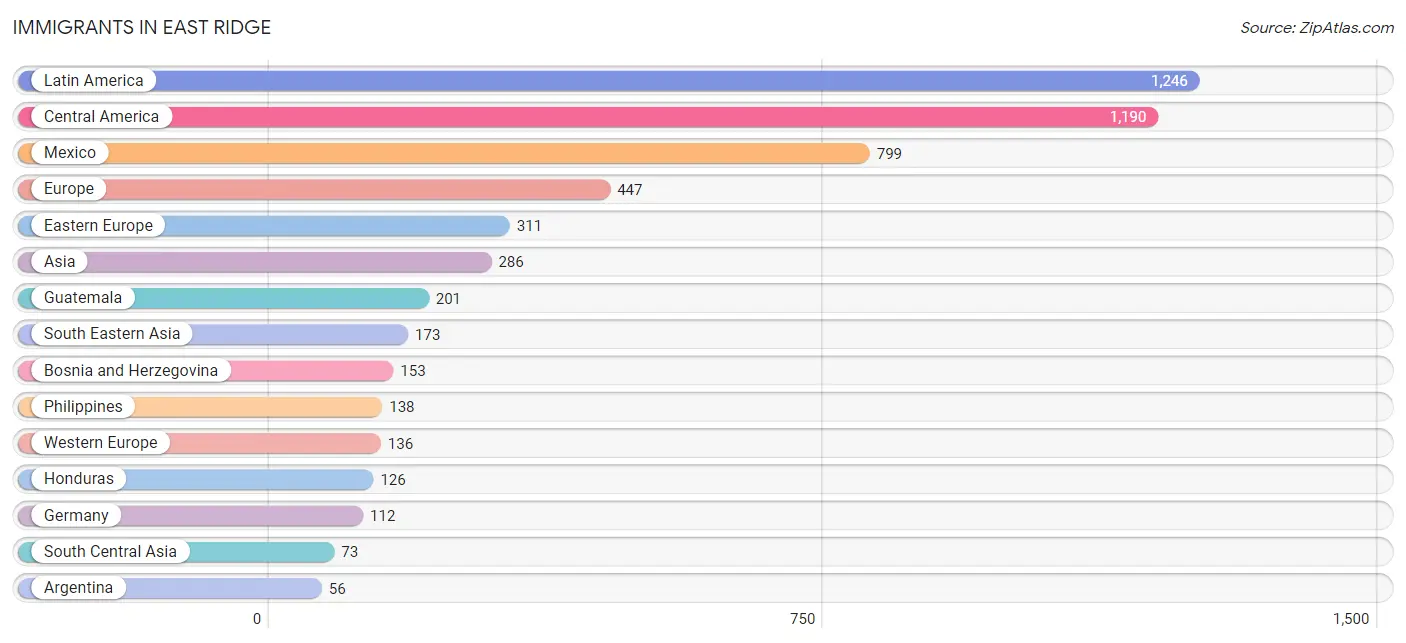
Immigrants in East Ridge
The most numerous immigrant groups reported in East Ridge came from Latin America (1,246 | 5.7%), Central America (1,190 | 5.4%), Mexico (799 | 3.6%), Europe (447 | 2.0%), and Eastern Europe (311 | 1.4%), together accounting for 18.1% of all East Ridge residents.
| Immigration Origin | # Population | % Population |
| Africa | 32 | 0.2% |
| Argentina | 56 | 0.3% |
| Asia | 286 | 1.3% |
| Austria | 18 | 0.1% |
| Bosnia and Herzegovina | 153 | 0.7% |
| Central America | 1,190 | 5.4% |
| China | 3 | 0.0% |
| Costa Rica | 23 | 0.1% |
| Eastern Africa | 8 | 0.0% |
| Eastern Asia | 29 | 0.1% |
| Eastern Europe | 311 | 1.4% |
| Egypt | 17 | 0.1% |
| El Salvador | 41 | 0.2% |
| Europe | 447 | 2.0% |
| France | 6 | 0.0% |
| Germany | 112 | 0.5% |
| Guatemala | 201 | 0.9% |
| Honduras | 126 | 0.6% |
| India | 53 | 0.2% |
| Iran | 20 | 0.1% |
| Israel | 6 | 0.0% |
| Korea | 26 | 0.1% |
| Kuwait | 5 | 0.0% |
| Latin America | 1,246 | 5.7% |
| Mexico | 799 | 3.6% |
| Northern Africa | 17 | 0.1% |
| Philippines | 138 | 0.6% |
| South Africa | 7 | 0.0% |
| South America | 56 | 0.3% |
| South Central Asia | 73 | 0.3% |
| South Eastern Asia | 173 | 0.8% |
| Uganda | 8 | 0.0% |
| Vietnam | 35 | 0.2% |
| Western Asia | 11 | 0.1% |
| Western Europe | 136 | 0.6% | View All 35 Rows |
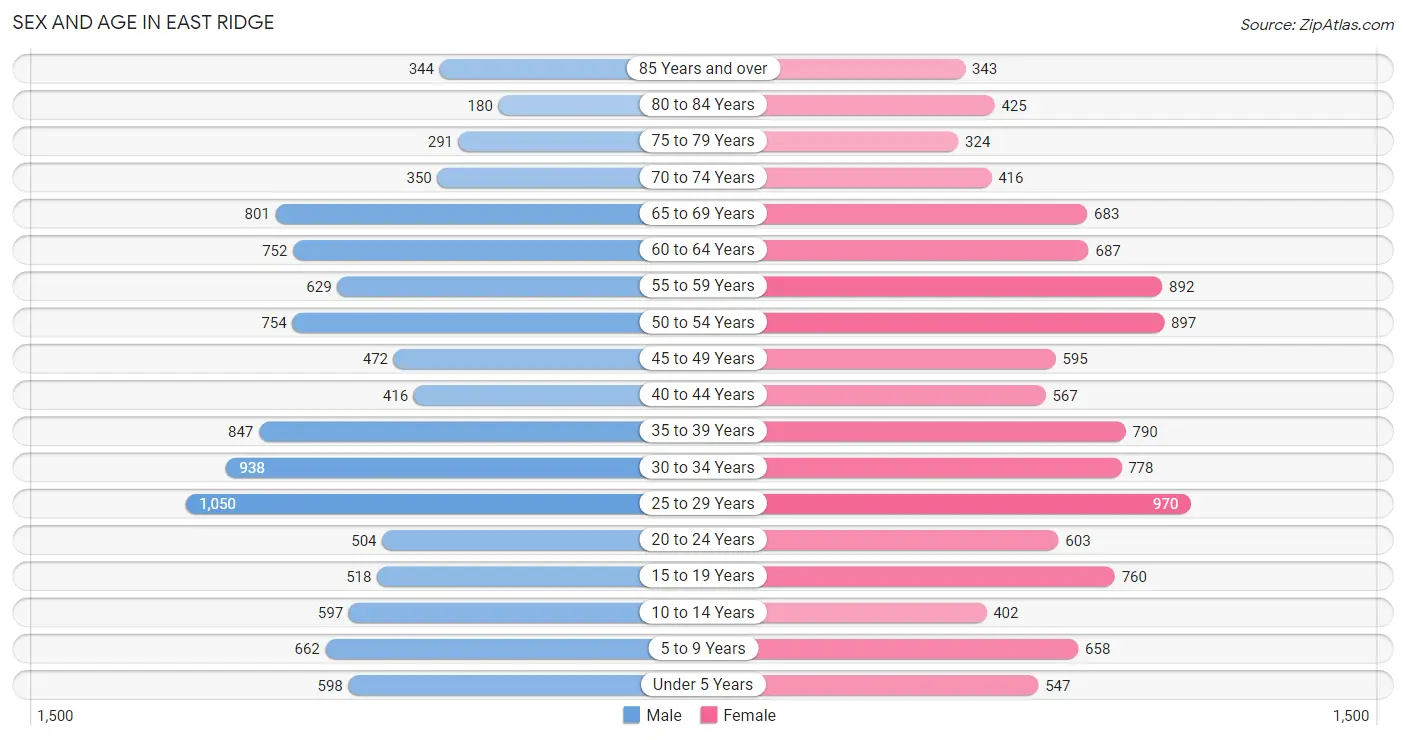
Sex and Age in East Ridge
Sex and Age in East Ridge
The most populous age groups in East Ridge are 25 to 29 Years (1,050 | 9.8%) for men and 25 to 29 Years (970 | 8.6%) for women.
| Age Bracket | Male | Female |
| Under 5 Years | 598 (5.6%) | 547 (4.8%) |
| 5 to 9 Years | 662 (6.2%) | 658 (5.8%) |
| 10 to 14 Years | 597 (5.6%) | 402 (3.5%) |
| 15 to 19 Years | 518 (4.8%) | 760 (6.7%) |
| 20 to 24 Years | 504 (4.7%) | 603 (5.3%) |
| 25 to 29 Years | 1,050 (9.8%) | 970 (8.6%) |
| 30 to 34 Years | 938 (8.8%) | 778 (6.9%) |
| 35 to 39 Years | 847 (7.9%) | 790 (7.0%) |
| 40 to 44 Years | 416 (3.9%) | 567 (5.0%) |
| 45 to 49 Years | 472 (4.4%) | 595 (5.2%) |
| 50 to 54 Years | 754 (7.0%) | 897 (7.9%) |
| 55 to 59 Years | 629 (5.9%) | 892 (7.9%) |
| 60 to 64 Years | 752 (7.0%) | 687 (6.1%) |
| 65 to 69 Years | 801 (7.5%) | 683 (6.0%) |
| 70 to 74 Years | 350 (3.3%) | 416 (3.7%) |
| 75 to 79 Years | 291 (2.7%) | 324 (2.9%) |
| 80 to 84 Years | 180 (1.7%) | 425 (3.7%) |
| 85 Years and over | 344 (3.2%) | 343 (3.0%) |
| Total | 10,703 (100.0%) | 11,337 (100.0%) |
Families and Households in East Ridge
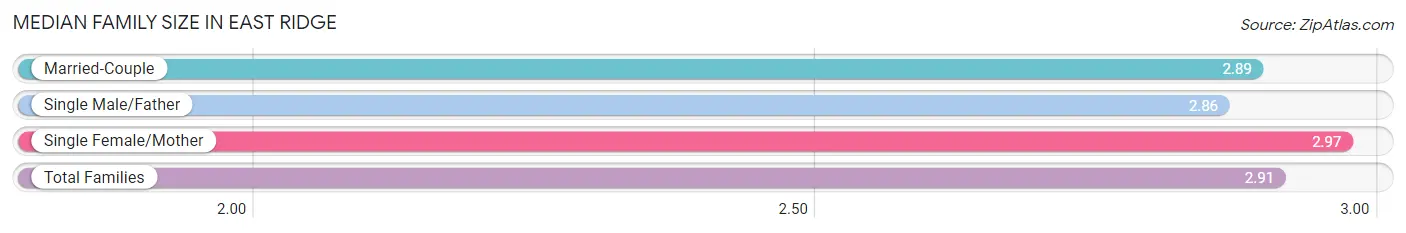
Median Family Size in East Ridge
The median family size in East Ridge is 2.91 persons per family, with single female/mother families (1,275 | 23.1%) accounting for the largest median family size of 2.97 persons per family. On the other hand, single male/father families (365 | 6.6%) represent the smallest median family size with 2.86 persons per family.
| Family Type | # Families | Family Size |
| Married-Couple | 3,877 (70.3%) | 2.89 |
| Single Male/Father | 365 (6.6%) | 2.86 |
| Single Female/Mother | 1,275 (23.1%) | 2.97 |
| Total Families | 5,517 (100.0%) | 2.91 |
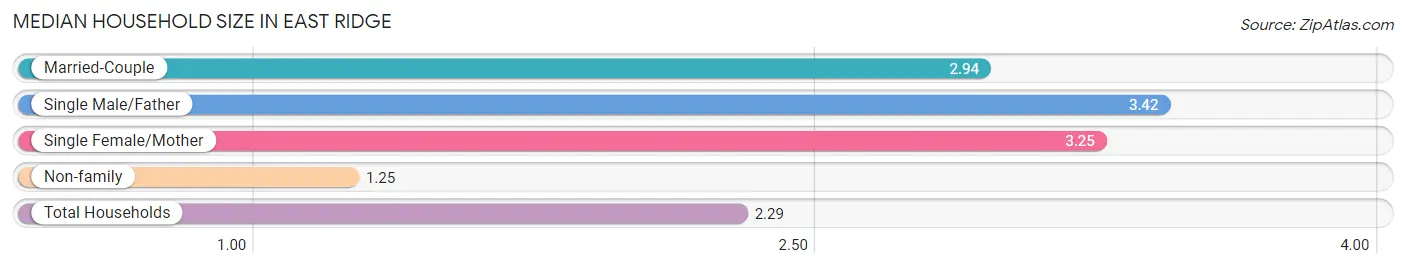
Median Household Size in East Ridge
The median household size in East Ridge is 2.29 persons per household, with single male/father households (365 | 3.8%) accounting for the largest median household size of 3.42 persons per household. non-family households (4,041 | 42.3%) represent the smallest median household size with 1.25 persons per household.
| Household Type | # Households | Household Size |
| Married-Couple | 3,877 (40.6%) | 2.94 |
| Single Male/Father | 365 (3.8%) | 3.42 |
| Single Female/Mother | 1,275 (13.3%) | 3.25 |
| Non-family | 4,041 (42.3%) | 1.25 |
| Total Households | 9,558 (100.0%) | 2.29 |
Household Size by Marriage Status in East Ridge
Out of a total of 9,558 households in East Ridge, 5,517 (57.7%) are family households, while 4,041 (42.3%) are nonfamily households. The most numerous type of family households are 2-person households, comprising 2,685, and the most common type of nonfamily households are 1-person households, comprising 3,347.
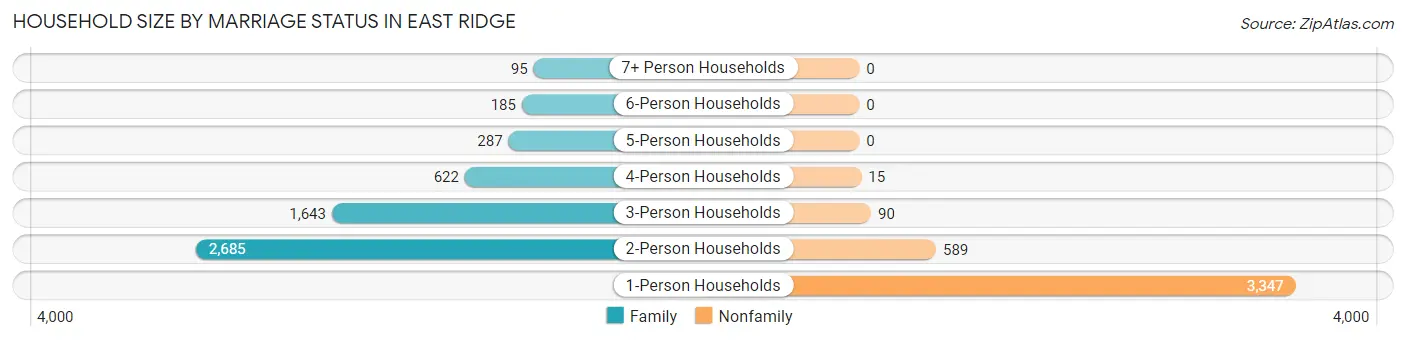
| Household Size | Family Households | Nonfamily Households |
| 1-Person Households | - | 3,347 (35.0%) |
| 2-Person Households | 2,685 (28.1%) | 589 (6.2%) |
| 3-Person Households | 1,643 (17.2%) | 90 (0.9%) |
| 4-Person Households | 622 (6.5%) | 15 (0.2%) |
| 5-Person Households | 287 (3.0%) | 0 (0.0%) |
| 6-Person Households | 185 (1.9%) | 0 (0.0%) |
| 7+ Person Households | 95 (1.0%) | 0 (0.0%) |
| Total | 5,517 (57.7%) | 4,041 (42.3%) |
Female Fertility in East Ridge
Fertility by Age in East Ridge
Average fertility rate in East Ridge is 14.0 births per 1,000 women. Women in the age bracket of 20 to 34 years have the highest fertility rate with 31.0 births per 1,000 women. Women in the age bracket of 20 to 34 years acount for 100.0% of all women with births.
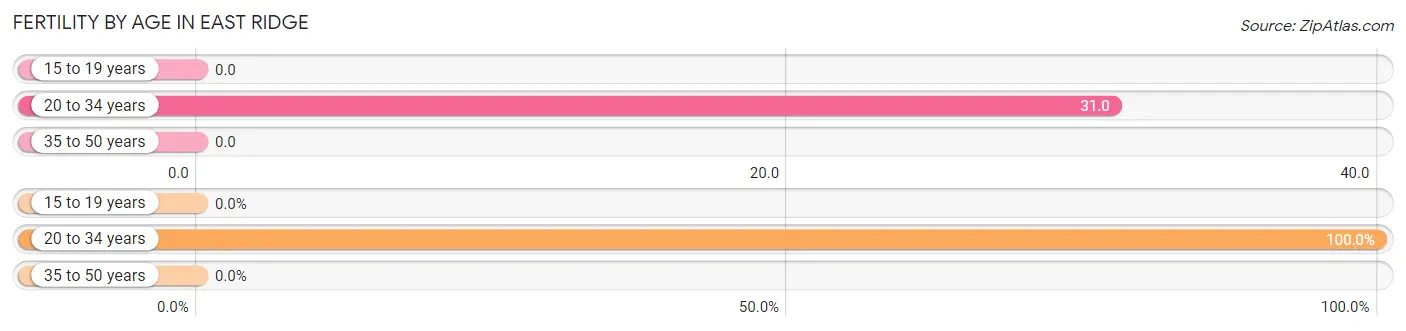
| Age Bracket | Women with Births | Births / 1,000 Women |
| 15 to 19 years | 0 (0.0%) | 0.0 |
| 20 to 34 years | 72 (100.0%) | 31.0 |
| 35 to 50 years | 0 (0.0%) | 0.0 |
| Total | 72 (100.0%) | 14.0 |
Fertility by Age by Marriage Status in East Ridge
54.2% of women with births (72) in East Ridge are married. The highest percentage of unmarried women with births falls into 20 to 34 years age bracket with 45.8% of them unmarried at the time of birth, while the lowest percentage of unmarried women with births belong to 20 to 34 years age bracket with 45.8% of them unmarried.
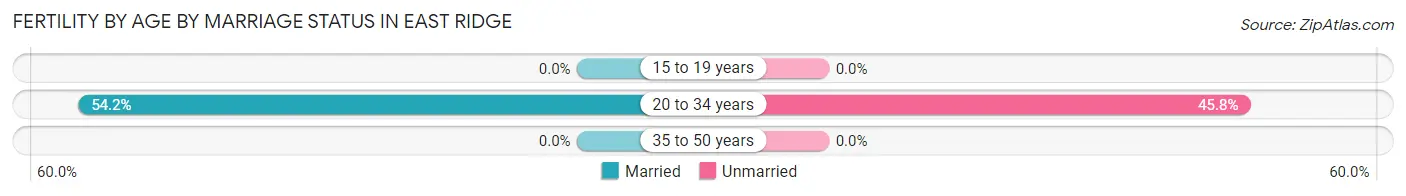
| Age Bracket | Married | Unmarried |
| 15 to 19 years | 0 (0.0%) | 0 (0.0%) |
| 20 to 34 years | 39 (54.2%) | 33 (45.8%) |
| 35 to 50 years | 0 (0.0%) | 0 (0.0%) |
| Total | 39 (54.2%) | 33 (45.8%) |
Fertility by Education in East Ridge
| Educational Attainment | Women with Births | Births / 1,000 Women |
| Less than High School | 0 (0.0%) | 0.0 |
| High School Diploma | 37 (51.4%) | 27.0 |
| College or Associate's Degree | 0 (0.0%) | 0.0 |
| Bachelor's Degree | 16 (22.2%) | 17.0 |
| Graduate Degree | 19 (26.4%) | 43.0 |
| Total | 72 (100.0%) | 14.0 |
Fertility by Education by Marriage Status in East Ridge
45.8% of women with births in East Ridge are unmarried. Women with the educational attainment of bachelor's degree are most likely to be married with 100.0% of them married at childbirth, while women with the educational attainment of high school diploma are least likely to be married with 89.2% of them unmarried at childbirth.
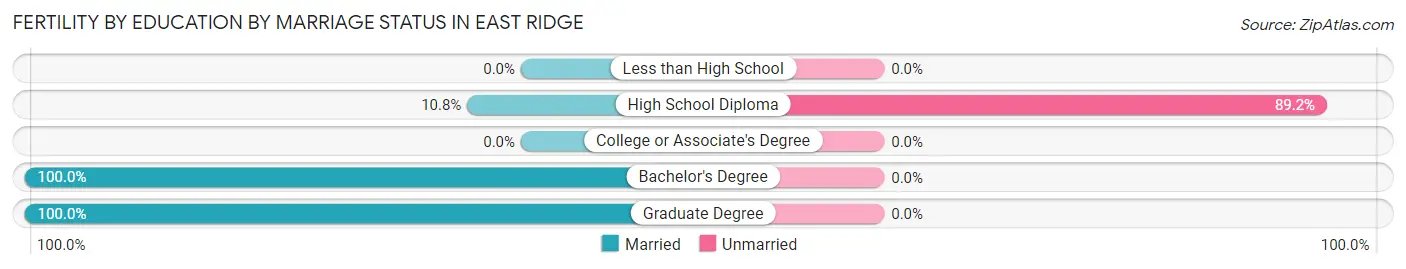
| Educational Attainment | Married | Unmarried |
| Less than High School | 0 (0.0%) | 0 (0.0%) |
| High School Diploma | 4 (10.8%) | 33 (89.2%) |
| College or Associate's Degree | 0 (0.0%) | 0 (0.0%) |
| Bachelor's Degree | 16 (100.0%) | 0 (0.0%) |
| Graduate Degree | 19 (100.0%) | 0 (0.0%) |
| Total | 39 (54.2%) | 33 (45.8%) |
Employment Characteristics in East Ridge
Employment by Class of Employer in East Ridge
Among the 11,141 employed individuals in East Ridge, private company employees (7,988 | 71.7%), not-for-profit organizations (946 | 8.5%), and self-employed (not incorporated) (741 | 6.7%) make up the most common classes of employment.
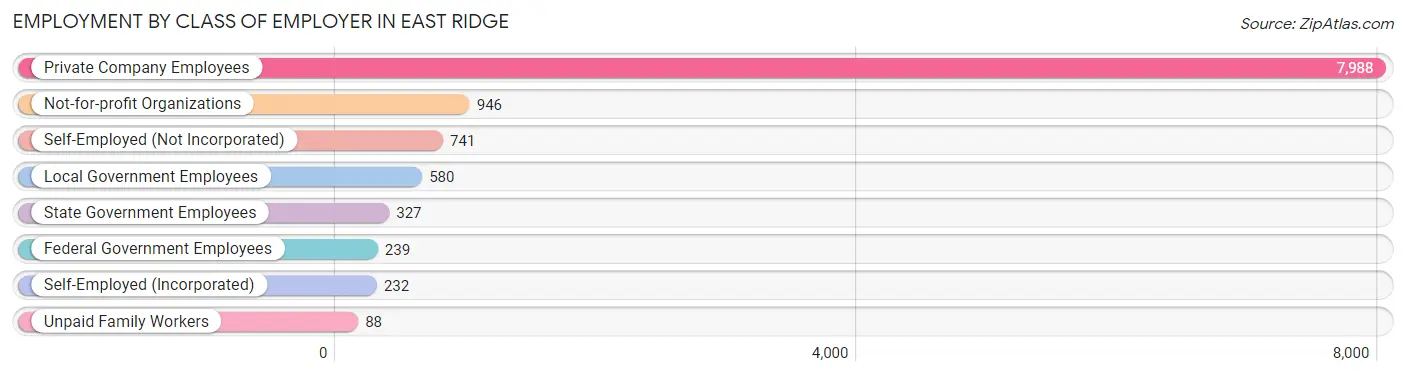
| Employer Class | # Employees | % Employees |
| Private Company Employees | 7,988 | 71.7% |
| Self-Employed (Incorporated) | 232 | 2.1% |
| Self-Employed (Not Incorporated) | 741 | 6.7% |
| Not-for-profit Organizations | 946 | 8.5% |
| Local Government Employees | 580 | 5.2% |
| State Government Employees | 327 | 2.9% |
| Federal Government Employees | 239 | 2.1% |
| Unpaid Family Workers | 88 | 0.8% |
| Total | 11,141 | 100.0% |
Employment Status by Age in East Ridge
According to the labor force statistics for East Ridge, out of the total population over 16 years of age (18,324), 66.7% or 12,222 individuals are in the labor force, with 6.5% or 794 of them unemployed. The age group with the highest labor force participation rate is 30 to 34 years, with 91.4% or 1,568 individuals in the labor force. Within the labor force, the 16 to 19 years age range has the highest percentage of unemployed individuals, with 38.8% or 179 of them being unemployed.
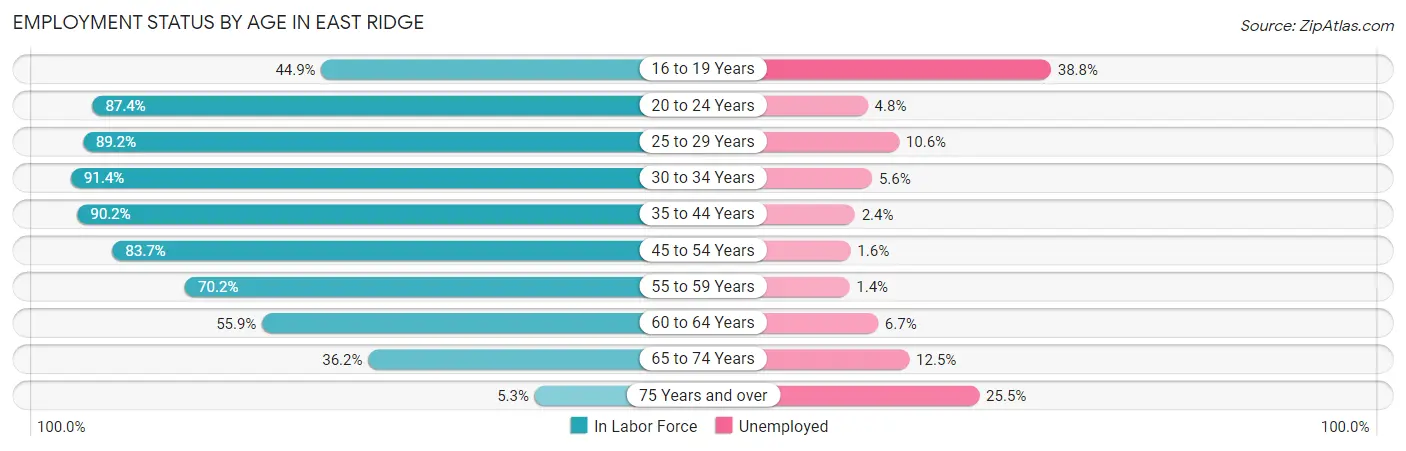
| Age Bracket | In Labor Force | Unemployed |
| 16 to 19 Years | 461 (44.9%) | 179 (38.8%) |
| 20 to 24 Years | 968 (87.4%) | 46 (4.8%) |
| 25 to 29 Years | 1,802 (89.2%) | 191 (10.6%) |
| 30 to 34 Years | 1,568 (91.4%) | 88 (5.6%) |
| 35 to 44 Years | 2,363 (90.2%) | 57 (2.4%) |
| 45 to 54 Years | 2,275 (83.7%) | 36 (1.6%) |
| 55 to 59 Years | 1,068 (70.2%) | 15 (1.4%) |
| 60 to 64 Years | 804 (55.9%) | 54 (6.7%) |
| 65 to 74 Years | 814 (36.2%) | 102 (12.5%) |
| 75 Years and over | 101 (5.3%) | 26 (25.5%) |
| Total | 12,222 (66.7%) | 794 (6.5%) |
Employment Status by Educational Attainment in East Ridge
According to labor force statistics for East Ridge, 82.1% of individuals (9,880) out of the total population between 25 and 64 years of age (12,034) are in the labor force, with 4.5% or 445 of them being unemployed. The group with the highest labor force participation rate are those with the educational attainment of bachelor's degree or higher, with 87.9% or 2,469 individuals in the labor force. Within the labor force, individuals with less than high school education have the highest percentage of unemployment, with 9.6% or 110 of them being unemployed.
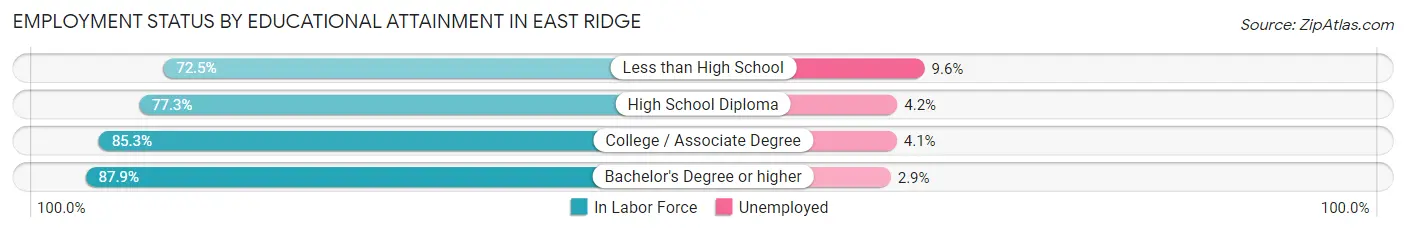
| Educational Attainment | In Labor Force | Unemployed |
| Less than High School | 1,145 (72.5%) | 152 (9.6%) |
| High School Diploma | 2,430 (77.3%) | 132 (4.2%) |
| College / Associate Degree | 3,841 (85.3%) | 185 (4.1%) |
| Bachelor's Degree or higher | 2,469 (87.9%) | 81 (2.9%) |
| Total | 9,880 (82.1%) | 542 (4.5%) |
Employment Occupations by Sex in East Ridge
Management, Business, Science and Arts Occupations
The most common Management, Business, Science and Arts occupations in East Ridge are Community & Social Service (1,116 | 9.8%), Management (808 | 7.1%), Business & Financial (675 | 5.9%), Education Instruction & Library (557 | 4.9%), and Health Diagnosing & Treating (318 | 2.8%).
Management, Business, Science and Arts Occupations by Sex
Within the Management, Business, Science and Arts occupations in East Ridge, the most male-oriented occupations are Architecture & Engineering (100.0%), Arts, Media & Entertainment (80.9%), and Computers, Engineering & Science (59.9%), while the most female-oriented occupations are Legal Services & Support (82.1%), Health Diagnosing & Treating (74.2%), and Health Technologists (71.7%).
| Occupation | Male | Female |
| Management | 423 (52.3%) | 385 (47.6%) |
| Business & Financial | 232 (34.4%) | 443 (65.6%) |
| Computers, Engineering & Science | 188 (59.9%) | 126 (40.1%) |
| Computers & Mathematics | 86 (44.3%) | 108 (55.7%) |
| Architecture & Engineering | 87 (100.0%) | 0 (0.0%) |
| Life, Physical & Social Science | 15 (45.5%) | 18 (54.5%) |
| Community & Social Service | 444 (39.8%) | 672 (60.2%) |
| Education, Arts & Media | 54 (31.6%) | 117 (68.4%) |
| Legal Services & Support | 31 (17.9%) | 142 (82.1%) |
| Education Instruction & Library | 185 (33.2%) | 372 (66.8%) |
| Arts, Media & Entertainment | 174 (80.9%) | 41 (19.1%) |
| Health Diagnosing & Treating | 82 (25.8%) | 236 (74.2%) |
| Health Technologists | 51 (28.3%) | 129 (71.7%) |
| Total (Category) | 1,369 (42.4%) | 1,862 (57.6%) |
| Total (Overall) | 5,860 (51.3%) | 5,571 (48.7%) |
Services Occupations
The most common Services occupations in East Ridge are Food Preparation & Serving (1,060 | 9.3%), Cleaning & Maintenance (470 | 4.1%), Personal Care & Service (401 | 3.5%), Healthcare Support (316 | 2.8%), and Security & Protection (199 | 1.7%).
Services Occupations by Sex
Within the Services occupations in East Ridge, the most male-oriented occupations are Law Enforcement (100.0%), Security & Protection (97.5%), and Firefighting & Prevention (93.8%), while the most female-oriented occupations are Personal Care & Service (74.3%), Healthcare Support (69.3%), and Food Preparation & Serving (56.1%).
| Occupation | Male | Female |
| Healthcare Support | 97 (30.7%) | 219 (69.3%) |
| Security & Protection | 194 (97.5%) | 5 (2.5%) |
| Firefighting & Prevention | 76 (93.8%) | 5 (6.2%) |
| Law Enforcement | 118 (100.0%) | 0 (0.0%) |
| Food Preparation & Serving | 465 (43.9%) | 595 (56.1%) |
| Cleaning & Maintenance | 260 (55.3%) | 210 (44.7%) |
| Personal Care & Service | 103 (25.7%) | 298 (74.3%) |
| Total (Category) | 1,119 (45.8%) | 1,327 (54.2%) |
| Total (Overall) | 5,860 (51.3%) | 5,571 (48.7%) |
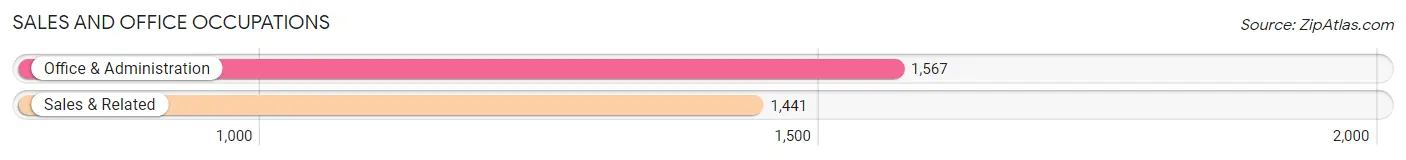
Sales and Office Occupations
The most common Sales and Office occupations in East Ridge are Office & Administration (1,567 | 13.7%), and Sales & Related (1,441 | 12.6%).
Sales and Office Occupations by Sex
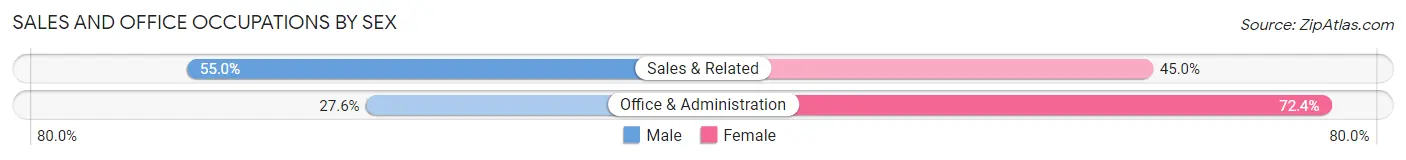
| Occupation | Male | Female |
| Sales & Related | 793 (55.0%) | 648 (45.0%) |
| Office & Administration | 432 (27.6%) | 1,135 (72.4%) |
| Total (Category) | 1,225 (40.7%) | 1,783 (59.3%) |
| Total (Overall) | 5,860 (51.3%) | 5,571 (48.7%) |
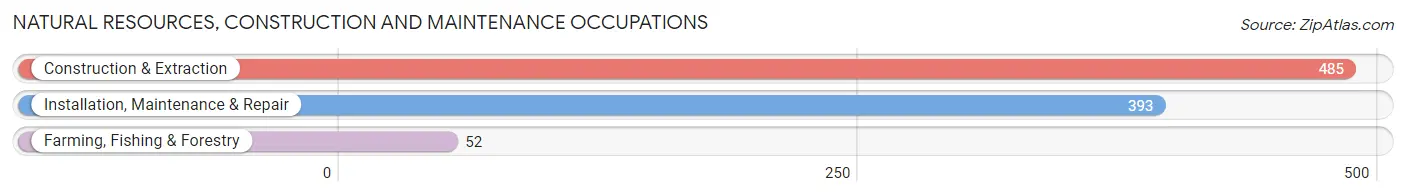
Natural Resources, Construction and Maintenance Occupations
The most common Natural Resources, Construction and Maintenance occupations in East Ridge are Construction & Extraction (485 | 4.2%), Installation, Maintenance & Repair (393 | 3.4%), and Farming, Fishing & Forestry (52 | 0.4%).
Natural Resources, Construction and Maintenance Occupations by Sex
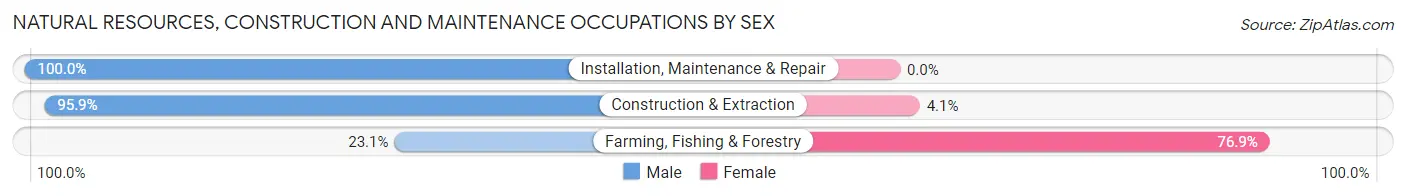
| Occupation | Male | Female |
| Farming, Fishing & Forestry | 12 (23.1%) | 40 (76.9%) |
| Construction & Extraction | 465 (95.9%) | 20 (4.1%) |
| Installation, Maintenance & Repair | 393 (100.0%) | 0 (0.0%) |
| Total (Category) | 870 (93.5%) | 60 (6.5%) |
| Total (Overall) | 5,860 (51.3%) | 5,571 (48.7%) |
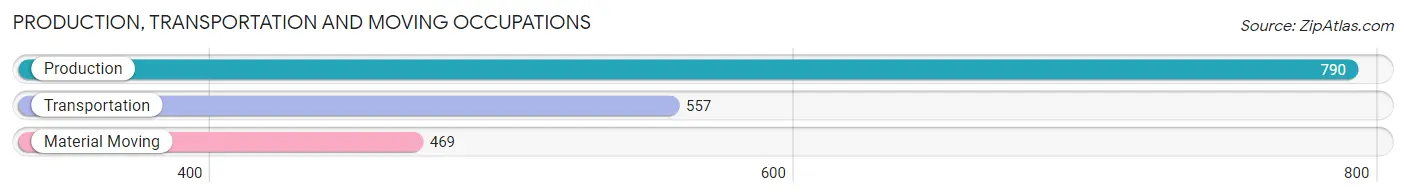
Production, Transportation and Moving Occupations
The most common Production, Transportation and Moving occupations in East Ridge are Production (790 | 6.9%), Transportation (557 | 4.9%), and Material Moving (469 | 4.1%).
Production, Transportation and Moving Occupations by Sex
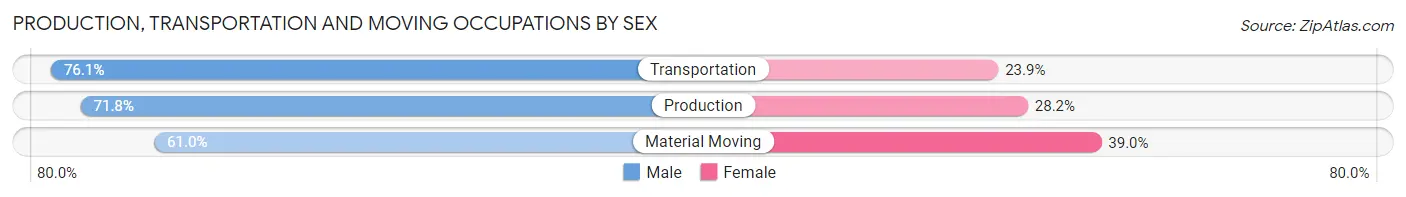
| Occupation | Male | Female |
| Production | 567 (71.8%) | 223 (28.2%) |
| Transportation | 424 (76.1%) | 133 (23.9%) |
| Material Moving | 286 (61.0%) | 183 (39.0%) |
| Total (Category) | 1,277 (70.3%) | 539 (29.7%) |
| Total (Overall) | 5,860 (51.3%) | 5,571 (48.7%) |
Employment Industries by Sex in East Ridge
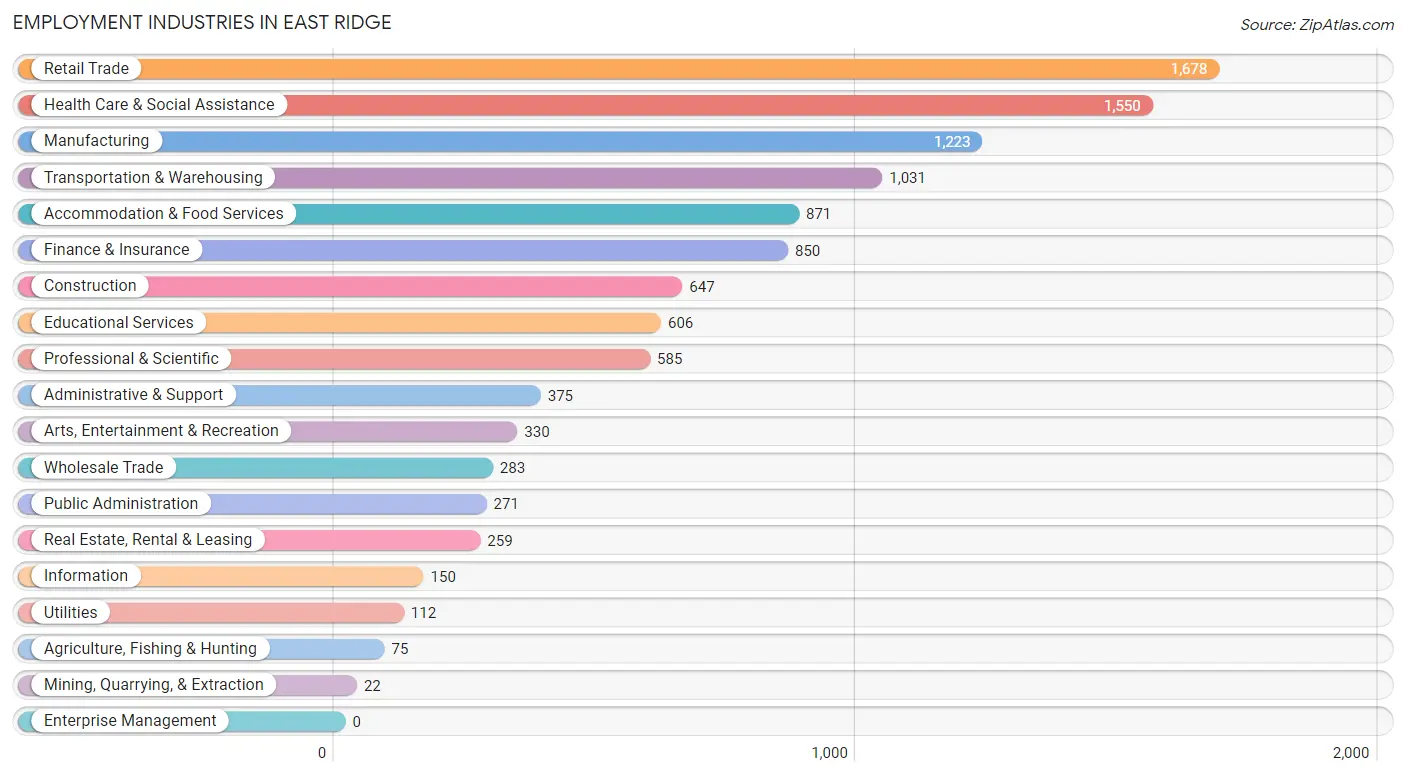
Employment Industries in East Ridge
The major employment industries in East Ridge include Retail Trade (1,678 | 14.7%), Health Care & Social Assistance (1,550 | 13.6%), Manufacturing (1,223 | 10.7%), Transportation & Warehousing (1,031 | 9.0%), and Accommodation & Food Services (871 | 7.6%).
Employment Industries by Sex in East Ridge
The East Ridge industries that see more men than women are Mining, Quarrying, & Extraction (100.0%), Construction (94.0%), and Manufacturing (73.8%), whereas the industries that tend to have a higher number of women are Agriculture, Fishing & Hunting (84.0%), Health Care & Social Assistance (75.1%), and Wholesale Trade (74.2%).
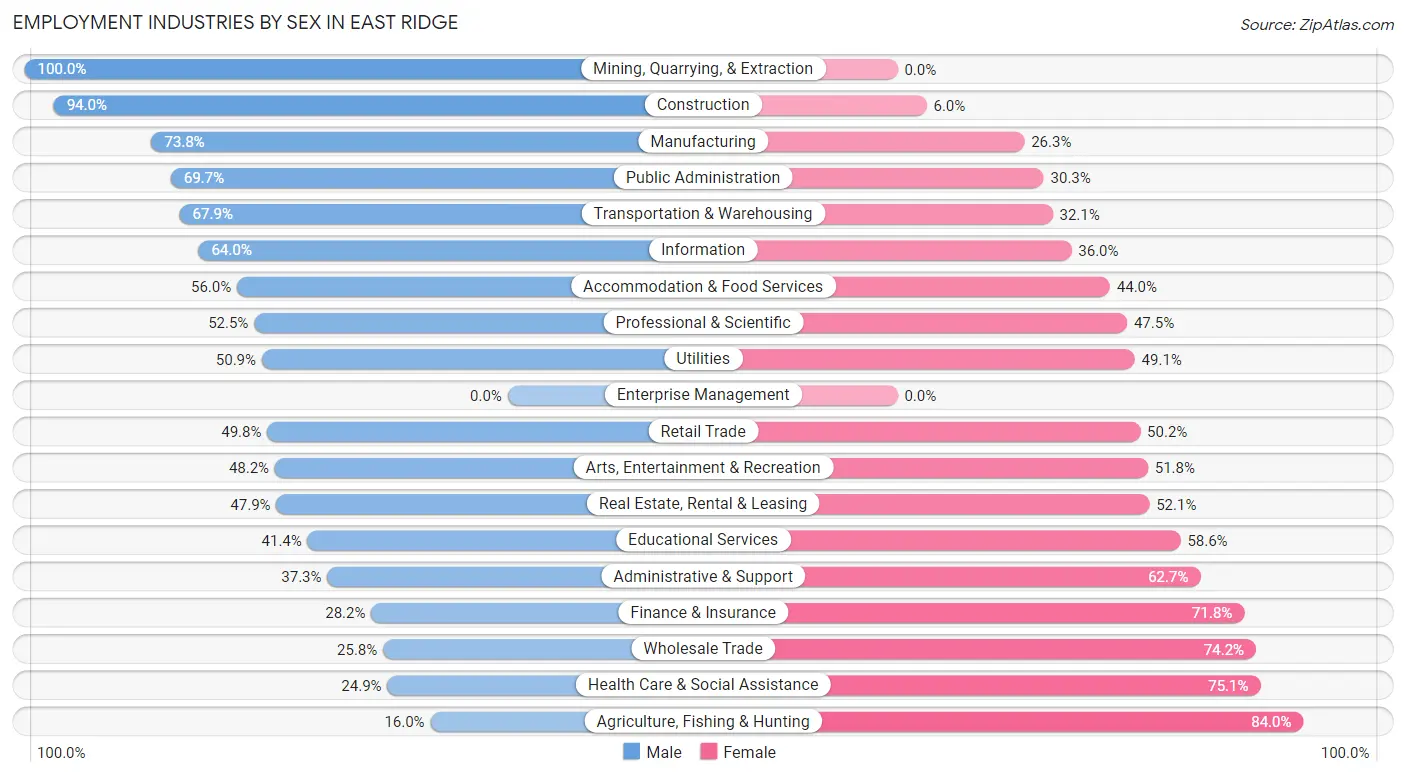
| Industry | Male | Female |
| Agriculture, Fishing & Hunting | 12 (16.0%) | 63 (84.0%) |
| Mining, Quarrying, & Extraction | 22 (100.0%) | 0 (0.0%) |
| Construction | 608 (94.0%) | 39 (6.0%) |
| Manufacturing | 902 (73.8%) | 321 (26.3%) |
| Wholesale Trade | 73 (25.8%) | 210 (74.2%) |
| Retail Trade | 835 (49.8%) | 843 (50.2%) |
| Transportation & Warehousing | 700 (67.9%) | 331 (32.1%) |
| Utilities | 57 (50.9%) | 55 (49.1%) |
| Information | 96 (64.0%) | 54 (36.0%) |
| Finance & Insurance | 240 (28.2%) | 610 (71.8%) |
| Real Estate, Rental & Leasing | 124 (47.9%) | 135 (52.1%) |
| Professional & Scientific | 307 (52.5%) | 278 (47.5%) |
| Enterprise Management | 0 (0.0%) | 0 (0.0%) |
| Administrative & Support | 140 (37.3%) | 235 (62.7%) |
| Educational Services | 251 (41.4%) | 355 (58.6%) |
| Health Care & Social Assistance | 386 (24.9%) | 1,164 (75.1%) |
| Arts, Entertainment & Recreation | 159 (48.2%) | 171 (51.8%) |
| Accommodation & Food Services | 488 (56.0%) | 383 (44.0%) |
| Public Administration | 189 (69.7%) | 82 (30.3%) |
| Total | 5,860 (51.3%) | 5,571 (48.7%) |
Education in East Ridge
School Enrollment in East Ridge
The most common levels of schooling among the 4,174 students in East Ridge are elementary school (1,066 | 25.5%), high school (1,053 | 25.2%), and college / undergraduate (803 | 19.2%).
| School Level | # Students | % Students |
| Nursery / Preschool | 178 | 4.3% |
| Kindergarten | 266 | 6.4% |
| Elementary School | 1,066 | 25.5% |
| Middle School | 640 | 15.3% |
| High School | 1,053 | 25.2% |
| College / Undergraduate | 803 | 19.2% |
| Graduate / Professional | 168 | 4.0% |
| Total | 4,174 | 100.0% |
School Enrollment by Age by Funding Source in East Ridge
Out of a total of 4,174 students who are enrolled in schools in East Ridge, 818 (19.6%) attend a private institution, while the remaining 3,356 (80.4%) are enrolled in public schools. The age group of 3 to 4 year olds has the highest likelihood of being enrolled in private schools, with 123 (63.1% in the age bracket) enrolled. Conversely, the age group of 18 to 19 year olds has the lowest likelihood of being enrolled in a private school, with 343 (100.0% in the age bracket) attending a public institution.
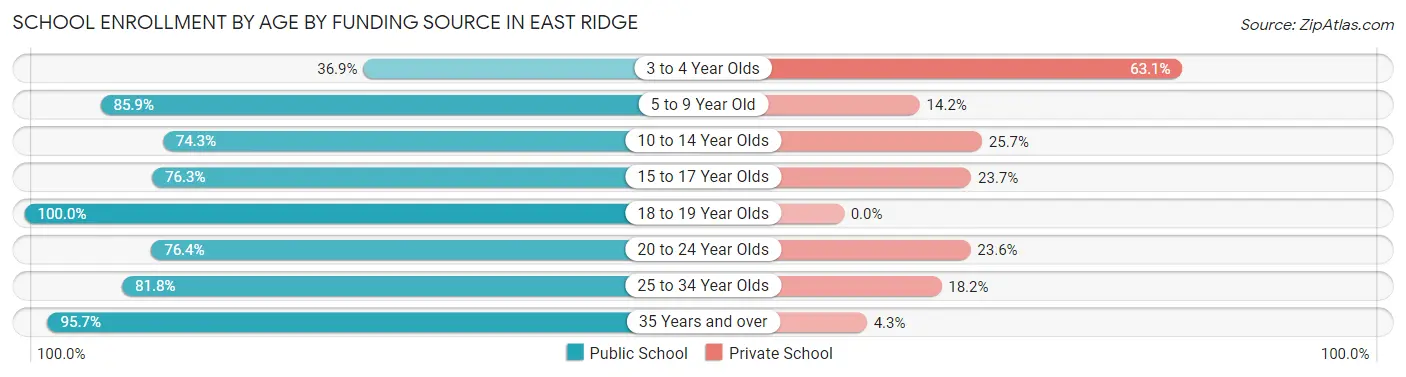
| Age Bracket | Public School | Private School |
| 3 to 4 Year Olds | 72 (36.9%) | 123 (63.1%) |
| 5 to 9 Year Old | 1,056 (85.9%) | 174 (14.1%) |
| 10 to 14 Year Olds | 603 (74.3%) | 209 (25.7%) |
| 15 to 17 Year Olds | 575 (76.3%) | 179 (23.7%) |
| 18 to 19 Year Olds | 343 (100.0%) | 0 (0.0%) |
| 20 to 24 Year Olds | 178 (76.4%) | 55 (23.6%) |
| 25 to 34 Year Olds | 306 (81.8%) | 68 (18.2%) |
| 35 Years and over | 223 (95.7%) | 10 (4.3%) |
| Total | 3,356 (80.4%) | 818 (19.6%) |
Educational Attainment by Field of Study in East Ridge
Business (896 | 23.8%), education (392 | 10.4%), liberal arts & history (355 | 9.4%), arts & humanities (324 | 8.6%), and science & technology (316 | 8.4%) are the most common fields of study among 3,763 individuals in East Ridge who have obtained a bachelor's degree or higher.
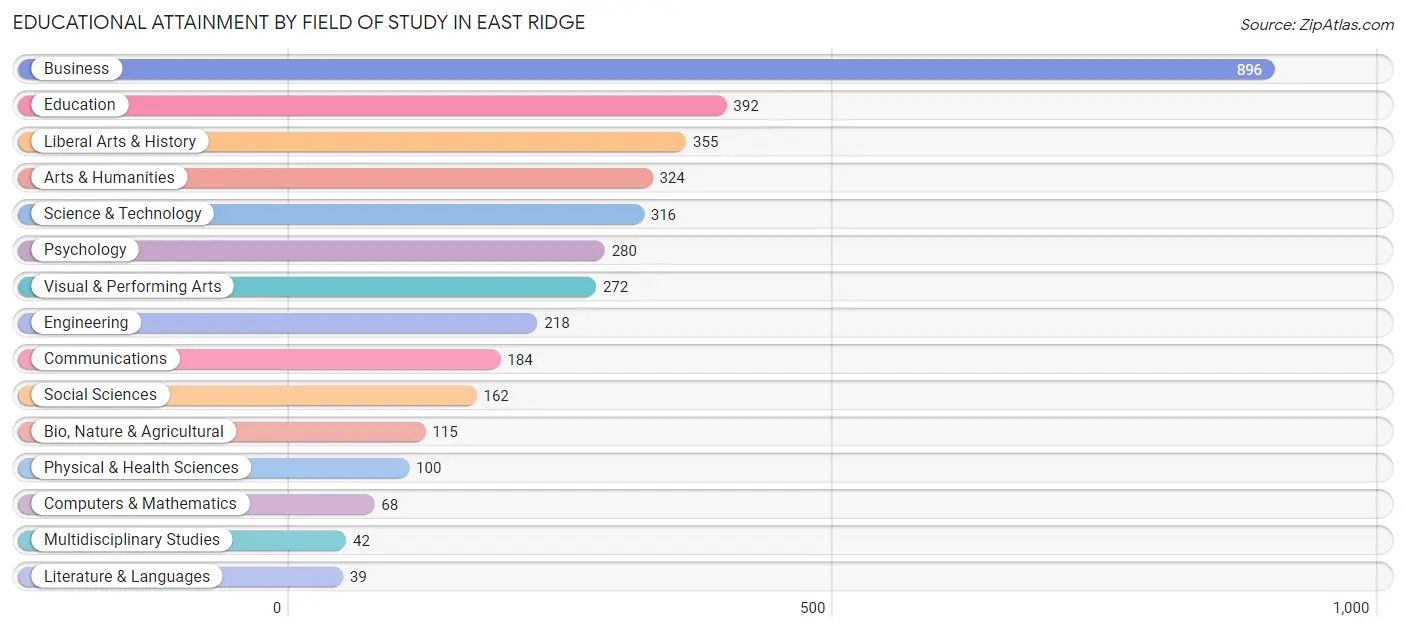
| Field of Study | # Graduates | % Graduates |
| Computers & Mathematics | 68 | 1.8% |
| Bio, Nature & Agricultural | 115 | 3.1% |
| Physical & Health Sciences | 100 | 2.7% |
| Psychology | 280 | 7.4% |
| Social Sciences | 162 | 4.3% |
| Engineering | 218 | 5.8% |
| Multidisciplinary Studies | 42 | 1.1% |
| Science & Technology | 316 | 8.4% |
| Business | 896 | 23.8% |
| Education | 392 | 10.4% |
| Literature & Languages | 39 | 1.0% |
| Liberal Arts & History | 355 | 9.4% |
| Visual & Performing Arts | 272 | 7.2% |
| Communications | 184 | 4.9% |
| Arts & Humanities | 324 | 8.6% |
| Total | 3,763 | 100.0% |
Transportation & Commute in East Ridge
Vehicle Availability by Sex in East Ridge
The most prevalent vehicle ownership categories in East Ridge are males with 2 vehicles (2,497, accounting for 44.0%) and females with 2 vehicles (2,228, making up 45.8%).
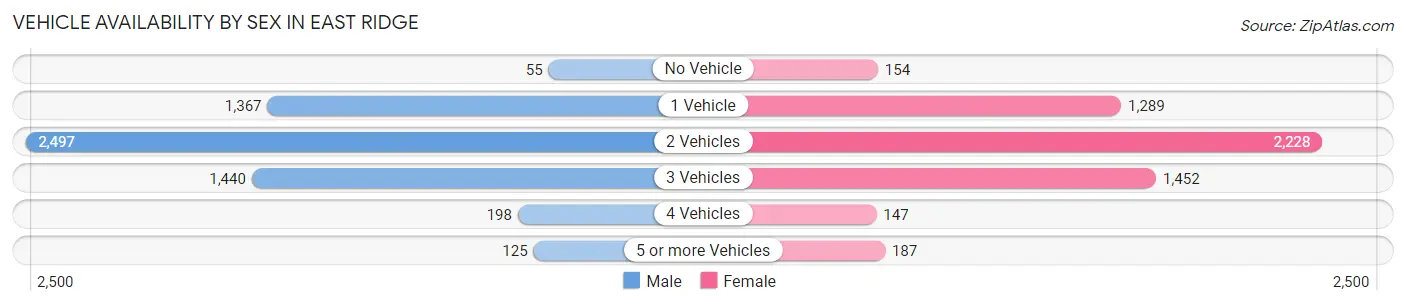
| Vehicles Available | Male | Female |
| No Vehicle | 55 (1.0%) | 154 (2.8%) |
| 1 Vehicle | 1,367 (24.1%) | 1,289 (23.6%) |
| 2 Vehicles | 2,497 (44.0%) | 2,228 (40.8%) |
| 3 Vehicles | 1,440 (25.3%) | 1,452 (26.6%) |
| 4 Vehicles | 198 (3.5%) | 147 (2.7%) |
| 5 or more Vehicles | 125 (2.2%) | 187 (3.4%) |
| Total | 5,682 (100.0%) | 5,457 (100.0%) |
Commute Time in East Ridge
The most frequently occuring commute durations in East Ridge are 15 to 19 minutes (2,891 commuters, 29.5%), 20 to 24 minutes (2,271 commuters, 23.2%), and 10 to 14 minutes (1,599 commuters, 16.3%).
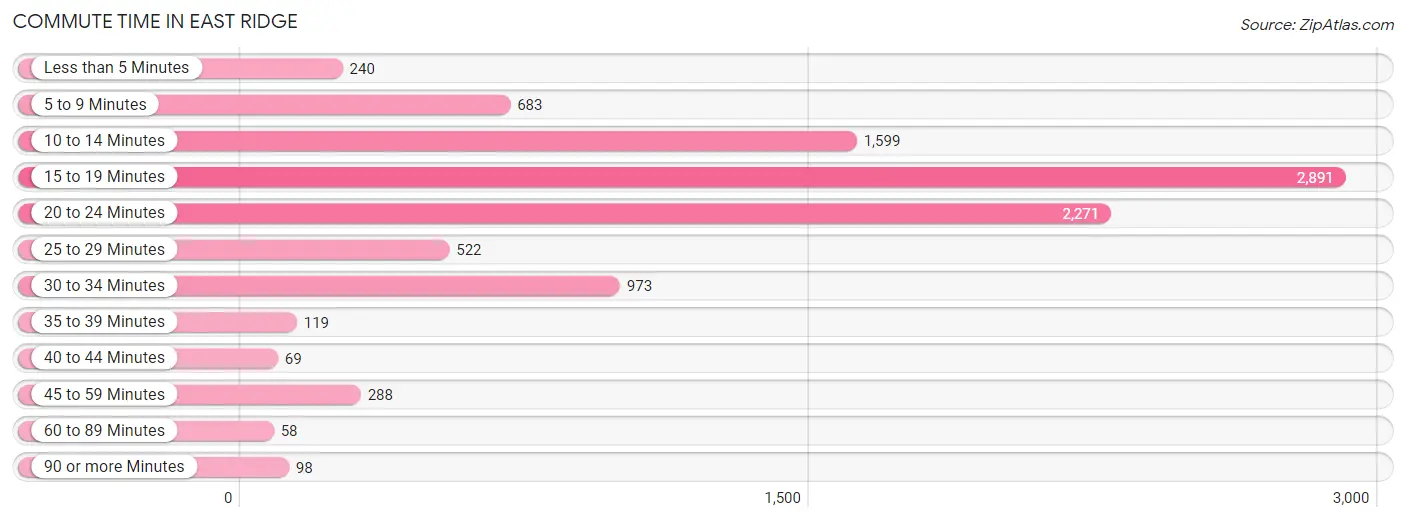
| Commute Time | # Commuters | % Commuters |
| Less than 5 Minutes | 240 | 2.5% |
| 5 to 9 Minutes | 683 | 7.0% |
| 10 to 14 Minutes | 1,599 | 16.3% |
| 15 to 19 Minutes | 2,891 | 29.5% |
| 20 to 24 Minutes | 2,271 | 23.2% |
| 25 to 29 Minutes | 522 | 5.3% |
| 30 to 34 Minutes | 973 | 9.9% |
| 35 to 39 Minutes | 119 | 1.2% |
| 40 to 44 Minutes | 69 | 0.7% |
| 45 to 59 Minutes | 288 | 2.9% |
| 60 to 89 Minutes | 58 | 0.6% |
| 90 or more Minutes | 98 | 1.0% |
Commute Time by Sex in East Ridge
The most common commute times in East Ridge are 15 to 19 minutes (1,460 commuters, 28.7%) for males and 15 to 19 minutes (1,431 commuters, 30.3%) for females.
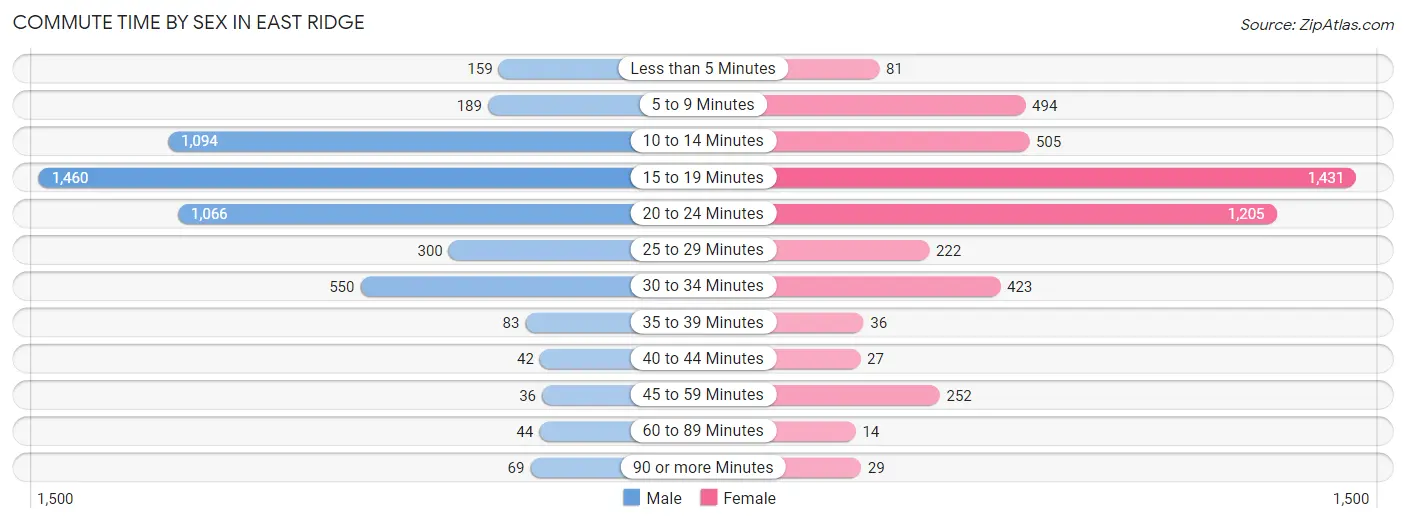
| Commute Time | Male | Female |
| Less than 5 Minutes | 159 (3.1%) | 81 (1.7%) |
| 5 to 9 Minutes | 189 (3.7%) | 494 (10.5%) |
| 10 to 14 Minutes | 1,094 (21.5%) | 505 (10.7%) |
| 15 to 19 Minutes | 1,460 (28.7%) | 1,431 (30.3%) |
| 20 to 24 Minutes | 1,066 (20.9%) | 1,205 (25.5%) |
| 25 to 29 Minutes | 300 (5.9%) | 222 (4.7%) |
| 30 to 34 Minutes | 550 (10.8%) | 423 (9.0%) |
| 35 to 39 Minutes | 83 (1.6%) | 36 (0.8%) |
| 40 to 44 Minutes | 42 (0.8%) | 27 (0.6%) |
| 45 to 59 Minutes | 36 (0.7%) | 252 (5.3%) |
| 60 to 89 Minutes | 44 (0.9%) | 14 (0.3%) |
| 90 or more Minutes | 69 (1.4%) | 29 (0.6%) |
Time of Departure to Work by Sex in East Ridge
The most frequent times of departure to work in East Ridge are 7:00 AM to 7:29 AM (801, 15.7%) for males and 8:00 AM to 8:29 AM (907, 19.2%) for females.
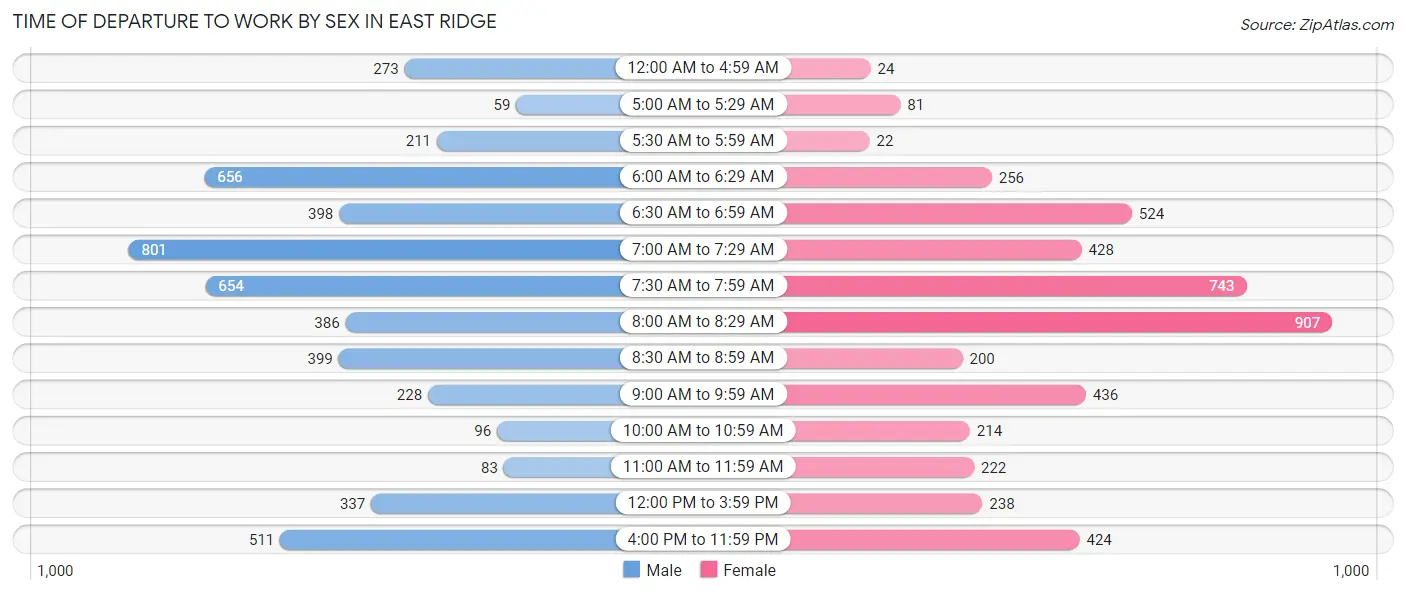
| Time of Departure | Male | Female |
| 12:00 AM to 4:59 AM | 273 (5.4%) | 24 (0.5%) |
| 5:00 AM to 5:29 AM | 59 (1.2%) | 81 (1.7%) |
| 5:30 AM to 5:59 AM | 211 (4.1%) | 22 (0.5%) |
| 6:00 AM to 6:29 AM | 656 (12.9%) | 256 (5.4%) |
| 6:30 AM to 6:59 AM | 398 (7.8%) | 524 (11.1%) |
| 7:00 AM to 7:29 AM | 801 (15.7%) | 428 (9.1%) |
| 7:30 AM to 7:59 AM | 654 (12.8%) | 743 (15.7%) |
| 8:00 AM to 8:29 AM | 386 (7.6%) | 907 (19.2%) |
| 8:30 AM to 8:59 AM | 399 (7.8%) | 200 (4.2%) |
| 9:00 AM to 9:59 AM | 228 (4.5%) | 436 (9.2%) |
| 10:00 AM to 10:59 AM | 96 (1.9%) | 214 (4.5%) |
| 11:00 AM to 11:59 AM | 83 (1.6%) | 222 (4.7%) |
| 12:00 PM to 3:59 PM | 337 (6.6%) | 238 (5.0%) |
| 4:00 PM to 11:59 PM | 511 (10.0%) | 424 (9.0%) |
| Total | 5,092 (100.0%) | 4,719 (100.0%) |
Housing Occupancy in East Ridge
Occupancy by Ownership in East Ridge
Of the total 9,558 dwellings in East Ridge, owner-occupied units account for 5,777 (60.4%), while renter-occupied units make up 3,781 (39.6%).
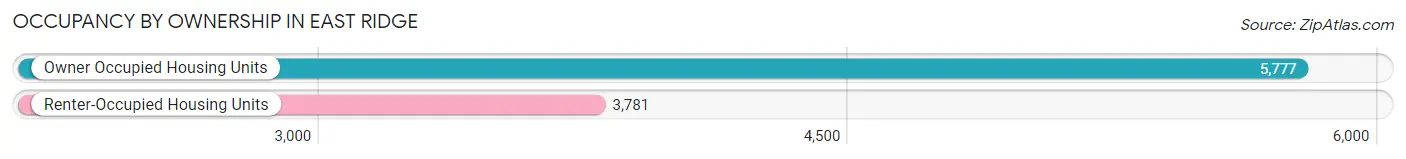
| Occupancy | # Housing Units | % Housing Units |
| Owner Occupied Housing Units | 5,777 | 60.4% |
| Renter-Occupied Housing Units | 3,781 | 39.6% |
| Total Occupied Housing Units | 9,558 | 100.0% |
Occupancy by Household Size in East Ridge
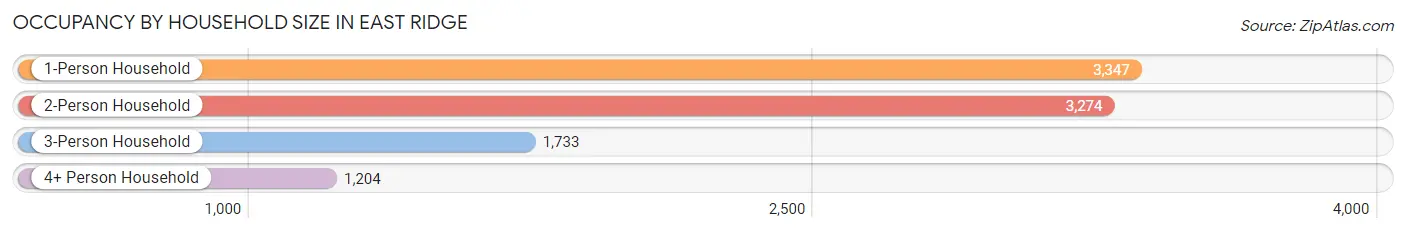
| Household Size | # Housing Units | % Housing Units |
| 1-Person Household | 3,347 | 35.0% |
| 2-Person Household | 3,274 | 34.3% |
| 3-Person Household | 1,733 | 18.1% |
| 4+ Person Household | 1,204 | 12.6% |
| Total Housing Units | 9,558 | 100.0% |
Occupancy by Ownership by Household Size in East Ridge
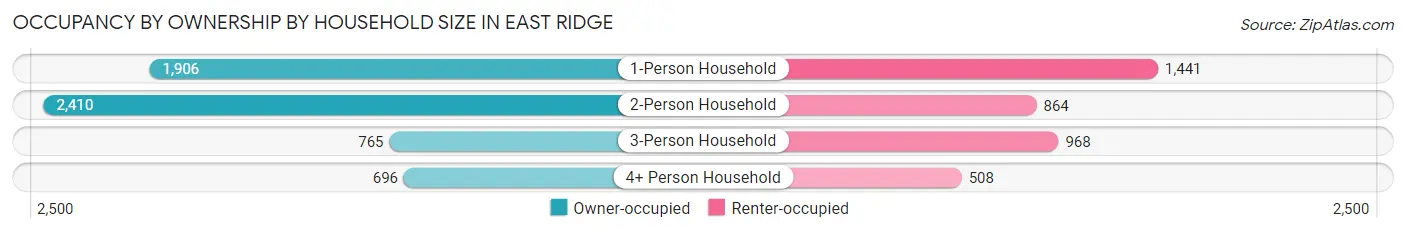
| Household Size | Owner-occupied | Renter-occupied |
| 1-Person Household | 1,906 (57.0%) | 1,441 (43.0%) |
| 2-Person Household | 2,410 (73.6%) | 864 (26.4%) |
| 3-Person Household | 765 (44.1%) | 968 (55.9%) |
| 4+ Person Household | 696 (57.8%) | 508 (42.2%) |
| Total Housing Units | 5,777 (60.4%) | 3,781 (39.6%) |
Occupancy by Educational Attainment in East Ridge
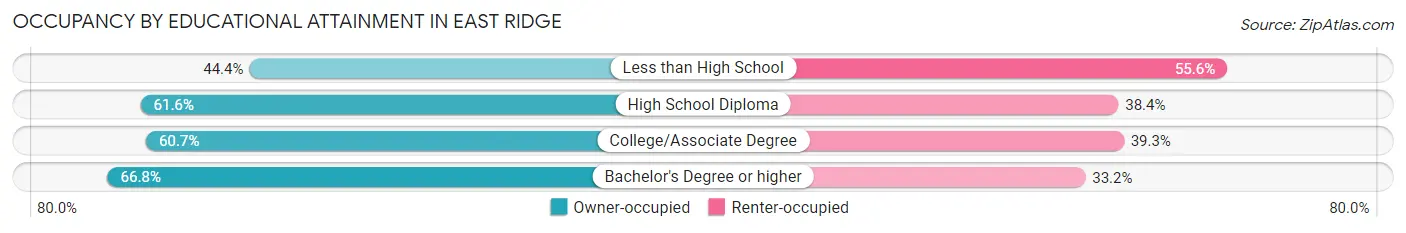
| Household Size | Owner-occupied | Renter-occupied |
| Less than High School | 496 (44.4%) | 622 (55.6%) |
| High School Diploma | 1,376 (61.6%) | 858 (38.4%) |
| College/Associate Degree | 2,418 (60.7%) | 1,563 (39.3%) |
| Bachelor's Degree or higher | 1,487 (66.8%) | 738 (33.2%) |
Occupancy by Age of Householder in East Ridge
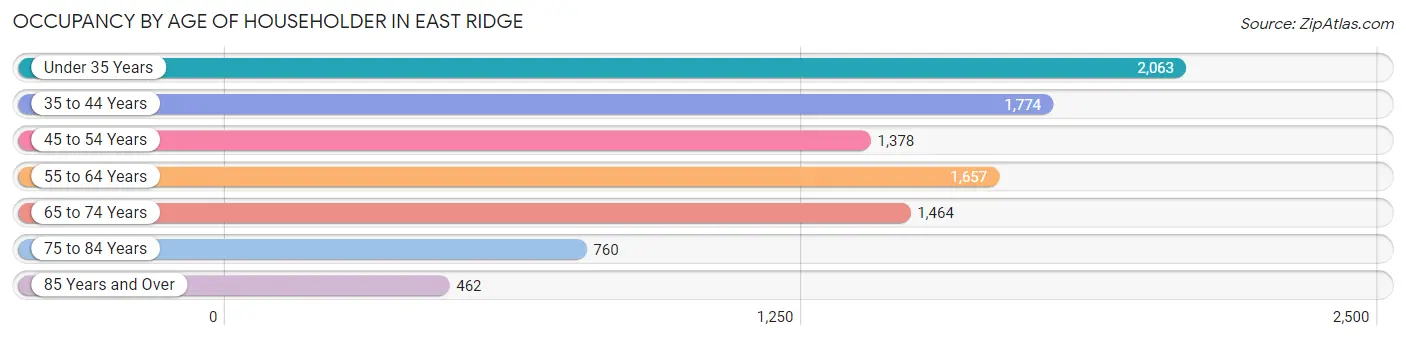
| Age Bracket | # Households | % Households |
| Under 35 Years | 2,063 | 21.6% |
| 35 to 44 Years | 1,774 | 18.6% |
| 45 to 54 Years | 1,378 | 14.4% |
| 55 to 64 Years | 1,657 | 17.3% |
| 65 to 74 Years | 1,464 | 15.3% |
| 75 to 84 Years | 760 | 8.0% |
| 85 Years and Over | 462 | 4.8% |
| Total | 9,558 | 100.0% |
Housing Finances in East Ridge
Median Income by Occupancy in East Ridge
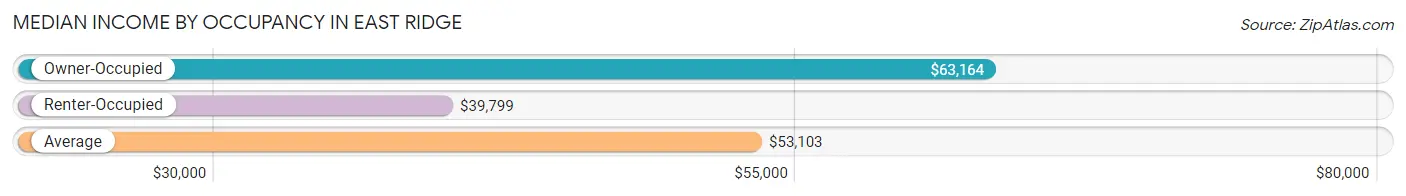
| Occupancy Type | # Households | Median Income |
| Owner-Occupied | 5,777 (60.4%) | $63,164 |
| Renter-Occupied | 3,781 (39.6%) | $39,799 |
| Average | 9,558 (100.0%) | $53,103 |
Occupancy by Householder Income Bracket in East Ridge
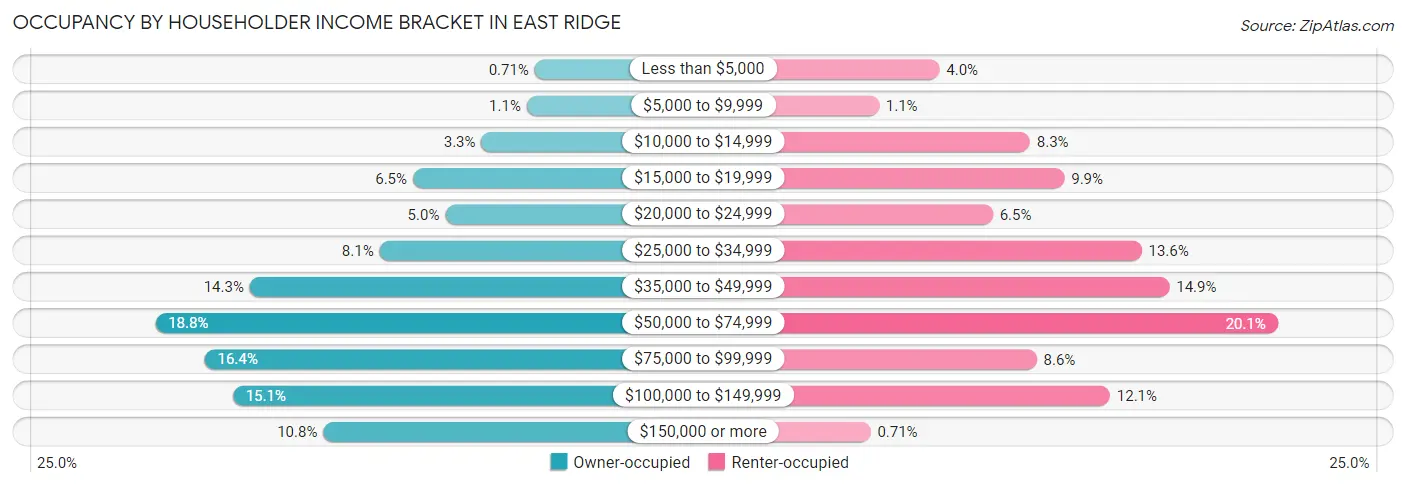
| Income Bracket | Owner-occupied | Renter-occupied |
| Less than $5,000 | 41 (0.7%) | 151 (4.0%) |
| $5,000 to $9,999 | 63 (1.1%) | 42 (1.1%) |
| $10,000 to $14,999 | 188 (3.3%) | 314 (8.3%) |
| $15,000 to $19,999 | 376 (6.5%) | 376 (9.9%) |
| $20,000 to $24,999 | 287 (5.0%) | 247 (6.5%) |
| $25,000 to $34,999 | 468 (8.1%) | 515 (13.6%) |
| $35,000 to $49,999 | 825 (14.3%) | 565 (14.9%) |
| $50,000 to $74,999 | 1,085 (18.8%) | 760 (20.1%) |
| $75,000 to $99,999 | 949 (16.4%) | 326 (8.6%) |
| $100,000 to $149,999 | 872 (15.1%) | 458 (12.1%) |
| $150,000 or more | 623 (10.8%) | 27 (0.7%) |
| Total | 5,777 (100.0%) | 3,781 (100.0%) |
Monthly Housing Cost Tiers in East Ridge
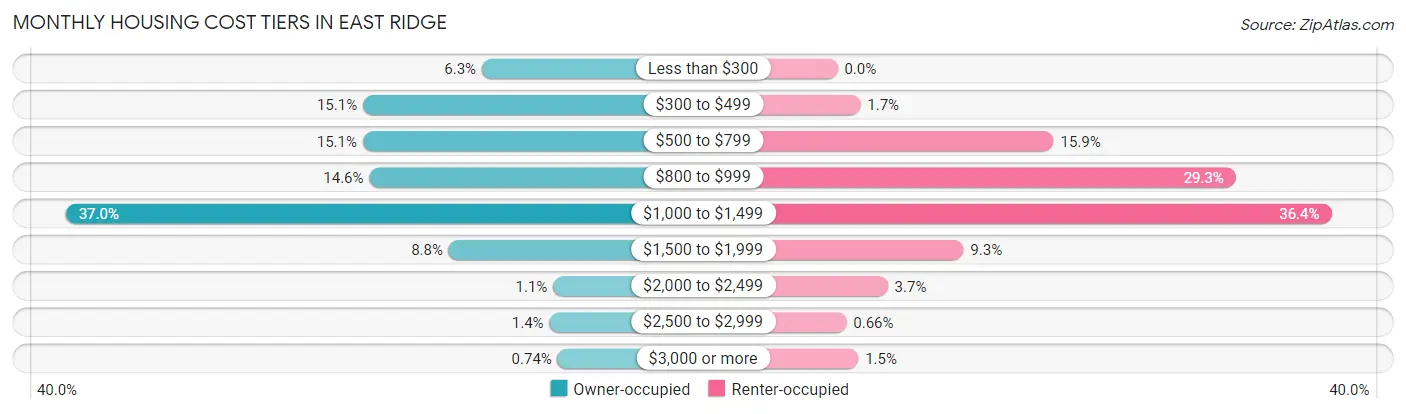
| Monthly Cost | Owner-occupied | Renter-occupied |
| Less than $300 | 365 (6.3%) | 0 (0.0%) |
| $300 to $499 | 871 (15.1%) | 64 (1.7%) |
| $500 to $799 | 872 (15.1%) | 602 (15.9%) |
| $800 to $999 | 844 (14.6%) | 1,109 (29.3%) |
| $1,000 to $1,499 | 2,136 (37.0%) | 1,375 (36.4%) |
| $1,500 to $1,999 | 506 (8.8%) | 351 (9.3%) |
| $2,000 to $2,499 | 62 (1.1%) | 140 (3.7%) |
| $2,500 to $2,999 | 78 (1.3%) | 25 (0.7%) |
| $3,000 or more | 43 (0.7%) | 58 (1.5%) |
| Total | 5,777 (100.0%) | 3,781 (100.0%) |
Physical Housing Characteristics in East Ridge
Housing Structures in East Ridge
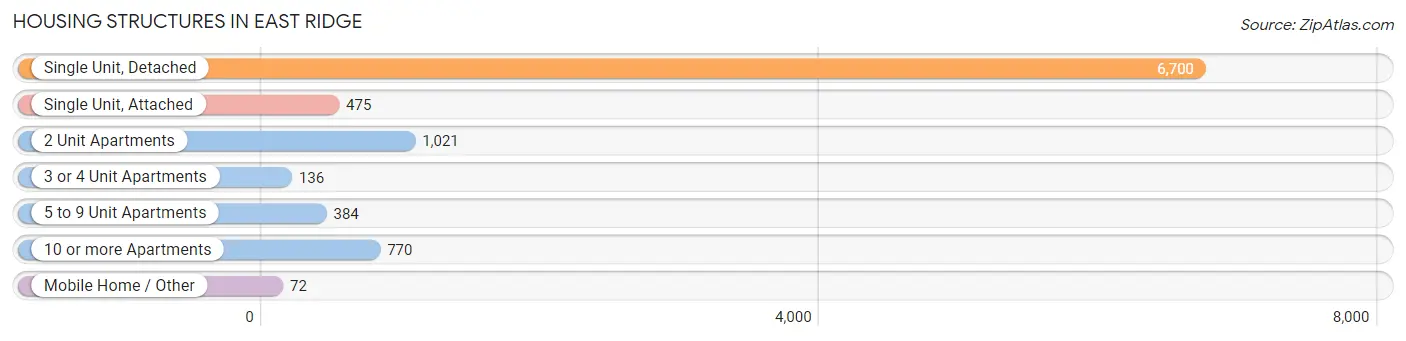
| Structure Type | # Housing Units | % Housing Units |
| Single Unit, Detached | 6,700 | 70.1% |
| Single Unit, Attached | 475 | 5.0% |
| 2 Unit Apartments | 1,021 | 10.7% |
| 3 or 4 Unit Apartments | 136 | 1.4% |
| 5 to 9 Unit Apartments | 384 | 4.0% |
| 10 or more Apartments | 770 | 8.1% |
| Mobile Home / Other | 72 | 0.7% |
| Total | 9,558 | 100.0% |
Housing Structures by Occupancy in East Ridge
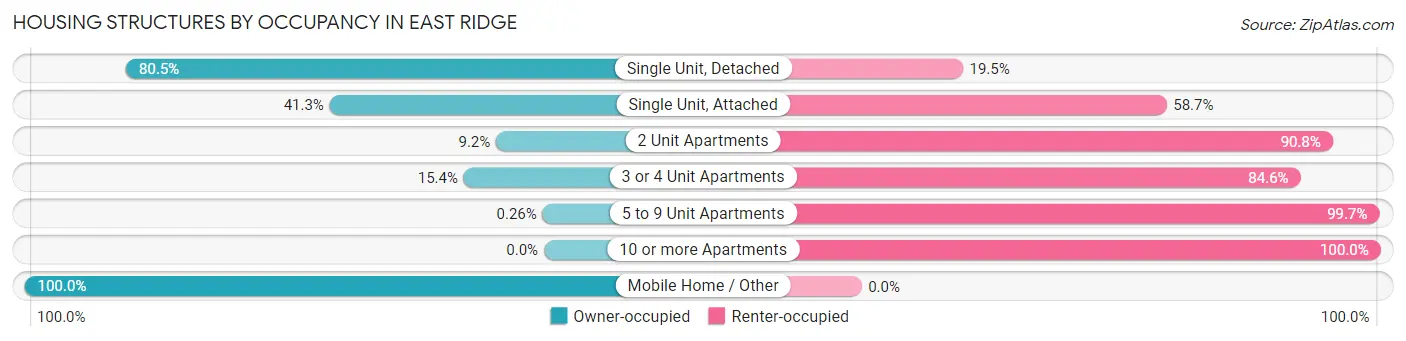
| Structure Type | Owner-occupied | Renter-occupied |
| Single Unit, Detached | 5,393 (80.5%) | 1,307 (19.5%) |
| Single Unit, Attached | 196 (41.3%) | 279 (58.7%) |
| 2 Unit Apartments | 94 (9.2%) | 927 (90.8%) |
| 3 or 4 Unit Apartments | 21 (15.4%) | 115 (84.6%) |
| 5 to 9 Unit Apartments | 1 (0.3%) | 383 (99.7%) |
| 10 or more Apartments | 0 (0.0%) | 770 (100.0%) |
| Mobile Home / Other | 72 (100.0%) | 0 (0.0%) |
| Total | 5,777 (60.4%) | 3,781 (39.6%) |
Housing Structures by Number of Rooms in East Ridge
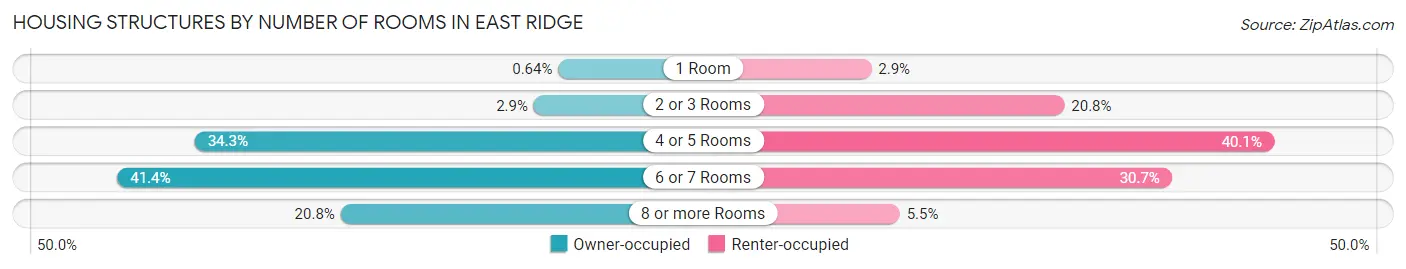
| Number of Rooms | Owner-occupied | Renter-occupied |
| 1 Room | 37 (0.6%) | 110 (2.9%) |
| 2 or 3 Rooms | 168 (2.9%) | 785 (20.8%) |
| 4 or 5 Rooms | 1,979 (34.3%) | 1,517 (40.1%) |
| 6 or 7 Rooms | 2,393 (41.4%) | 1,160 (30.7%) |
| 8 or more Rooms | 1,200 (20.8%) | 209 (5.5%) |
| Total | 5,777 (100.0%) | 3,781 (100.0%) |
Housing Structure by Heating Type in East Ridge
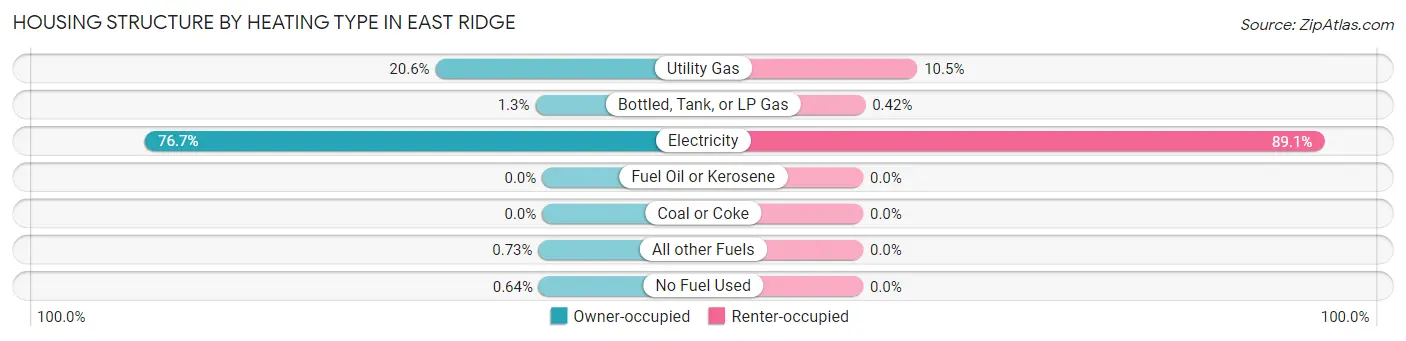
| Heating Type | Owner-occupied | Renter-occupied |
| Utility Gas | 1,191 (20.6%) | 396 (10.5%) |
| Bottled, Tank, or LP Gas | 76 (1.3%) | 16 (0.4%) |
| Electricity | 4,431 (76.7%) | 3,369 (89.1%) |
| Fuel Oil or Kerosene | 0 (0.0%) | 0 (0.0%) |
| Coal or Coke | 0 (0.0%) | 0 (0.0%) |
| All other Fuels | 42 (0.7%) | 0 (0.0%) |
| No Fuel Used | 37 (0.6%) | 0 (0.0%) |
| Total | 5,777 (100.0%) | 3,781 (100.0%) |
Household Vehicle Usage in East Ridge
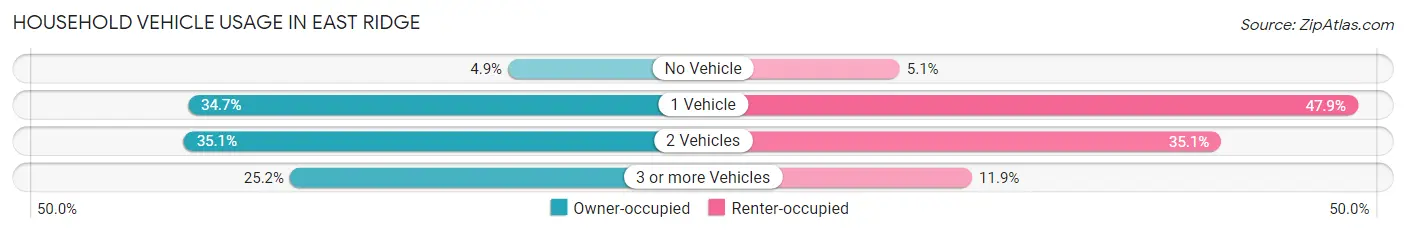
| Vehicles per Household | Owner-occupied | Renter-occupied |
| No Vehicle | 282 (4.9%) | 194 (5.1%) |
| 1 Vehicle | 2,007 (34.7%) | 1,810 (47.9%) |
| 2 Vehicles | 2,030 (35.1%) | 1,328 (35.1%) |
| 3 or more Vehicles | 1,458 (25.2%) | 449 (11.9%) |
| Total | 5,777 (100.0%) | 3,781 (100.0%) |
Real Estate & Mortgages in East Ridge
Real Estate and Mortgage Overview in East Ridge
| Characteristic | Without Mortgage | With Mortgage |
| Housing Units | 1,809 | 3,968 |
| Median Property Value | $184,100 | $157,200 |
| Median Household Income | $39,485 | $512 |
| Monthly Housing Costs | $441 | $43 |
| Real Estate Taxes | $1,613 | $218 |
Property Value by Mortgage Status in East Ridge
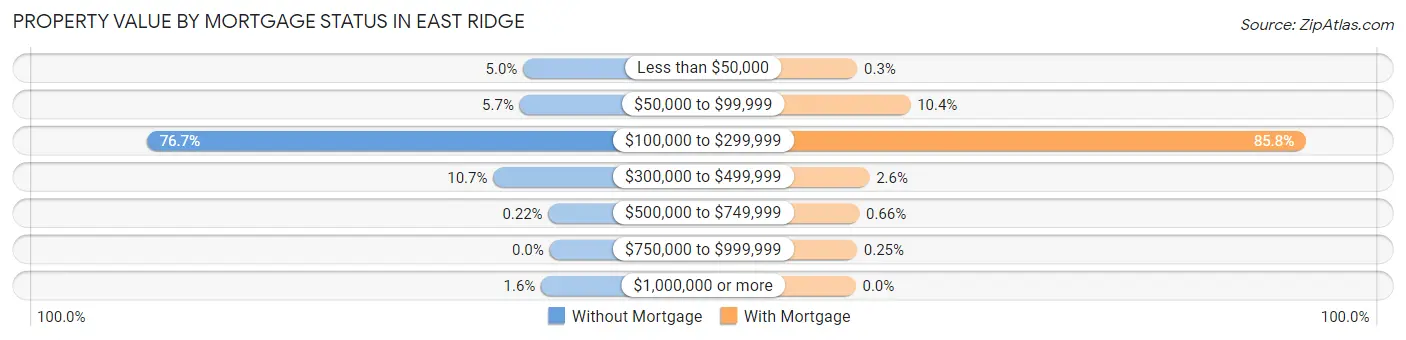
| Property Value | Without Mortgage | With Mortgage |
| Less than $50,000 | 91 (5.0%) | 12 (0.3%) |
| $50,000 to $99,999 | 103 (5.7%) | 413 (10.4%) |
| $100,000 to $299,999 | 1,388 (76.7%) | 3,404 (85.8%) |
| $300,000 to $499,999 | 194 (10.7%) | 103 (2.6%) |
| $500,000 to $749,999 | 4 (0.2%) | 26 (0.7%) |
| $750,000 to $999,999 | 0 (0.0%) | 10 (0.3%) |
| $1,000,000 or more | 29 (1.6%) | 0 (0.0%) |
| Total | 1,809 (100.0%) | 3,968 (100.0%) |
Household Income by Mortgage Status in East Ridge
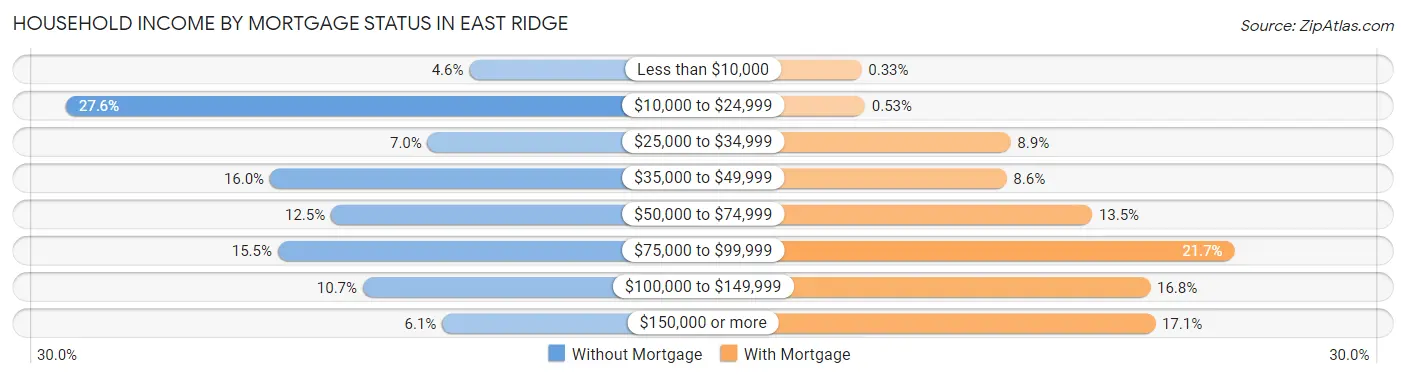
| Household Income | Without Mortgage | With Mortgage |
| Less than $10,000 | 83 (4.6%) | 13 (0.3%) |
| $10,000 to $24,999 | 500 (27.6%) | 21 (0.5%) |
| $25,000 to $34,999 | 126 (7.0%) | 351 (8.8%) |
| $35,000 to $49,999 | 289 (16.0%) | 342 (8.6%) |
| $50,000 to $74,999 | 226 (12.5%) | 536 (13.5%) |
| $75,000 to $99,999 | 281 (15.5%) | 859 (21.6%) |
| $100,000 to $149,999 | 193 (10.7%) | 668 (16.8%) |
| $150,000 or more | 111 (6.1%) | 679 (17.1%) |
| Total | 1,809 (100.0%) | 3,968 (100.0%) |
Property Value to Household Income Ratio in East Ridge
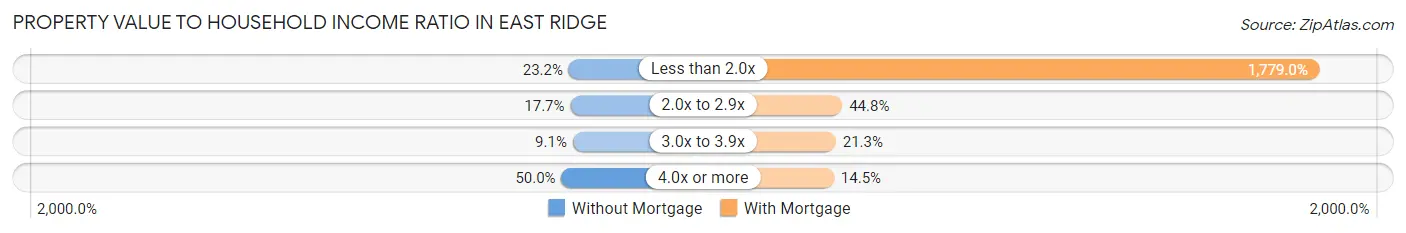
| Value-to-Income Ratio | Without Mortgage | With Mortgage |
| Less than 2.0x | 420 (23.2%) | 70,591 (1,779.0%) |
| 2.0x to 2.9x | 320 (17.7%) | 1,778 (44.8%) |
| 3.0x to 3.9x | 164 (9.1%) | 844 (21.3%) |
| 4.0x or more | 905 (50.0%) | 577 (14.5%) |
| Total | 1,809 (100.0%) | 3,968 (100.0%) |
Real Estate Taxes by Mortgage Status in East Ridge
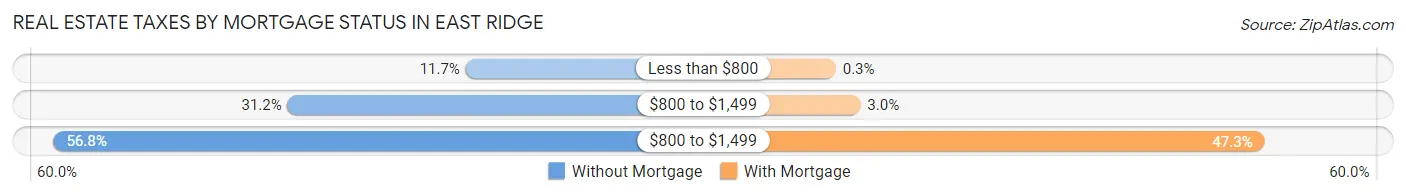
| Property Taxes | Without Mortgage | With Mortgage |
| Less than $800 | 211 (11.7%) | 12 (0.3%) |
| $800 to $1,499 | 564 (31.2%) | 119 (3.0%) |
| $800 to $1,499 | 1,028 (56.8%) | 1,876 (47.3%) |
| Total | 1,809 (100.0%) | 3,968 (100.0%) |
Health & Disability in East Ridge
Health Insurance Coverage by Age in East Ridge
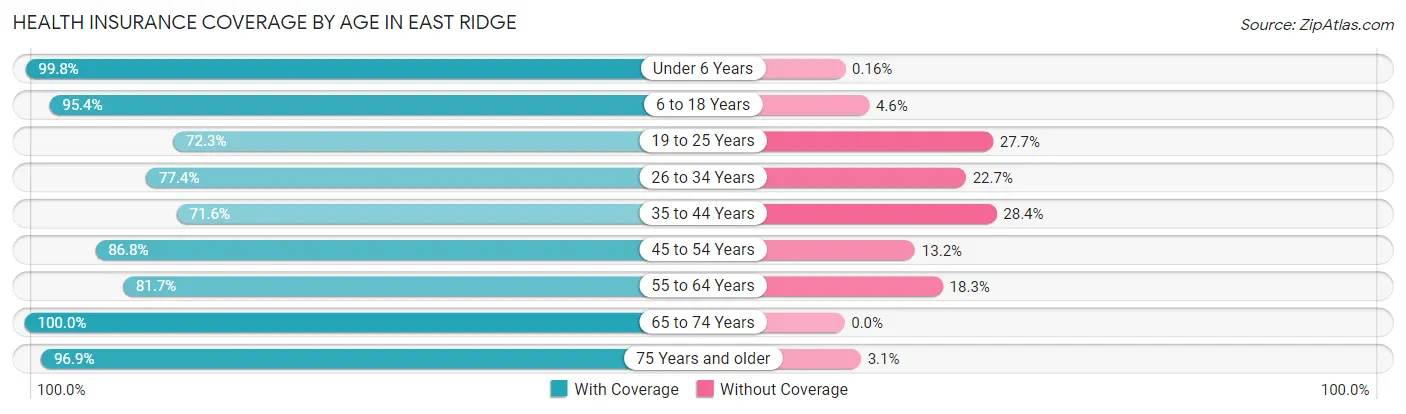
| Age Bracket | With Coverage | Without Coverage |
| Under 6 Years | 1,262 (99.8%) | 2 (0.2%) |
| 6 to 18 Years | 3,145 (95.4%) | 152 (4.6%) |
| 19 to 25 Years | 1,191 (72.3%) | 456 (27.7%) |
| 26 to 34 Years | 2,612 (77.3%) | 765 (22.7%) |
| 35 to 44 Years | 1,877 (71.6%) | 743 (28.4%) |
| 45 to 54 Years | 2,360 (86.8%) | 358 (13.2%) |
| 55 to 64 Years | 2,417 (81.7%) | 543 (18.3%) |
| 65 to 74 Years | 2,227 (100.0%) | 0 (0.0%) |
| 75 Years and older | 1,777 (96.9%) | 56 (3.1%) |
| Total | 18,868 (86.0%) | 3,075 (14.0%) |
Health Insurance Coverage by Citizenship Status in East Ridge
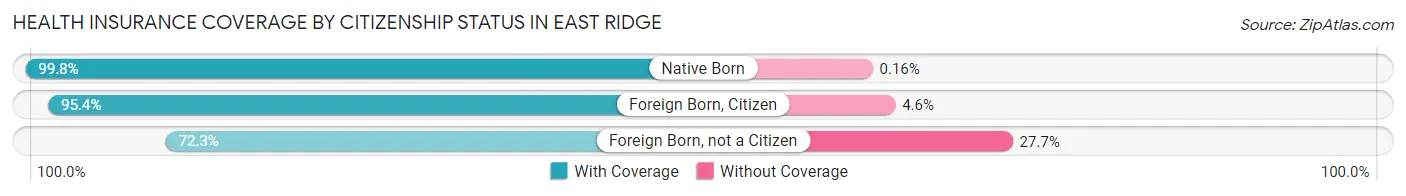
| Citizenship Status | With Coverage | Without Coverage |
| Native Born | 1,262 (99.8%) | 2 (0.2%) |
| Foreign Born, Citizen | 3,145 (95.4%) | 152 (4.6%) |
| Foreign Born, not a Citizen | 1,191 (72.3%) | 456 (27.7%) |
Health Insurance Coverage by Household Income in East Ridge
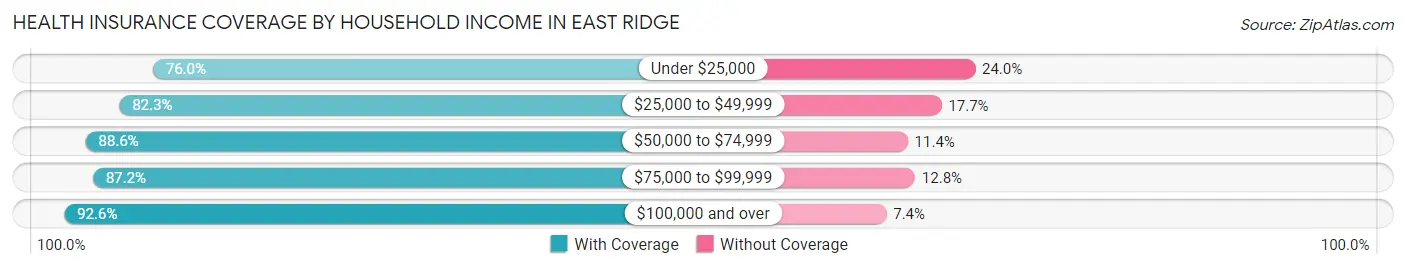
| Household Income | With Coverage | Without Coverage |
| Under $25,000 | 2,804 (76.0%) | 887 (24.0%) |
| $25,000 to $49,999 | 3,588 (82.3%) | 773 (17.7%) |
| $50,000 to $74,999 | 3,918 (88.6%) | 504 (11.4%) |
| $75,000 to $99,999 | 3,055 (87.2%) | 447 (12.8%) |
| $100,000 and over | 5,444 (92.6%) | 435 (7.4%) |
Public vs Private Health Insurance Coverage by Age in East Ridge
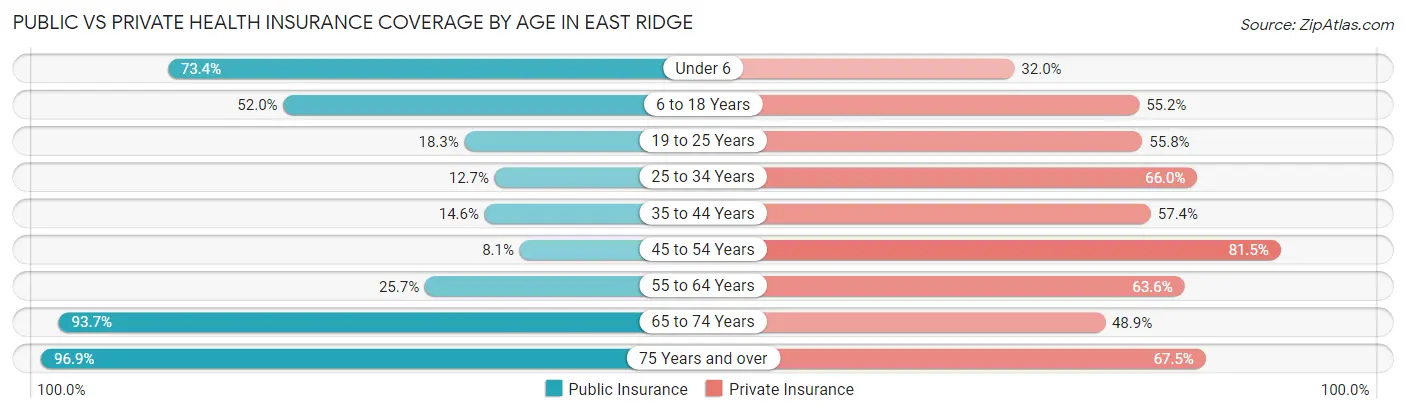
| Age Bracket | Public Insurance | Private Insurance |
| Under 6 | 928 (73.4%) | 405 (32.0%) |
| 6 to 18 Years | 1,713 (52.0%) | 1,820 (55.2%) |
| 19 to 25 Years | 302 (18.3%) | 919 (55.8%) |
| 25 to 34 Years | 430 (12.7%) | 2,228 (66.0%) |
| 35 to 44 Years | 382 (14.6%) | 1,503 (57.4%) |
| 45 to 54 Years | 220 (8.1%) | 2,214 (81.5%) |
| 55 to 64 Years | 760 (25.7%) | 1,883 (63.6%) |
| 65 to 74 Years | 2,086 (93.7%) | 1,088 (48.8%) |
| 75 Years and over | 1,777 (96.9%) | 1,238 (67.5%) |
| Total | 8,598 (39.2%) | 13,298 (60.6%) |
Disability Status by Sex by Age in East Ridge
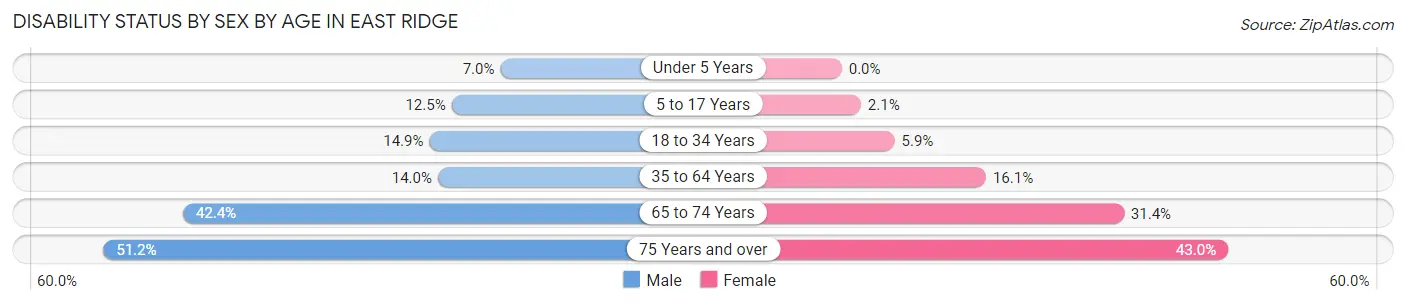
| Age Bracket | Male | Female |
| Under 5 Years | 42 (7.0%) | 0 (0.0%) |
| 5 to 17 Years | 199 (12.5%) | 32 (2.1%) |
| 18 to 34 Years | 399 (14.9%) | 157 (5.9%) |
| 35 to 64 Years | 541 (14.0%) | 711 (16.1%) |
| 65 to 74 Years | 485 (42.4%) | 340 (31.4%) |
| 75 Years and over | 397 (51.2%) | 455 (43.0%) |
Disability Class by Sex by Age in East Ridge
Disability Class: Hearing Difficulty
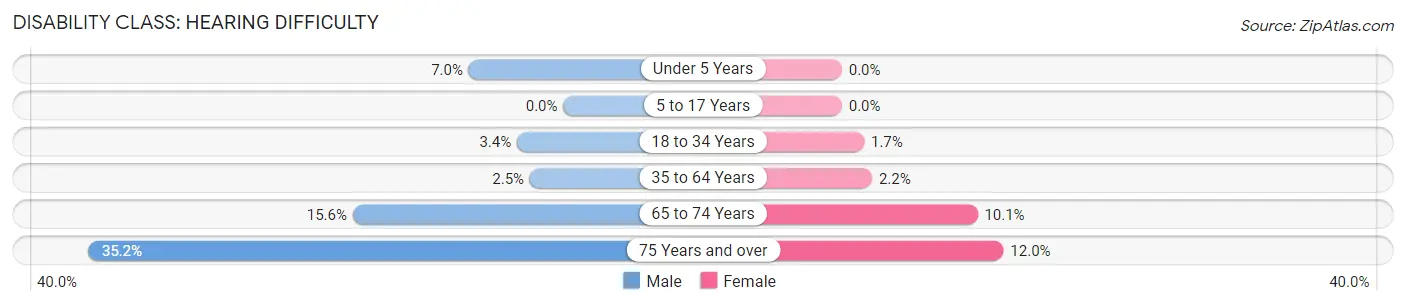
| Age Bracket | Male | Female |
| Under 5 Years | 42 (7.0%) | 0 (0.0%) |
| 5 to 17 Years | 0 (0.0%) | 0 (0.0%) |
| 18 to 34 Years | 92 (3.4%) | 44 (1.7%) |
| 35 to 64 Years | 96 (2.5%) | 99 (2.2%) |
| 65 to 74 Years | 179 (15.6%) | 109 (10.1%) |
| 75 Years and over | 273 (35.2%) | 127 (12.0%) |
Disability Class: Vision Difficulty
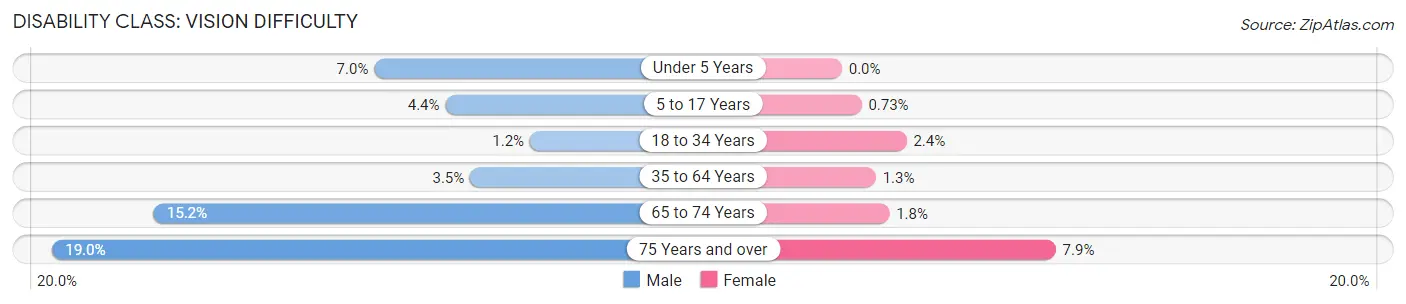
| Age Bracket | Male | Female |
| Under 5 Years | 42 (7.0%) | 0 (0.0%) |
| 5 to 17 Years | 70 (4.4%) | 11 (0.7%) |
| 18 to 34 Years | 33 (1.2%) | 64 (2.4%) |
| 35 to 64 Years | 134 (3.5%) | 56 (1.3%) |
| 65 to 74 Years | 174 (15.2%) | 19 (1.8%) |
| 75 Years and over | 147 (19.0%) | 84 (7.9%) |
Disability Class: Cognitive Difficulty
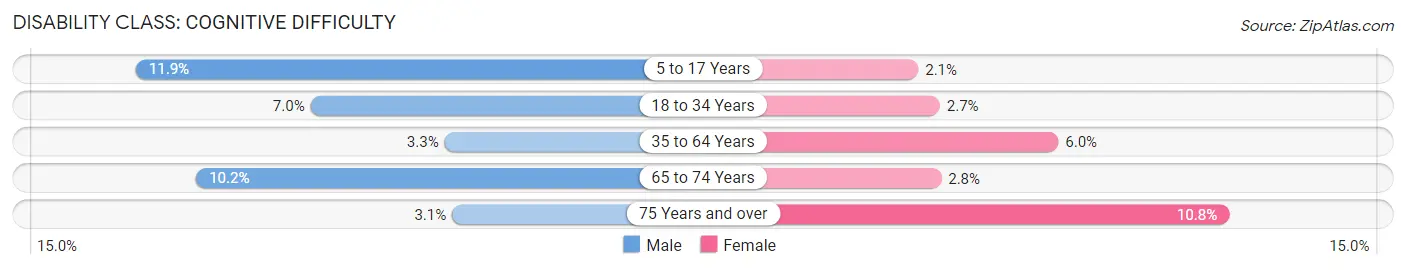
| Age Bracket | Male | Female |
| 5 to 17 Years | 190 (11.9%) | 32 (2.1%) |
| 18 to 34 Years | 188 (7.0%) | 73 (2.7%) |
| 35 to 64 Years | 128 (3.3%) | 267 (6.0%) |
| 65 to 74 Years | 117 (10.2%) | 30 (2.8%) |
| 75 Years and over | 24 (3.1%) | 114 (10.8%) |
Disability Class: Ambulatory Difficulty
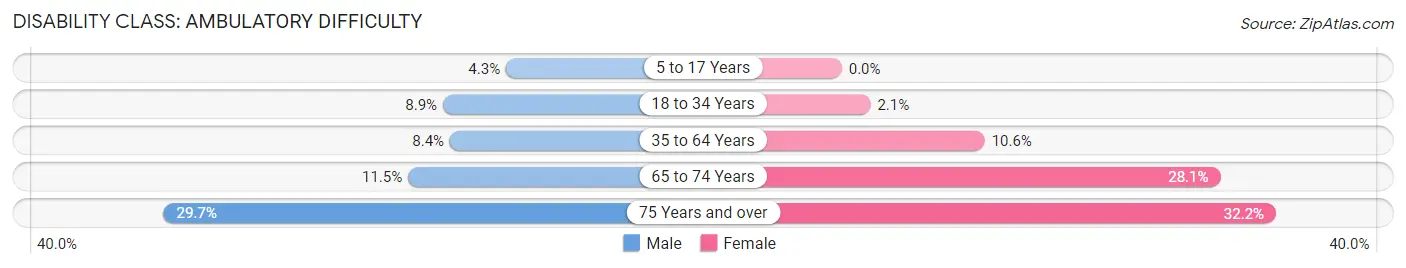
| Age Bracket | Male | Female |
| 5 to 17 Years | 68 (4.3%) | 0 (0.0%) |
| 18 to 34 Years | 239 (8.9%) | 57 (2.1%) |
| 35 to 64 Years | 326 (8.4%) | 470 (10.6%) |
| 65 to 74 Years | 132 (11.5%) | 304 (28.1%) |
| 75 Years and over | 230 (29.7%) | 341 (32.2%) |
Disability Class: Self-Care Difficulty
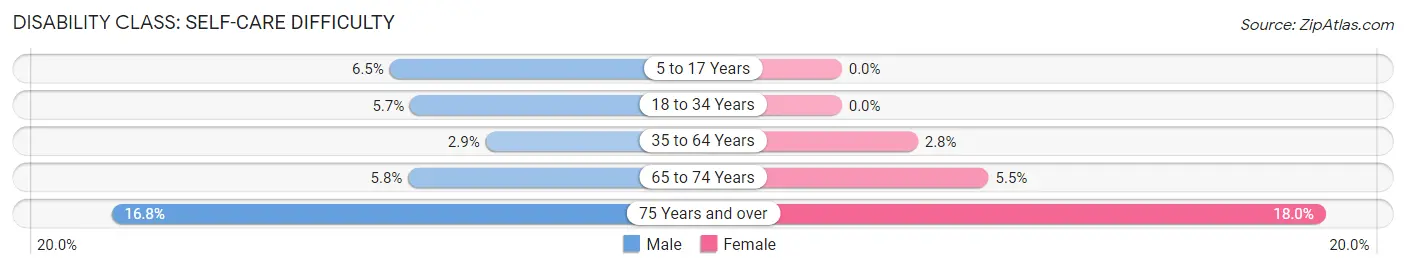
| Age Bracket | Male | Female |
| 5 to 17 Years | 103 (6.5%) | 0 (0.0%) |
| 18 to 34 Years | 152 (5.7%) | 0 (0.0%) |
| 35 to 64 Years | 112 (2.9%) | 125 (2.8%) |
| 65 to 74 Years | 66 (5.8%) | 59 (5.4%) |
| 75 Years and over | 130 (16.8%) | 190 (18.0%) |
Technology Access in East Ridge
Computing Device Access in East Ridge
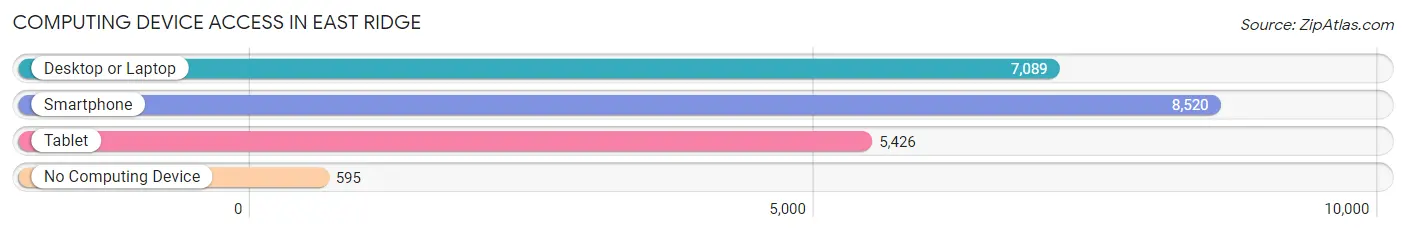
| Device Type | # Households | % Households |
| Desktop or Laptop | 7,089 | 74.2% |
| Smartphone | 8,520 | 89.1% |
| Tablet | 5,426 | 56.8% |
| No Computing Device | 595 | 6.2% |
| Total | 9,558 | 100.0% |
Internet Access in East Ridge
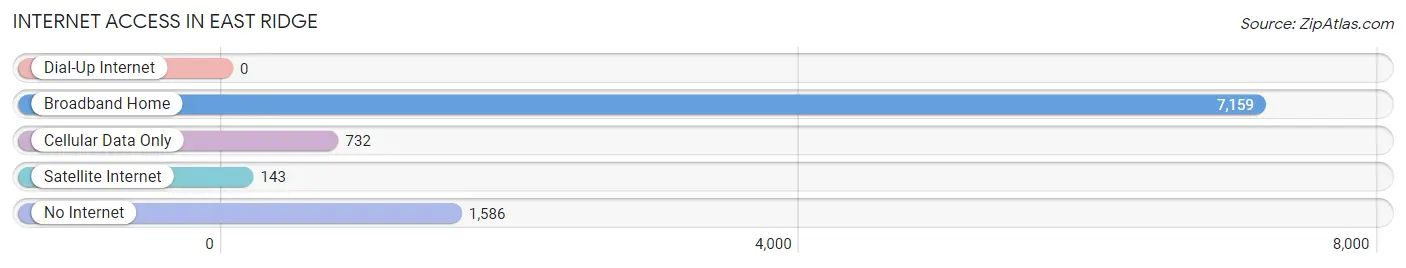
| Internet Type | # Households | % Households |
| Dial-Up Internet | 0 | 0.0% |
| Broadband Home | 7,159 | 74.9% |
| Cellular Data Only | 732 | 7.7% |
| Satellite Internet | 143 | 1.5% |
| No Internet | 1,586 | 16.6% |
| Total | 9,558 | 100.0% |
East Ridge Summary
History
East Ridge, Tennessee is a city located in Hamilton County, just east of Chattanooga. It was founded in 1891 and incorporated in 1919. The city was named for its location east of Missionary Ridge, a site of a major Civil War battle.
The area that is now East Ridge was originally inhabited by the Cherokee Indians. In the early 1800s, the area was settled by European-American settlers. The first settlers were mostly farmers, but the area soon became a popular destination for vacationers. The area was known for its natural beauty and its proximity to Chattanooga.
In 1891, the East Ridge Land Company was formed to develop the area. The company purchased land from the Cherokee Nation and began to lay out streets and lots. The first lots were sold in 1892 and the first homes were built in 1893.
The city was officially incorporated in 1919. At the time, the population was around 500 people. The city grew slowly over the next few decades, reaching a population of 1,000 in 1940.
Geography
East Ridge is located in Hamilton County, Tennessee, just east of Chattanooga. It is situated on the western edge of the Cumberland Plateau, at the base of Missionary Ridge. The city covers an area of 8.3 square miles and has an elevation of 690 feet.
The city is bordered by the city of Chattanooga to the west, the city of Red Bank to the north, the city of Lookout Mountain to the east, and the city of Signal Mountain to the south. The city is located near the Tennessee River, which provides a natural border between East Ridge and Chattanooga.
The climate in East Ridge is humid subtropical, with hot, humid summers and mild winters. The average annual temperature is around 60 degrees Fahrenheit. The average annual precipitation is around 50 inches.
Economy
The economy of East Ridge is largely based on manufacturing and retail. The city is home to several large manufacturing companies, including East Ridge Manufacturing, East Ridge Industries, and East Ridge Plastics. These companies produce a variety of products, including automotive parts, medical supplies, and industrial equipment.
The city is also home to several retail stores, including Walmart, Target, and Lowe’s. These stores provide a variety of goods and services to the local community.
Demographics
As of the 2010 census, the population of East Ridge was 21,717. The racial makeup of the city was 79.3% White, 14.2% African American, 0.7% Native American, 1.2% Asian, 0.1% Pacific Islander, and 4.5% from other races. Hispanic or Latino of any race were 5.3% of the population.
The median household income in East Ridge was $41,945, and the median family income was $50,945. The per capita income was $20,945. About 11.3% of the population was below the poverty line.
Conclusion
East Ridge, Tennessee is a city located in Hamilton County, just east of Chattanooga. It was founded in 1891 and incorporated in 1919. The city was named for its location east of Missionary Ridge, a site of a major Civil War battle. The economy of East Ridge is largely based on manufacturing and retail, and the city is home to several large companies and retail stores. As of the 2010 census, the population of East Ridge was 21,717. The racial makeup of the city was 79.3% White, 14.2% African American, 0.7% Native American, 1.2% Asian, 0.1% Pacific Islander, and 4.5% from other races. The median household income in East Ridge was $41,945, and the median family income was $50,945.
Common Questions
What is Per Capita Income in East Ridge?
Per Capita income in East Ridge is $30,355.
What is the Median Family Income in East Ridge?
Median Family Income in East Ridge is $64,696.
What is the Median Household income in East Ridge?
Median Household Income in East Ridge is $53,103.
What is Income or Wage Gap in East Ridge?
Income or Wage Gap in East Ridge is 21.6%.
Women in East Ridge earn 78.4 cents for every dollar earned by a man.
What is Family Income Deficit in East Ridge?
Family Income Deficit in East Ridge is $9,773.
Families that are below poverty line in East Ridge earn $9,773 less on average than the poverty threshold level.
What is Inequality or Gini Index in East Ridge?
Inequality or Gini Index in East Ridge is 0.41.
What is the Total Population of East Ridge?
Total Population of East Ridge is 22,040.
What is the Total Male Population of East Ridge?
Total Male Population of East Ridge is 10,703.
What is the Total Female Population of East Ridge?
Total Female Population of East Ridge is 11,337.
What is the Ratio of Males per 100 Females in East Ridge?
There are 94.41 Males per 100 Females in East Ridge.
What is the Ratio of Females per 100 Males in East Ridge?
There are 105.92 Females per 100 Males in East Ridge.
What is the Median Population Age in East Ridge?
Median Population Age in East Ridge is 39.6 Years.
What is the Average Family Size in East Ridge
Average Family Size in East Ridge is 2.9 People.
What is the Average Household Size in East Ridge
Average Household Size in East Ridge is 2.3 People.
How Large is the Labor Force in East Ridge?
There are 12,222 People in the Labor Forcein in East Ridge.
What is the Percentage of People in the Labor Force in East Ridge?
66.7% of People are in the Labor Force in East Ridge.
What is the Unemployment Rate in East Ridge?
Unemployment Rate in East Ridge is 6.5%.