Midtown, TN Map & Demographics
Midtown Map
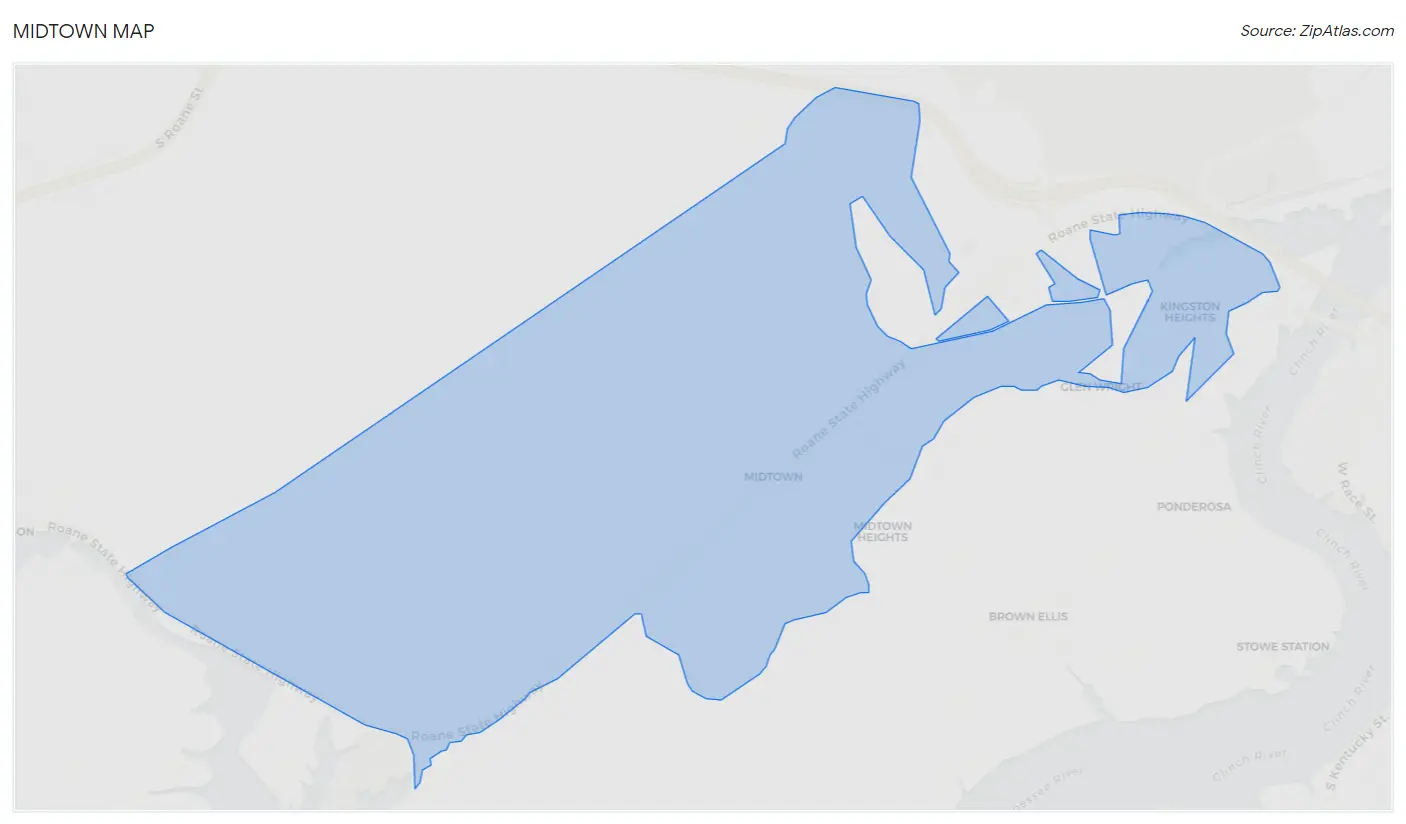
Midtown Overview
$22,212
PER CAPITA INCOME
$46,867
AVG FAMILY INCOME
$36,815
AVG HOUSEHOLD INCOME
61.8%
WAGE / INCOME GAP [ % ]
38.2¢/ $1
WAGE / INCOME GAP [ $ ]
0.39
INEQUALITY / GINI INDEX
1,260
TOTAL POPULATION
469
MALE POPULATION
791
FEMALE POPULATION
59.29
MALES / 100 FEMALES
168.66
FEMALES / 100 MALES
58.9
MEDIAN AGE
3.0
AVG FAMILY SIZE
2.2
AVG HOUSEHOLD SIZE
413
LABOR FORCE [ PEOPLE ]
36.9%
PERCENT IN LABOR FORCE
7.8%
UNEMPLOYMENT RATE
Income in Midtown
Income Overview in Midtown
Per Capita Income in Midtown is $22,212, while median incomes of families and households are $46,867 and $36,815 respectively.
| Characteristic | Number | Measure |
| Per Capita Income | 1,260 | $22,212 |
| Median Family Income | 307 | $46,867 |
| Mean Family Income | 307 | $57,028 |
| Median Household Income | 569 | $36,815 |
| Mean Household Income | 569 | $45,259 |
| Income Deficit | 307 | $0 |
| Wage / Income Gap (%) | 1,260 | 61.77% |
| Wage / Income Gap ($) | 1,260 | 38.23¢ per $1 |
| Gini / Inequality Index | 1,260 | 0.39 |
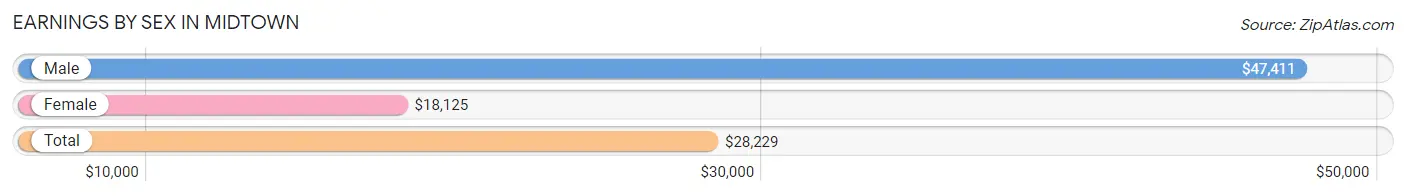
Earnings by Sex in Midtown
Average Earnings in Midtown are $28,229, $47,411 for men and $18,125 for women, a difference of 61.8%.
| Sex | Number | Average Earnings |
| Male | 242 (55.6%) | $47,411 |
| Female | 193 (44.4%) | $18,125 |
| Total | 435 (100.0%) | $28,229 |
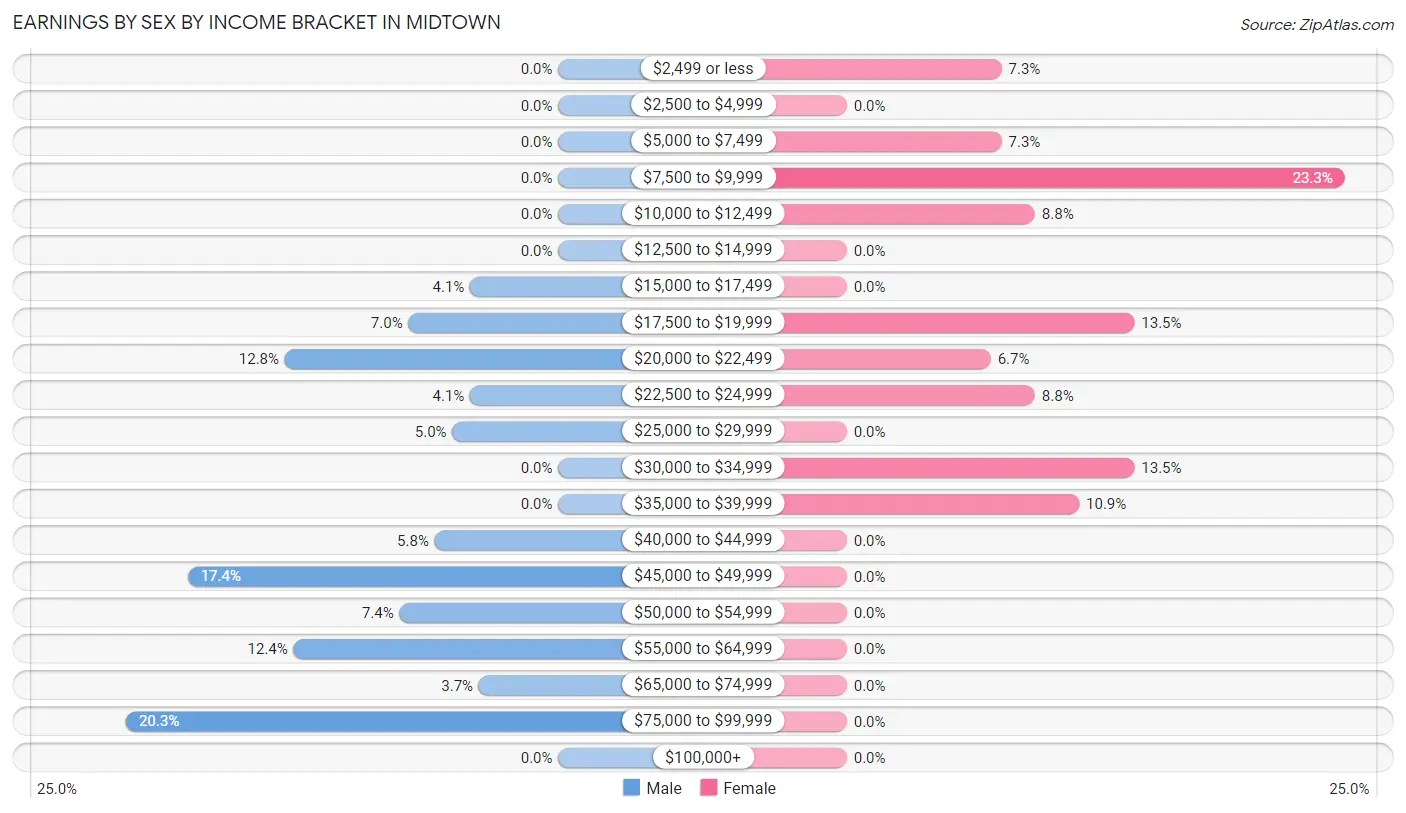
Earnings by Sex by Income Bracket in Midtown
The most common earnings brackets in Midtown are $75,000 to $99,999 for men (49 | 20.3%) and $7,500 to $9,999 for women (45 | 23.3%).
| Income | Male | Female |
| $2,499 or less | 0 (0.0%) | 14 (7.2%) |
| $2,500 to $4,999 | 0 (0.0%) | 0 (0.0%) |
| $5,000 to $7,499 | 0 (0.0%) | 14 (7.2%) |
| $7,500 to $9,999 | 0 (0.0%) | 45 (23.3%) |
| $10,000 to $12,499 | 0 (0.0%) | 17 (8.8%) |
| $12,500 to $14,999 | 0 (0.0%) | 0 (0.0%) |
| $15,000 to $17,499 | 10 (4.1%) | 0 (0.0%) |
| $17,500 to $19,999 | 17 (7.0%) | 26 (13.5%) |
| $20,000 to $22,499 | 31 (12.8%) | 13 (6.7%) |
| $22,500 to $24,999 | 10 (4.1%) | 17 (8.8%) |
| $25,000 to $29,999 | 12 (5.0%) | 0 (0.0%) |
| $30,000 to $34,999 | 0 (0.0%) | 26 (13.5%) |
| $35,000 to $39,999 | 0 (0.0%) | 21 (10.9%) |
| $40,000 to $44,999 | 14 (5.8%) | 0 (0.0%) |
| $45,000 to $49,999 | 42 (17.4%) | 0 (0.0%) |
| $50,000 to $54,999 | 18 (7.4%) | 0 (0.0%) |
| $55,000 to $64,999 | 30 (12.4%) | 0 (0.0%) |
| $65,000 to $74,999 | 9 (3.7%) | 0 (0.0%) |
| $75,000 to $99,999 | 49 (20.3%) | 0 (0.0%) |
| $100,000+ | 0 (0.0%) | 0 (0.0%) |
| Total | 242 (100.0%) | 193 (100.0%) |
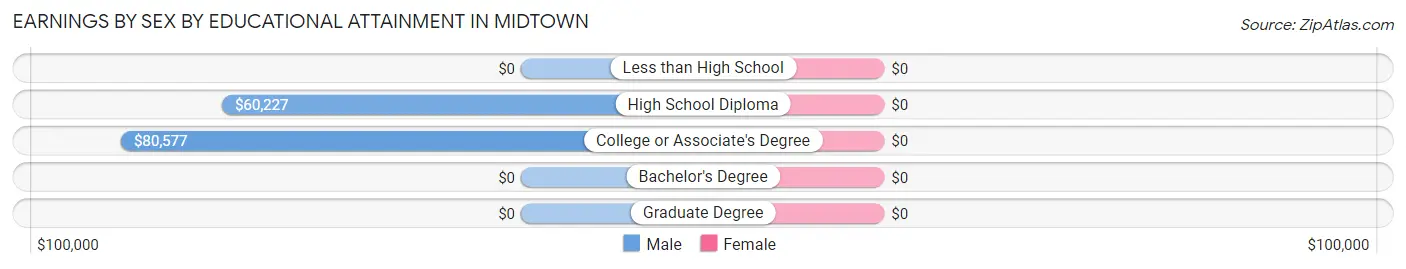
Earnings by Sex by Educational Attainment in Midtown
| Educational Attainment | Male Income | Female Income |
| Less than High School | - | - |
| High School Diploma | $60,227 | $0 |
| College or Associate's Degree | $80,577 | $0 |
| Bachelor's Degree | - | - |
| Graduate Degree | - | - |
| Total | $51,319 | $19,712 |
Family Income in Midtown
Family Income Brackets in Midtown
According to the Midtown family income data, there are 142 families falling into the $35,000 to $49,999 income range, which is the most common income bracket and makes up 46.3% of all families.
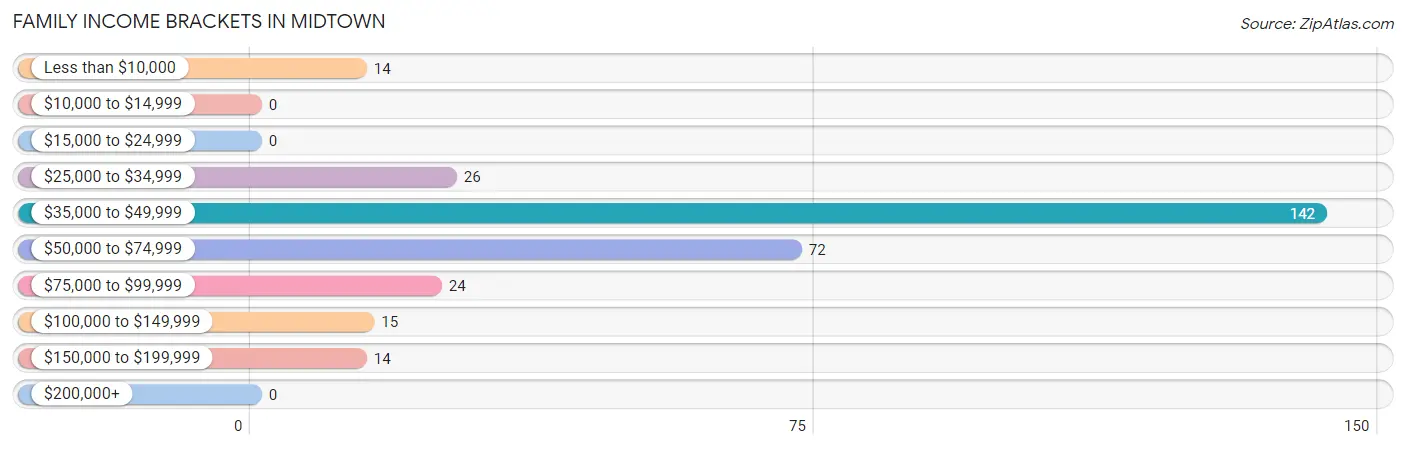
| Income Bracket | # Families | % Families |
| Less than $10,000 | 14 | 4.6% |
| $10,000 to $14,999 | 0 | 0.0% |
| $15,000 to $24,999 | 0 | 0.0% |
| $25,000 to $34,999 | 26 | 8.5% |
| $35,000 to $49,999 | 142 | 46.3% |
| $50,000 to $74,999 | 72 | 23.5% |
| $75,000 to $99,999 | 24 | 7.8% |
| $100,000 to $149,999 | 15 | 4.9% |
| $150,000 to $199,999 | 14 | 4.6% |
| $200,000+ | 0 | 0.0% |
Family Income by Famaliy Size in Midtown
3-person families (81 | 26.4%) account for the highest median family income in Midtown with $56,442 per family, while 2-person families (144 | 46.9%) have the highest median income of $23,077 per family member.
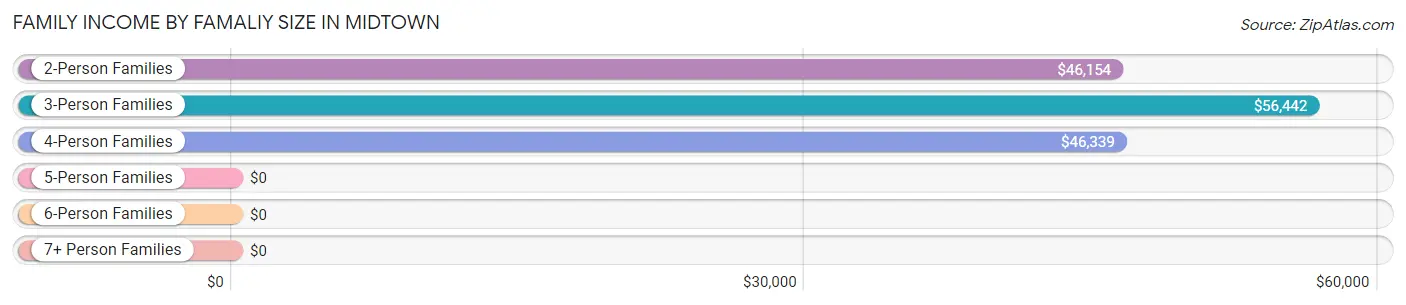
| Income Bracket | # Families | Median Income |
| 2-Person Families | 144 (46.9%) | $46,154 |
| 3-Person Families | 81 (26.4%) | $56,442 |
| 4-Person Families | 82 (26.7%) | $46,339 |
| 5-Person Families | 0 (0.0%) | $0 |
| 6-Person Families | 0 (0.0%) | $0 |
| 7+ Person Families | 0 (0.0%) | $0 |
| Total | 307 (100.0%) | $46,867 |
Family Income by Number of Earners in Midtown
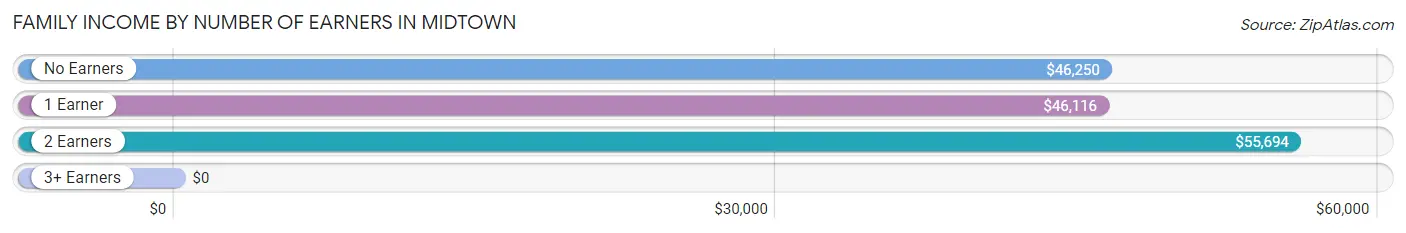
| Number of Earners | # Families | Median Income |
| No Earners | 121 (39.4%) | $46,250 |
| 1 Earner | 103 (33.6%) | $46,116 |
| 2 Earners | 69 (22.5%) | $55,694 |
| 3+ Earners | 14 (4.6%) | $0 |
| Total | 307 (100.0%) | $46,867 |
Household Income in Midtown
Household Income Brackets in Midtown
With 161 households falling in the category, the $15,000 to $24,999 income range is the most frequent in Midtown, accounting for 28.3% of all households.
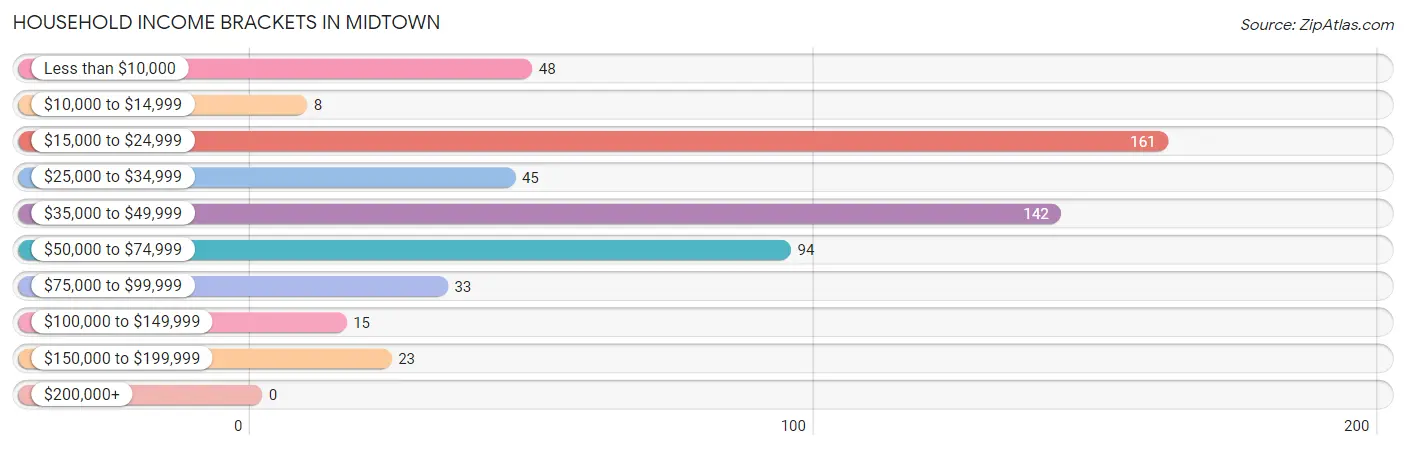
| Income Bracket | # Households | % Households |
| Less than $10,000 | 48 | 8.4% |
| $10,000 to $14,999 | 8 | 1.4% |
| $15,000 to $24,999 | 161 | 28.3% |
| $25,000 to $34,999 | 45 | 7.9% |
| $35,000 to $49,999 | 142 | 25.0% |
| $50,000 to $74,999 | 94 | 16.5% |
| $75,000 to $99,999 | 33 | 5.8% |
| $100,000 to $149,999 | 15 | 2.6% |
| $150,000 to $199,999 | 23 | 4.0% |
| $200,000+ | 0 | 0.0% |
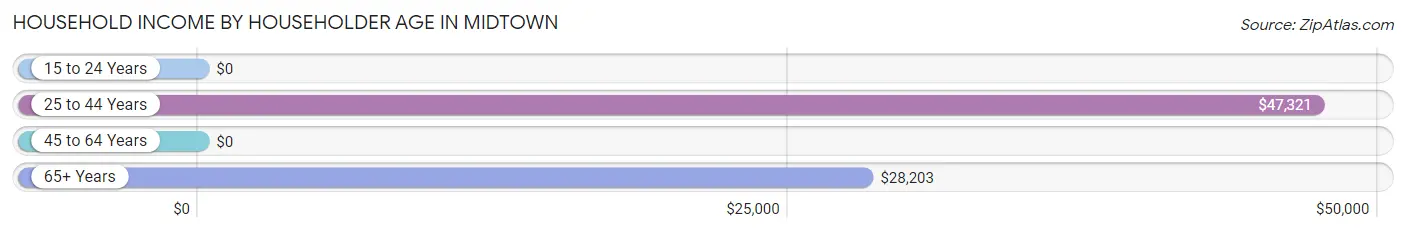
Household Income by Householder Age in Midtown
The median household income in Midtown is $36,815, with the highest median household income of $47,321 found in the 25 to 44 years age bracket for the primary householder. A total of 80 households (14.1%) fall into this category. Meanwhile, the 15 to 24 years age bracket for the primary householder has the lowest median household income of $0, with 28 households (4.9%) in this group.
| Income Bracket | # Households | Median Income |
| 15 to 24 Years | 28 (4.9%) | $0 |
| 25 to 44 Years | 80 (14.1%) | $47,321 |
| 45 to 64 Years | 149 (26.2%) | $0 |
| 65+ Years | 312 (54.8%) | $28,203 |
| Total | 569 (100.0%) | $36,815 |
Poverty in Midtown
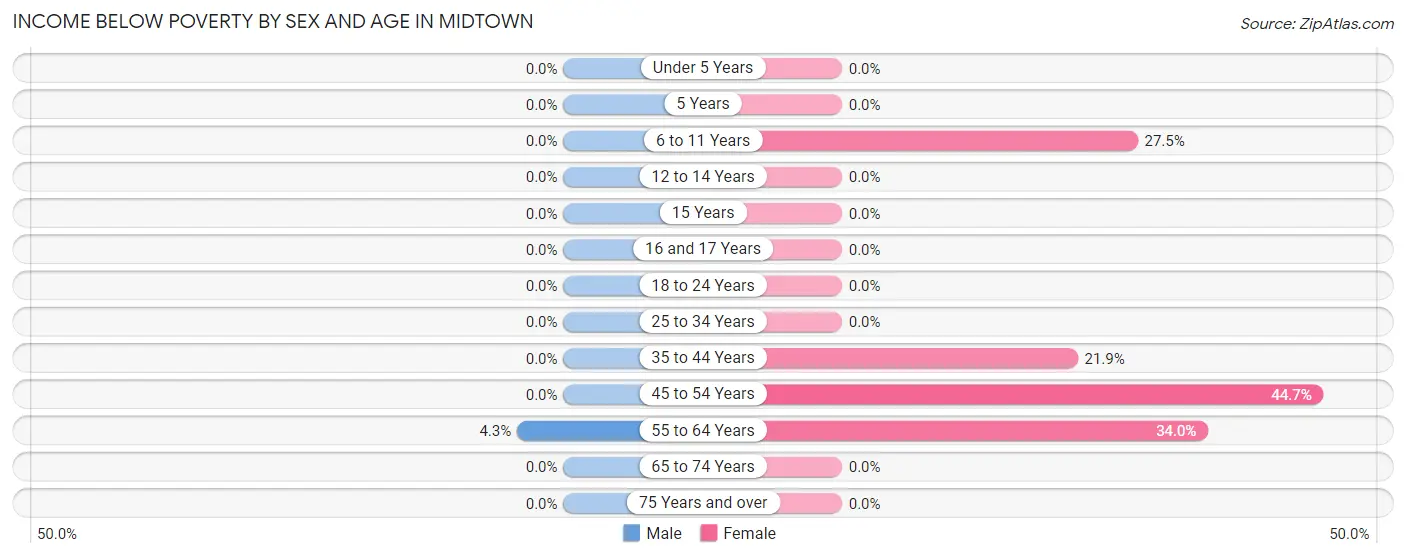
Income Below Poverty by Sex and Age in Midtown
With 0.9% poverty level for males and 12.6% for females among the residents of Midtown, 55 to 64 year old males and 45 to 54 year old females are the most vulnerable to poverty, with 4 males (4.3%) and 38 females (44.7%) in their respective age groups living below the poverty level.
| Age Bracket | Male | Female |
| Under 5 Years | 0 (0.0%) | 0 (0.0%) |
| 5 Years | 0 (0.0%) | 0 (0.0%) |
| 6 to 11 Years | 0 (0.0%) | 14 (27.5%) |
| 12 to 14 Years | 0 (0.0%) | 0 (0.0%) |
| 15 Years | 0 (0.0%) | 0 (0.0%) |
| 16 and 17 Years | 0 (0.0%) | 0 (0.0%) |
| 18 to 24 Years | 0 (0.0%) | 0 (0.0%) |
| 25 to 34 Years | 0 (0.0%) | 0 (0.0%) |
| 35 to 44 Years | 0 (0.0%) | 14 (21.9%) |
| 45 to 54 Years | 0 (0.0%) | 38 (44.7%) |
| 55 to 64 Years | 4 (4.3%) | 34 (34.0%) |
| 65 to 74 Years | 0 (0.0%) | 0 (0.0%) |
| 75 Years and over | 0 (0.0%) | 0 (0.0%) |
| Total | 4 (0.9%) | 100 (12.6%) |
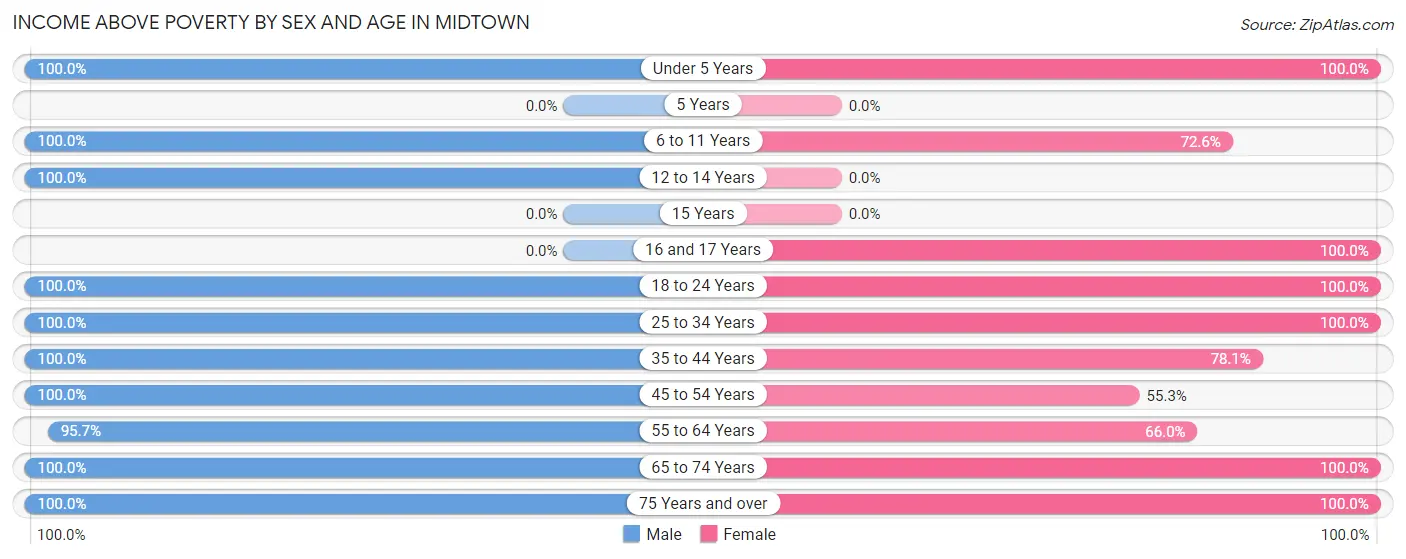
Income Above Poverty by Sex and Age in Midtown
According to the poverty statistics in Midtown, males aged under 5 years and females aged under 5 years are the age groups that are most secure financially, with 100.0% of males and 100.0% of females in these age groups living above the poverty line.
| Age Bracket | Male | Female |
| Under 5 Years | 8 (100.0%) | 58 (100.0%) |
| 5 Years | 0 (0.0%) | 0 (0.0%) |
| 6 to 11 Years | 12 (100.0%) | 37 (72.6%) |
| 12 to 14 Years | 13 (100.0%) | 0 (0.0%) |
| 15 Years | 0 (0.0%) | 0 (0.0%) |
| 16 and 17 Years | 0 (0.0%) | 33 (100.0%) |
| 18 to 24 Years | 49 (100.0%) | 44 (100.0%) |
| 25 to 34 Years | 31 (100.0%) | 61 (100.0%) |
| 35 to 44 Years | 60 (100.0%) | 50 (78.1%) |
| 45 to 54 Years | 22 (100.0%) | 47 (55.3%) |
| 55 to 64 Years | 89 (95.7%) | 66 (66.0%) |
| 65 to 74 Years | 137 (100.0%) | 86 (100.0%) |
| 75 Years and over | 44 (100.0%) | 209 (100.0%) |
| Total | 465 (99.2%) | 691 (87.4%) |
Income Below Poverty Among Married-Couple Families in Midtown

| Children | Above Poverty | Below Poverty |
| No Children | 163 (100.0%) | 0 (0.0%) |
| 1 or 2 Children | 70 (100.0%) | 0 (0.0%) |
| 3 or 4 Children | 0 (0.0%) | 0 (0.0%) |
| 5 or more Children | 0 (0.0%) | 0 (0.0%) |
| Total | 233 (100.0%) | 0 (0.0%) |
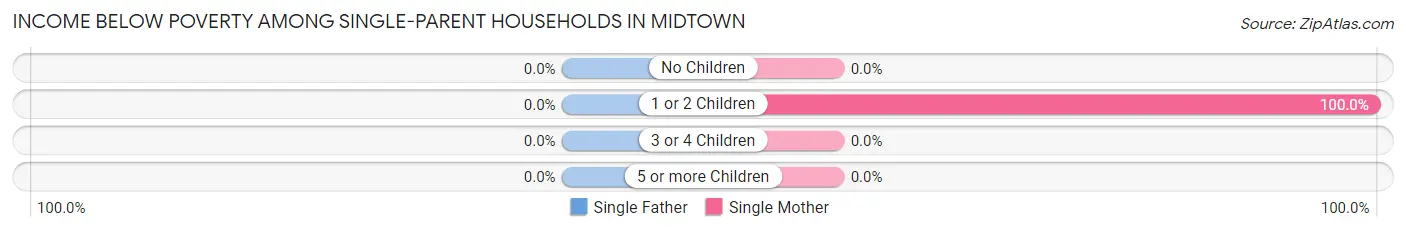
Income Below Poverty Among Single-Parent Households in Midtown
| Children | Single Father | Single Mother |
| No Children | 0 (0.0%) | 0 (0.0%) |
| 1 or 2 Children | 0 (0.0%) | 14 (100.0%) |
| 3 or 4 Children | 0 (0.0%) | 0 (0.0%) |
| 5 or more Children | 0 (0.0%) | 0 (0.0%) |
| Total | 0 (0.0%) | 14 (25.9%) |
Income Below Poverty Among Married-Couple vs Single-Parent Households in Midtown
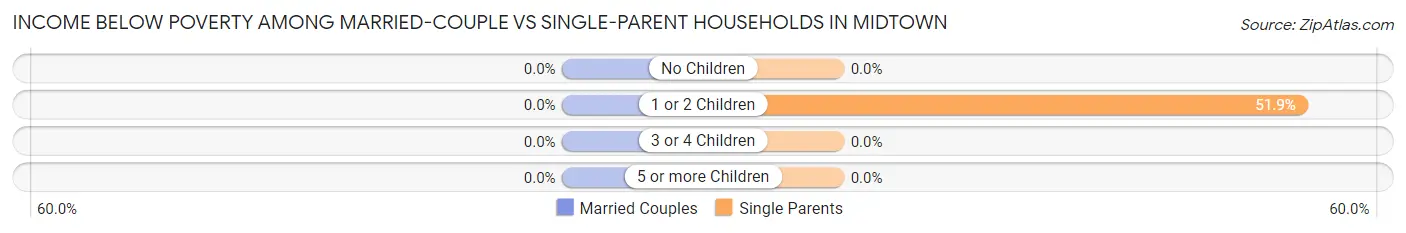
| Children | Married-Couple Families | Single-Parent Households |
| No Children | 0 (0.0%) | 0 (0.0%) |
| 1 or 2 Children | 0 (0.0%) | 14 (51.8%) |
| 3 or 4 Children | 0 (0.0%) | 0 (0.0%) |
| 5 or more Children | 0 (0.0%) | 0 (0.0%) |
| Total | 0 (0.0%) | 14 (18.9%) |
Race in Midtown
The most populous races in Midtown are White / Caucasian (1,228 | 97.5%), Hispanic or Latino (17 | 1.3%), and Two or more Races (17 | 1.3%).
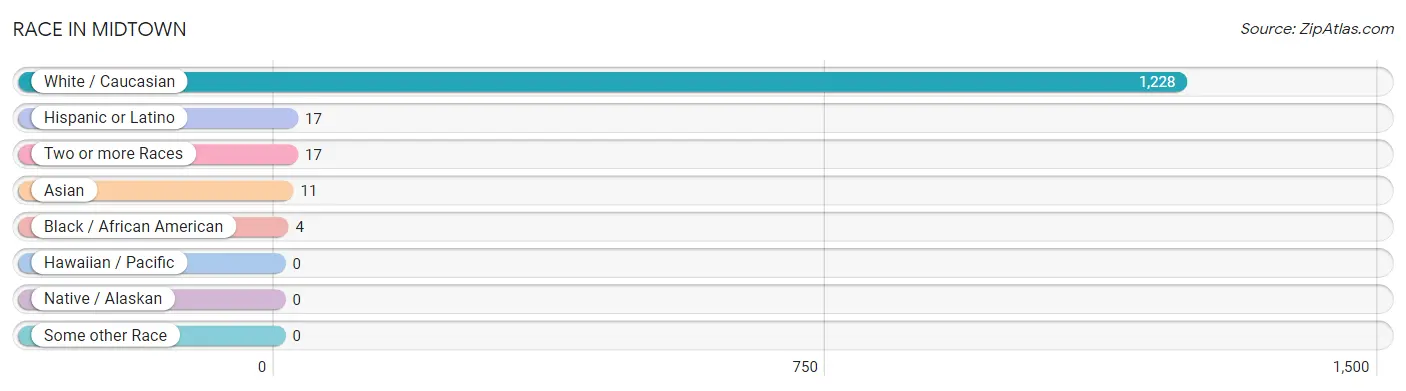
| Race | # Population | % Population |
| Asian | 11 | 0.9% |
| Black / African American | 4 | 0.3% |
| Hawaiian / Pacific | 0 | 0.0% |
| Hispanic or Latino | 17 | 1.3% |
| Native / Alaskan | 0 | 0.0% |
| White / Caucasian | 1,228 | 97.5% |
| Two or more Races | 17 | 1.3% |
| Some other Race | 0 | 0.0% |
| Total | 1,260 | 100.0% |
Ancestry in Midtown
The most populous ancestries reported in Midtown are German (268 | 21.3%), American (186 | 14.8%), English (88 | 7.0%), British (84 | 6.7%), and Dutch (36 | 2.9%), together accounting for 52.5% of all Midtown residents.
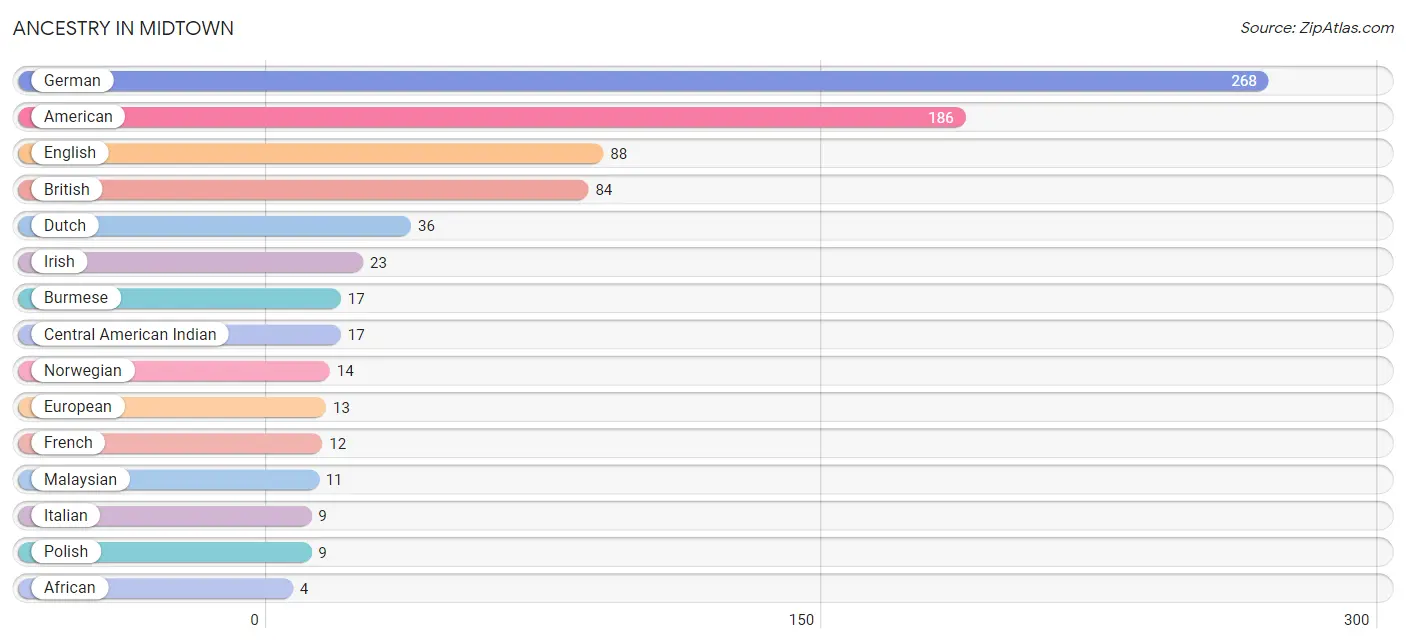
| Ancestry | # Population | % Population |
| African | 4 | 0.3% |
| American | 186 | 14.8% |
| British | 84 | 6.7% |
| Burmese | 17 | 1.3% |
| Central American Indian | 17 | 1.3% |
| Dutch | 36 | 2.9% |
| English | 88 | 7.0% |
| European | 13 | 1.0% |
| French | 12 | 0.9% |
| German | 268 | 21.3% |
| Irish | 23 | 1.8% |
| Italian | 9 | 0.7% |
| Malaysian | 11 | 0.9% |
| Norwegian | 14 | 1.1% |
| Polish | 9 | 0.7% |
| Subsaharan African | 4 | 0.3% | View All 16 Rows |
Immigrants in Midtown
The most numerous immigrant groups reported in Midtown came from Asia (11 | 0.9%), South Eastern Asia (11 | 0.9%), Thailand (6 | 0.5%), and Laos (5 | 0.4%), together accounting for 2.6% of all Midtown residents.
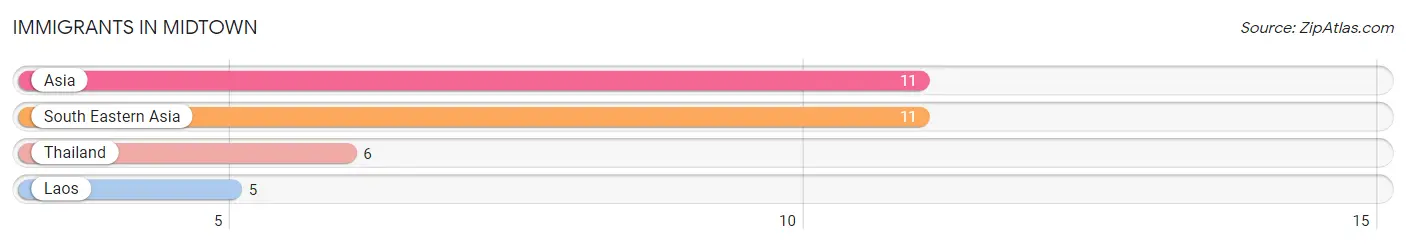
| Immigration Origin | # Population | % Population |
| Asia | 11 | 0.9% |
| Laos | 5 | 0.4% |
| South Eastern Asia | 11 | 0.9% |
| Thailand | 6 | 0.5% | View All 4 Rows |
Sex and Age in Midtown
Sex and Age in Midtown
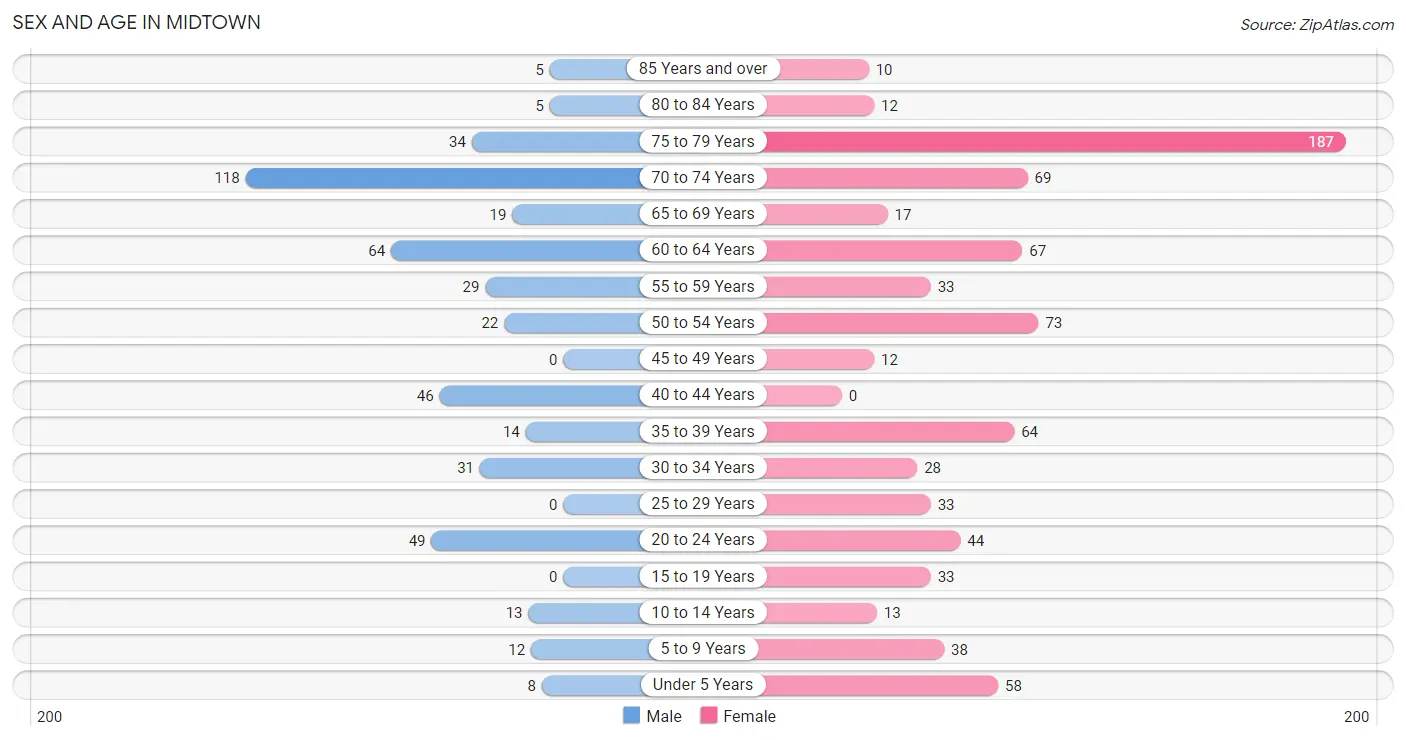
The most populous age groups in Midtown are 70 to 74 Years (118 | 25.2%) for men and 75 to 79 Years (187 | 23.6%) for women.
| Age Bracket | Male | Female |
| Under 5 Years | 8 (1.7%) | 58 (7.3%) |
| 5 to 9 Years | 12 (2.6%) | 38 (4.8%) |
| 10 to 14 Years | 13 (2.8%) | 13 (1.6%) |
| 15 to 19 Years | 0 (0.0%) | 33 (4.2%) |
| 20 to 24 Years | 49 (10.4%) | 44 (5.6%) |
| 25 to 29 Years | 0 (0.0%) | 33 (4.2%) |
| 30 to 34 Years | 31 (6.6%) | 28 (3.5%) |
| 35 to 39 Years | 14 (3.0%) | 64 (8.1%) |
| 40 to 44 Years | 46 (9.8%) | 0 (0.0%) |
| 45 to 49 Years | 0 (0.0%) | 12 (1.5%) |
| 50 to 54 Years | 22 (4.7%) | 73 (9.2%) |
| 55 to 59 Years | 29 (6.2%) | 33 (4.2%) |
| 60 to 64 Years | 64 (13.7%) | 67 (8.5%) |
| 65 to 69 Years | 19 (4.1%) | 17 (2.1%) |
| 70 to 74 Years | 118 (25.2%) | 69 (8.7%) |
| 75 to 79 Years | 34 (7.2%) | 187 (23.6%) |
| 80 to 84 Years | 5 (1.1%) | 12 (1.5%) |
| 85 Years and over | 5 (1.1%) | 10 (1.3%) |
| Total | 469 (100.0%) | 791 (100.0%) |
Families and Households in Midtown
Median Family Size in Midtown
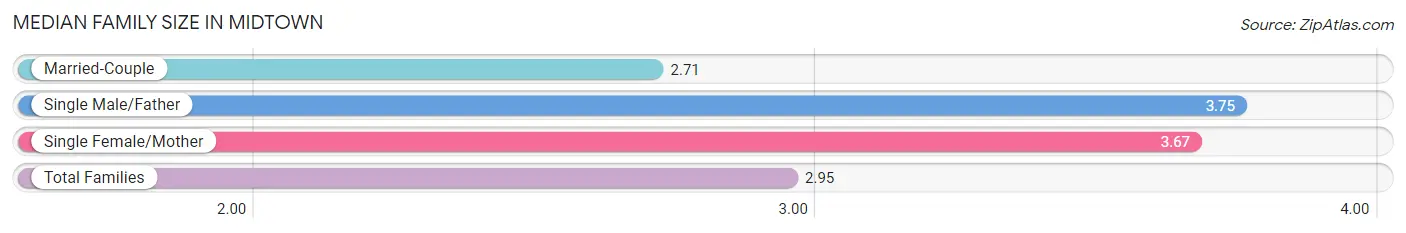
The median family size in Midtown is 2.95 persons per family, with single male/father families (20 | 6.5%) accounting for the largest median family size of 3.75 persons per family. On the other hand, married-couple families (233 | 75.9%) represent the smallest median family size with 2.71 persons per family.
| Family Type | # Families | Family Size |
| Married-Couple | 233 (75.9%) | 2.71 |
| Single Male/Father | 20 (6.5%) | 3.75 |
| Single Female/Mother | 54 (17.6%) | 3.67 |
| Total Families | 307 (100.0%) | 2.95 |
Median Household Size in Midtown
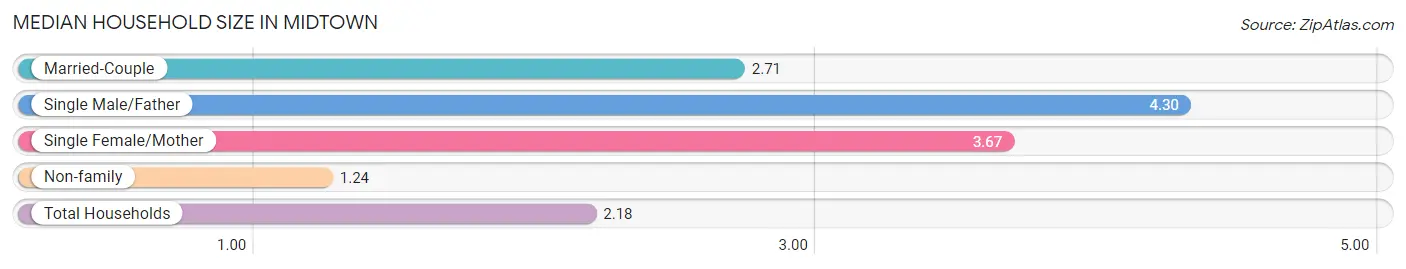
The median household size in Midtown is 2.18 persons per household, with single male/father households (20 | 3.5%) accounting for the largest median household size of 4.3 persons per household. non-family households (262 | 46.1%) represent the smallest median household size with 1.24 persons per household.
| Household Type | # Households | Household Size |
| Married-Couple | 233 (40.9%) | 2.71 |
| Single Male/Father | 20 (3.5%) | 4.30 |
| Single Female/Mother | 54 (9.5%) | 3.67 |
| Non-family | 262 (46.1%) | 1.24 |
| Total Households | 569 (100.0%) | 2.18 |
Household Size by Marriage Status in Midtown
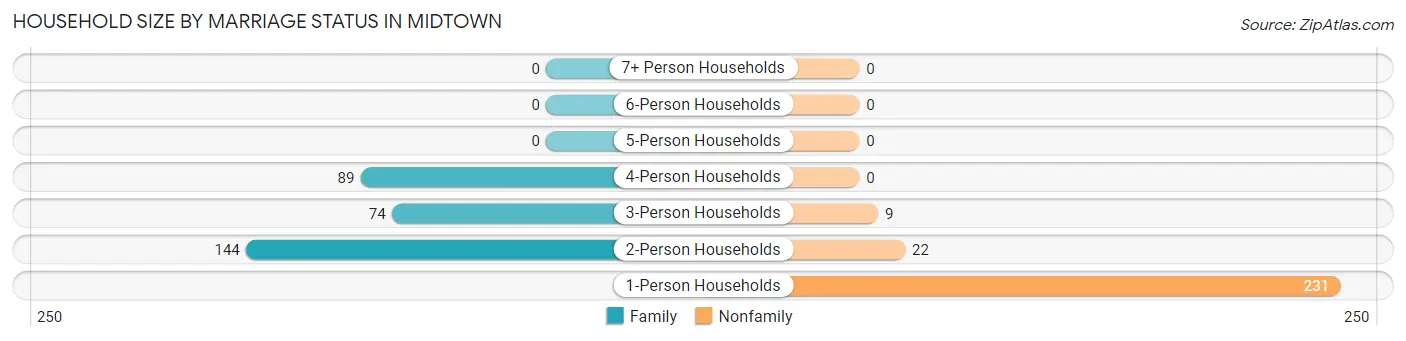
Out of a total of 569 households in Midtown, 307 (53.9%) are family households, while 262 (46.1%) are nonfamily households. The most numerous type of family households are 2-person households, comprising 144, and the most common type of nonfamily households are 1-person households, comprising 231.
| Household Size | Family Households | Nonfamily Households |
| 1-Person Households | - | 231 (40.6%) |
| 2-Person Households | 144 (25.3%) | 22 (3.9%) |
| 3-Person Households | 74 (13.0%) | 9 (1.6%) |
| 4-Person Households | 89 (15.6%) | 0 (0.0%) |
| 5-Person Households | 0 (0.0%) | 0 (0.0%) |
| 6-Person Households | 0 (0.0%) | 0 (0.0%) |
| 7+ Person Households | 0 (0.0%) | 0 (0.0%) |
| Total | 307 (53.9%) | 262 (46.1%) |
Female Fertility in Midtown
Fertility by Age in Midtown
Average fertility rate in Midtown is 285.0 births per 1,000 women. Women in the age bracket of 20 to 34 years have the highest fertility rate with 581.0 births per 1,000 women. Women in the age bracket of 20 to 34 years acount for 100.0% of all women with births.
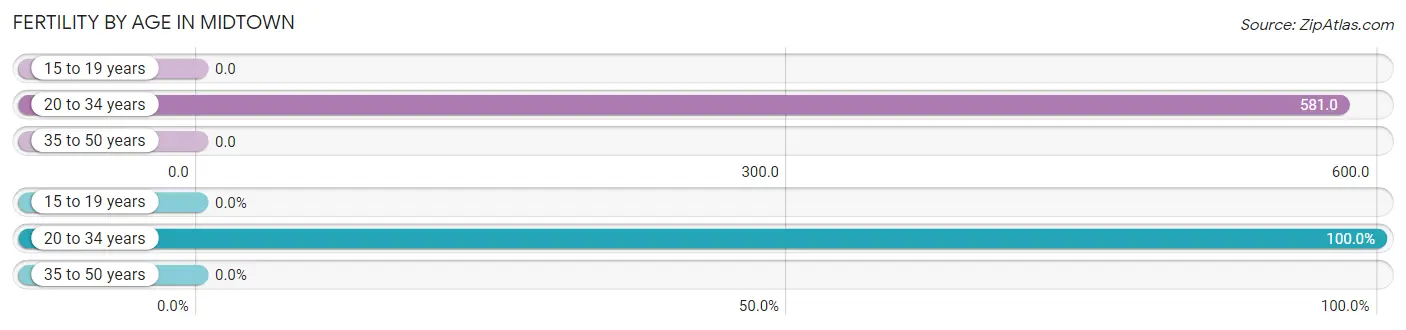
| Age Bracket | Women with Births | Births / 1,000 Women |
| 15 to 19 years | 0 (0.0%) | 0.0 |
| 20 to 34 years | 61 (100.0%) | 581.0 |
| 35 to 50 years | 0 (0.0%) | 0.0 |
| Total | 61 (100.0%) | 285.0 |
Fertility by Age by Marriage Status in Midtown
73.8% of women with births (61) in Midtown are married. The highest percentage of unmarried women with births falls into 20 to 34 years age bracket with 26.2% of them unmarried at the time of birth, while the lowest percentage of unmarried women with births belong to 20 to 34 years age bracket with 26.2% of them unmarried.
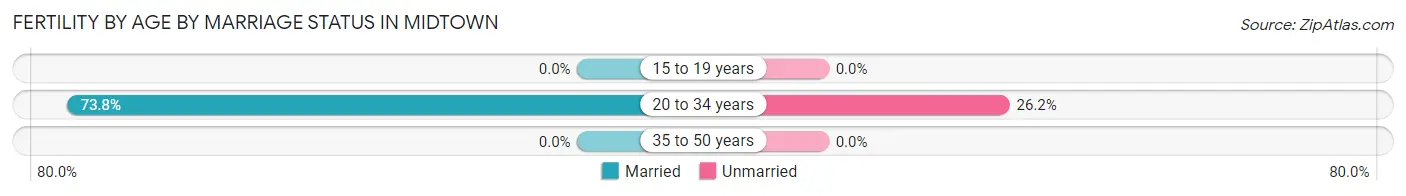
| Age Bracket | Married | Unmarried |
| 15 to 19 years | 0 (0.0%) | 0 (0.0%) |
| 20 to 34 years | 45 (73.8%) | 16 (26.2%) |
| 35 to 50 years | 0 (0.0%) | 0 (0.0%) |
| Total | 45 (73.8%) | 16 (26.2%) |
Fertility by Education in Midtown
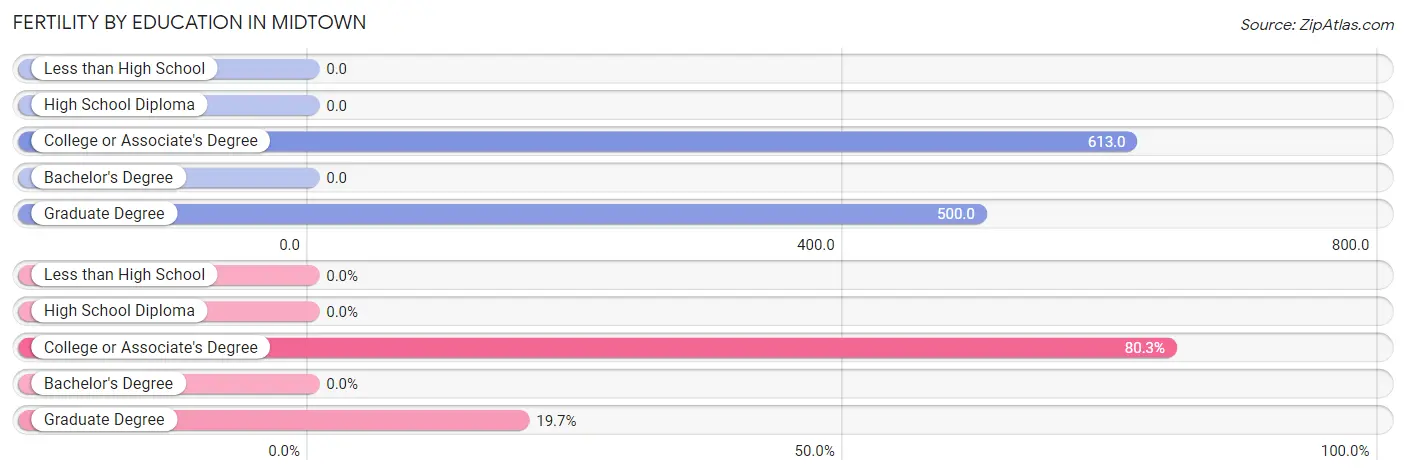
| Educational Attainment | Women with Births | Births / 1,000 Women |
| Less than High School | 0 (0.0%) | 0.0 |
| High School Diploma | 0 (0.0%) | 0.0 |
| College or Associate's Degree | 49 (80.3%) | 613.0 |
| Bachelor's Degree | 0 (0.0%) | 0.0 |
| Graduate Degree | 12 (19.7%) | 500.0 |
| Total | 61 (100.0%) | 285.0 |
Fertility by Education by Marriage Status in Midtown
26.2% of women with births in Midtown are unmarried. Women with the educational attainment of graduate degree are most likely to be married with 100.0% of them married at childbirth, while women with the educational attainment of college or associate's degree are least likely to be married with 32.7% of them unmarried at childbirth.
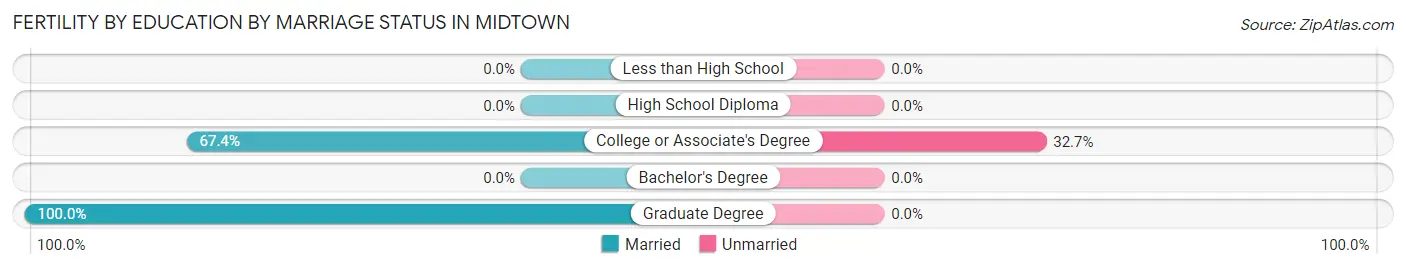
| Educational Attainment | Married | Unmarried |
| Less than High School | 0 (0.0%) | 0 (0.0%) |
| High School Diploma | 0 (0.0%) | 0 (0.0%) |
| College or Associate's Degree | 33 (67.3%) | 16 (32.7%) |
| Bachelor's Degree | 0 (0.0%) | 0 (0.0%) |
| Graduate Degree | 12 (100.0%) | 0 (0.0%) |
| Total | 45 (73.8%) | 16 (26.2%) |
Employment Characteristics in Midtown
Employment by Class of Employer in Midtown
Among the 366 employed individuals in Midtown, private company employees (182 | 49.7%), local government employees (58 | 15.9%), and self-employed (incorporated) (38 | 10.4%) make up the most common classes of employment.
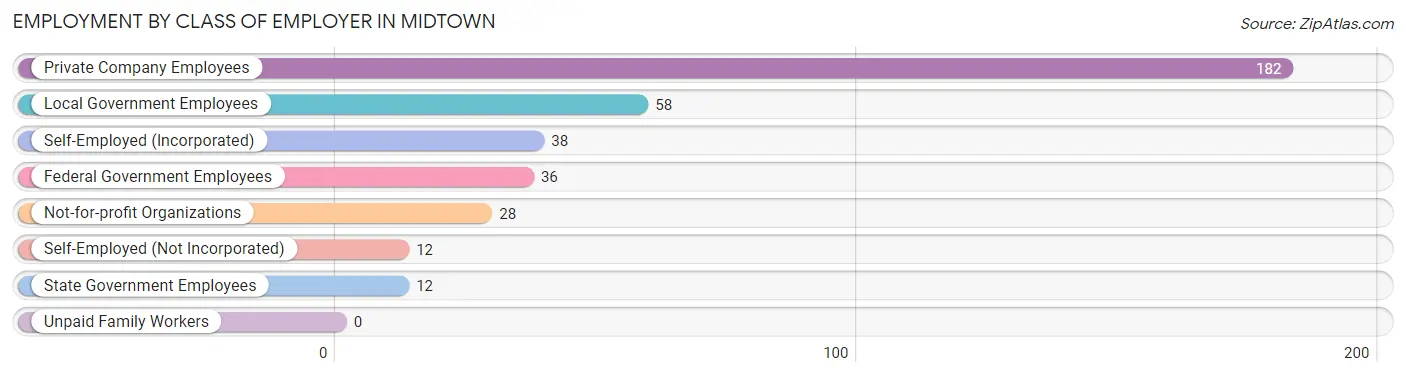
| Employer Class | # Employees | % Employees |
| Private Company Employees | 182 | 49.7% |
| Self-Employed (Incorporated) | 38 | 10.4% |
| Self-Employed (Not Incorporated) | 12 | 3.3% |
| Not-for-profit Organizations | 28 | 7.6% |
| Local Government Employees | 58 | 15.9% |
| State Government Employees | 12 | 3.3% |
| Federal Government Employees | 36 | 9.8% |
| Unpaid Family Workers | 0 | 0.0% |
| Total | 366 | 100.0% |
Employment Status by Age in Midtown
According to the labor force statistics for Midtown, out of the total population over 16 years of age (1,118), 36.9% or 413 individuals are in the labor force, with 7.8% or 32 of them unemployed. The age group with the highest labor force participation rate is 16 to 19 years, with 100.0% or 33 individuals in the labor force. Within the labor force, the 20 to 24 years age range has the highest percentage of unemployed individuals, with 25.3% or 21 of them being unemployed.
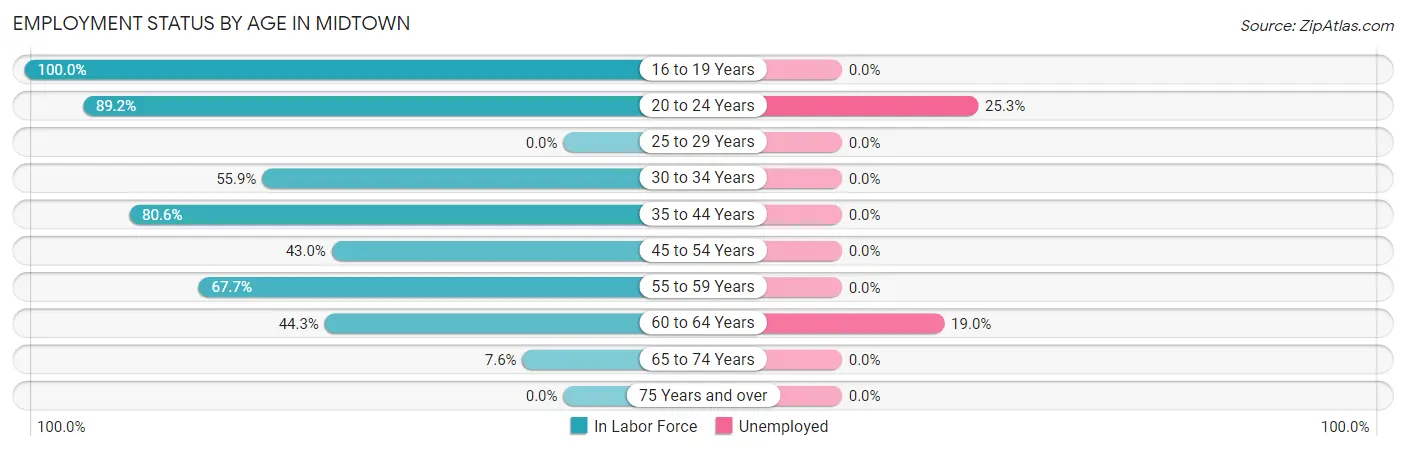
| Age Bracket | In Labor Force | Unemployed |
| 16 to 19 Years | 33 (100.0%) | 0 (0.0%) |
| 20 to 24 Years | 83 (89.2%) | 21 (25.3%) |
| 25 to 29 Years | 0 (0.0%) | 0 (0.0%) |
| 30 to 34 Years | 33 (55.9%) | 0 (0.0%) |
| 35 to 44 Years | 100 (80.6%) | 0 (0.0%) |
| 45 to 54 Years | 46 (43.0%) | 0 (0.0%) |
| 55 to 59 Years | 42 (67.7%) | 0 (0.0%) |
| 60 to 64 Years | 58 (44.3%) | 11 (19.0%) |
| 65 to 74 Years | 17 (7.6%) | 0 (0.0%) |
| 75 Years and over | 0 (0.0%) | 0 (0.0%) |
| Total | 413 (36.9%) | 32 (7.8%) |
Employment Status by Educational Attainment in Midtown
According to labor force statistics for Midtown, 54.1% of individuals (279) out of the total population between 25 and 64 years of age (516) are in the labor force, with 3.9% or 11 of them being unemployed. The group with the highest labor force participation rate are those with the educational attainment of high school diploma, with 74.3% or 153 individuals in the labor force. Within the labor force, individuals with high school diploma education have the highest percentage of unemployment, with 7.2% or 11 of them being unemployed.
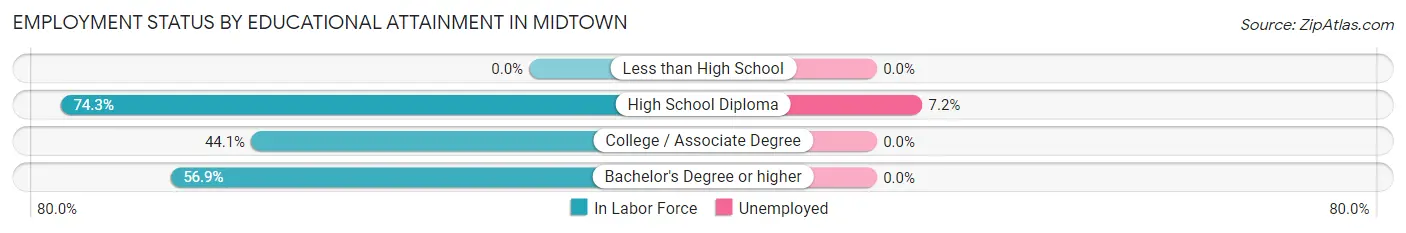
| Educational Attainment | In Labor Force | Unemployed |
| Less than High School | 0 (0.0%) | 0 (0.0%) |
| High School Diploma | 153 (74.3%) | 15 (7.2%) |
| College / Associate Degree | 60 (44.1%) | 0 (0.0%) |
| Bachelor's Degree or higher | 66 (56.9%) | 0 (0.0%) |
| Total | 279 (54.1%) | 20 (3.9%) |
Employment Occupations by Sex in Midtown
Management, Business, Science and Arts Occupations
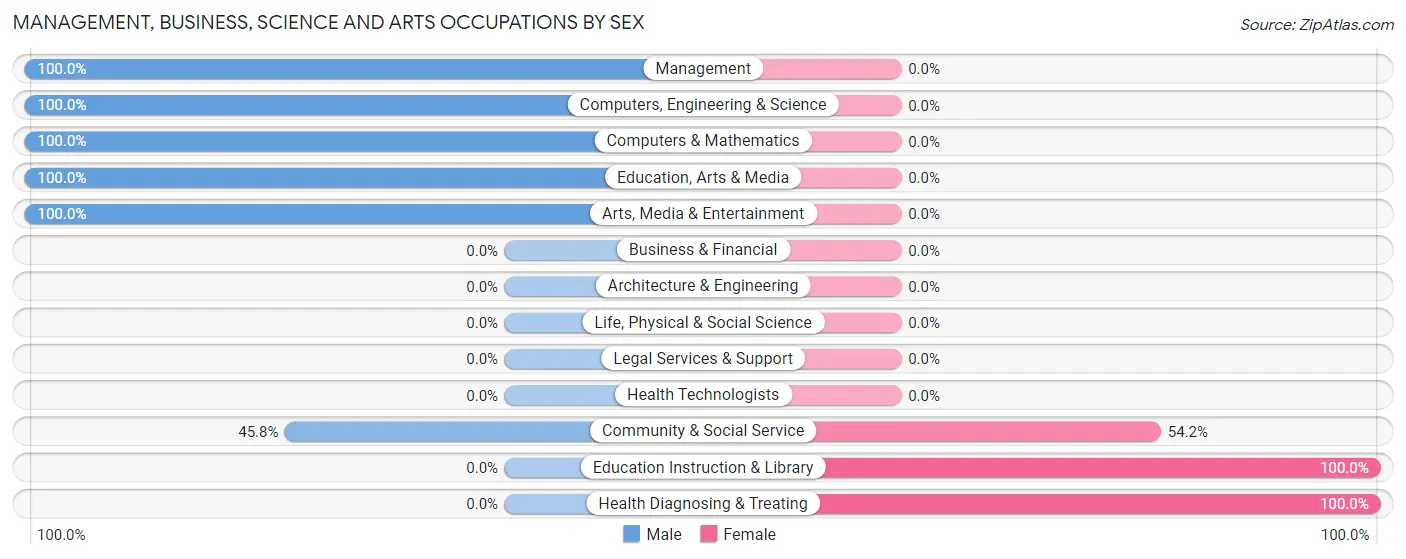
The most common Management, Business, Science and Arts occupations in Midtown are Community & Social Service (48 | 12.6%), Management (28 | 7.4%), Education Instruction & Library (26 | 6.8%), Health Diagnosing & Treating (24 | 6.3%), and Education, Arts & Media (14 | 3.7%).
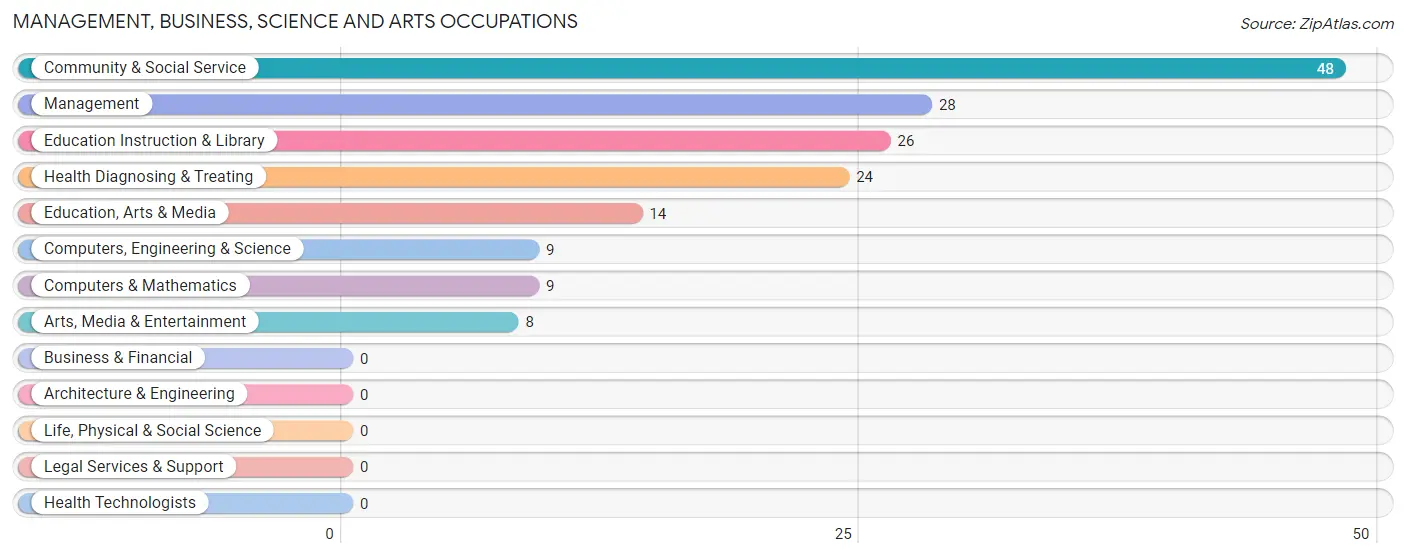
Management, Business, Science and Arts Occupations by Sex
Within the Management, Business, Science and Arts occupations in Midtown, the most male-oriented occupations are Management (100.0%), Computers, Engineering & Science (100.0%), and Computers & Mathematics (100.0%), while the most female-oriented occupations are Education Instruction & Library (100.0%), Health Diagnosing & Treating (100.0%), and Community & Social Service (54.2%).
| Occupation | Male | Female |
| Management | 28 (100.0%) | 0 (0.0%) |
| Business & Financial | 0 (0.0%) | 0 (0.0%) |
| Computers, Engineering & Science | 9 (100.0%) | 0 (0.0%) |
| Computers & Mathematics | 9 (100.0%) | 0 (0.0%) |
| Architecture & Engineering | 0 (0.0%) | 0 (0.0%) |
| Life, Physical & Social Science | 0 (0.0%) | 0 (0.0%) |
| Community & Social Service | 22 (45.8%) | 26 (54.2%) |
| Education, Arts & Media | 14 (100.0%) | 0 (0.0%) |
| Legal Services & Support | 0 (0.0%) | 0 (0.0%) |
| Education Instruction & Library | 0 (0.0%) | 26 (100.0%) |
| Arts, Media & Entertainment | 8 (100.0%) | 0 (0.0%) |
| Health Diagnosing & Treating | 0 (0.0%) | 24 (100.0%) |
| Health Technologists | 0 (0.0%) | 0 (0.0%) |
| Total (Category) | 59 (54.1%) | 50 (45.9%) |
| Total (Overall) | 201 (52.9%) | 179 (47.1%) |
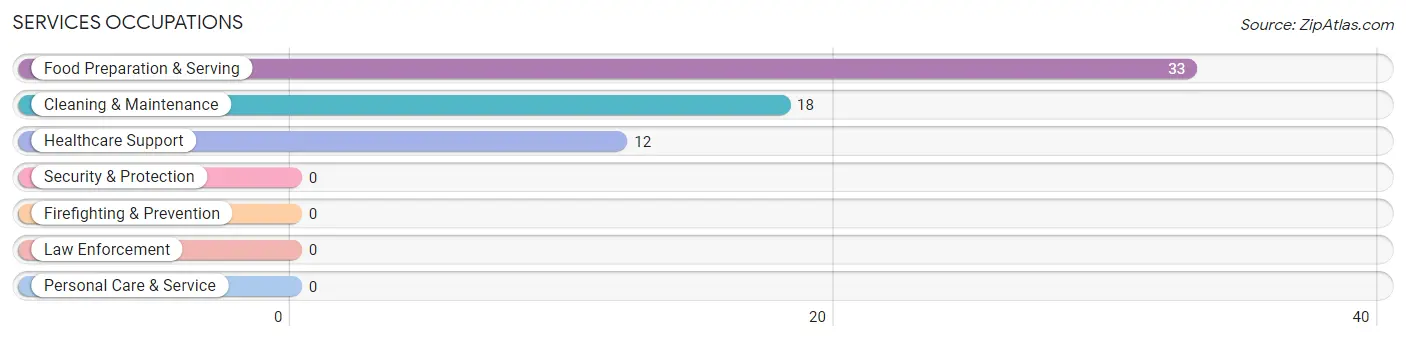
Services Occupations
The most common Services occupations in Midtown are Food Preparation & Serving (33 | 8.7%), Cleaning & Maintenance (18 | 4.7%), and Healthcare Support (12 | 3.2%).
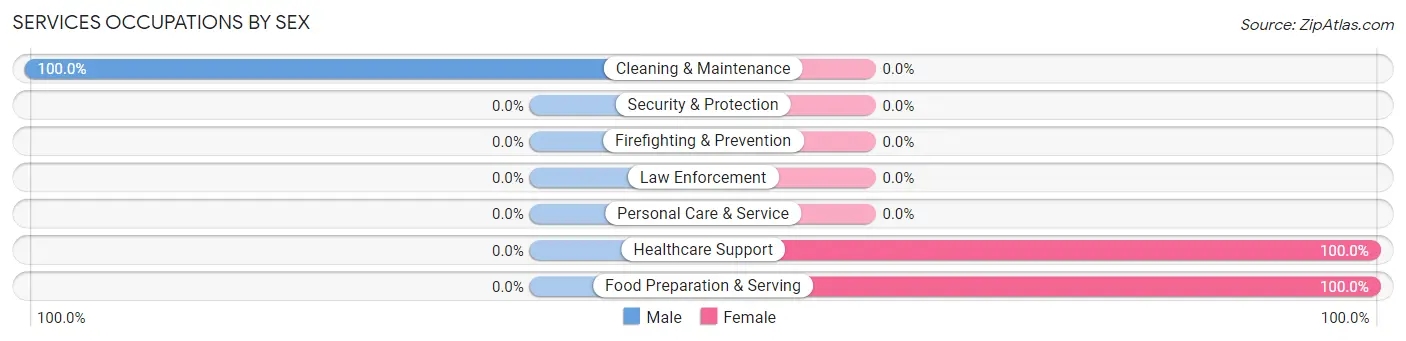
Services Occupations by Sex
| Occupation | Male | Female |
| Healthcare Support | 0 (0.0%) | 12 (100.0%) |
| Security & Protection | 0 (0.0%) | 0 (0.0%) |
| Firefighting & Prevention | 0 (0.0%) | 0 (0.0%) |
| Law Enforcement | 0 (0.0%) | 0 (0.0%) |
| Food Preparation & Serving | 0 (0.0%) | 33 (100.0%) |
| Cleaning & Maintenance | 18 (100.0%) | 0 (0.0%) |
| Personal Care & Service | 0 (0.0%) | 0 (0.0%) |
| Total (Category) | 18 (28.6%) | 45 (71.4%) |
| Total (Overall) | 201 (52.9%) | 179 (47.1%) |
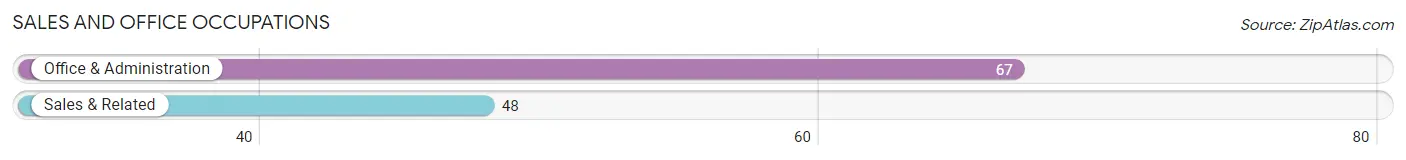
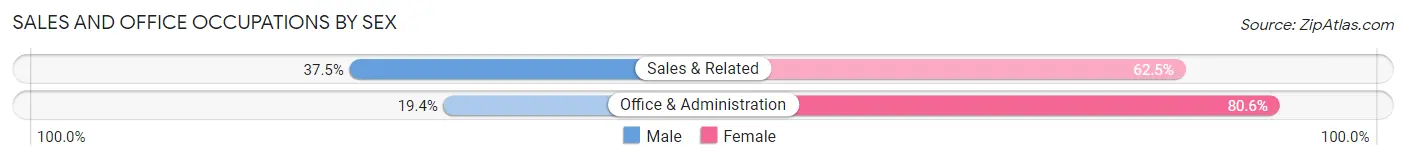
Sales and Office Occupations
The most common Sales and Office occupations in Midtown are Office & Administration (67 | 17.6%), and Sales & Related (48 | 12.6%).
Sales and Office Occupations by Sex
| Occupation | Male | Female |
| Sales & Related | 18 (37.5%) | 30 (62.5%) |
| Office & Administration | 13 (19.4%) | 54 (80.6%) |
| Total (Category) | 31 (27.0%) | 84 (73.0%) |
| Total (Overall) | 201 (52.9%) | 179 (47.1%) |
Natural Resources, Construction and Maintenance Occupations
The most common Natural Resources, Construction and Maintenance occupations in Midtown are , and Construction & Extraction (17 | 4.5%).

Natural Resources, Construction and Maintenance Occupations by Sex

| Occupation | Male | Female |
| Farming, Fishing & Forestry | 0 (0.0%) | 0 (0.0%) |
| Construction & Extraction | 17 (100.0%) | 0 (0.0%) |
| Installation, Maintenance & Repair | 0 (0.0%) | 0 (0.0%) |
| Total (Category) | 17 (100.0%) | 0 (0.0%) |
| Total (Overall) | 201 (52.9%) | 179 (47.1%) |
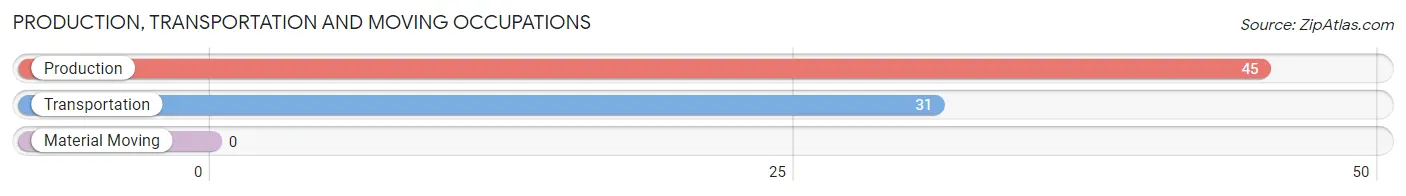
Production, Transportation and Moving Occupations
The most common Production, Transportation and Moving occupations in Midtown are Production (45 | 11.8%), and Transportation (31 | 8.2%).
Production, Transportation and Moving Occupations by Sex
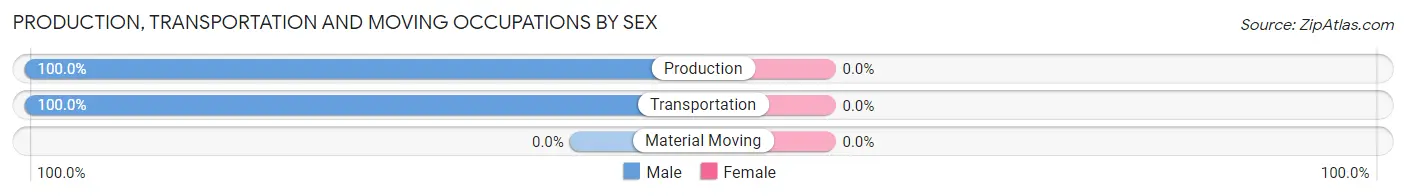
| Occupation | Male | Female |
| Production | 45 (100.0%) | 0 (0.0%) |
| Transportation | 31 (100.0%) | 0 (0.0%) |
| Material Moving | 0 (0.0%) | 0 (0.0%) |
| Total (Category) | 76 (100.0%) | 0 (0.0%) |
| Total (Overall) | 201 (52.9%) | 179 (47.1%) |
Employment Industries by Sex in Midtown
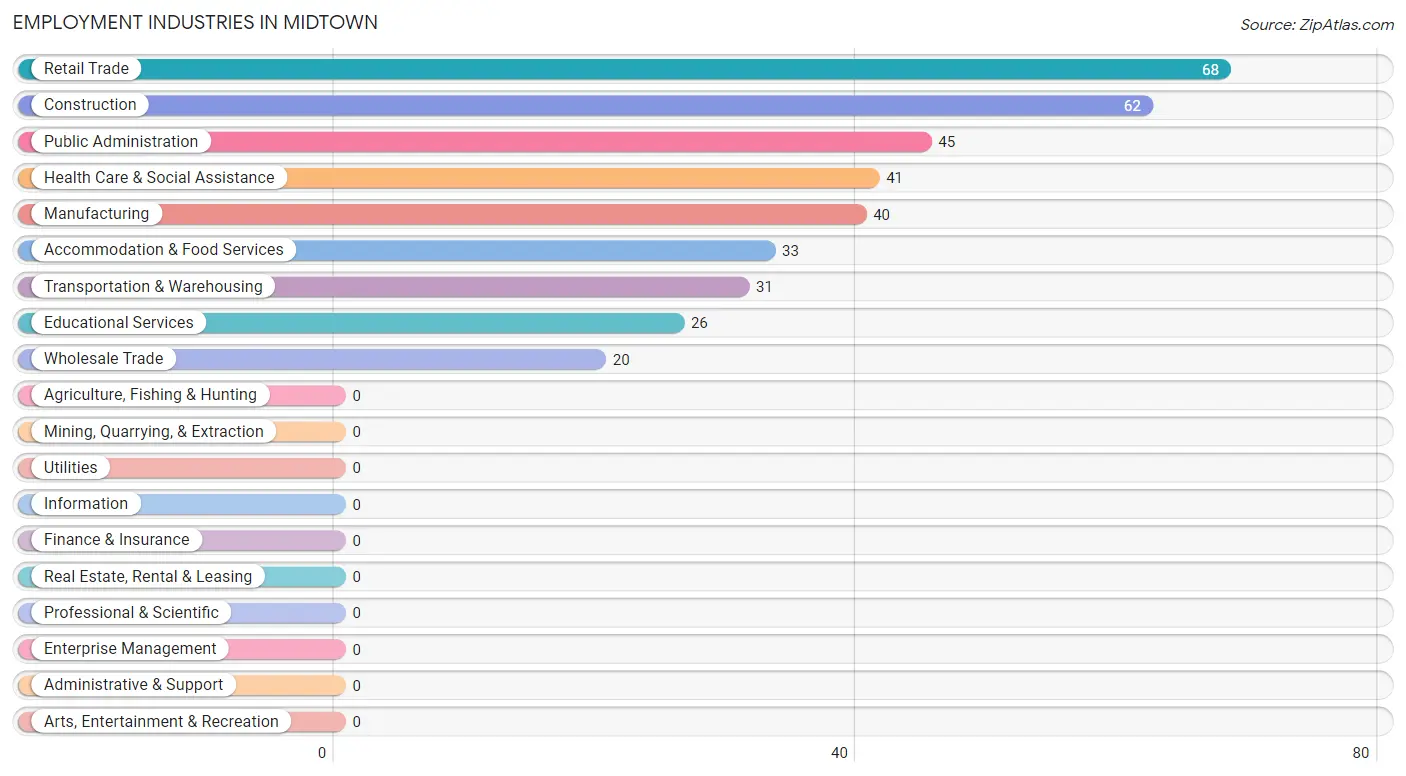
Employment Industries in Midtown
The major employment industries in Midtown include Retail Trade (68 | 17.9%), Construction (62 | 16.3%), Public Administration (45 | 11.8%), Health Care & Social Assistance (41 | 10.8%), and Manufacturing (40 | 10.5%).
Employment Industries by Sex in Midtown
The Midtown industries that see more men than women are Construction (100.0%), Wholesale Trade (100.0%), and Transportation & Warehousing (100.0%), whereas the industries that tend to have a higher number of women are Educational Services (100.0%), Health Care & Social Assistance (100.0%), and Accommodation & Food Services (100.0%).
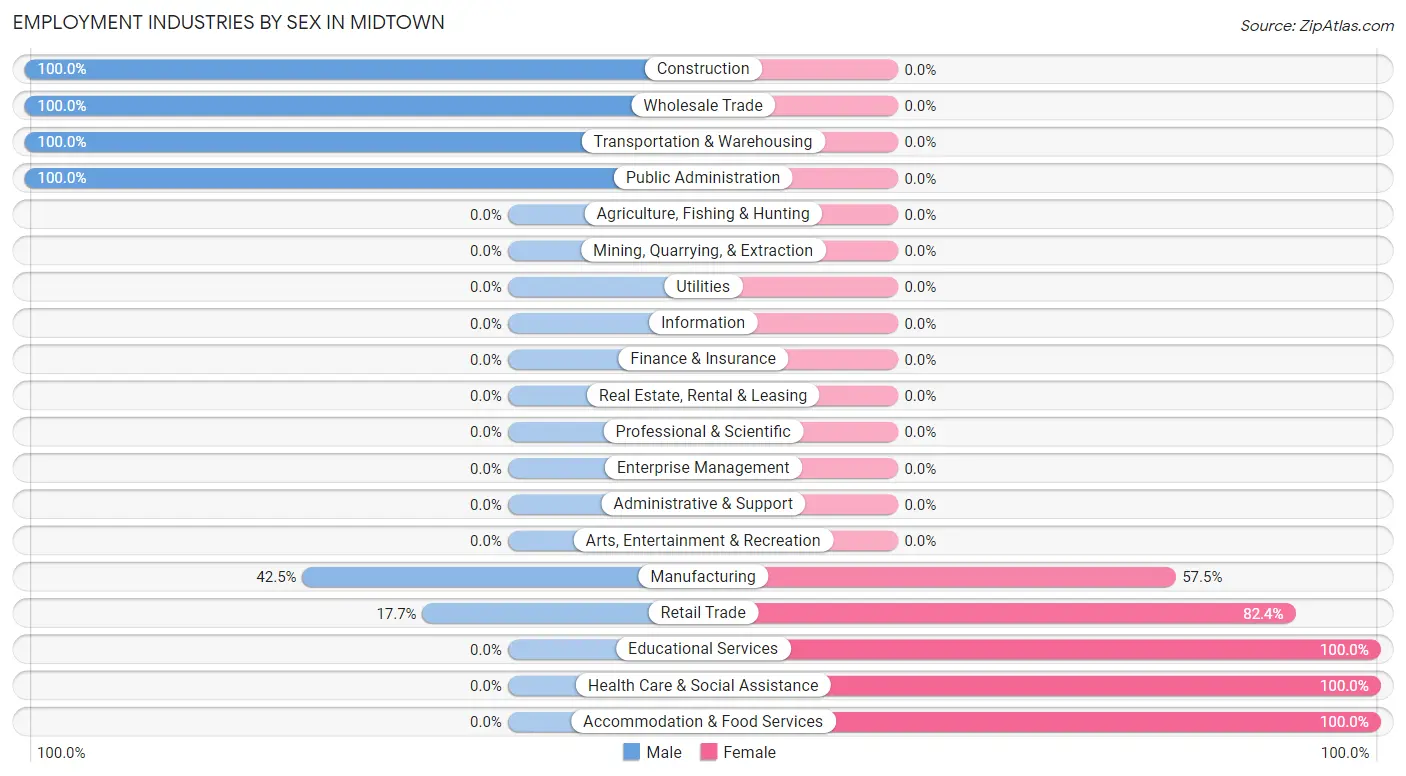
| Industry | Male | Female |
| Agriculture, Fishing & Hunting | 0 (0.0%) | 0 (0.0%) |
| Mining, Quarrying, & Extraction | 0 (0.0%) | 0 (0.0%) |
| Construction | 62 (100.0%) | 0 (0.0%) |
| Manufacturing | 17 (42.5%) | 23 (57.5%) |
| Wholesale Trade | 20 (100.0%) | 0 (0.0%) |
| Retail Trade | 12 (17.6%) | 56 (82.4%) |
| Transportation & Warehousing | 31 (100.0%) | 0 (0.0%) |
| Utilities | 0 (0.0%) | 0 (0.0%) |
| Information | 0 (0.0%) | 0 (0.0%) |
| Finance & Insurance | 0 (0.0%) | 0 (0.0%) |
| Real Estate, Rental & Leasing | 0 (0.0%) | 0 (0.0%) |
| Professional & Scientific | 0 (0.0%) | 0 (0.0%) |
| Enterprise Management | 0 (0.0%) | 0 (0.0%) |
| Administrative & Support | 0 (0.0%) | 0 (0.0%) |
| Educational Services | 0 (0.0%) | 26 (100.0%) |
| Health Care & Social Assistance | 0 (0.0%) | 41 (100.0%) |
| Arts, Entertainment & Recreation | 0 (0.0%) | 0 (0.0%) |
| Accommodation & Food Services | 0 (0.0%) | 33 (100.0%) |
| Public Administration | 45 (100.0%) | 0 (0.0%) |
| Total | 201 (52.9%) | 179 (47.1%) |
Education in Midtown
School Enrollment in Midtown
The most common levels of schooling among the 134 students in Midtown are elementary school (36 | 26.9%), high school (33 | 24.6%), and middle school (26 | 19.4%).
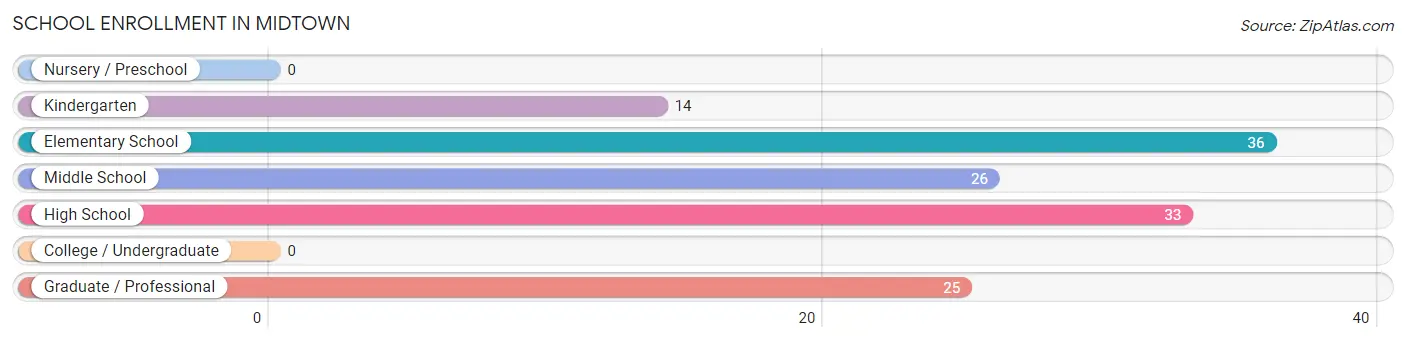
| School Level | # Students | % Students |
| Nursery / Preschool | 0 | 0.0% |
| Kindergarten | 14 | 10.4% |
| Elementary School | 36 | 26.9% |
| Middle School | 26 | 19.4% |
| High School | 33 | 24.6% |
| College / Undergraduate | 0 | 0.0% |
| Graduate / Professional | 25 | 18.7% |
| Total | 134 | 100.0% |
School Enrollment by Age by Funding Source in Midtown
Out of a total of 134 students who are enrolled in schools in Midtown, 30 (22.4%) attend a private institution, while the remaining 104 (77.6%) are enrolled in public schools. The age group of 15 to 17 year olds has the highest likelihood of being enrolled in private schools, with 16 (48.5% in the age bracket) enrolled. Conversely, the age group of 10 to 14 year olds has the lowest likelihood of being enrolled in a private school, with 26 (100.0% in the age bracket) attending a public institution.
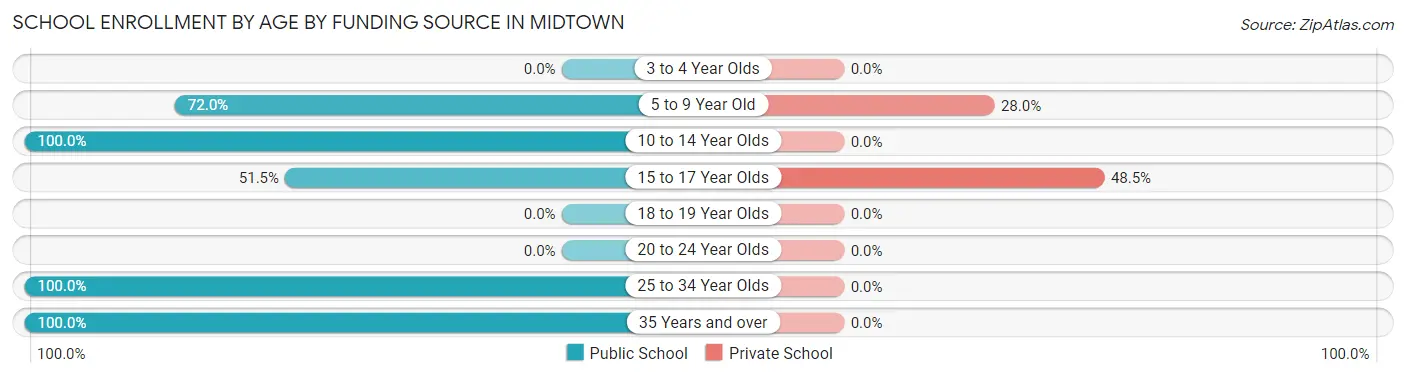
| Age Bracket | Public School | Private School |
| 3 to 4 Year Olds | 0 (0.0%) | 0 (0.0%) |
| 5 to 9 Year Old | 36 (72.0%) | 14 (28.0%) |
| 10 to 14 Year Olds | 26 (100.0%) | 0 (0.0%) |
| 15 to 17 Year Olds | 17 (51.5%) | 16 (48.5%) |
| 18 to 19 Year Olds | 0 (0.0%) | 0 (0.0%) |
| 20 to 24 Year Olds | 0 (0.0%) | 0 (0.0%) |
| 25 to 34 Year Olds | 14 (100.0%) | 0 (0.0%) |
| 35 Years and over | 11 (100.0%) | 0 (0.0%) |
| Total | 104 (77.6%) | 30 (22.4%) |
Educational Attainment by Field of Study in Midtown
Psychology (49 | 27.1%), arts & humanities (38 | 21.0%), science & technology (34 | 18.8%), business (20 | 11.1%), and physical & health sciences (14 | 7.7%) are the most common fields of study among 181 individuals in Midtown who have obtained a bachelor's degree or higher.
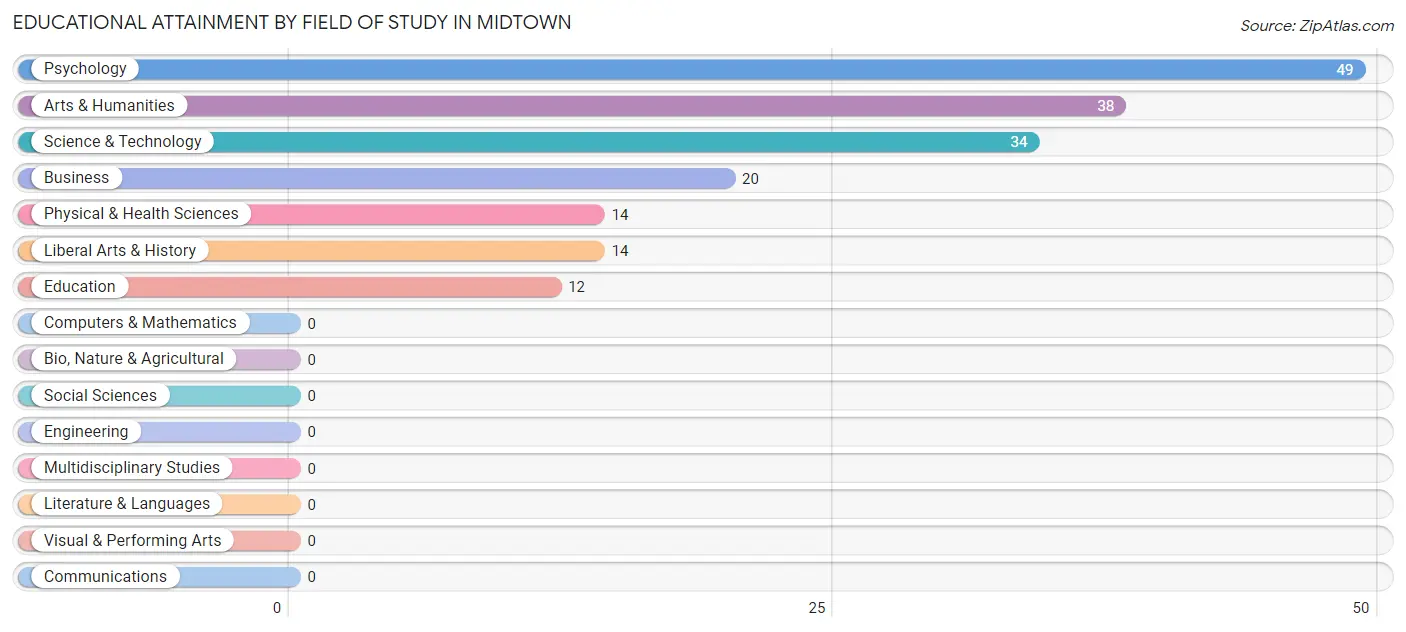
| Field of Study | # Graduates | % Graduates |
| Computers & Mathematics | 0 | 0.0% |
| Bio, Nature & Agricultural | 0 | 0.0% |
| Physical & Health Sciences | 14 | 7.7% |
| Psychology | 49 | 27.1% |
| Social Sciences | 0 | 0.0% |
| Engineering | 0 | 0.0% |
| Multidisciplinary Studies | 0 | 0.0% |
| Science & Technology | 34 | 18.8% |
| Business | 20 | 11.1% |
| Education | 12 | 6.6% |
| Literature & Languages | 0 | 0.0% |
| Liberal Arts & History | 14 | 7.7% |
| Visual & Performing Arts | 0 | 0.0% |
| Communications | 0 | 0.0% |
| Arts & Humanities | 38 | 21.0% |
| Total | 181 | 100.0% |
Transportation & Commute in Midtown
Vehicle Availability by Sex in Midtown
The most prevalent vehicle ownership categories in Midtown are males with 2 vehicles (74, accounting for 36.8%) and females with 2 vehicles (42, making up 49.0%).
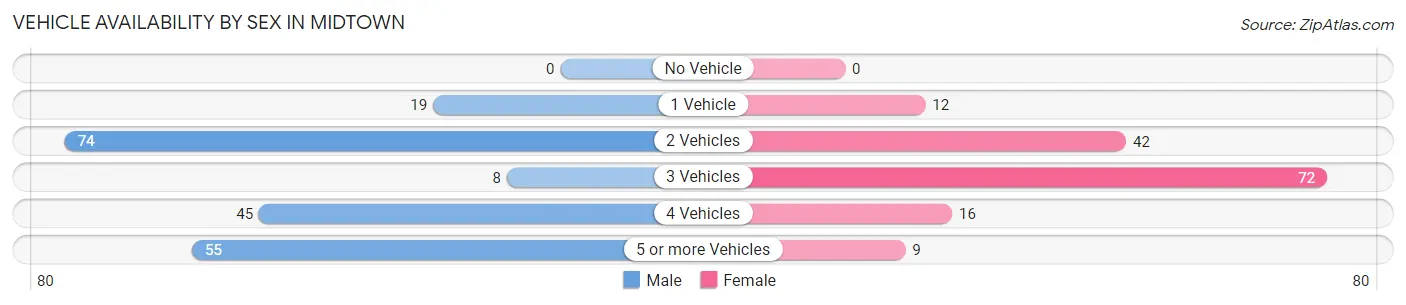
| Vehicles Available | Male | Female |
| No Vehicle | 0 (0.0%) | 0 (0.0%) |
| 1 Vehicle | 19 (9.5%) | 12 (8.0%) |
| 2 Vehicles | 74 (36.8%) | 42 (27.8%) |
| 3 Vehicles | 8 (4.0%) | 72 (47.7%) |
| 4 Vehicles | 45 (22.4%) | 16 (10.6%) |
| 5 or more Vehicles | 55 (27.4%) | 9 (6.0%) |
| Total | 201 (100.0%) | 151 (100.0%) |
Commute Time in Midtown
The most frequently occuring commute durations in Midtown are 45 to 59 minutes (58 commuters, 15.9%), 10 to 14 minutes (53 commuters, 14.5%), and 35 to 39 minutes (47 commuters, 12.8%).
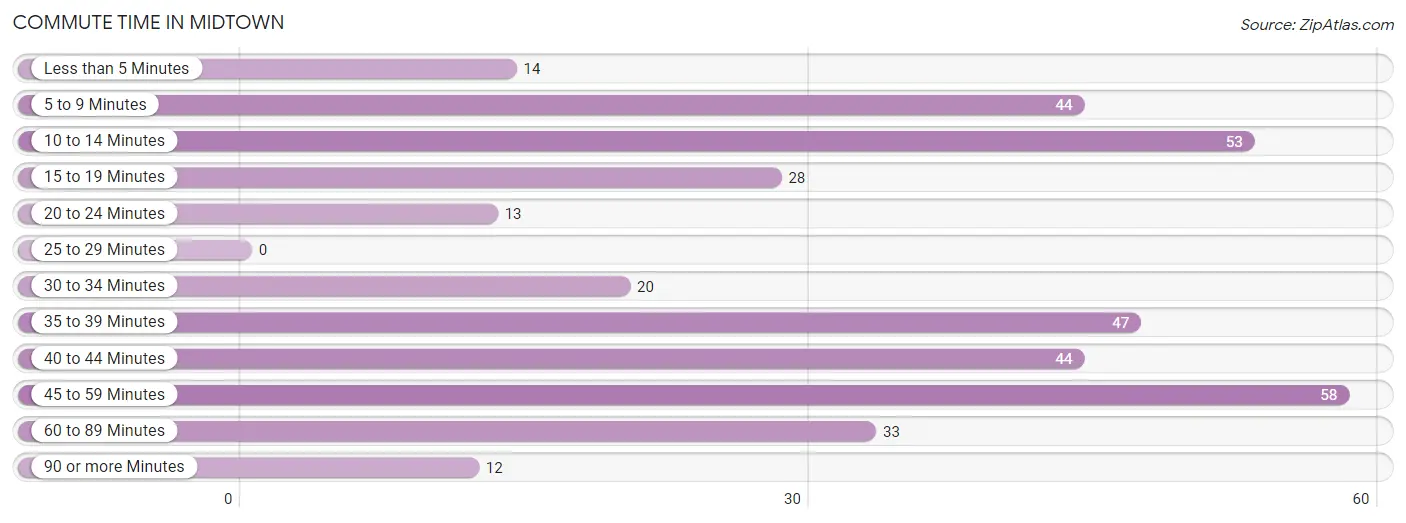
| Commute Time | # Commuters | % Commuters |
| Less than 5 Minutes | 14 | 3.8% |
| 5 to 9 Minutes | 44 | 12.0% |
| 10 to 14 Minutes | 53 | 14.5% |
| 15 to 19 Minutes | 28 | 7.6% |
| 20 to 24 Minutes | 13 | 3.5% |
| 25 to 29 Minutes | 0 | 0.0% |
| 30 to 34 Minutes | 20 | 5.5% |
| 35 to 39 Minutes | 47 | 12.8% |
| 40 to 44 Minutes | 44 | 12.0% |
| 45 to 59 Minutes | 58 | 15.9% |
| 60 to 89 Minutes | 33 | 9.0% |
| 90 or more Minutes | 12 | 3.3% |
Commute Time by Sex in Midtown
The most common commute times in Midtown are 45 to 59 minutes (58 commuters, 28.9%) for males and 10 to 14 minutes (43 commuters, 26.1%) for females.
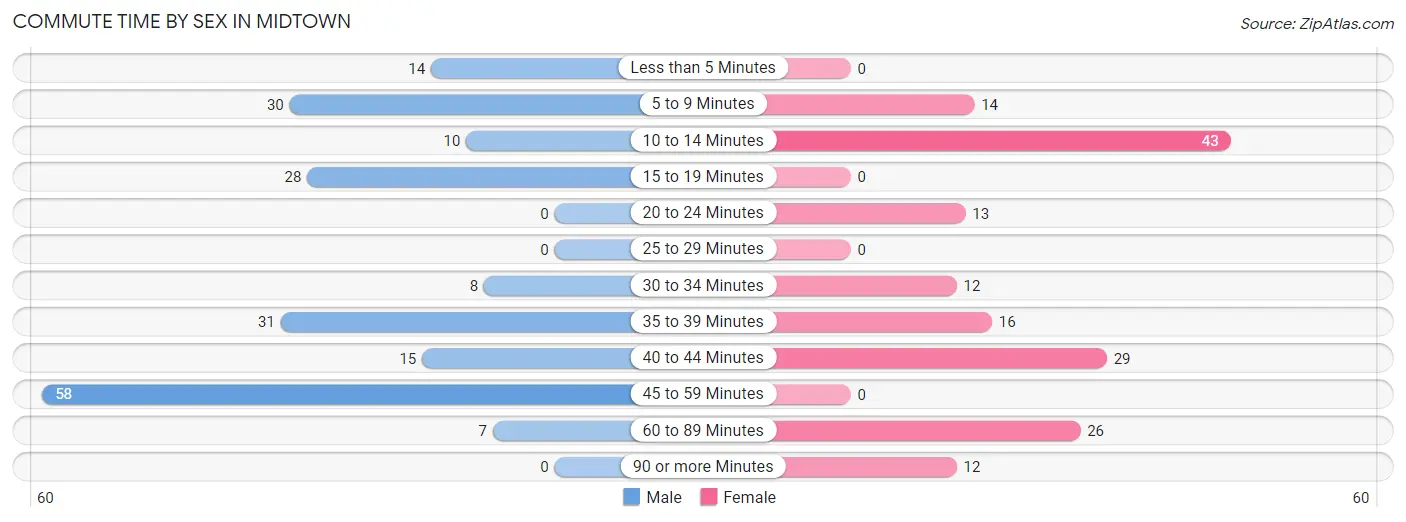
| Commute Time | Male | Female |
| Less than 5 Minutes | 14 (7.0%) | 0 (0.0%) |
| 5 to 9 Minutes | 30 (14.9%) | 14 (8.5%) |
| 10 to 14 Minutes | 10 (5.0%) | 43 (26.1%) |
| 15 to 19 Minutes | 28 (13.9%) | 0 (0.0%) |
| 20 to 24 Minutes | 0 (0.0%) | 13 (7.9%) |
| 25 to 29 Minutes | 0 (0.0%) | 0 (0.0%) |
| 30 to 34 Minutes | 8 (4.0%) | 12 (7.3%) |
| 35 to 39 Minutes | 31 (15.4%) | 16 (9.7%) |
| 40 to 44 Minutes | 15 (7.5%) | 29 (17.6%) |
| 45 to 59 Minutes | 58 (28.9%) | 0 (0.0%) |
| 60 to 89 Minutes | 7 (3.5%) | 26 (15.8%) |
| 90 or more Minutes | 0 (0.0%) | 12 (7.3%) |
Time of Departure to Work by Sex in Midtown
The most frequent times of departure to work in Midtown are 12:00 AM to 4:59 AM (72, 35.8%) for males and 7:00 AM to 7:29 AM (47, 28.5%) for females.
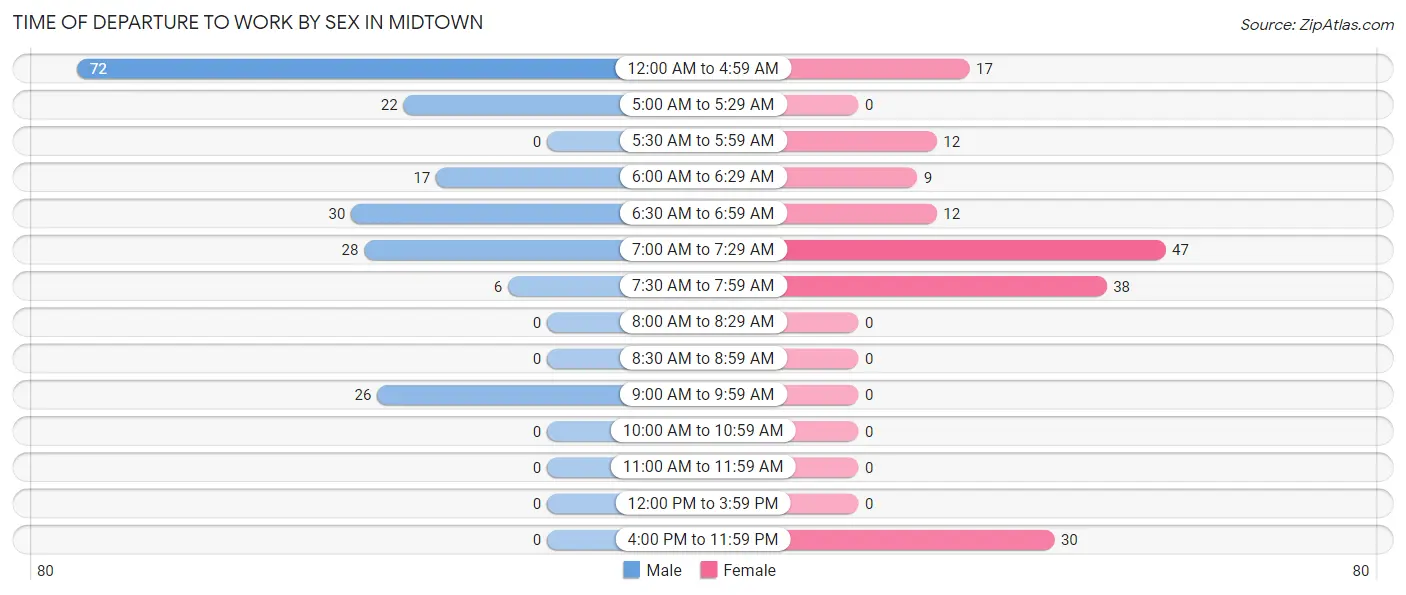
| Time of Departure | Male | Female |
| 12:00 AM to 4:59 AM | 72 (35.8%) | 17 (10.3%) |
| 5:00 AM to 5:29 AM | 22 (11.0%) | 0 (0.0%) |
| 5:30 AM to 5:59 AM | 0 (0.0%) | 12 (7.3%) |
| 6:00 AM to 6:29 AM | 17 (8.5%) | 9 (5.4%) |
| 6:30 AM to 6:59 AM | 30 (14.9%) | 12 (7.3%) |
| 7:00 AM to 7:29 AM | 28 (13.9%) | 47 (28.5%) |
| 7:30 AM to 7:59 AM | 6 (3.0%) | 38 (23.0%) |
| 8:00 AM to 8:29 AM | 0 (0.0%) | 0 (0.0%) |
| 8:30 AM to 8:59 AM | 0 (0.0%) | 0 (0.0%) |
| 9:00 AM to 9:59 AM | 26 (12.9%) | 0 (0.0%) |
| 10:00 AM to 10:59 AM | 0 (0.0%) | 0 (0.0%) |
| 11:00 AM to 11:59 AM | 0 (0.0%) | 0 (0.0%) |
| 12:00 PM to 3:59 PM | 0 (0.0%) | 0 (0.0%) |
| 4:00 PM to 11:59 PM | 0 (0.0%) | 30 (18.2%) |
| Total | 201 (100.0%) | 165 (100.0%) |
Housing Occupancy in Midtown
Occupancy by Ownership in Midtown
Of the total 569 dwellings in Midtown, owner-occupied units account for 331 (58.2%), while renter-occupied units make up 238 (41.8%).
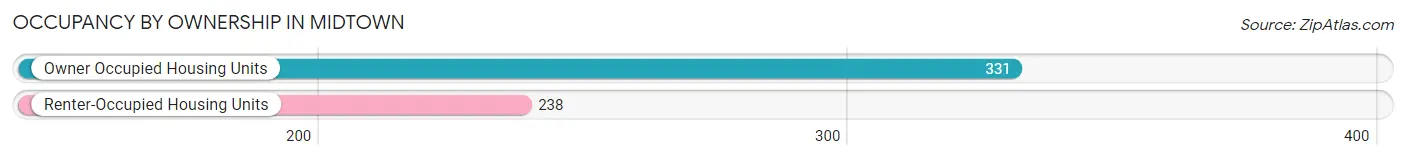
| Occupancy | # Housing Units | % Housing Units |
| Owner Occupied Housing Units | 331 | 58.2% |
| Renter-Occupied Housing Units | 238 | 41.8% |
| Total Occupied Housing Units | 569 | 100.0% |
Occupancy by Household Size in Midtown
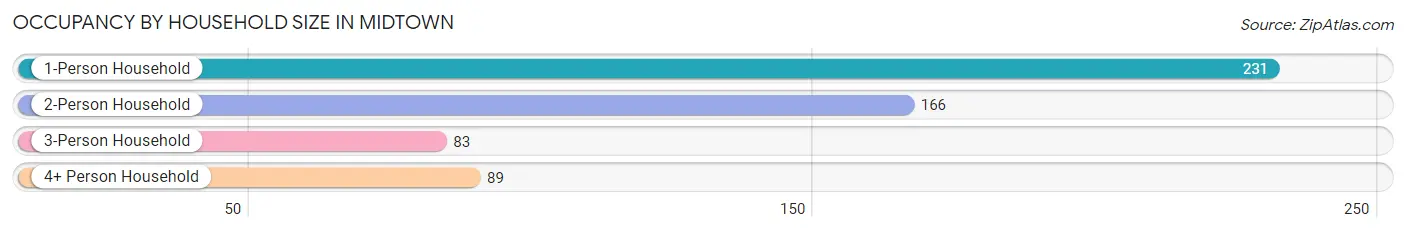
| Household Size | # Housing Units | % Housing Units |
| 1-Person Household | 231 | 40.6% |
| 2-Person Household | 166 | 29.2% |
| 3-Person Household | 83 | 14.6% |
| 4+ Person Household | 89 | 15.6% |
| Total Housing Units | 569 | 100.0% |
Occupancy by Ownership by Household Size in Midtown
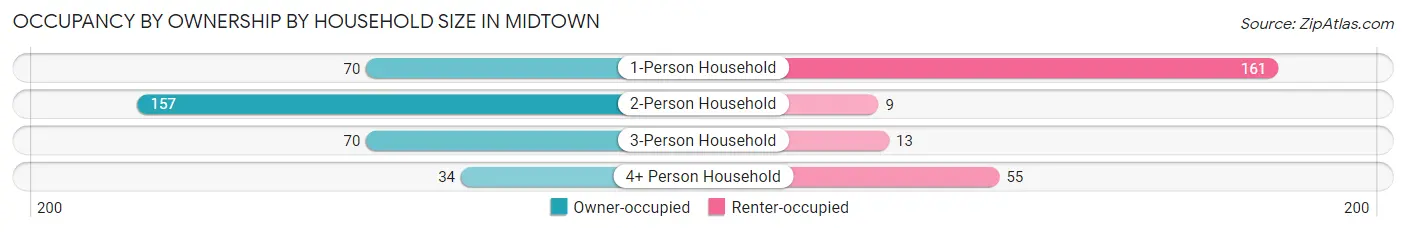
| Household Size | Owner-occupied | Renter-occupied |
| 1-Person Household | 70 (30.3%) | 161 (69.7%) |
| 2-Person Household | 157 (94.6%) | 9 (5.4%) |
| 3-Person Household | 70 (84.3%) | 13 (15.7%) |
| 4+ Person Household | 34 (38.2%) | 55 (61.8%) |
| Total Housing Units | 331 (58.2%) | 238 (41.8%) |
Occupancy by Educational Attainment in Midtown
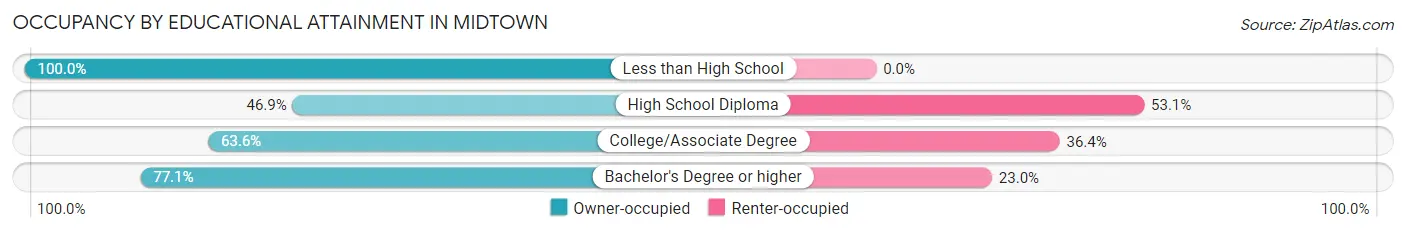
| Household Size | Owner-occupied | Renter-occupied |
| Less than High School | 62 (100.0%) | 0 (0.0%) |
| High School Diploma | 173 (46.9%) | 196 (53.1%) |
| College/Associate Degree | 49 (63.6%) | 28 (36.4%) |
| Bachelor's Degree or higher | 47 (77.0%) | 14 (23.0%) |
Occupancy by Age of Householder in Midtown
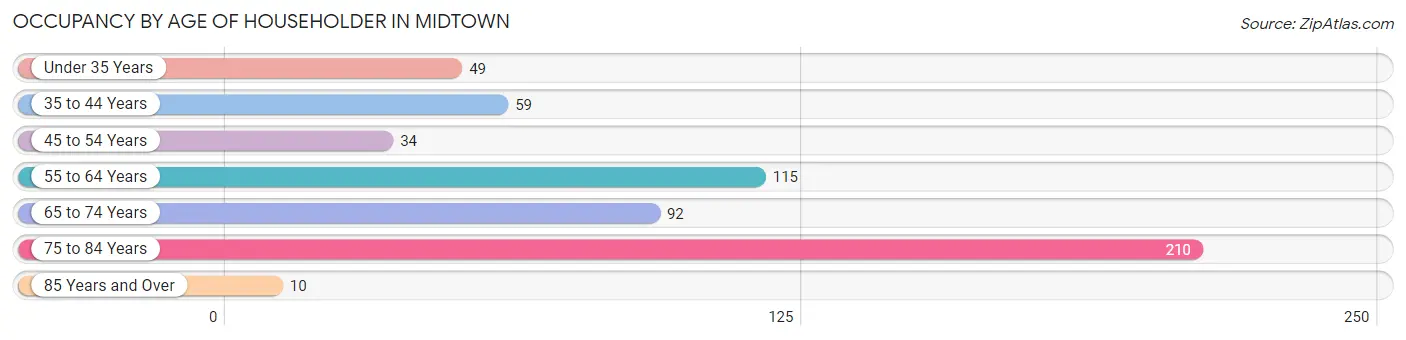
| Age Bracket | # Households | % Households |
| Under 35 Years | 49 | 8.6% |
| 35 to 44 Years | 59 | 10.4% |
| 45 to 54 Years | 34 | 6.0% |
| 55 to 64 Years | 115 | 20.2% |
| 65 to 74 Years | 92 | 16.2% |
| 75 to 84 Years | 210 | 36.9% |
| 85 Years and Over | 10 | 1.8% |
| Total | 569 | 100.0% |
Housing Finances in Midtown
Median Income by Occupancy in Midtown
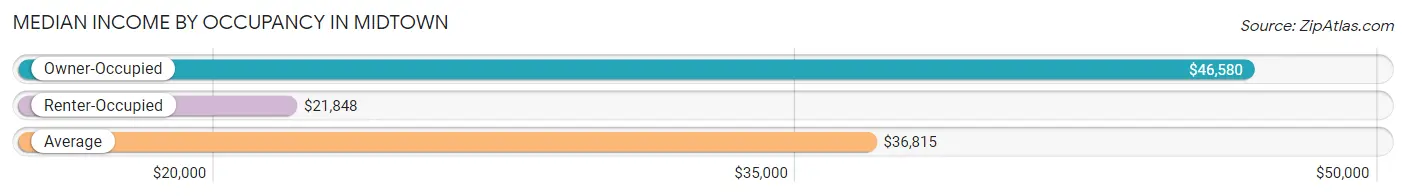
| Occupancy Type | # Households | Median Income |
| Owner-Occupied | 331 (58.2%) | $46,580 |
| Renter-Occupied | 238 (41.8%) | $21,848 |
| Average | 569 (100.0%) | $36,815 |
Occupancy by Householder Income Bracket in Midtown
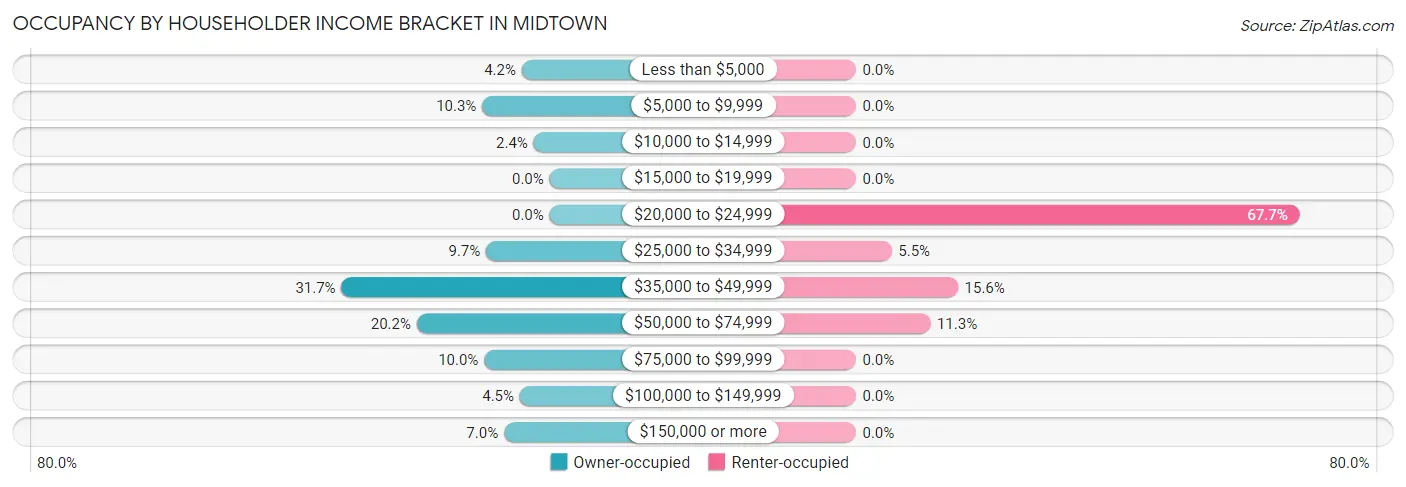
| Income Bracket | Owner-occupied | Renter-occupied |
| Less than $5,000 | 14 (4.2%) | 0 (0.0%) |
| $5,000 to $9,999 | 34 (10.3%) | 0 (0.0%) |
| $10,000 to $14,999 | 8 (2.4%) | 0 (0.0%) |
| $15,000 to $19,999 | 0 (0.0%) | 0 (0.0%) |
| $20,000 to $24,999 | 0 (0.0%) | 161 (67.6%) |
| $25,000 to $34,999 | 32 (9.7%) | 13 (5.5%) |
| $35,000 to $49,999 | 105 (31.7%) | 37 (15.5%) |
| $50,000 to $74,999 | 67 (20.2%) | 27 (11.3%) |
| $75,000 to $99,999 | 33 (10.0%) | 0 (0.0%) |
| $100,000 to $149,999 | 15 (4.5%) | 0 (0.0%) |
| $150,000 or more | 23 (7.0%) | 0 (0.0%) |
| Total | 331 (100.0%) | 238 (100.0%) |
Monthly Housing Cost Tiers in Midtown
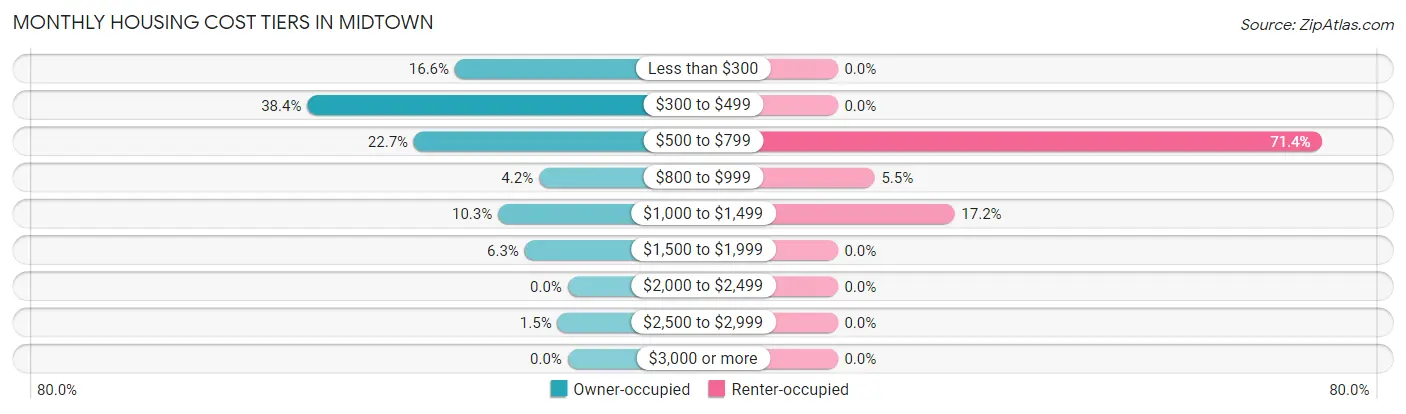
| Monthly Cost | Owner-occupied | Renter-occupied |
| Less than $300 | 55 (16.6%) | 0 (0.0%) |
| $300 to $499 | 127 (38.4%) | 0 (0.0%) |
| $500 to $799 | 75 (22.7%) | 170 (71.4%) |
| $800 to $999 | 14 (4.2%) | 13 (5.5%) |
| $1,000 to $1,499 | 34 (10.3%) | 41 (17.2%) |
| $1,500 to $1,999 | 21 (6.3%) | 0 (0.0%) |
| $2,000 to $2,499 | 0 (0.0%) | 0 (0.0%) |
| $2,500 to $2,999 | 5 (1.5%) | 0 (0.0%) |
| $3,000 or more | 0 (0.0%) | 0 (0.0%) |
| Total | 331 (100.0%) | 238 (100.0%) |
Physical Housing Characteristics in Midtown
Housing Structures in Midtown
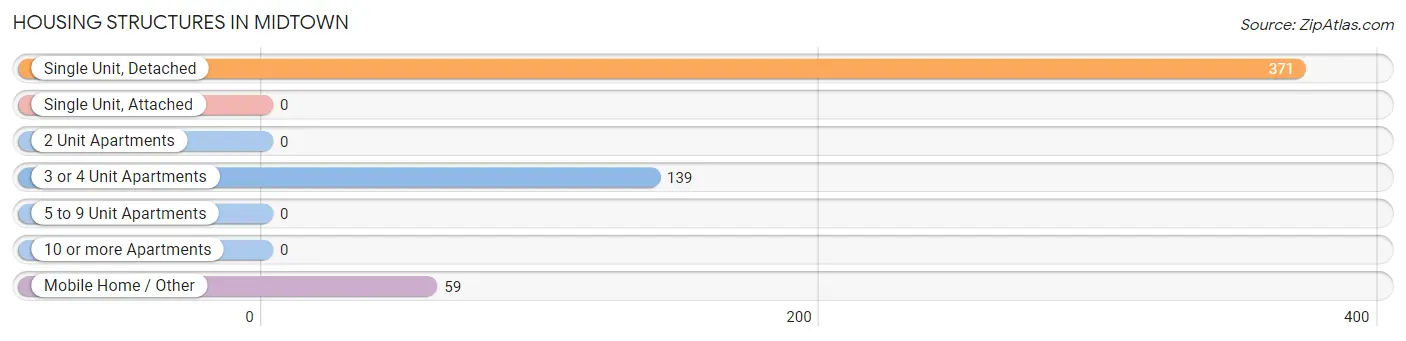
| Structure Type | # Housing Units | % Housing Units |
| Single Unit, Detached | 371 | 65.2% |
| Single Unit, Attached | 0 | 0.0% |
| 2 Unit Apartments | 0 | 0.0% |
| 3 or 4 Unit Apartments | 139 | 24.4% |
| 5 to 9 Unit Apartments | 0 | 0.0% |
| 10 or more Apartments | 0 | 0.0% |
| Mobile Home / Other | 59 | 10.4% |
| Total | 569 | 100.0% |
Housing Structures by Occupancy in Midtown
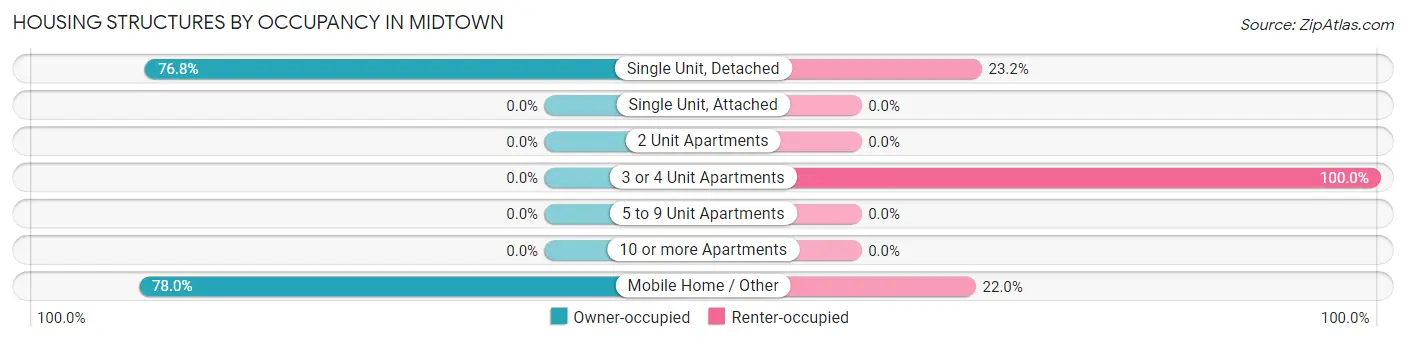
| Structure Type | Owner-occupied | Renter-occupied |
| Single Unit, Detached | 285 (76.8%) | 86 (23.2%) |
| Single Unit, Attached | 0 (0.0%) | 0 (0.0%) |
| 2 Unit Apartments | 0 (0.0%) | 0 (0.0%) |
| 3 or 4 Unit Apartments | 0 (0.0%) | 139 (100.0%) |
| 5 to 9 Unit Apartments | 0 (0.0%) | 0 (0.0%) |
| 10 or more Apartments | 0 (0.0%) | 0 (0.0%) |
| Mobile Home / Other | 46 (78.0%) | 13 (22.0%) |
| Total | 331 (58.2%) | 238 (41.8%) |
Housing Structures by Number of Rooms in Midtown
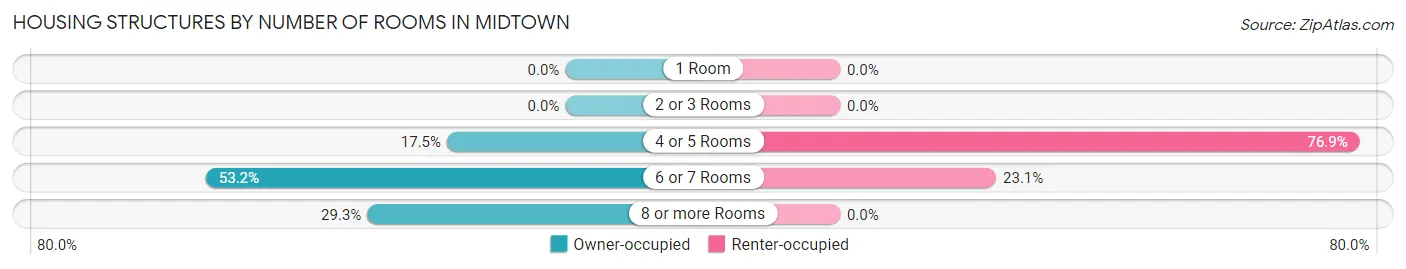
| Number of Rooms | Owner-occupied | Renter-occupied |
| 1 Room | 0 (0.0%) | 0 (0.0%) |
| 2 or 3 Rooms | 0 (0.0%) | 0 (0.0%) |
| 4 or 5 Rooms | 58 (17.5%) | 183 (76.9%) |
| 6 or 7 Rooms | 176 (53.2%) | 55 (23.1%) |
| 8 or more Rooms | 97 (29.3%) | 0 (0.0%) |
| Total | 331 (100.0%) | 238 (100.0%) |
Housing Structure by Heating Type in Midtown
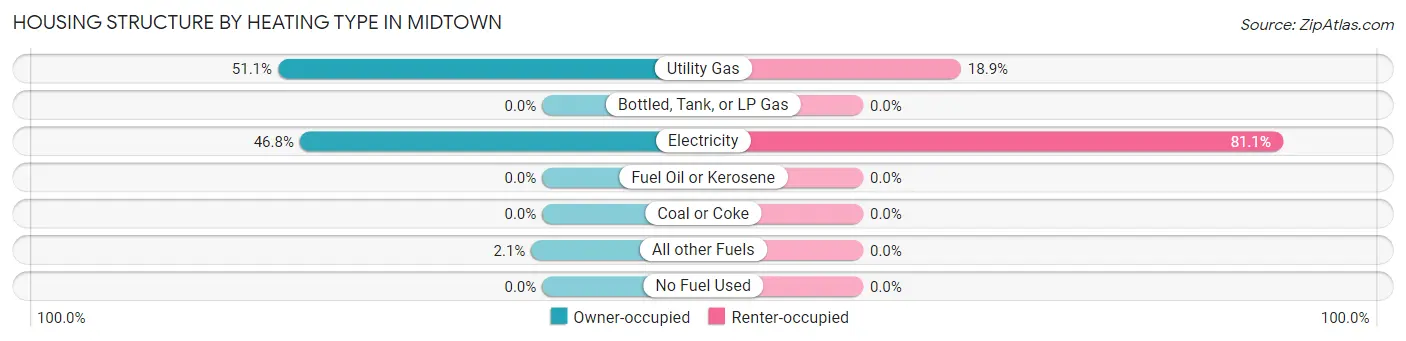
| Heating Type | Owner-occupied | Renter-occupied |
| Utility Gas | 169 (51.1%) | 45 (18.9%) |
| Bottled, Tank, or LP Gas | 0 (0.0%) | 0 (0.0%) |
| Electricity | 155 (46.8%) | 193 (81.1%) |
| Fuel Oil or Kerosene | 0 (0.0%) | 0 (0.0%) |
| Coal or Coke | 0 (0.0%) | 0 (0.0%) |
| All other Fuels | 7 (2.1%) | 0 (0.0%) |
| No Fuel Used | 0 (0.0%) | 0 (0.0%) |
| Total | 331 (100.0%) | 238 (100.0%) |
Household Vehicle Usage in Midtown
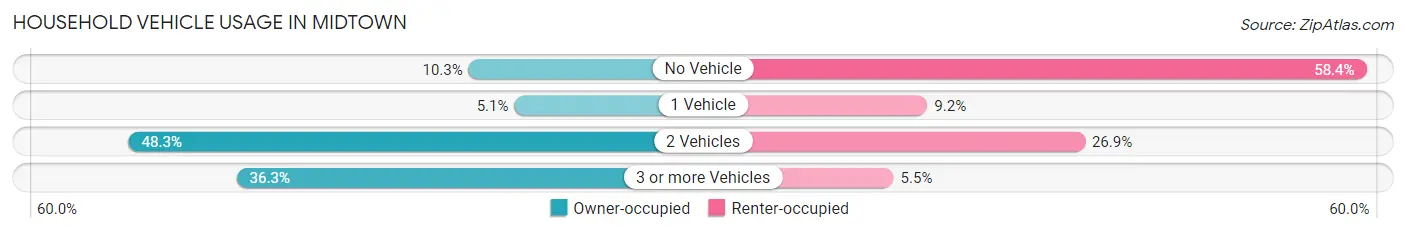
| Vehicles per Household | Owner-occupied | Renter-occupied |
| No Vehicle | 34 (10.3%) | 139 (58.4%) |
| 1 Vehicle | 17 (5.1%) | 22 (9.2%) |
| 2 Vehicles | 160 (48.3%) | 64 (26.9%) |
| 3 or more Vehicles | 120 (36.2%) | 13 (5.5%) |
| Total | 331 (100.0%) | 238 (100.0%) |
Real Estate & Mortgages in Midtown
Real Estate and Mortgage Overview in Midtown
| Characteristic | Without Mortgage | With Mortgage |
| Housing Units | 221 | 110 |
| Median Property Value | $79,700 | $160,400 |
| Median Household Income | $46,250 | $14 |
| Monthly Housing Costs | $368 | $0 |
| Real Estate Taxes | $413 | $0 |
Property Value by Mortgage Status in Midtown
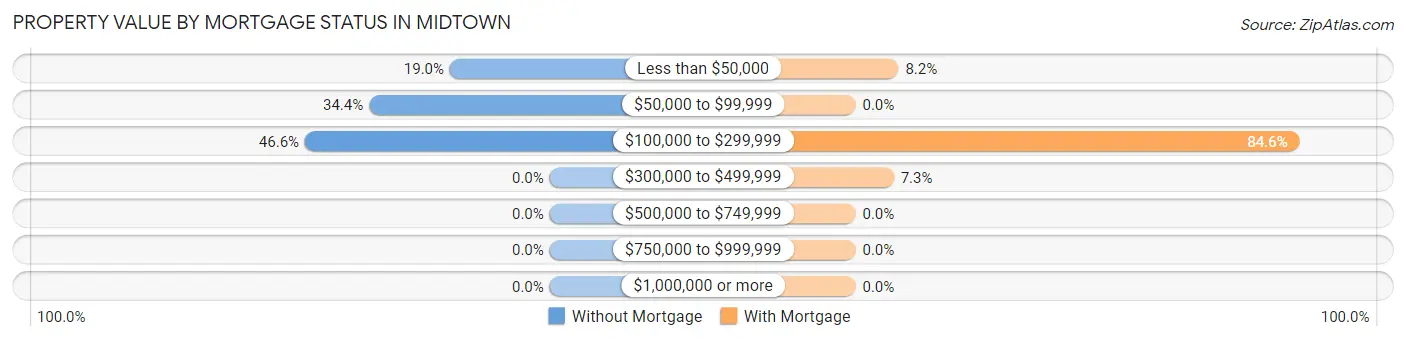
| Property Value | Without Mortgage | With Mortgage |
| Less than $50,000 | 42 (19.0%) | 9 (8.2%) |
| $50,000 to $99,999 | 76 (34.4%) | 0 (0.0%) |
| $100,000 to $299,999 | 103 (46.6%) | 93 (84.6%) |
| $300,000 to $499,999 | 0 (0.0%) | 8 (7.3%) |
| $500,000 to $749,999 | 0 (0.0%) | 0 (0.0%) |
| $750,000 to $999,999 | 0 (0.0%) | 0 (0.0%) |
| $1,000,000 or more | 0 (0.0%) | 0 (0.0%) |
| Total | 221 (100.0%) | 110 (100.0%) |
Household Income by Mortgage Status in Midtown
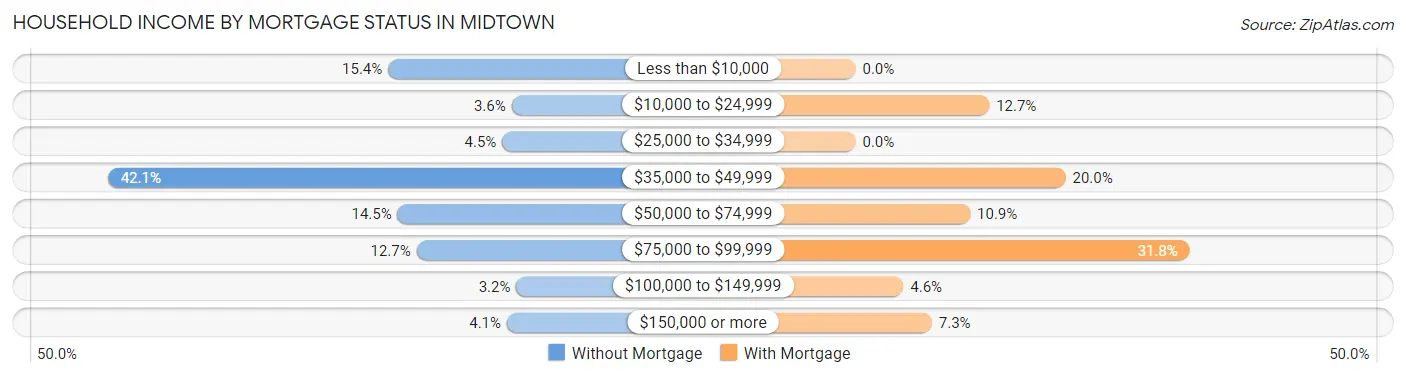
| Household Income | Without Mortgage | With Mortgage |
| Less than $10,000 | 34 (15.4%) | 0 (0.0%) |
| $10,000 to $24,999 | 8 (3.6%) | 14 (12.7%) |
| $25,000 to $34,999 | 10 (4.5%) | 0 (0.0%) |
| $35,000 to $49,999 | 93 (42.1%) | 22 (20.0%) |
| $50,000 to $74,999 | 32 (14.5%) | 12 (10.9%) |
| $75,000 to $99,999 | 28 (12.7%) | 35 (31.8%) |
| $100,000 to $149,999 | 7 (3.2%) | 5 (4.5%) |
| $150,000 or more | 9 (4.1%) | 8 (7.3%) |
| Total | 221 (100.0%) | 110 (100.0%) |
Property Value to Household Income Ratio in Midtown
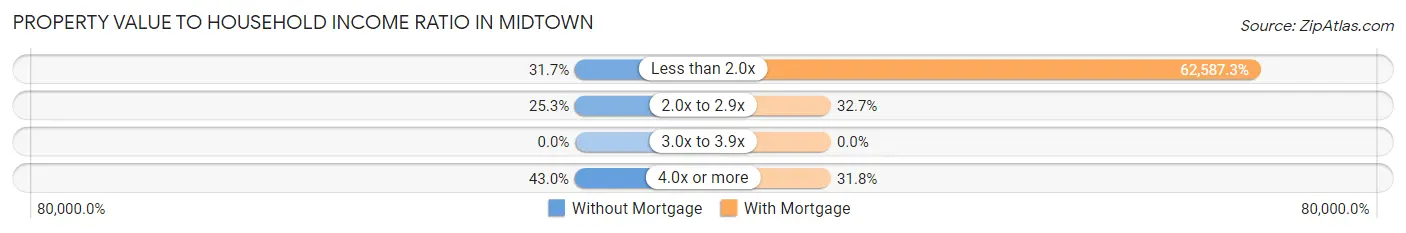
| Value-to-Income Ratio | Without Mortgage | With Mortgage |
| Less than 2.0x | 70 (31.7%) | 68,846 (62,587.3%) |
| 2.0x to 2.9x | 56 (25.3%) | 36 (32.7%) |
| 3.0x to 3.9x | 0 (0.0%) | 0 (0.0%) |
| 4.0x or more | 95 (43.0%) | 35 (31.8%) |
| Total | 221 (100.0%) | 110 (100.0%) |
Real Estate Taxes by Mortgage Status in Midtown
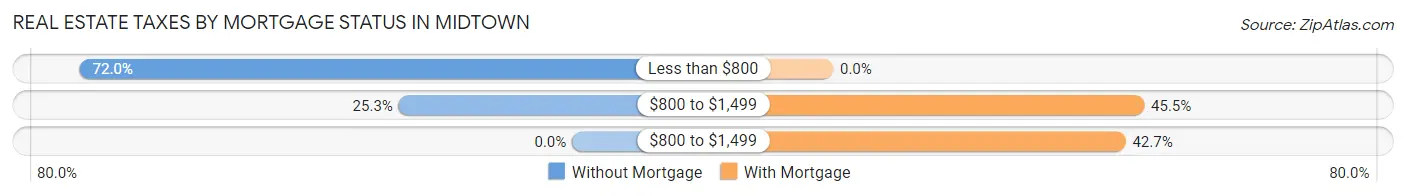
| Property Taxes | Without Mortgage | With Mortgage |
| Less than $800 | 159 (72.0%) | 0 (0.0%) |
| $800 to $1,499 | 56 (25.3%) | 50 (45.5%) |
| $800 to $1,499 | 0 (0.0%) | 47 (42.7%) |
| Total | 221 (100.0%) | 110 (100.0%) |
Health & Disability in Midtown
Health Insurance Coverage by Age in Midtown
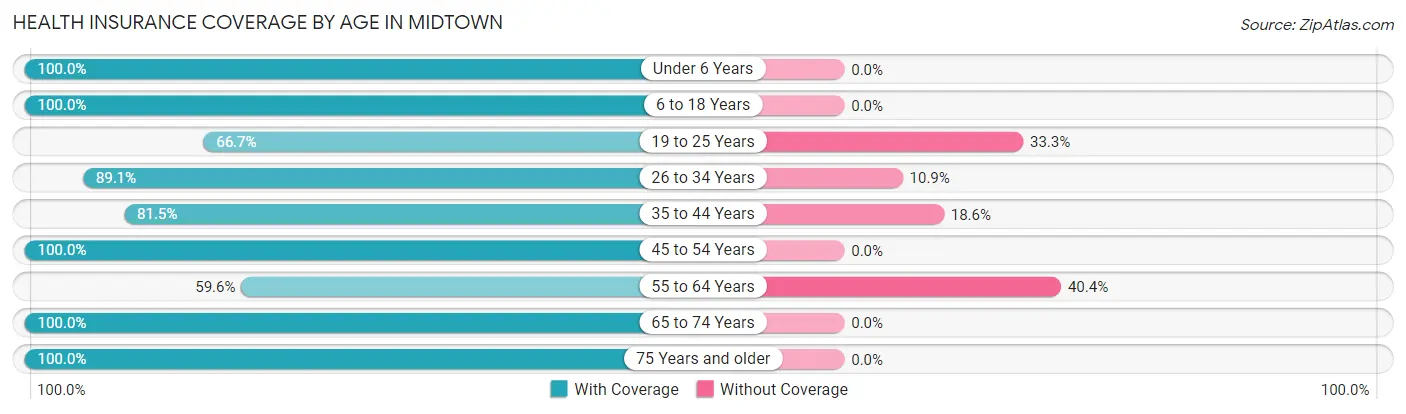
| Age Bracket | With Coverage | Without Coverage |
| Under 6 Years | 66 (100.0%) | 0 (0.0%) |
| 6 to 18 Years | 109 (100.0%) | 0 (0.0%) |
| 19 to 25 Years | 62 (66.7%) | 31 (33.3%) |
| 26 to 34 Years | 82 (89.1%) | 10 (10.9%) |
| 35 to 44 Years | 101 (81.5%) | 23 (18.5%) |
| 45 to 54 Years | 107 (100.0%) | 0 (0.0%) |
| 55 to 64 Years | 115 (59.6%) | 78 (40.4%) |
| 65 to 74 Years | 223 (100.0%) | 0 (0.0%) |
| 75 Years and older | 253 (100.0%) | 0 (0.0%) |
| Total | 1,118 (88.7%) | 142 (11.3%) |
Health Insurance Coverage by Citizenship Status in Midtown
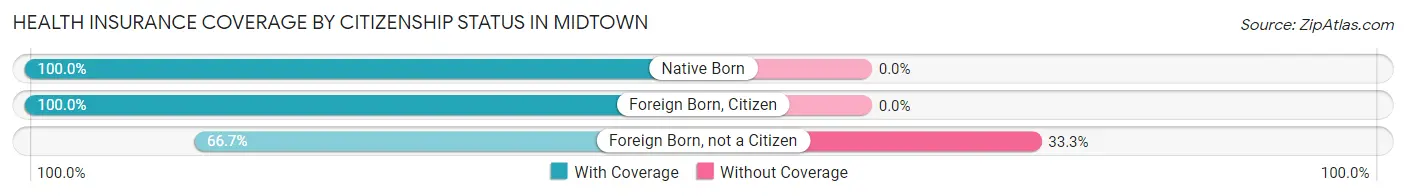
| Citizenship Status | With Coverage | Without Coverage |
| Native Born | 66 (100.0%) | 0 (0.0%) |
| Foreign Born, Citizen | 109 (100.0%) | 0 (0.0%) |
| Foreign Born, not a Citizen | 62 (66.7%) | 31 (33.3%) |
Health Insurance Coverage by Household Income in Midtown
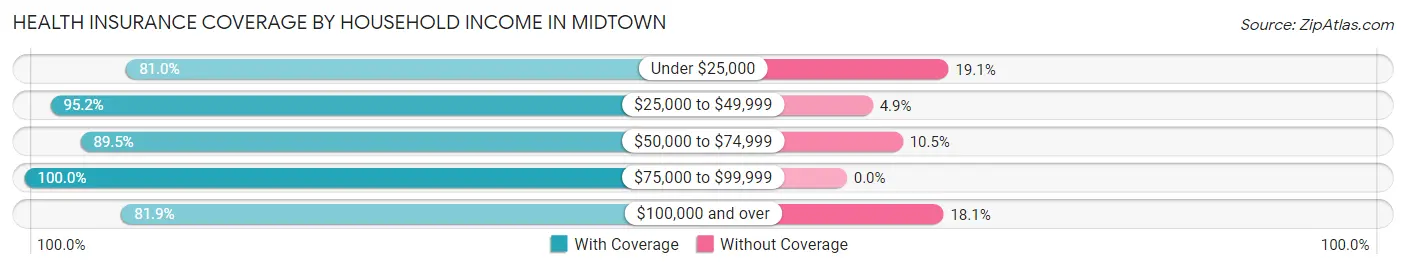
| Household Income | With Coverage | Without Coverage |
| Under $25,000 | 187 (80.9%) | 44 (19.1%) |
| $25,000 to $49,999 | 471 (95.2%) | 24 (4.9%) |
| $50,000 to $74,999 | 265 (89.5%) | 31 (10.5%) |
| $75,000 to $99,999 | 60 (100.0%) | 0 (0.0%) |
| $100,000 and over | 131 (81.9%) | 29 (18.1%) |
Public vs Private Health Insurance Coverage by Age in Midtown
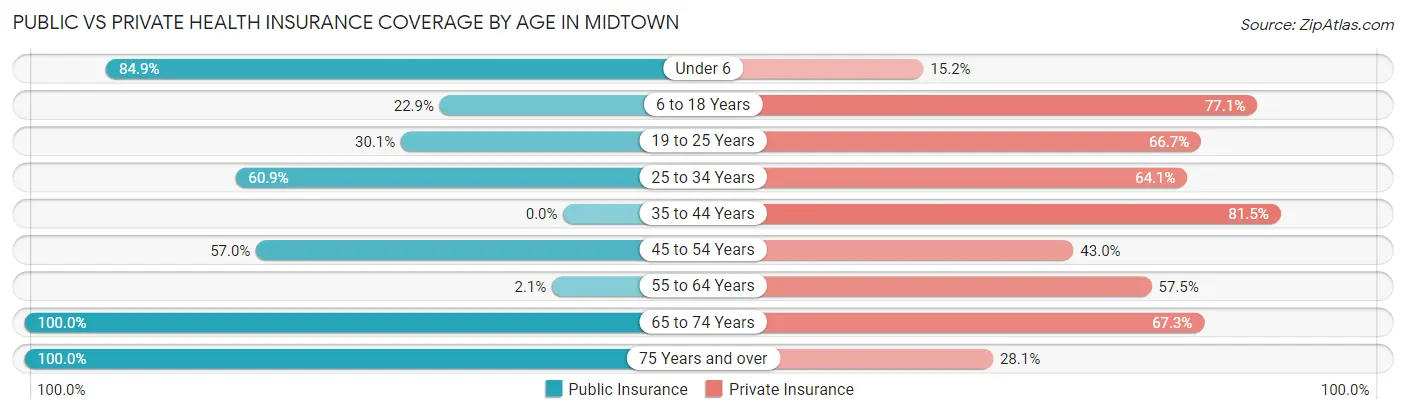
| Age Bracket | Public Insurance | Private Insurance |
| Under 6 | 56 (84.9%) | 10 (15.1%) |
| 6 to 18 Years | 25 (22.9%) | 84 (77.1%) |
| 19 to 25 Years | 28 (30.1%) | 62 (66.7%) |
| 25 to 34 Years | 56 (60.9%) | 59 (64.1%) |
| 35 to 44 Years | 0 (0.0%) | 101 (81.5%) |
| 45 to 54 Years | 61 (57.0%) | 46 (43.0%) |
| 55 to 64 Years | 4 (2.1%) | 111 (57.5%) |
| 65 to 74 Years | 223 (100.0%) | 150 (67.3%) |
| 75 Years and over | 253 (100.0%) | 71 (28.1%) |
| Total | 706 (56.0%) | 694 (55.1%) |
Disability Status by Sex by Age in Midtown
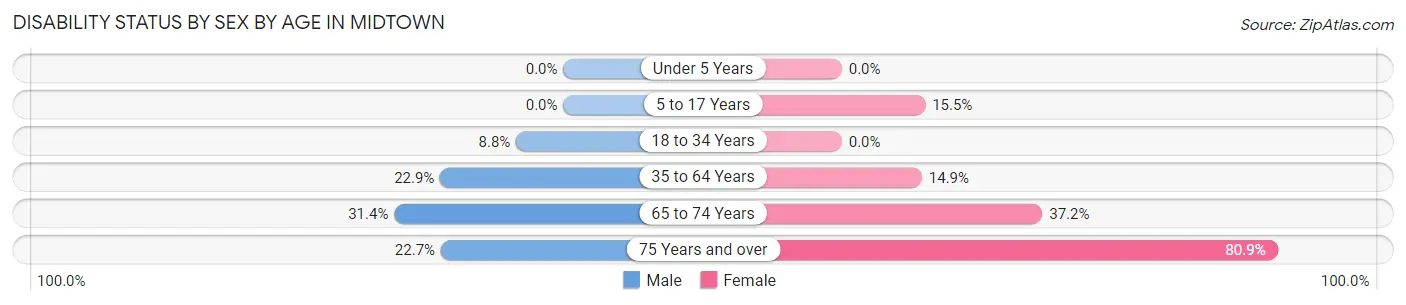
| Age Bracket | Male | Female |
| Under 5 Years | 0 (0.0%) | 0 (0.0%) |
| 5 to 17 Years | 0 (0.0%) | 13 (15.5%) |
| 18 to 34 Years | 7 (8.7%) | 0 (0.0%) |
| 35 to 64 Years | 40 (22.9%) | 37 (14.9%) |
| 65 to 74 Years | 43 (31.4%) | 32 (37.2%) |
| 75 Years and over | 10 (22.7%) | 169 (80.9%) |
Disability Class by Sex by Age in Midtown
Disability Class: Hearing Difficulty
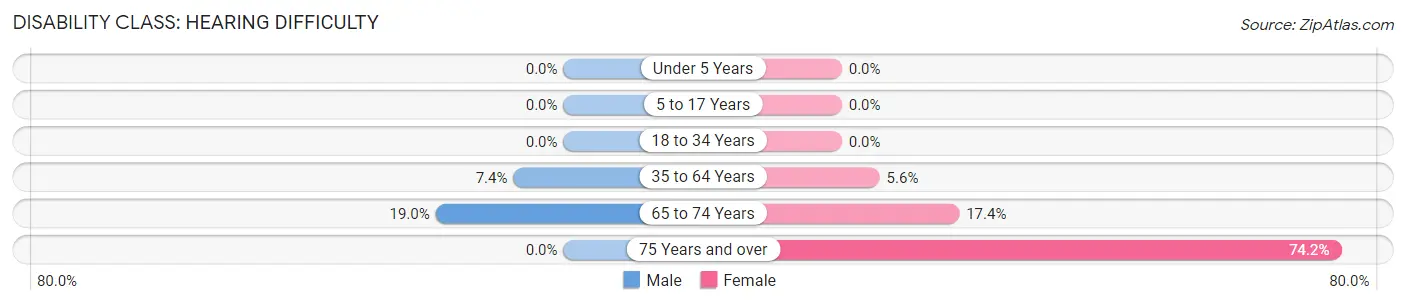
| Age Bracket | Male | Female |
| Under 5 Years | 0 (0.0%) | 0 (0.0%) |
| 5 to 17 Years | 0 (0.0%) | 0 (0.0%) |
| 18 to 34 Years | 0 (0.0%) | 0 (0.0%) |
| 35 to 64 Years | 13 (7.4%) | 14 (5.6%) |
| 65 to 74 Years | 26 (19.0%) | 15 (17.4%) |
| 75 Years and over | 0 (0.0%) | 155 (74.2%) |
Disability Class: Vision Difficulty
| Age Bracket | Male | Female |
| Under 5 Years | 0 (0.0%) | 0 (0.0%) |
| 5 to 17 Years | 0 (0.0%) | 0 (0.0%) |
| 18 to 34 Years | 0 (0.0%) | 0 (0.0%) |
| 35 to 64 Years | 0 (0.0%) | 0 (0.0%) |
| 65 to 74 Years | 0 (0.0%) | 0 (0.0%) |
| 75 Years and over | 0 (0.0%) | 0 (0.0%) |
Disability Class: Cognitive Difficulty
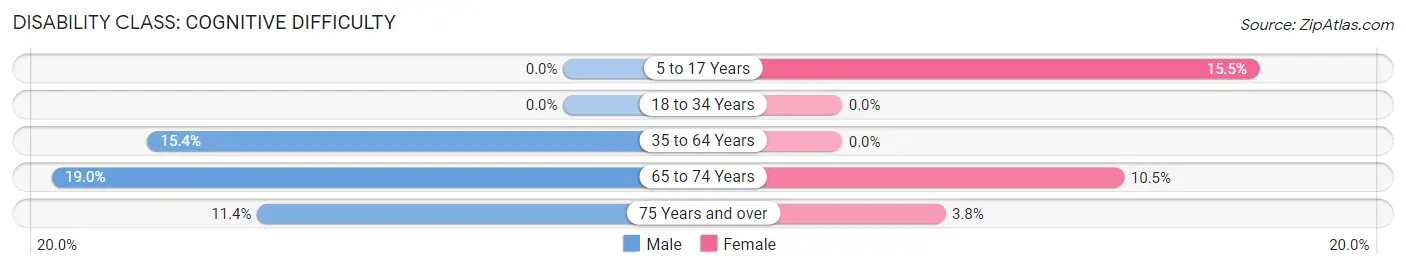
| Age Bracket | Male | Female |
| 5 to 17 Years | 0 (0.0%) | 13 (15.5%) |
| 18 to 34 Years | 0 (0.0%) | 0 (0.0%) |
| 35 to 64 Years | 27 (15.4%) | 0 (0.0%) |
| 65 to 74 Years | 26 (19.0%) | 9 (10.5%) |
| 75 Years and over | 5 (11.4%) | 8 (3.8%) |
Disability Class: Ambulatory Difficulty
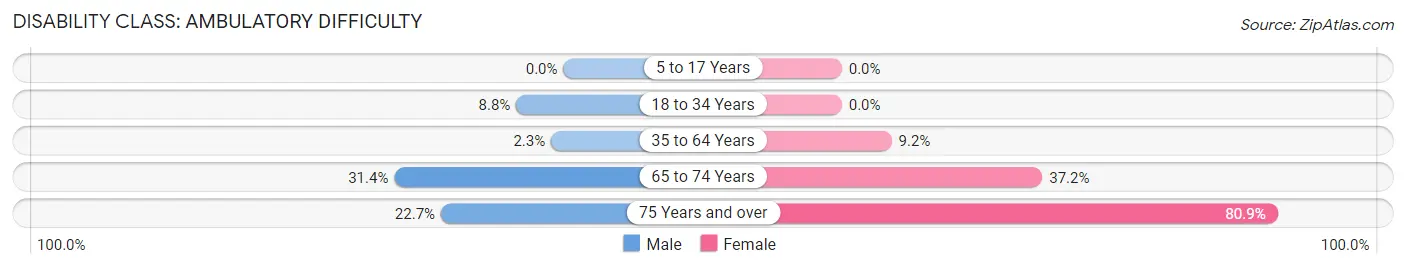
| Age Bracket | Male | Female |
| 5 to 17 Years | 0 (0.0%) | 0 (0.0%) |
| 18 to 34 Years | 7 (8.7%) | 0 (0.0%) |
| 35 to 64 Years | 4 (2.3%) | 23 (9.2%) |
| 65 to 74 Years | 43 (31.4%) | 32 (37.2%) |
| 75 Years and over | 10 (22.7%) | 169 (80.9%) |
Disability Class: Self-Care Difficulty
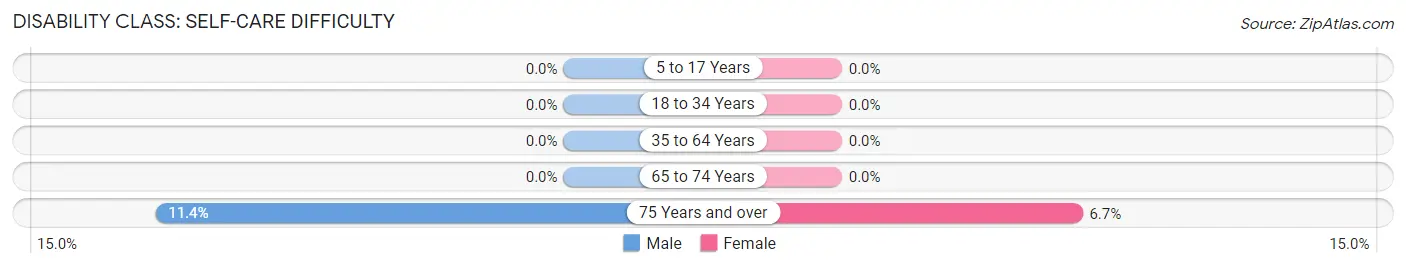
| Age Bracket | Male | Female |
| 5 to 17 Years | 0 (0.0%) | 0 (0.0%) |
| 18 to 34 Years | 0 (0.0%) | 0 (0.0%) |
| 35 to 64 Years | 0 (0.0%) | 0 (0.0%) |
| 65 to 74 Years | 0 (0.0%) | 0 (0.0%) |
| 75 Years and over | 5 (11.4%) | 14 (6.7%) |
Technology Access in Midtown
Computing Device Access in Midtown

| Device Type | # Households | % Households |
| Desktop or Laptop | 261 | 45.9% |
| Smartphone | 442 | 77.7% |
| Tablet | 232 | 40.8% |
| No Computing Device | 75 | 13.2% |
| Total | 569 | 100.0% |
Internet Access in Midtown
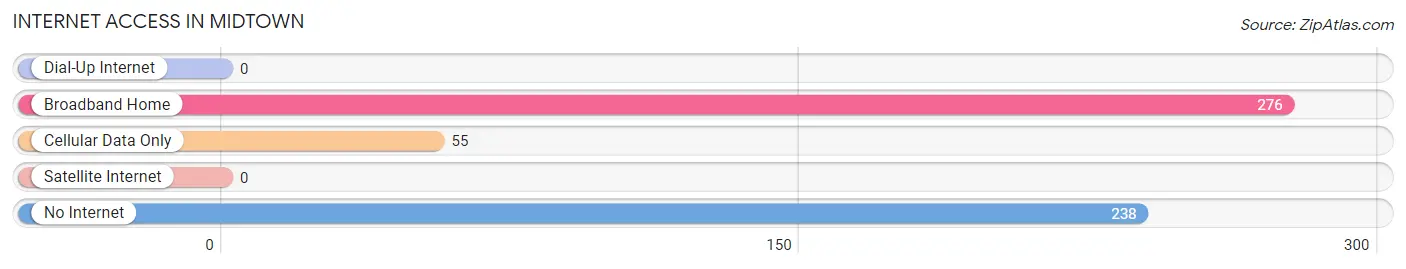
| Internet Type | # Households | % Households |
| Dial-Up Internet | 0 | 0.0% |
| Broadband Home | 276 | 48.5% |
| Cellular Data Only | 55 | 9.7% |
| Satellite Internet | 0 | 0.0% |
| No Internet | 238 | 41.8% |
| Total | 569 | 100.0% |
Midtown Summary
Midtown is a neighborhood located in the city of Memphis, Tennessee. It is located in the center of the city, just south of Downtown Memphis. Midtown is known for its vibrant culture, diverse population, and unique architecture.
History
Midtown was originally part of the Chickasaw Nation, which was a Native American tribe that inhabited the area prior to the arrival of European settlers. The Chickasaw Nation was forcibly removed from the area in the 1830s, and the land was then sold to settlers. The area was developed in the late 19th century, and by the early 20th century, it had become a thriving residential and commercial district.
The area was home to a large number of African-American residents, and it was a center of the civil rights movement in Memphis. In 1968, the assassination of Martin Luther King Jr. occurred in Midtown, and the area was the site of numerous protests and demonstrations in the following years.
In the late 20th century, Midtown experienced a period of decline, as many of its residents moved to the suburbs. However, in the early 21st century, the area has seen a resurgence, with new businesses and residents moving into the area.
Geography
Midtown is located in the center of Memphis, just south of Downtown. It is bordered by the neighborhoods of South Memphis to the south, Binghampton to the east, and North Memphis to the north. The area is roughly bounded by Poplar Avenue to the north, East Parkway to the east, Union Avenue to the south, and McLean Boulevard to the west.
The area is mostly flat, with some hills in the northern part of the neighborhood. The area is home to several parks, including Overton Park, which is one of the largest parks in the city.
Economy
Midtown is home to a diverse economy, with a mix of businesses and industries. The area is home to several large employers, including St. Jude Children’s Research Hospital, the University of Memphis, and the Memphis Zoo.
The area is also home to a number of small businesses, including restaurants, bars, and retail stores. The area is also home to a number of art galleries, music venues, and other cultural attractions.
Demographics
Midtown is a diverse neighborhood, with a population of approximately 25,000 people. The area is home to a large number of African-American residents, as well as a significant Hispanic population. The area is also home to a large number of college students, due to its proximity to the University of Memphis.
The median household income in Midtown is approximately $35,000, which is slightly lower than the citywide median of $37,000. The area has a higher rate of poverty than the city as a whole, with approximately 25% of residents living below the poverty line.
Conclusion
Midtown is a vibrant and diverse neighborhood located in the center of Memphis, Tennessee. The area has a long and rich history, and it is home to a diverse population and a thriving economy. The area is home to a number of large employers, as well as small businesses and cultural attractions. The area has a lower median household income than the city as a whole, and a higher rate of poverty. Despite this, Midtown is a vibrant and thriving neighborhood, and it is an important part of the city of Memphis.
Common Questions
What is Per Capita Income in Midtown?
Per Capita income in Midtown is $22,212.
What is the Median Family Income in Midtown?
Median Family Income in Midtown is $46,867.
What is the Median Household income in Midtown?
Median Household Income in Midtown is $36,815.
What is Income or Wage Gap in Midtown?
Income or Wage Gap in Midtown is 61.8%.
Women in Midtown earn 38.2 cents for every dollar earned by a man.
What is Inequality or Gini Index in Midtown?
Inequality or Gini Index in Midtown is 0.39.
What is the Total Population of Midtown?
Total Population of Midtown is 1,260.
What is the Total Male Population of Midtown?
Total Male Population of Midtown is 469.
What is the Total Female Population of Midtown?
Total Female Population of Midtown is 791.
What is the Ratio of Males per 100 Females in Midtown?
There are 59.29 Males per 100 Females in Midtown.
What is the Ratio of Females per 100 Males in Midtown?
There are 168.66 Females per 100 Males in Midtown.
What is the Median Population Age in Midtown?
Median Population Age in Midtown is 58.9 Years.
What is the Average Family Size in Midtown
Average Family Size in Midtown is 3.0 People.
What is the Average Household Size in Midtown
Average Household Size in Midtown is 2.2 People.
How Large is the Labor Force in Midtown?
There are 413 People in the Labor Forcein in Midtown.
What is the Percentage of People in the Labor Force in Midtown?
36.9% of People are in the Labor Force in Midtown.
What is the Unemployment Rate in Midtown?
Unemployment Rate in Midtown is 7.8%.