Andersonville, TN Map & Demographics
Andersonville Map
Andersonville Overview
$34,018
PER CAPITA INCOME
$111,250
AVG FAMILY INCOME
47.2%
WAGE / INCOME GAP [ % ]
52.8¢/ $1
WAGE / INCOME GAP [ $ ]
0.32
INEQUALITY / GINI INDEX
274
TOTAL POPULATION
112
MALE POPULATION
162
FEMALE POPULATION
69.14
MALES / 100 FEMALES
144.64
FEMALES / 100 MALES
44.4
MEDIAN AGE
2.9
AVG FAMILY SIZE
2.5
AVG HOUSEHOLD SIZE
187
LABOR FORCE [ PEOPLE ]
72.8%
PERCENT IN LABOR FORCE
Andersonville Zip Codes
Andersonville Area Codes
Income in Andersonville
Income Overview in Andersonville
| Characteristic | Number | Measure |
| Per Capita Income | 274 | $34,018 |
| Median Family Income | 77 | $111,250 |
| Mean Family Income | 77 | $98,653 |
| Median Household Income | 112 | $0 |
| Mean Household Income | 112 | $76,073 |
| Income Deficit | 77 | $0 |
| Wage / Income Gap (%) | 274 | 47.18% |
| Wage / Income Gap ($) | 274 | 52.82¢ per $1 |
| Gini / Inequality Index | 274 | 0.32 |
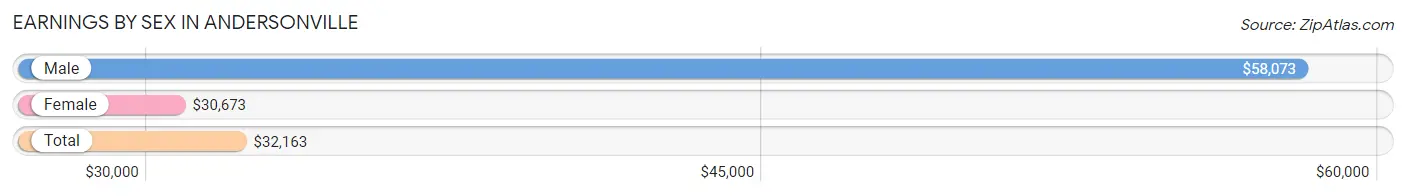
Earnings by Sex in Andersonville
Average Earnings in Andersonville are $32,163, $58,073 for men and $30,673 for women, a difference of 47.2%.
| Sex | Number | Average Earnings |
| Male | 77 (41.2%) | $58,073 |
| Female | 110 (58.8%) | $30,673 |
| Total | 187 (100.0%) | $32,163 |
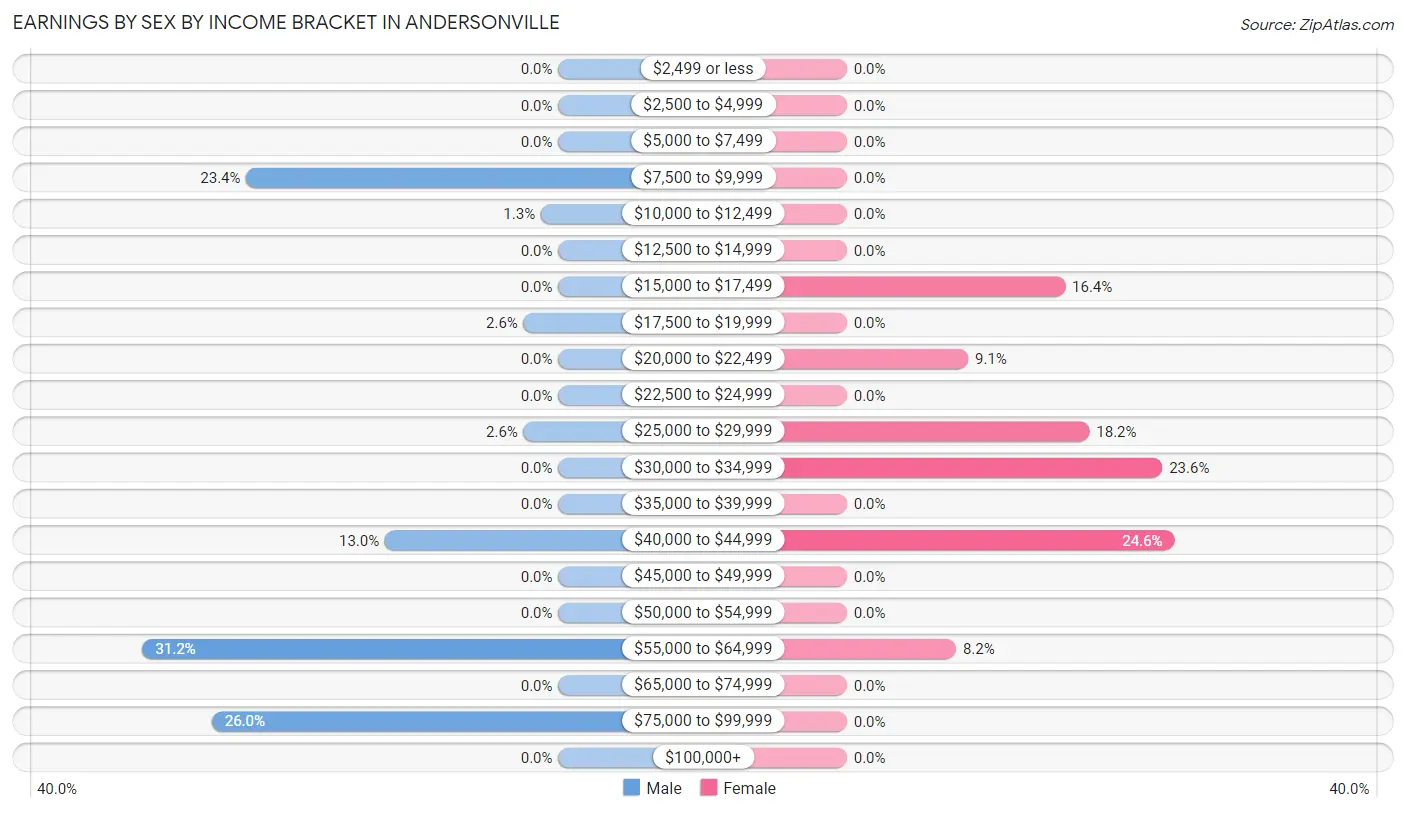
Earnings by Sex by Income Bracket in Andersonville
The most common earnings brackets in Andersonville are $55,000 to $64,999 for men (24 | 31.2%) and $40,000 to $44,999 for women (27 | 24.5%).
| Income | Male | Female |
| $2,499 or less | 0 (0.0%) | 0 (0.0%) |
| $2,500 to $4,999 | 0 (0.0%) | 0 (0.0%) |
| $5,000 to $7,499 | 0 (0.0%) | 0 (0.0%) |
| $7,500 to $9,999 | 18 (23.4%) | 0 (0.0%) |
| $10,000 to $12,499 | 1 (1.3%) | 0 (0.0%) |
| $12,500 to $14,999 | 0 (0.0%) | 0 (0.0%) |
| $15,000 to $17,499 | 0 (0.0%) | 18 (16.4%) |
| $17,500 to $19,999 | 2 (2.6%) | 0 (0.0%) |
| $20,000 to $22,499 | 0 (0.0%) | 10 (9.1%) |
| $22,500 to $24,999 | 0 (0.0%) | 0 (0.0%) |
| $25,000 to $29,999 | 2 (2.6%) | 20 (18.2%) |
| $30,000 to $34,999 | 0 (0.0%) | 26 (23.6%) |
| $35,000 to $39,999 | 0 (0.0%) | 0 (0.0%) |
| $40,000 to $44,999 | 10 (13.0%) | 27 (24.5%) |
| $45,000 to $49,999 | 0 (0.0%) | 0 (0.0%) |
| $50,000 to $54,999 | 0 (0.0%) | 0 (0.0%) |
| $55,000 to $64,999 | 24 (31.2%) | 9 (8.2%) |
| $65,000 to $74,999 | 0 (0.0%) | 0 (0.0%) |
| $75,000 to $99,999 | 20 (26.0%) | 0 (0.0%) |
| $100,000+ | 0 (0.0%) | 0 (0.0%) |
| Total | 77 (100.0%) | 110 (100.0%) |
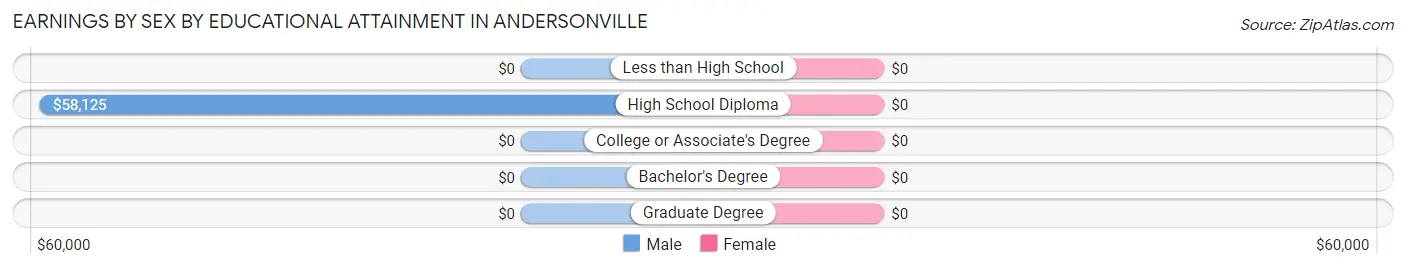
Earnings by Sex by Educational Attainment in Andersonville
| Educational Attainment | Male Income | Female Income |
| Less than High School | - | - |
| High School Diploma | $58,125 | $0 |
| College or Associate's Degree | - | - |
| Bachelor's Degree | - | - |
| Graduate Degree | - | - |
| Total | $58,229 | $31,538 |
Family Income in Andersonville
Family Income Brackets in Andersonville
According to the Andersonville family income data, there are 43 families falling into the $100,000 to $149,999 income range, which is the most common income bracket and makes up 55.8% of all families.
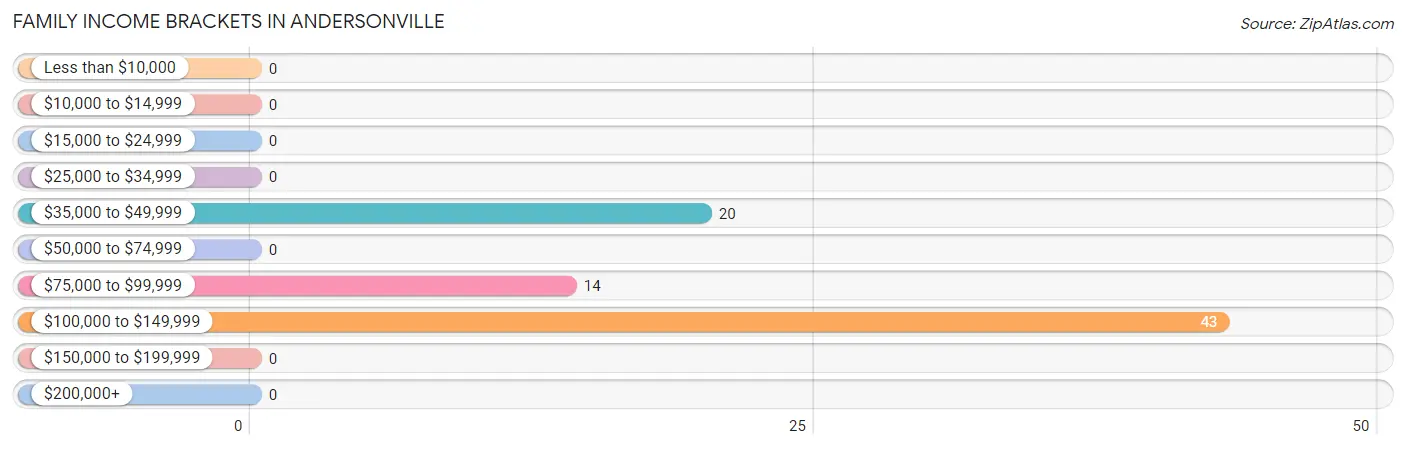
| Income Bracket | # Families | % Families |
| Less than $10,000 | 0 | 0.0% |
| $10,000 to $14,999 | 0 | 0.0% |
| $15,000 to $24,999 | 0 | 0.0% |
| $25,000 to $34,999 | 0 | 0.0% |
| $35,000 to $49,999 | 20 | 26.0% |
| $50,000 to $74,999 | 0 | 0.0% |
| $75,000 to $99,999 | 14 | 18.2% |
| $100,000 to $149,999 | 43 | 55.8% |
| $150,000 to $199,999 | 0 | 0.0% |
| $200,000+ | 0 | 0.0% |
Family Income by Famaliy Size in Andersonville
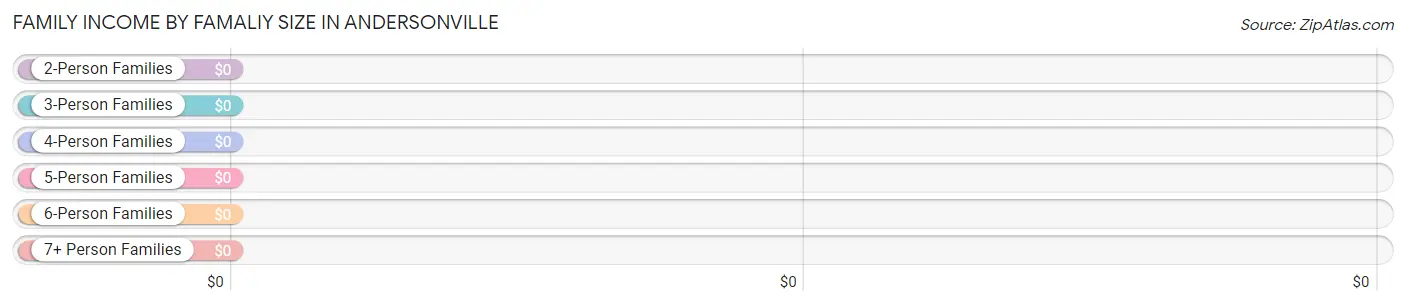
| Income Bracket | # Families | Median Income |
| 2-Person Families | 34 (44.2%) | $0 |
| 3-Person Families | 40 (51.9%) | $0 |
| 4-Person Families | 3 (3.9%) | $0 |
| 5-Person Families | 0 (0.0%) | $0 |
| 6-Person Families | 0 (0.0%) | $0 |
| 7+ Person Families | 0 (0.0%) | $0 |
| Total | 77 (100.0%) | $111,250 |
Family Income by Number of Earners in Andersonville
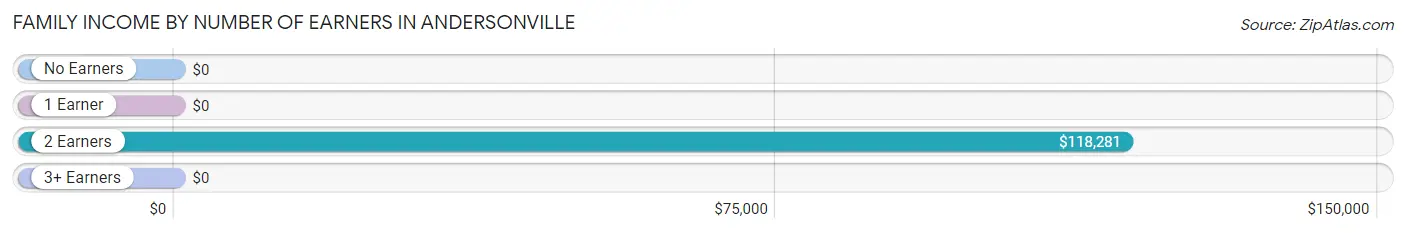
| Number of Earners | # Families | Median Income |
| No Earners | 0 (0.0%) | $0 |
| 1 Earner | 21 (27.3%) | $0 |
| 2 Earners | 53 (68.8%) | $118,281 |
| 3+ Earners | 3 (3.9%) | $0 |
| Total | 77 (100.0%) | $111,250 |
Household Income in Andersonville
Household Income Brackets in Andersonville
With 43 households falling in the category, the $100,000 to $149,999 income range is the most frequent in Andersonville, accounting for 38.4% of all households.
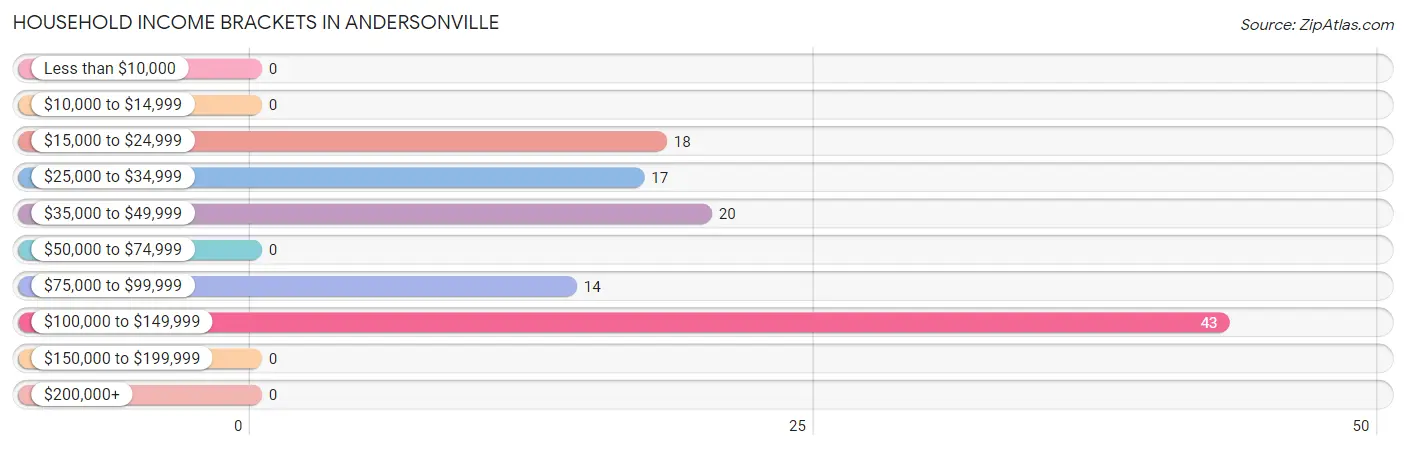
| Income Bracket | # Households | % Households |
| Less than $10,000 | 0 | 0.0% |
| $10,000 to $14,999 | 0 | 0.0% |
| $15,000 to $24,999 | 18 | 16.1% |
| $25,000 to $34,999 | 17 | 15.2% |
| $35,000 to $49,999 | 20 | 17.9% |
| $50,000 to $74,999 | 0 | 0.0% |
| $75,000 to $99,999 | 14 | 12.5% |
| $100,000 to $149,999 | 43 | 38.4% |
| $150,000 to $199,999 | 0 | 0.0% |
| $200,000+ | 0 | 0.0% |
Household Income by Householder Age in Andersonville
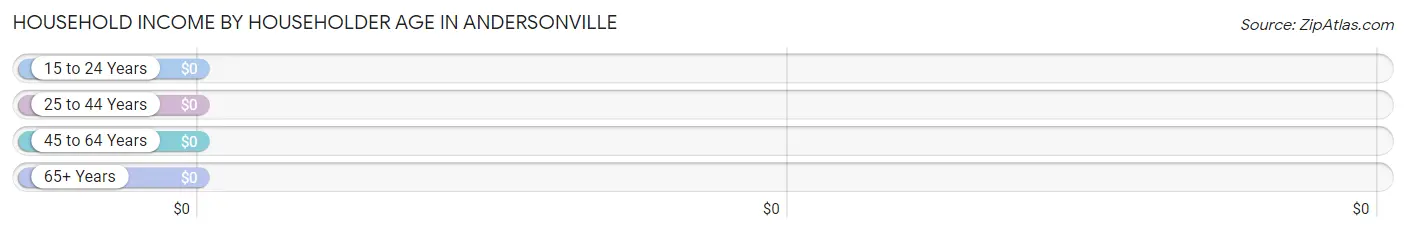
| Income Bracket | # Households | Median Income |
| 15 to 24 Years | 0 (0.0%) | $0 |
| 25 to 44 Years | 73 (65.2%) | $0 |
| 45 to 64 Years | 28 (25.0%) | $0 |
| 65+ Years | 11 (9.8%) | $0 |
| Total | 112 (100.0%) | $0 |
Poverty in Andersonville
Income Below Poverty by Sex and Age in Andersonville
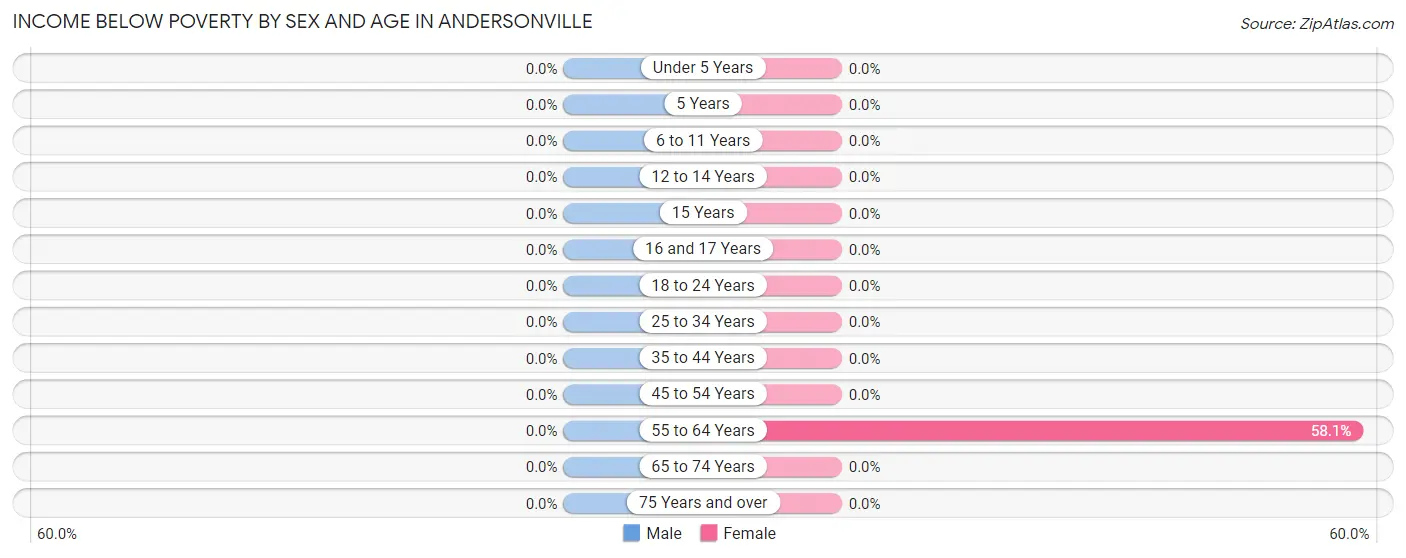
| Age Bracket | Male | Female |
| Under 5 Years | 0 (0.0%) | 0 (0.0%) |
| 5 Years | 0 (0.0%) | 0 (0.0%) |
| 6 to 11 Years | 0 (0.0%) | 0 (0.0%) |
| 12 to 14 Years | 0 (0.0%) | 0 (0.0%) |
| 15 Years | 0 (0.0%) | 0 (0.0%) |
| 16 and 17 Years | 0 (0.0%) | 0 (0.0%) |
| 18 to 24 Years | 0 (0.0%) | 0 (0.0%) |
| 25 to 34 Years | 0 (0.0%) | 0 (0.0%) |
| 35 to 44 Years | 0 (0.0%) | 0 (0.0%) |
| 45 to 54 Years | 0 (0.0%) | 0 (0.0%) |
| 55 to 64 Years | 0 (0.0%) | 18 (58.1%) |
| 65 to 74 Years | 0 (0.0%) | 0 (0.0%) |
| 75 Years and over | 0 (0.0%) | 0 (0.0%) |
| Total | 0 (0.0%) | 18 (11.1%) |
Income Above Poverty by Sex and Age in Andersonville
According to the poverty statistics in Andersonville, males aged 6 to 11 years and females aged 18 to 24 years are the age groups that are most secure financially, with 100.0% of males and 100.0% of females in these age groups living above the poverty line.
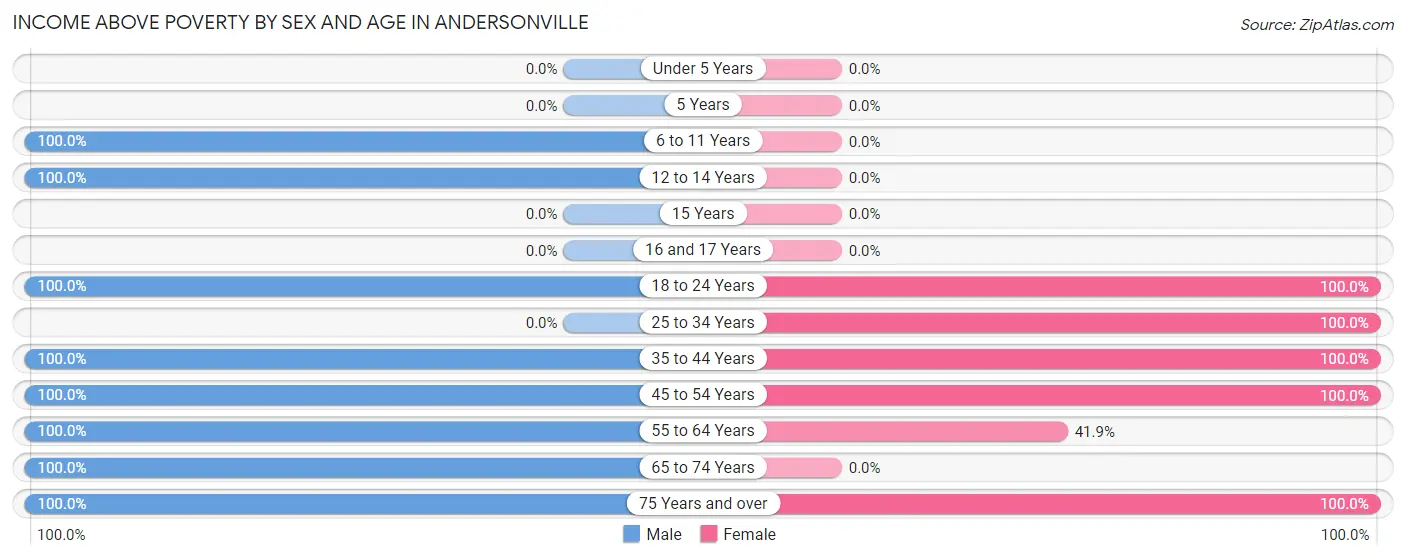
| Age Bracket | Male | Female |
| Under 5 Years | 0 (0.0%) | 0 (0.0%) |
| 5 Years | 0 (0.0%) | 0 (0.0%) |
| 6 to 11 Years | 8 (100.0%) | 0 (0.0%) |
| 12 to 14 Years | 9 (100.0%) | 0 (0.0%) |
| 15 Years | 0 (0.0%) | 0 (0.0%) |
| 16 and 17 Years | 0 (0.0%) | 0 (0.0%) |
| 18 to 24 Years | 3 (100.0%) | 18 (100.0%) |
| 25 to 34 Years | 0 (0.0%) | 27 (100.0%) |
| 35 to 44 Years | 24 (100.0%) | 58 (100.0%) |
| 45 to 54 Years | 20 (100.0%) | 17 (100.0%) |
| 55 to 64 Years | 12 (100.0%) | 13 (41.9%) |
| 65 to 74 Years | 18 (100.0%) | 0 (0.0%) |
| 75 Years and over | 18 (100.0%) | 11 (100.0%) |
| Total | 112 (100.0%) | 144 (88.9%) |
Income Below Poverty Among Married-Couple Families in Andersonville
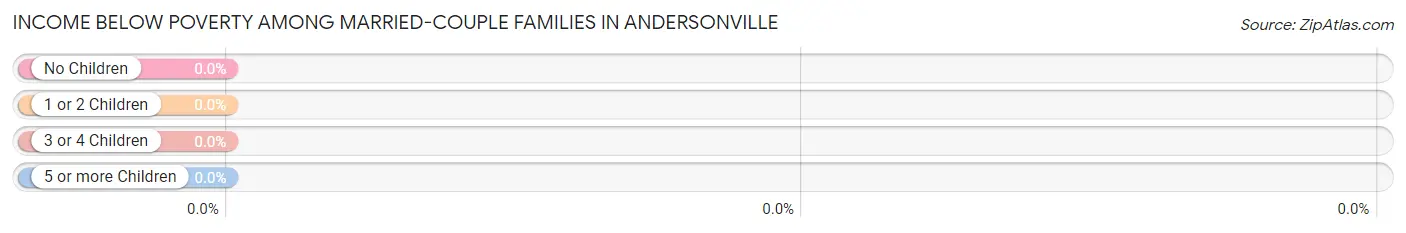
| Children | Above Poverty | Below Poverty |
| No Children | 48 (100.0%) | 0 (0.0%) |
| 1 or 2 Children | 19 (100.0%) | 0 (0.0%) |
| 3 or 4 Children | 0 (0.0%) | 0 (0.0%) |
| 5 or more Children | 0 (0.0%) | 0 (0.0%) |
| Total | 67 (100.0%) | 0 (0.0%) |
Income Below Poverty Among Single-Parent Households in Andersonville
| Children | Single Father | Single Mother |
| No Children | 0 (0.0%) | 0 (0.0%) |
| 1 or 2 Children | 0 (0.0%) | 0 (0.0%) |
| 3 or 4 Children | 0 (0.0%) | 0 (0.0%) |
| 5 or more Children | 0 (0.0%) | 0 (0.0%) |
| Total | 0 (0.0%) | 0 (0.0%) |
Income Below Poverty Among Married-Couple vs Single-Parent Households in Andersonville
| Children | Married-Couple Families | Single-Parent Households |
| No Children | 0 (0.0%) | 0 (0.0%) |
| 1 or 2 Children | 0 (0.0%) | 0 (0.0%) |
| 3 or 4 Children | 0 (0.0%) | 0 (0.0%) |
| 5 or more Children | 0 (0.0%) | 0 (0.0%) |
| Total | 0 (0.0%) | 0 (0.0%) |
Race in Andersonville
The most populous races in Andersonville are White / Caucasian (220 | 80.3%), Hispanic or Latino (36 | 13.1%), and Some other Race (36 | 13.1%).
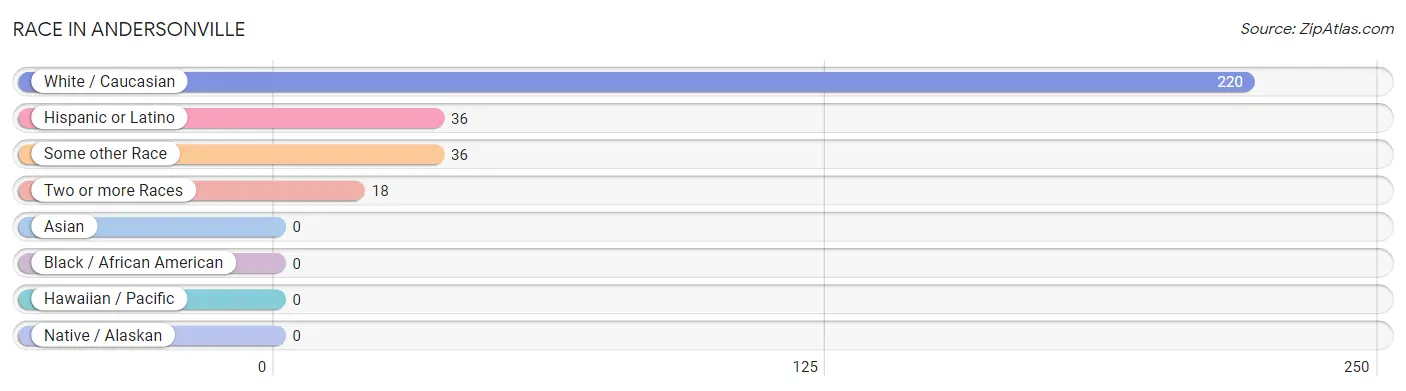
| Race | # Population | % Population |
| Asian | 0 | 0.0% |
| Black / African American | 0 | 0.0% |
| Hawaiian / Pacific | 0 | 0.0% |
| Hispanic or Latino | 36 | 13.1% |
| Native / Alaskan | 0 | 0.0% |
| White / Caucasian | 220 | 80.3% |
| Two or more Races | 18 | 6.6% |
| Some other Race | 36 | 13.1% |
| Total | 274 | 100.0% |
Ancestry in Andersonville
The most populous ancestries reported in Andersonville are English (99 | 36.1%), American (46 | 16.8%), Mexican (36 | 13.1%), German (27 | 9.9%), and Burmese (18 | 6.6%), together accounting for 82.5% of all Andersonville residents.
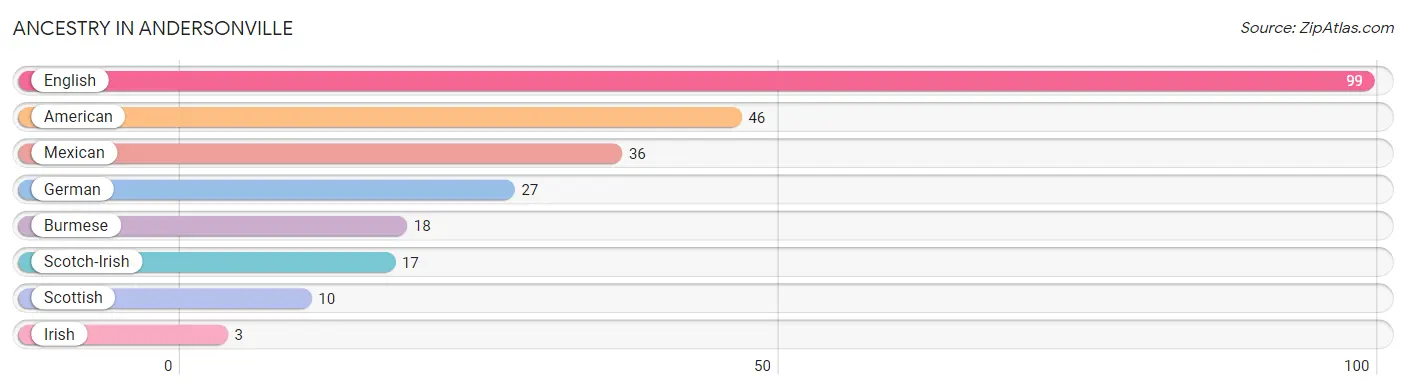
| Ancestry | # Population | % Population |
| American | 46 | 16.8% |
| Burmese | 18 | 6.6% |
| English | 99 | 36.1% |
| German | 27 | 9.9% |
| Irish | 3 | 1.1% |
| Mexican | 36 | 13.1% |
| Scotch-Irish | 17 | 6.2% |
| Scottish | 10 | 3.6% | View All 8 Rows |
Immigrants in Andersonville
The most numerous immigrant groups reported in Andersonville came from Central America (36 | 13.1%), Latin America (36 | 13.1%), and Mexico (36 | 13.1%), together accounting for 39.4% of all Andersonville residents.
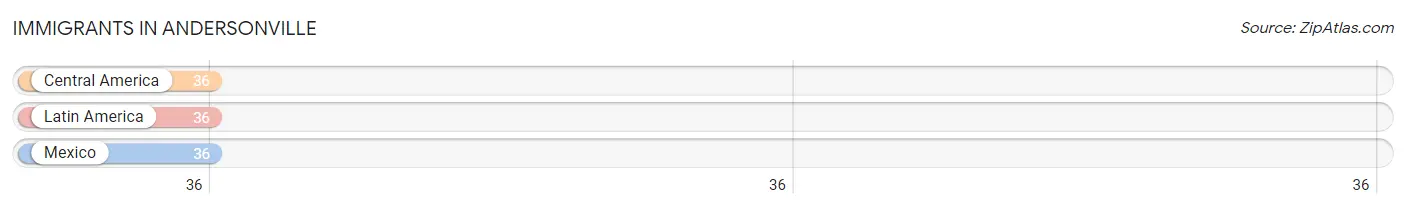
| Immigration Origin | # Population | % Population |
| Central America | 36 | 13.1% |
| Latin America | 36 | 13.1% |
| Mexico | 36 | 13.1% | View All 3 Rows |
Sex and Age in Andersonville
Sex and Age in Andersonville
The most populous age groups in Andersonville are 40 to 44 Years (24 | 21.4%) for men and 40 to 44 Years (31 | 19.1%) for women.
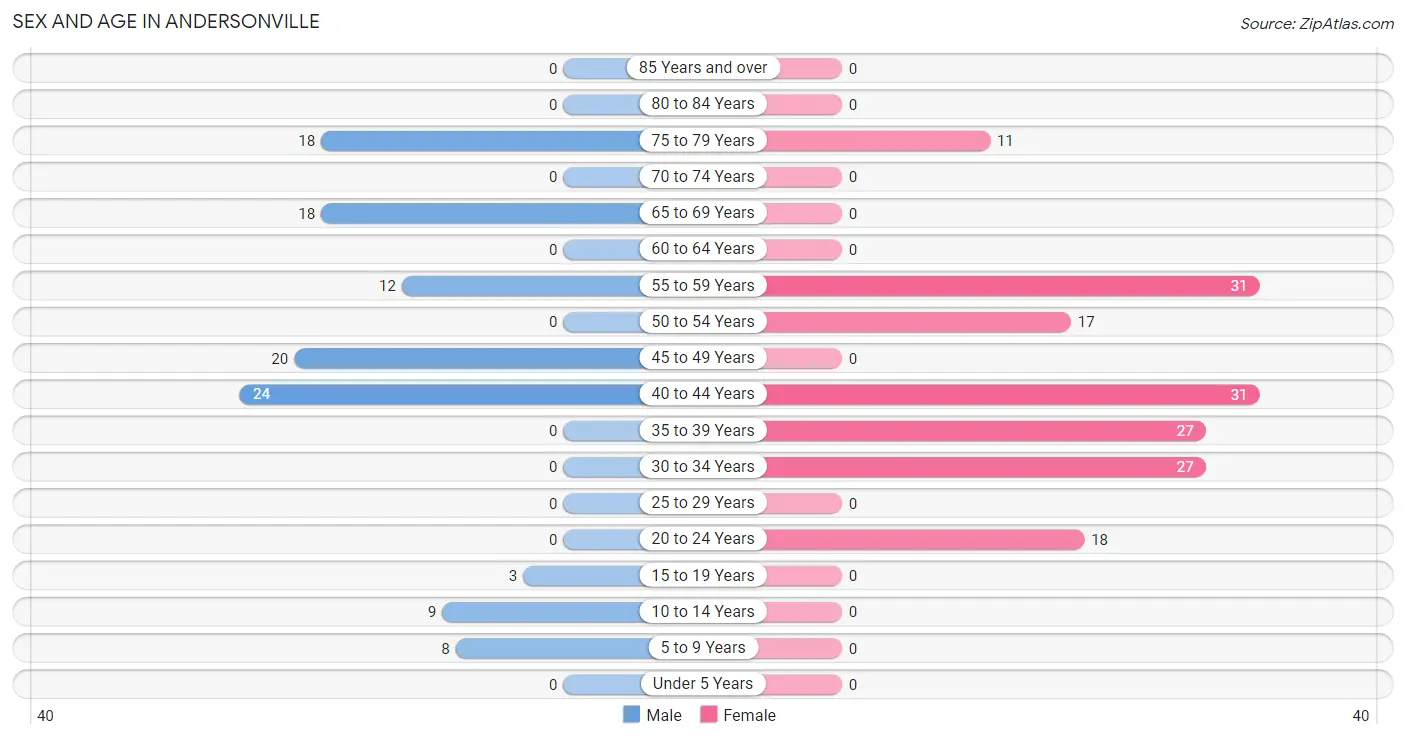
| Age Bracket | Male | Female |
| Under 5 Years | 0 (0.0%) | 0 (0.0%) |
| 5 to 9 Years | 8 (7.1%) | 0 (0.0%) |
| 10 to 14 Years | 9 (8.0%) | 0 (0.0%) |
| 15 to 19 Years | 3 (2.7%) | 0 (0.0%) |
| 20 to 24 Years | 0 (0.0%) | 18 (11.1%) |
| 25 to 29 Years | 0 (0.0%) | 0 (0.0%) |
| 30 to 34 Years | 0 (0.0%) | 27 (16.7%) |
| 35 to 39 Years | 0 (0.0%) | 27 (16.7%) |
| 40 to 44 Years | 24 (21.4%) | 31 (19.1%) |
| 45 to 49 Years | 20 (17.9%) | 0 (0.0%) |
| 50 to 54 Years | 0 (0.0%) | 17 (10.5%) |
| 55 to 59 Years | 12 (10.7%) | 31 (19.1%) |
| 60 to 64 Years | 0 (0.0%) | 0 (0.0%) |
| 65 to 69 Years | 18 (16.1%) | 0 (0.0%) |
| 70 to 74 Years | 0 (0.0%) | 0 (0.0%) |
| 75 to 79 Years | 18 (16.1%) | 11 (6.8%) |
| 80 to 84 Years | 0 (0.0%) | 0 (0.0%) |
| 85 Years and over | 0 (0.0%) | 0 (0.0%) |
| Total | 112 (100.0%) | 162 (100.0%) |
Families and Households in Andersonville
Median Family Size in Andersonville
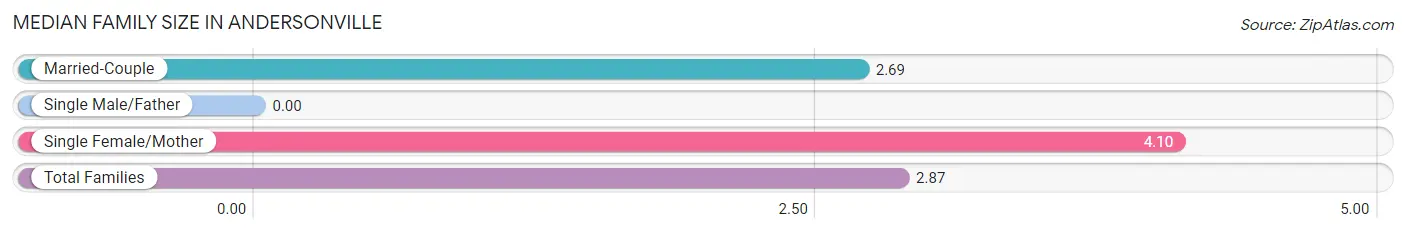
| Family Type | # Families | Family Size |
| Married-Couple | 67 (87.0%) | 2.69 |
| Single Male/Father | 0 (0.0%) | - |
| Single Female/Mother | 10 (13.0%) | 4.10 |
| Total Families | 77 (100.0%) | 2.87 |
Median Household Size in Andersonville
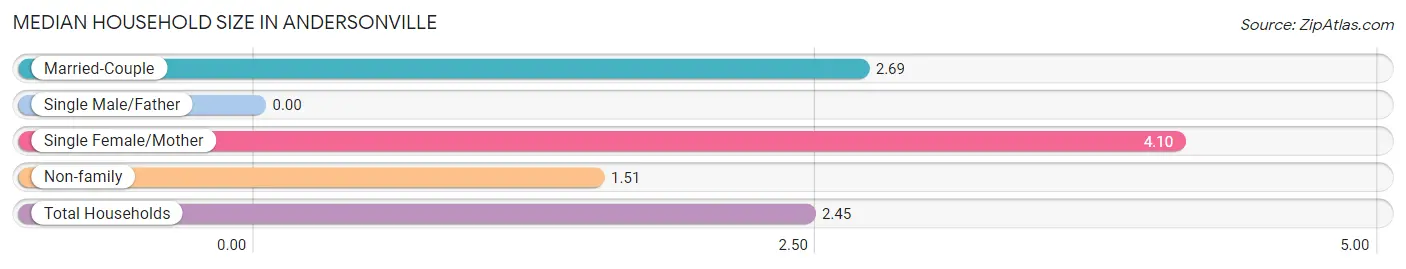
| Household Type | # Households | Household Size |
| Married-Couple | 67 (59.8%) | 2.69 |
| Single Male/Father | 0 (0.0%) | - |
| Single Female/Mother | 10 (8.9%) | 4.10 |
| Non-family | 35 (31.2%) | 1.51 |
| Total Households | 112 (100.0%) | 2.45 |
Household Size by Marriage Status in Andersonville
Out of a total of 112 households in Andersonville, 77 (68.8%) are family households, while 35 (31.2%) are nonfamily households. The most numerous type of family households are 3-person households, comprising 40, and the most common type of nonfamily households are 2-person households, comprising 18.
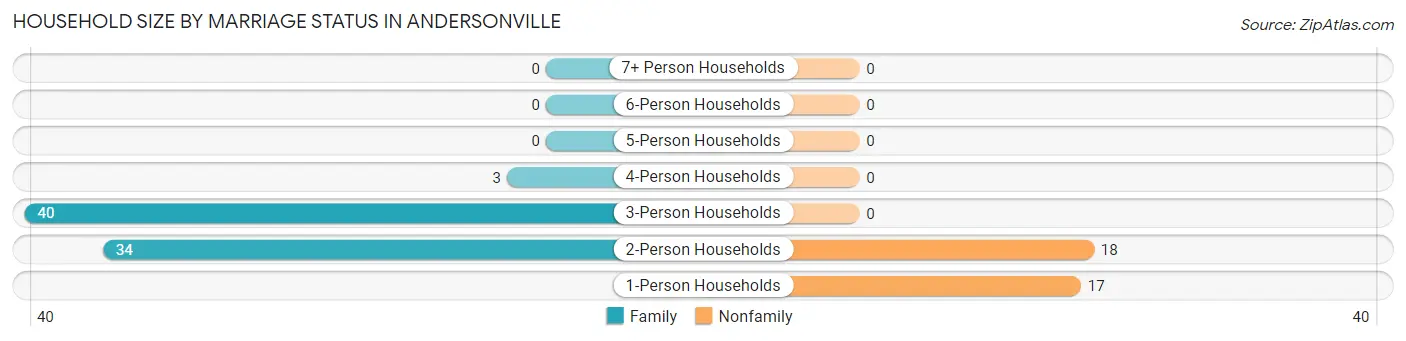
| Household Size | Family Households | Nonfamily Households |
| 1-Person Households | - | 17 (15.2%) |
| 2-Person Households | 34 (30.4%) | 18 (16.1%) |
| 3-Person Households | 40 (35.7%) | 0 (0.0%) |
| 4-Person Households | 3 (2.7%) | 0 (0.0%) |
| 5-Person Households | 0 (0.0%) | 0 (0.0%) |
| 6-Person Households | 0 (0.0%) | 0 (0.0%) |
| 7+ Person Households | 0 (0.0%) | 0 (0.0%) |
| Total | 77 (68.8%) | 35 (31.2%) |
Female Fertility in Andersonville
Fertility by Age in Andersonville
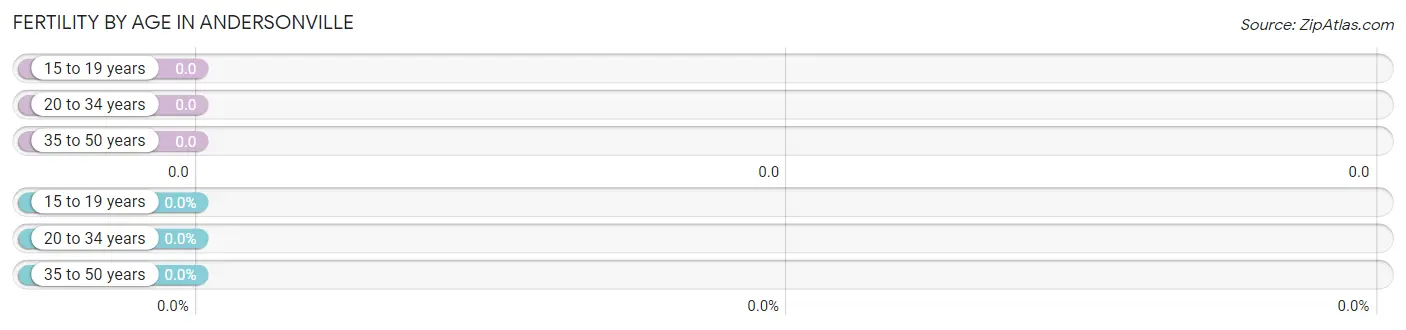
| Age Bracket | Women with Births | Births / 1,000 Women |
| 15 to 19 years | 0 (0.0%) | 0.0 |
| 20 to 34 years | 0 (0.0%) | 0.0 |
| 35 to 50 years | 0 (0.0%) | 0.0 |
| Total | 0 (0.0%) | 0.0 |
Fertility by Age by Marriage Status in Andersonville
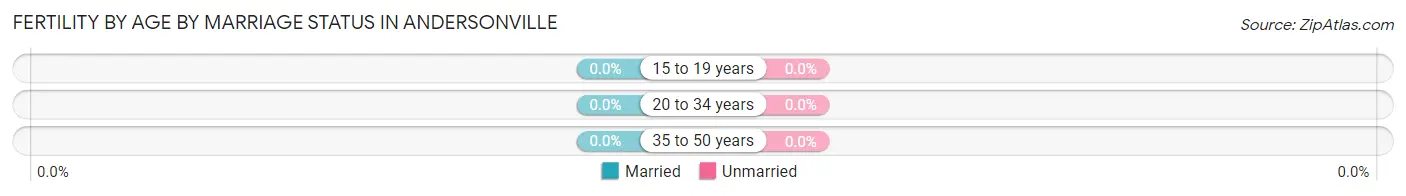
| Age Bracket | Married | Unmarried |
| 15 to 19 years | 0 (0.0%) | 0 (0.0%) |
| 20 to 34 years | 0 (0.0%) | 0 (0.0%) |
| 35 to 50 years | 0 (0.0%) | 0 (0.0%) |
| Total | 0 (0.0%) | 0 (0.0%) |
Fertility by Education in Andersonville
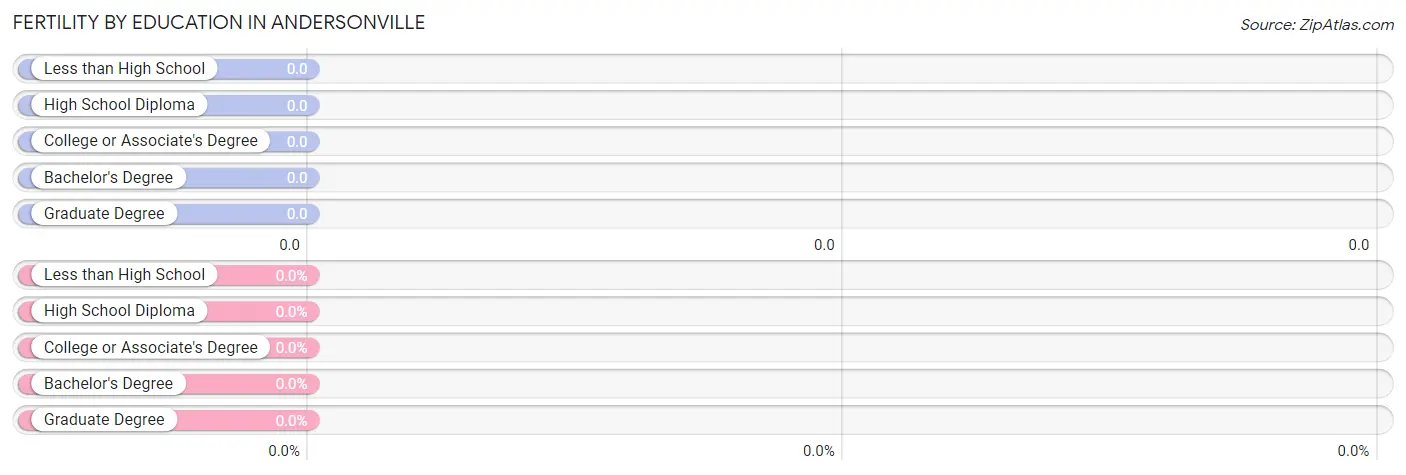
| Educational Attainment | Women with Births | Births / 1,000 Women |
| Less than High School | 0 (0.0%) | 0.0 |
| High School Diploma | 0 (0.0%) | 0.0 |
| College or Associate's Degree | 0 (0.0%) | 0.0 |
| Bachelor's Degree | 0 (0.0%) | 0.0 |
| Graduate Degree | 0 (0.0%) | 0.0 |
| Total | 0 (0.0%) | 0.0 |
Fertility by Education by Marriage Status in Andersonville
| Educational Attainment | Married | Unmarried |
| Less than High School | 0 (0.0%) | 0 (0.0%) |
| High School Diploma | 0 (0.0%) | 0 (0.0%) |
| College or Associate's Degree | 0 (0.0%) | 0 (0.0%) |
| Bachelor's Degree | 0 (0.0%) | 0 (0.0%) |
| Graduate Degree | 0 (0.0%) | 0 (0.0%) |
| Total | 0 (0.0%) | 0 (0.0%) |
Employment Characteristics in Andersonville
Employment by Class of Employer in Andersonville
Among the 169 employed individuals in Andersonville, private company employees (118 | 69.8%), and federal government employees (51 | 30.2%) make up the most common classes of employment.
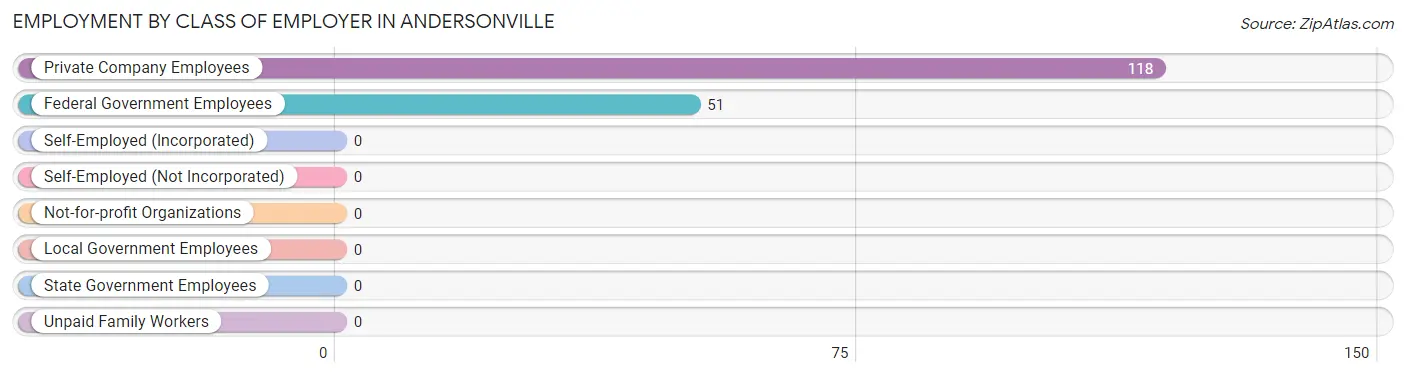
| Employer Class | # Employees | % Employees |
| Private Company Employees | 118 | 69.8% |
| Self-Employed (Incorporated) | 0 | 0.0% |
| Self-Employed (Not Incorporated) | 0 | 0.0% |
| Not-for-profit Organizations | 0 | 0.0% |
| Local Government Employees | 0 | 0.0% |
| State Government Employees | 0 | 0.0% |
| Federal Government Employees | 51 | 30.2% |
| Unpaid Family Workers | 0 | 0.0% |
| Total | 169 | 100.0% |
Employment Status by Age in Andersonville
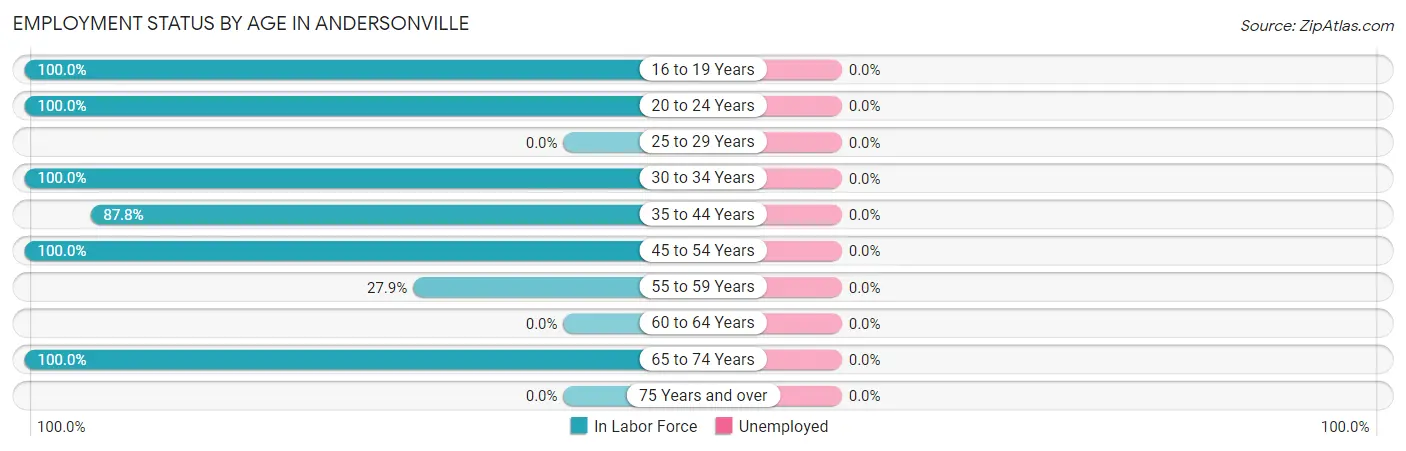
| Age Bracket | In Labor Force | Unemployed |
| 16 to 19 Years | 3 (100.0%) | 0 (0.0%) |
| 20 to 24 Years | 18 (100.0%) | 0 (0.0%) |
| 25 to 29 Years | 0 (0.0%) | 0 (0.0%) |
| 30 to 34 Years | 27 (100.0%) | 0 (0.0%) |
| 35 to 44 Years | 72 (87.8%) | 0 (0.0%) |
| 45 to 54 Years | 37 (100.0%) | 0 (0.0%) |
| 55 to 59 Years | 12 (27.9%) | 0 (0.0%) |
| 60 to 64 Years | 0 (0.0%) | 0 (0.0%) |
| 65 to 74 Years | 18 (100.0%) | 0 (0.0%) |
| 75 Years and over | 0 (0.0%) | 0 (0.0%) |
| Total | 187 (72.8%) | 0 (0.0%) |
Employment Status by Educational Attainment in Andersonville
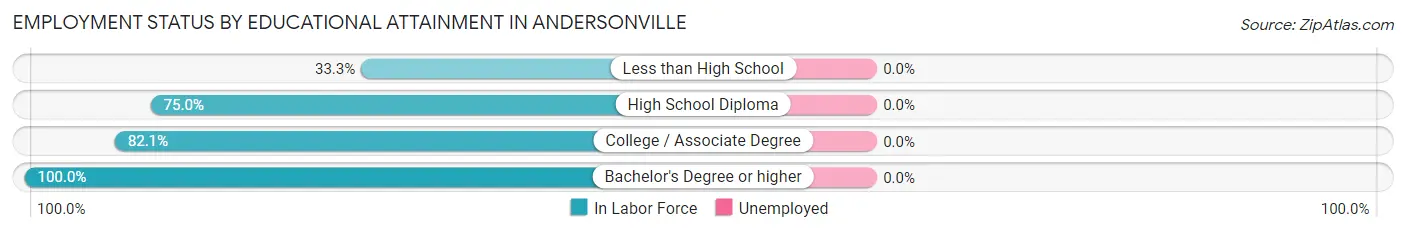
| Educational Attainment | In Labor Force | Unemployed |
| Less than High School | 9 (33.3%) | 0 (0.0%) |
| High School Diploma | 39 (75.0%) | 0 (0.0%) |
| College / Associate Degree | 46 (82.1%) | 0 (0.0%) |
| Bachelor's Degree or higher | 54 (100.0%) | 0 (0.0%) |
| Total | 148 (78.3%) | 0 (0.0%) |
Employment Occupations by Sex in Andersonville
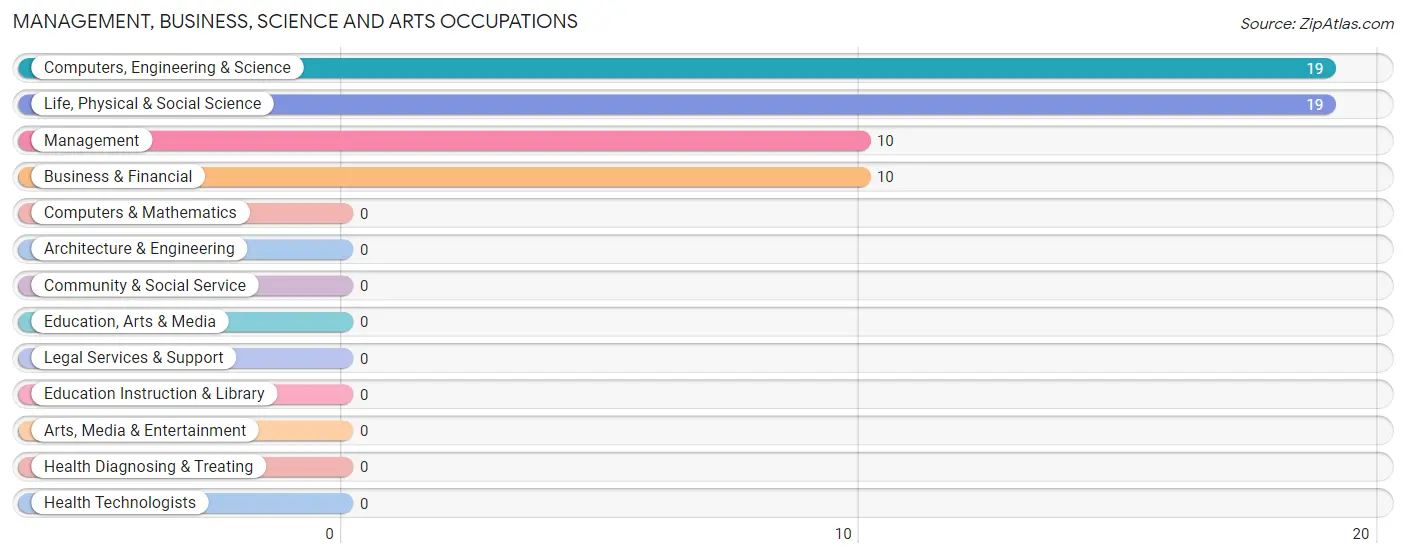
Management, Business, Science and Arts Occupations
The most common Management, Business, Science and Arts occupations in Andersonville are Computers, Engineering & Science (19 | 10.2%), Life, Physical & Social Science (19 | 10.2%), Management (10 | 5.3%), and Business & Financial (10 | 5.3%).
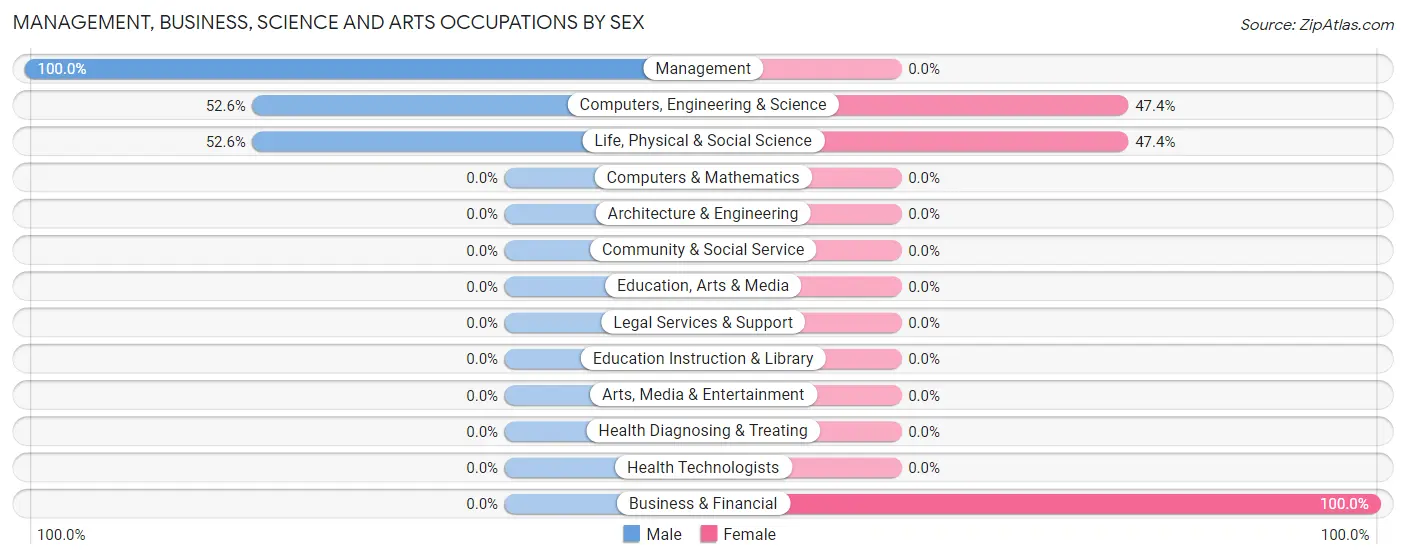
Management, Business, Science and Arts Occupations by Sex
Within the Management, Business, Science and Arts occupations in Andersonville, the most male-oriented occupations are Management (100.0%), Computers, Engineering & Science (52.6%), and Life, Physical & Social Science (52.6%), while the most female-oriented occupations are Business & Financial (100.0%), Computers, Engineering & Science (47.4%), and Life, Physical & Social Science (47.4%).
| Occupation | Male | Female |
| Management | 10 (100.0%) | 0 (0.0%) |
| Business & Financial | 0 (0.0%) | 10 (100.0%) |
| Computers, Engineering & Science | 10 (52.6%) | 9 (47.4%) |
| Computers & Mathematics | 0 (0.0%) | 0 (0.0%) |
| Architecture & Engineering | 0 (0.0%) | 0 (0.0%) |
| Life, Physical & Social Science | 10 (52.6%) | 9 (47.4%) |
| Community & Social Service | 0 (0.0%) | 0 (0.0%) |
| Education, Arts & Media | 0 (0.0%) | 0 (0.0%) |
| Legal Services & Support | 0 (0.0%) | 0 (0.0%) |
| Education Instruction & Library | 0 (0.0%) | 0 (0.0%) |
| Arts, Media & Entertainment | 0 (0.0%) | 0 (0.0%) |
| Health Diagnosing & Treating | 0 (0.0%) | 0 (0.0%) |
| Health Technologists | 0 (0.0%) | 0 (0.0%) |
| Total (Category) | 20 (51.3%) | 19 (48.7%) |
| Total (Overall) | 77 (41.2%) | 110 (58.8%) |
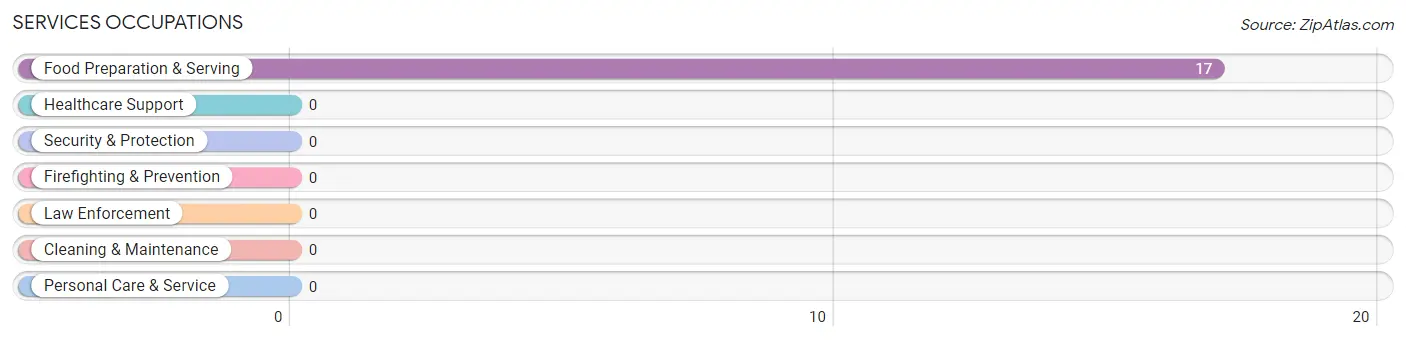
Services Occupations
The most common Services occupations in Andersonville are , and Food Preparation & Serving (17 | 9.1%).
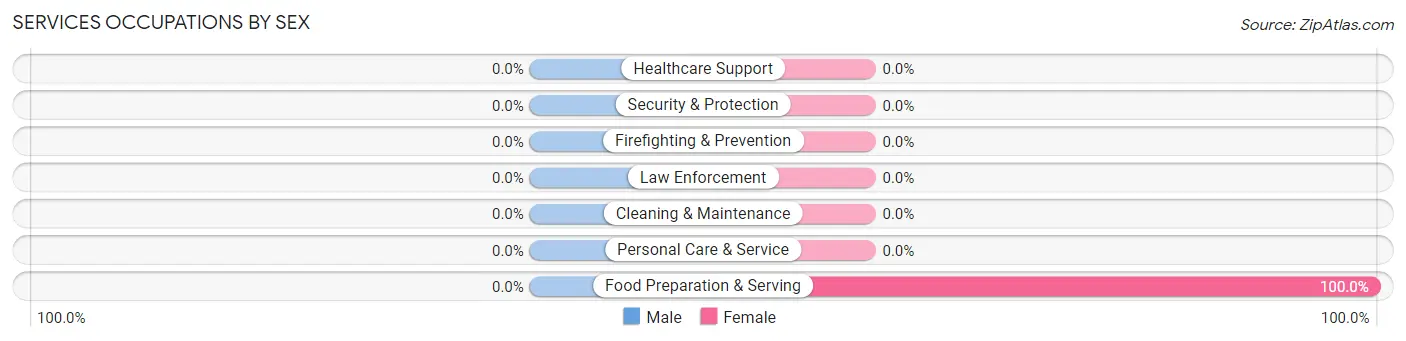
Services Occupations by Sex
| Occupation | Male | Female |
| Healthcare Support | 0 (0.0%) | 0 (0.0%) |
| Security & Protection | 0 (0.0%) | 0 (0.0%) |
| Firefighting & Prevention | 0 (0.0%) | 0 (0.0%) |
| Law Enforcement | 0 (0.0%) | 0 (0.0%) |
| Food Preparation & Serving | 0 (0.0%) | 17 (100.0%) |
| Cleaning & Maintenance | 0 (0.0%) | 0 (0.0%) |
| Personal Care & Service | 0 (0.0%) | 0 (0.0%) |
| Total (Category) | 0 (0.0%) | 17 (100.0%) |
| Total (Overall) | 77 (41.2%) | 110 (58.8%) |
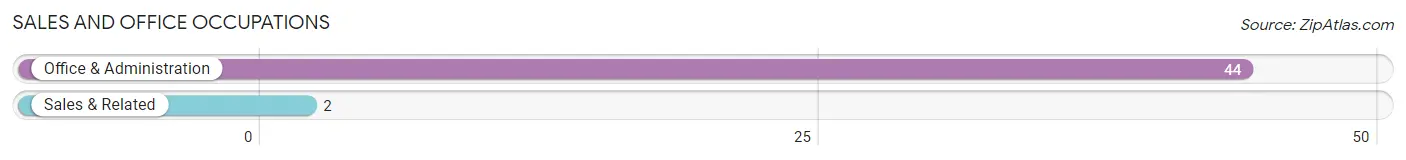
Sales and Office Occupations
The most common Sales and Office occupations in Andersonville are Office & Administration (44 | 23.5%), and Sales & Related (2 | 1.1%).
Sales and Office Occupations by Sex
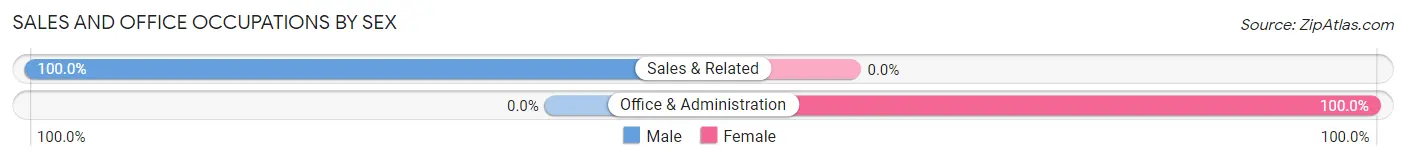
| Occupation | Male | Female |
| Sales & Related | 2 (100.0%) | 0 (0.0%) |
| Office & Administration | 0 (0.0%) | 44 (100.0%) |
| Total (Category) | 2 (4.3%) | 44 (95.7%) |
| Total (Overall) | 77 (41.2%) | 110 (58.8%) |
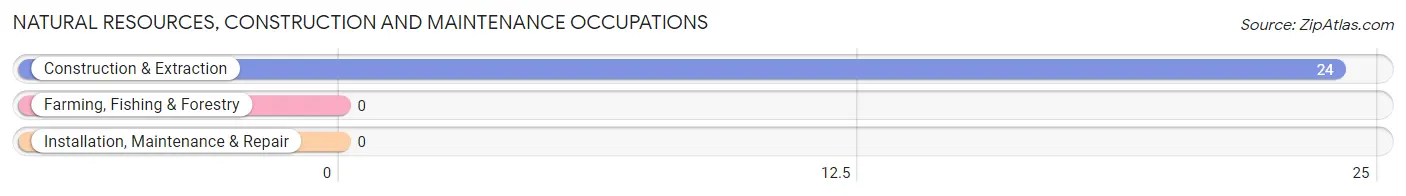
Natural Resources, Construction and Maintenance Occupations
The most common Natural Resources, Construction and Maintenance occupations in Andersonville are , and Construction & Extraction (24 | 12.8%).
Natural Resources, Construction and Maintenance Occupations by Sex
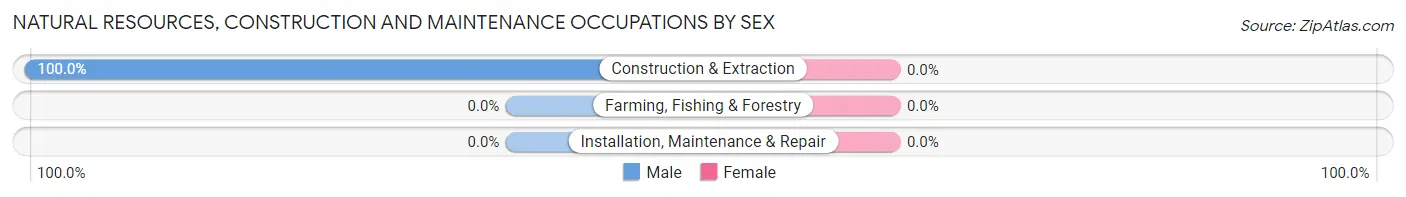
| Occupation | Male | Female |
| Farming, Fishing & Forestry | 0 (0.0%) | 0 (0.0%) |
| Construction & Extraction | 24 (100.0%) | 0 (0.0%) |
| Installation, Maintenance & Repair | 0 (0.0%) | 0 (0.0%) |
| Total (Category) | 24 (100.0%) | 0 (0.0%) |
| Total (Overall) | 77 (41.2%) | 110 (58.8%) |
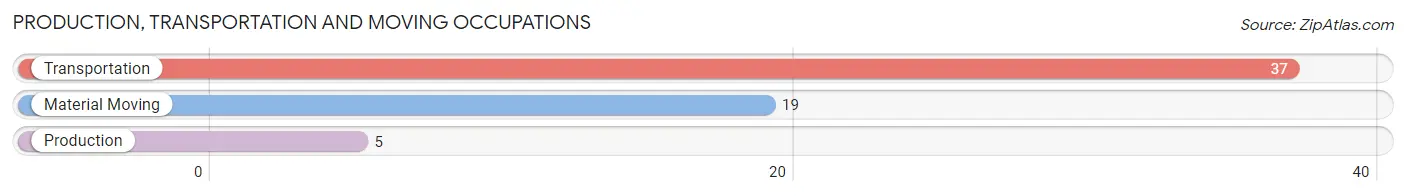
Production, Transportation and Moving Occupations
The most common Production, Transportation and Moving occupations in Andersonville are Transportation (37 | 19.8%), Material Moving (19 | 10.2%), and Production (5 | 2.7%).
Production, Transportation and Moving Occupations by Sex
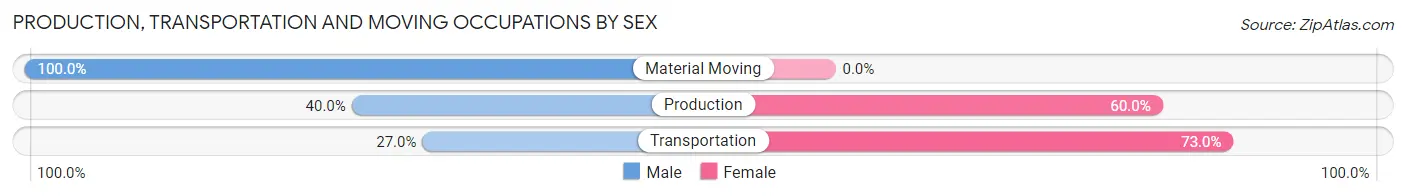
| Occupation | Male | Female |
| Production | 2 (40.0%) | 3 (60.0%) |
| Transportation | 10 (27.0%) | 27 (73.0%) |
| Material Moving | 19 (100.0%) | 0 (0.0%) |
| Total (Category) | 31 (50.8%) | 30 (49.2%) |
| Total (Overall) | 77 (41.2%) | 110 (58.8%) |
Employment Industries by Sex in Andersonville
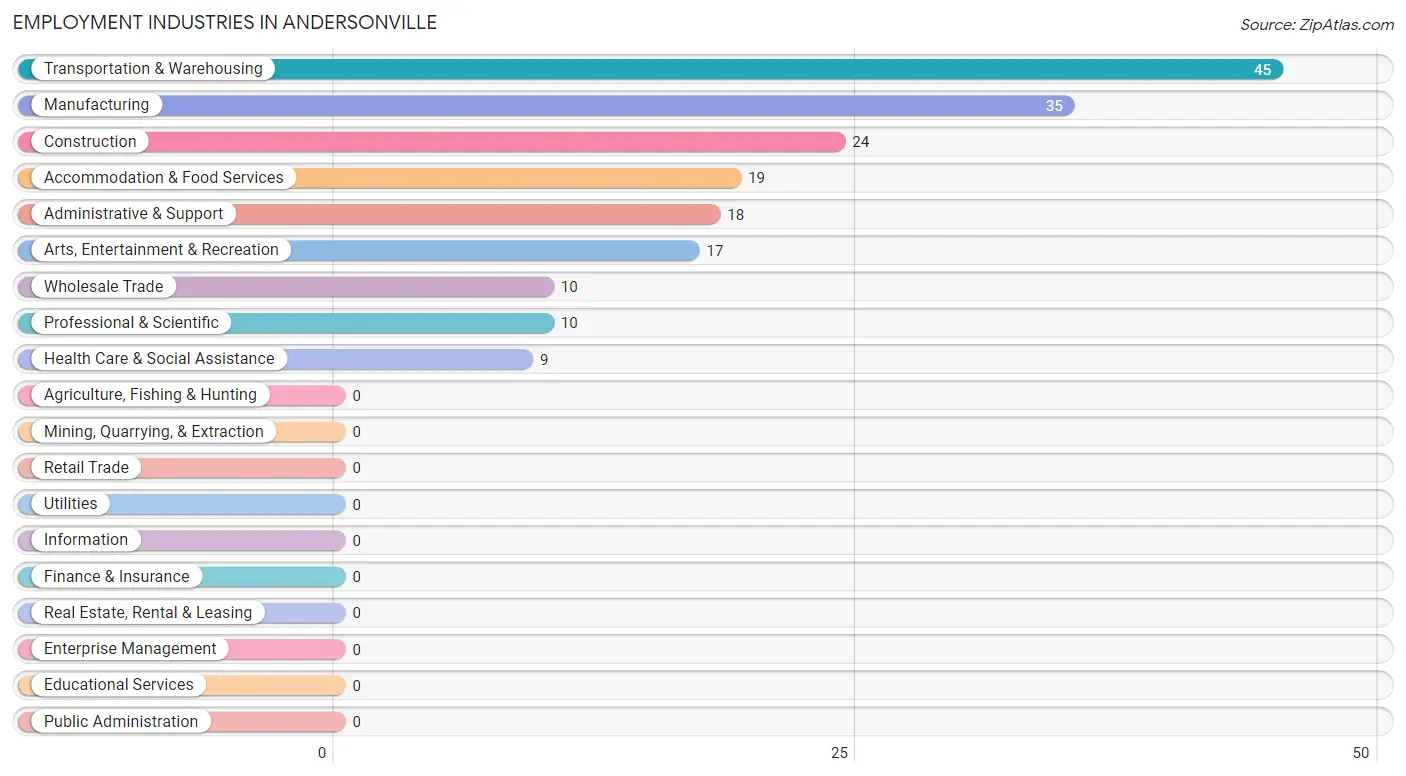
Employment Industries in Andersonville
The major employment industries in Andersonville include Transportation & Warehousing (45 | 24.1%), Manufacturing (35 | 18.7%), Construction (24 | 12.8%), Accommodation & Food Services (19 | 10.2%), and Administrative & Support (18 | 9.6%).
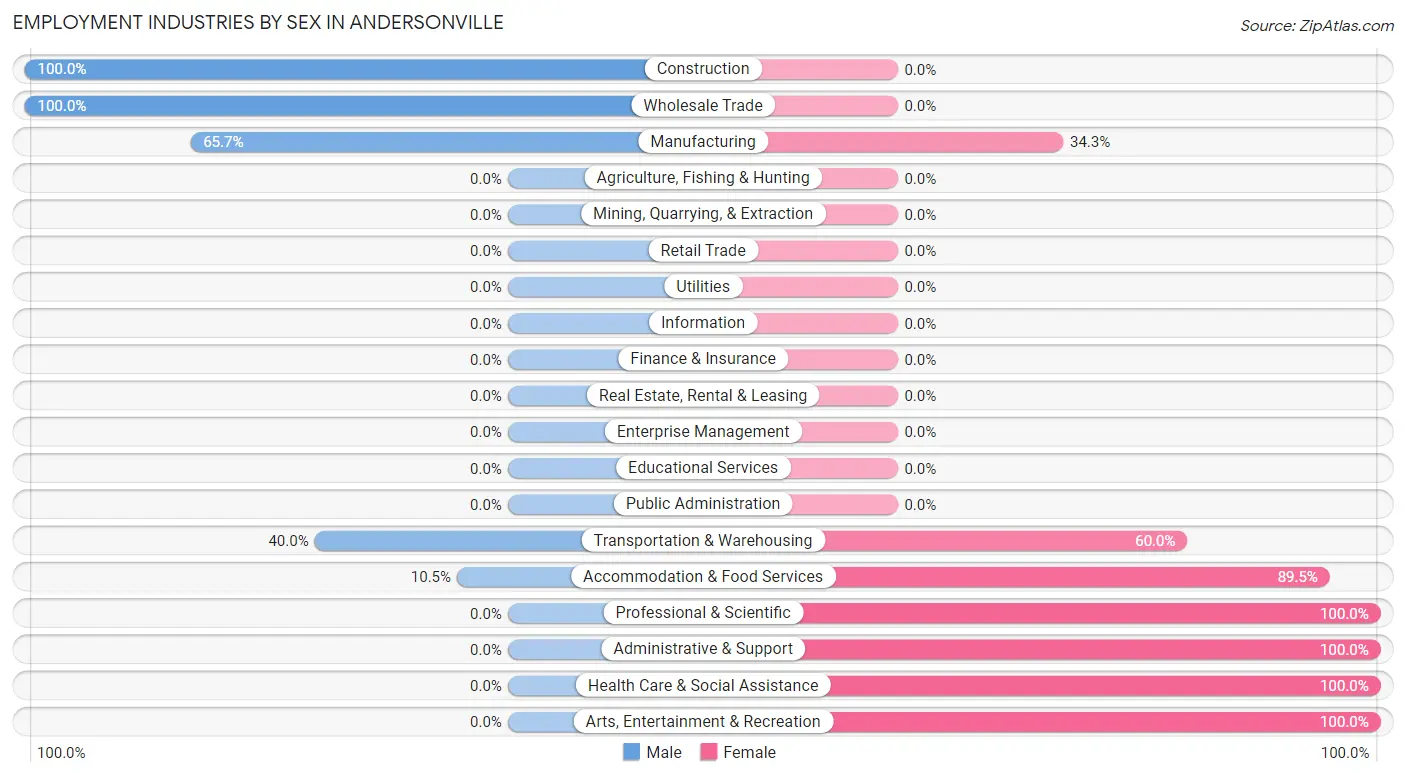
Employment Industries by Sex in Andersonville
The Andersonville industries that see more men than women are Construction (100.0%), Wholesale Trade (100.0%), and Manufacturing (65.7%), whereas the industries that tend to have a higher number of women are Professional & Scientific (100.0%), Administrative & Support (100.0%), and Health Care & Social Assistance (100.0%).
| Industry | Male | Female |
| Agriculture, Fishing & Hunting | 0 (0.0%) | 0 (0.0%) |
| Mining, Quarrying, & Extraction | 0 (0.0%) | 0 (0.0%) |
| Construction | 24 (100.0%) | 0 (0.0%) |
| Manufacturing | 23 (65.7%) | 12 (34.3%) |
| Wholesale Trade | 10 (100.0%) | 0 (0.0%) |
| Retail Trade | 0 (0.0%) | 0 (0.0%) |
| Transportation & Warehousing | 18 (40.0%) | 27 (60.0%) |
| Utilities | 0 (0.0%) | 0 (0.0%) |
| Information | 0 (0.0%) | 0 (0.0%) |
| Finance & Insurance | 0 (0.0%) | 0 (0.0%) |
| Real Estate, Rental & Leasing | 0 (0.0%) | 0 (0.0%) |
| Professional & Scientific | 0 (0.0%) | 10 (100.0%) |
| Enterprise Management | 0 (0.0%) | 0 (0.0%) |
| Administrative & Support | 0 (0.0%) | 18 (100.0%) |
| Educational Services | 0 (0.0%) | 0 (0.0%) |
| Health Care & Social Assistance | 0 (0.0%) | 9 (100.0%) |
| Arts, Entertainment & Recreation | 0 (0.0%) | 17 (100.0%) |
| Accommodation & Food Services | 2 (10.5%) | 17 (89.5%) |
| Public Administration | 0 (0.0%) | 0 (0.0%) |
| Total | 77 (41.2%) | 110 (58.8%) |
Education in Andersonville
School Enrollment in Andersonville
The most common levels of schooling among the 28 students in Andersonville are college / undergraduate (10 | 35.7%), middle school (9 | 32.1%), and elementary school (8 | 28.6%).
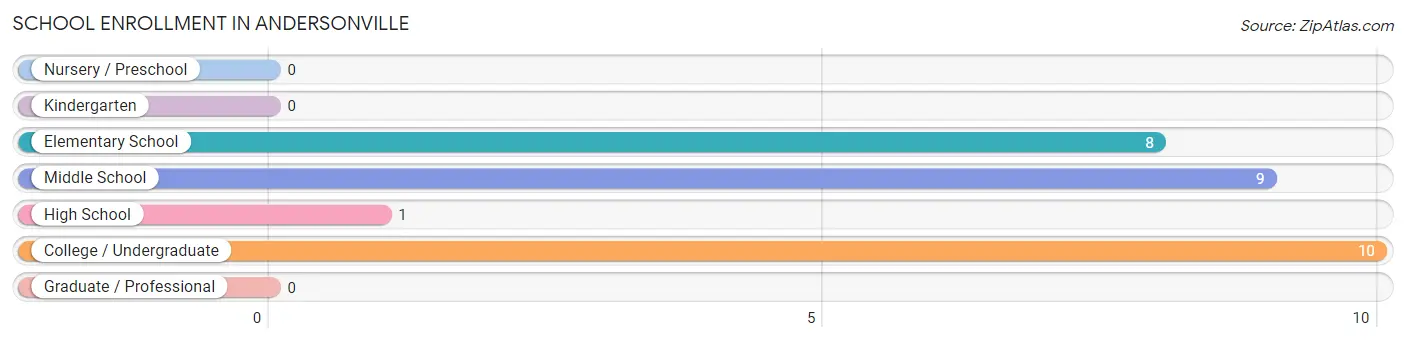
| School Level | # Students | % Students |
| Nursery / Preschool | 0 | 0.0% |
| Kindergarten | 0 | 0.0% |
| Elementary School | 8 | 28.6% |
| Middle School | 9 | 32.1% |
| High School | 1 | 3.6% |
| College / Undergraduate | 10 | 35.7% |
| Graduate / Professional | 0 | 0.0% |
| Total | 28 | 100.0% |
School Enrollment by Age by Funding Source in Andersonville
Out of a total of 28 students who are enrolled in schools in Andersonville, 9 (32.1%) attend a private institution, while the remaining 19 (67.9%) are enrolled in public schools. The age group of 10 to 14 year olds has the highest likelihood of being enrolled in private schools, with 9 (100.0% in the age bracket) enrolled. Conversely, the age group of 5 to 9 year old has the lowest likelihood of being enrolled in a private school, with 8 (100.0% in the age bracket) attending a public institution.
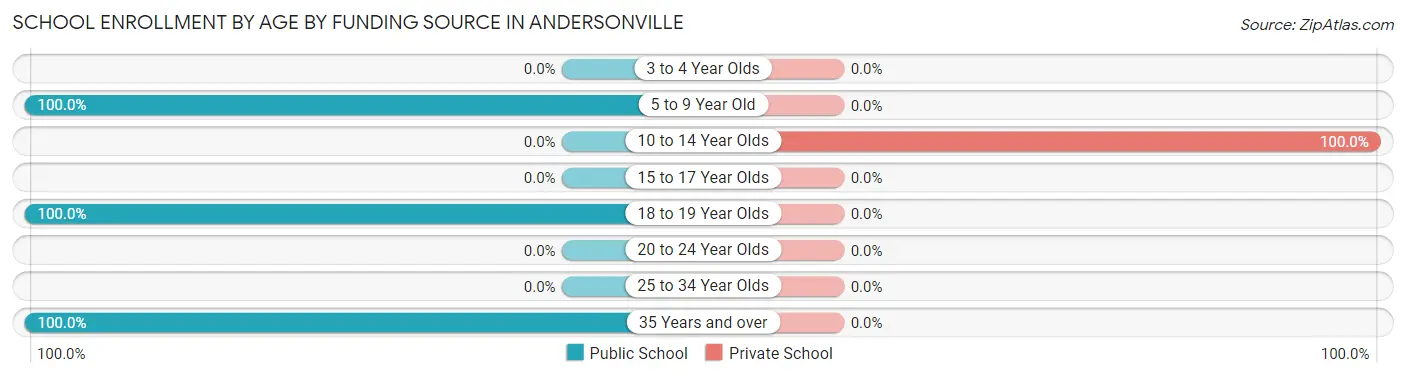
| Age Bracket | Public School | Private School |
| 3 to 4 Year Olds | 0 (0.0%) | 0 (0.0%) |
| 5 to 9 Year Old | 8 (100.0%) | 0 (0.0%) |
| 10 to 14 Year Olds | 0 (0.0%) | 9 (100.0%) |
| 15 to 17 Year Olds | 0 (0.0%) | 0 (0.0%) |
| 18 to 19 Year Olds | 1 (100.0%) | 0 (0.0%) |
| 20 to 24 Year Olds | 0 (0.0%) | 0 (0.0%) |
| 25 to 34 Year Olds | 0 (0.0%) | 0 (0.0%) |
| 35 Years and over | 10 (100.0%) | 0 (0.0%) |
| Total | 19 (67.9%) | 9 (32.1%) |
Educational Attainment by Field of Study in Andersonville
Social sciences (27 | 50.0%), and business (27 | 50.0%) are the most common fields of study among 54 individuals in Andersonville who have obtained a bachelor's degree or higher.
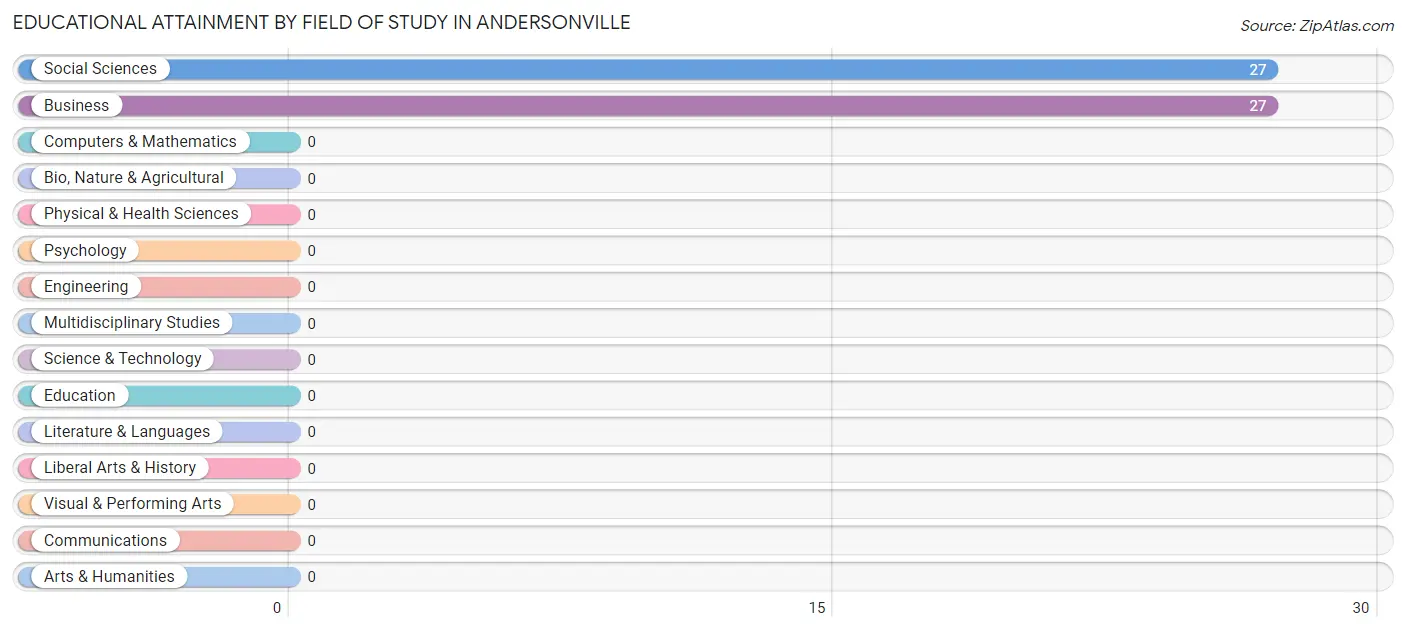
| Field of Study | # Graduates | % Graduates |
| Computers & Mathematics | 0 | 0.0% |
| Bio, Nature & Agricultural | 0 | 0.0% |
| Physical & Health Sciences | 0 | 0.0% |
| Psychology | 0 | 0.0% |
| Social Sciences | 27 | 50.0% |
| Engineering | 0 | 0.0% |
| Multidisciplinary Studies | 0 | 0.0% |
| Science & Technology | 0 | 0.0% |
| Business | 27 | 50.0% |
| Education | 0 | 0.0% |
| Literature & Languages | 0 | 0.0% |
| Liberal Arts & History | 0 | 0.0% |
| Visual & Performing Arts | 0 | 0.0% |
| Communications | 0 | 0.0% |
| Arts & Humanities | 0 | 0.0% |
| Total | 54 | 100.0% |
Transportation & Commute in Andersonville
Vehicle Availability by Sex in Andersonville
The most prevalent vehicle ownership categories in Andersonville are males with no vehicle (24, accounting for 40.7%) and females with no vehicle (27, making up 21.8%).
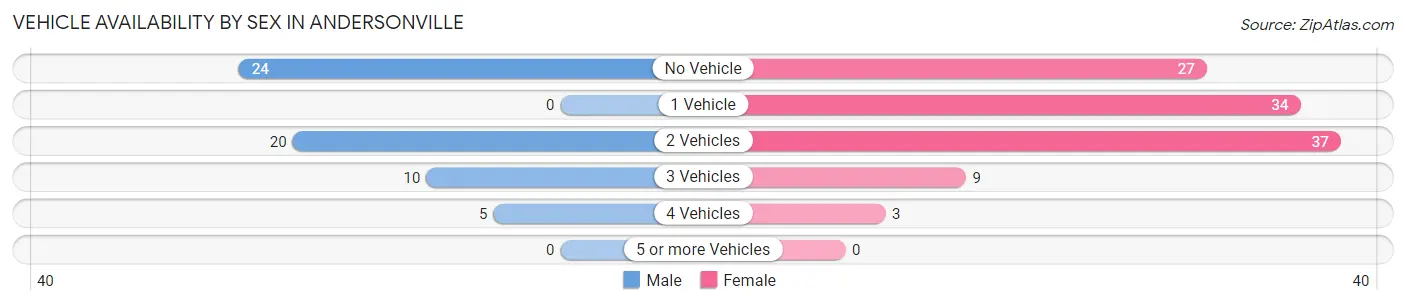
| Vehicles Available | Male | Female |
| No Vehicle | 24 (40.7%) | 27 (24.5%) |
| 1 Vehicle | 0 (0.0%) | 34 (30.9%) |
| 2 Vehicles | 20 (33.9%) | 37 (33.6%) |
| 3 Vehicles | 10 (17.0%) | 9 (8.2%) |
| 4 Vehicles | 5 (8.5%) | 3 (2.7%) |
| 5 or more Vehicles | 0 (0.0%) | 0 (0.0%) |
| Total | 59 (100.0%) | 110 (100.0%) |
Commute Time in Andersonville
The most frequently occuring commute durations in Andersonville are 30 to 34 minutes (75 commuters, 44.4%), 5 to 9 minutes (19 commuters, 11.2%), and 60 to 89 minutes (19 commuters, 11.2%).
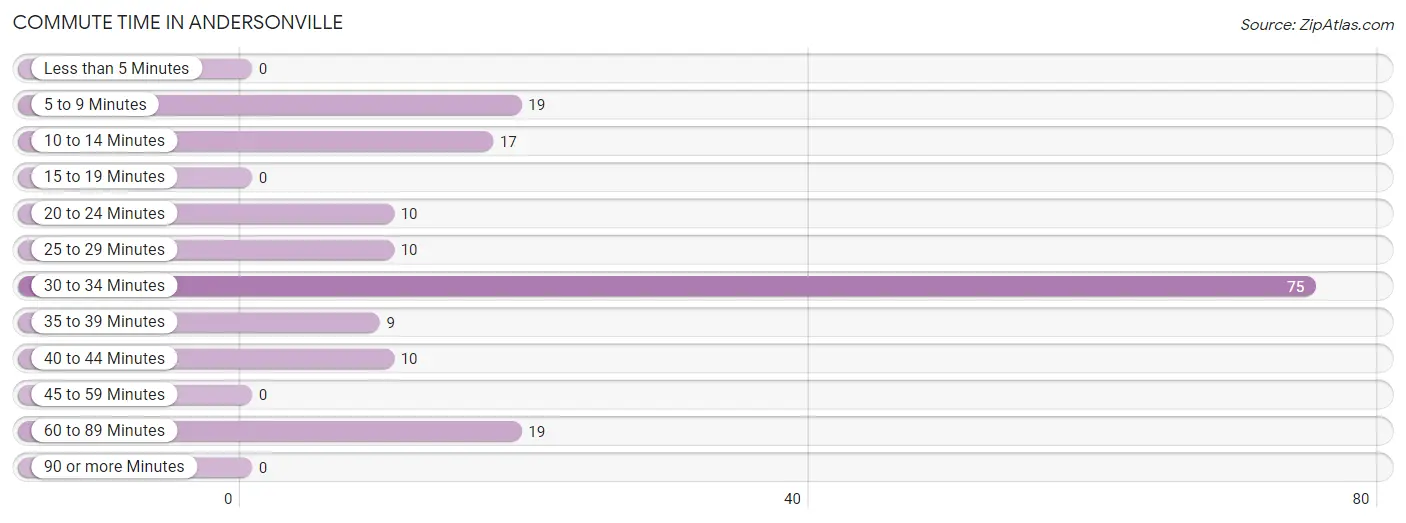
| Commute Time | # Commuters | % Commuters |
| Less than 5 Minutes | 0 | 0.0% |
| 5 to 9 Minutes | 19 | 11.2% |
| 10 to 14 Minutes | 17 | 10.1% |
| 15 to 19 Minutes | 0 | 0.0% |
| 20 to 24 Minutes | 10 | 5.9% |
| 25 to 29 Minutes | 10 | 5.9% |
| 30 to 34 Minutes | 75 | 44.4% |
| 35 to 39 Minutes | 9 | 5.3% |
| 40 to 44 Minutes | 10 | 5.9% |
| 45 to 59 Minutes | 0 | 0.0% |
| 60 to 89 Minutes | 19 | 11.2% |
| 90 or more Minutes | 0 | 0.0% |
Commute Time by Sex in Andersonville
The most common commute times in Andersonville are 30 to 34 minutes (27 commuters, 45.8%) for males and 30 to 34 minutes (48 commuters, 43.6%) for females.
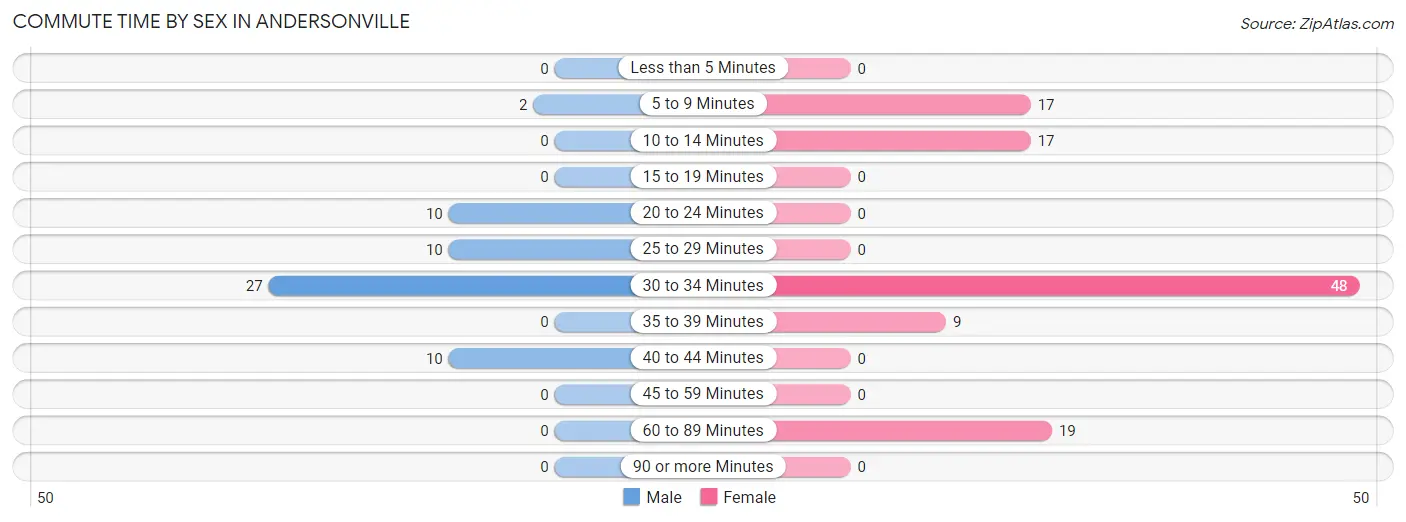
| Commute Time | Male | Female |
| Less than 5 Minutes | 0 (0.0%) | 0 (0.0%) |
| 5 to 9 Minutes | 2 (3.4%) | 17 (15.4%) |
| 10 to 14 Minutes | 0 (0.0%) | 17 (15.4%) |
| 15 to 19 Minutes | 0 (0.0%) | 0 (0.0%) |
| 20 to 24 Minutes | 10 (17.0%) | 0 (0.0%) |
| 25 to 29 Minutes | 10 (17.0%) | 0 (0.0%) |
| 30 to 34 Minutes | 27 (45.8%) | 48 (43.6%) |
| 35 to 39 Minutes | 0 (0.0%) | 9 (8.2%) |
| 40 to 44 Minutes | 10 (17.0%) | 0 (0.0%) |
| 45 to 59 Minutes | 0 (0.0%) | 0 (0.0%) |
| 60 to 89 Minutes | 0 (0.0%) | 19 (17.3%) |
| 90 or more Minutes | 0 (0.0%) | 0 (0.0%) |
Time of Departure to Work by Sex in Andersonville
The most frequent times of departure to work in Andersonville are 5:00 AM to 5:29 AM (24, 40.7%) for males and 7:00 AM to 7:29 AM (44, 40.0%) for females.
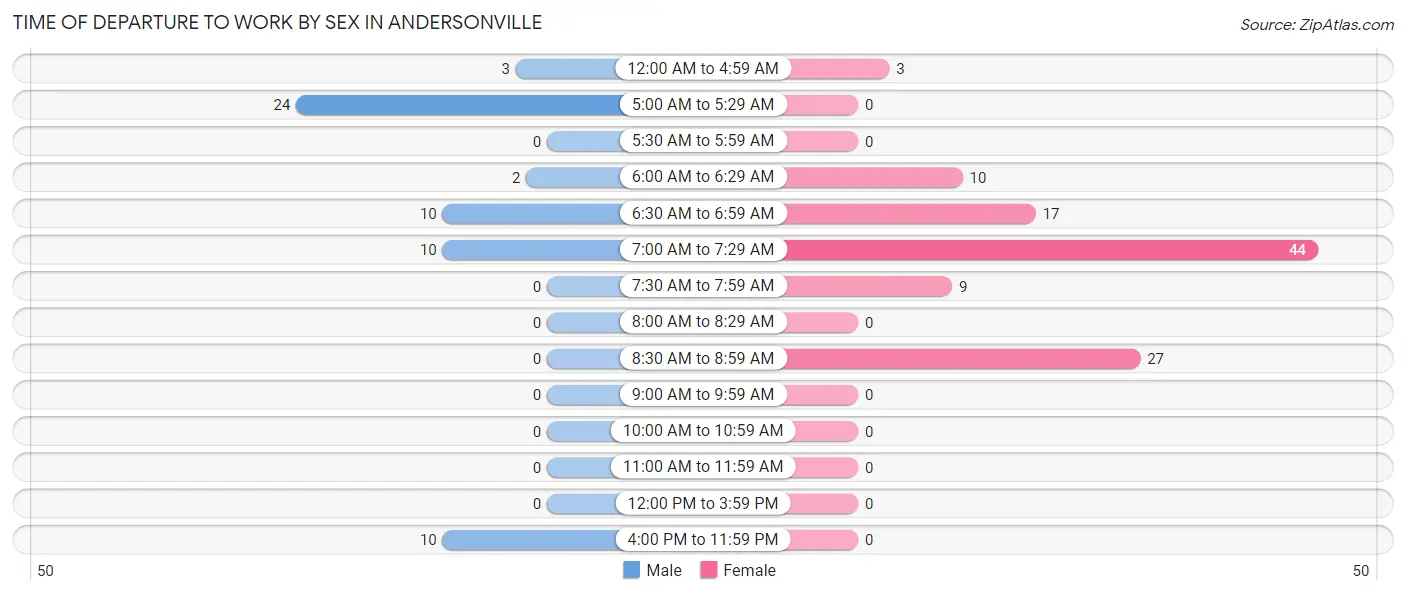
| Time of Departure | Male | Female |
| 12:00 AM to 4:59 AM | 3 (5.1%) | 3 (2.7%) |
| 5:00 AM to 5:29 AM | 24 (40.7%) | 0 (0.0%) |
| 5:30 AM to 5:59 AM | 0 (0.0%) | 0 (0.0%) |
| 6:00 AM to 6:29 AM | 2 (3.4%) | 10 (9.1%) |
| 6:30 AM to 6:59 AM | 10 (17.0%) | 17 (15.4%) |
| 7:00 AM to 7:29 AM | 10 (17.0%) | 44 (40.0%) |
| 7:30 AM to 7:59 AM | 0 (0.0%) | 9 (8.2%) |
| 8:00 AM to 8:29 AM | 0 (0.0%) | 0 (0.0%) |
| 8:30 AM to 8:59 AM | 0 (0.0%) | 27 (24.5%) |
| 9:00 AM to 9:59 AM | 0 (0.0%) | 0 (0.0%) |
| 10:00 AM to 10:59 AM | 0 (0.0%) | 0 (0.0%) |
| 11:00 AM to 11:59 AM | 0 (0.0%) | 0 (0.0%) |
| 12:00 PM to 3:59 PM | 0 (0.0%) | 0 (0.0%) |
| 4:00 PM to 11:59 PM | 10 (17.0%) | 0 (0.0%) |
| Total | 59 (100.0%) | 110 (100.0%) |
Housing Occupancy in Andersonville
Occupancy by Ownership in Andersonville
Of the total 112 dwellings in Andersonville, owner-occupied units account for 57 (50.9%), while renter-occupied units make up 55 (49.1%).
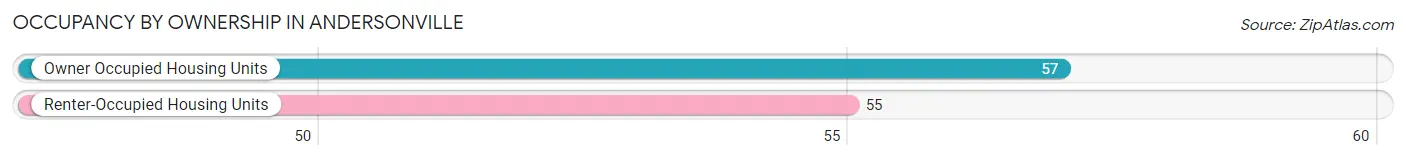
| Occupancy | # Housing Units | % Housing Units |
| Owner Occupied Housing Units | 57 | 50.9% |
| Renter-Occupied Housing Units | 55 | 49.1% |
| Total Occupied Housing Units | 112 | 100.0% |
Occupancy by Household Size in Andersonville
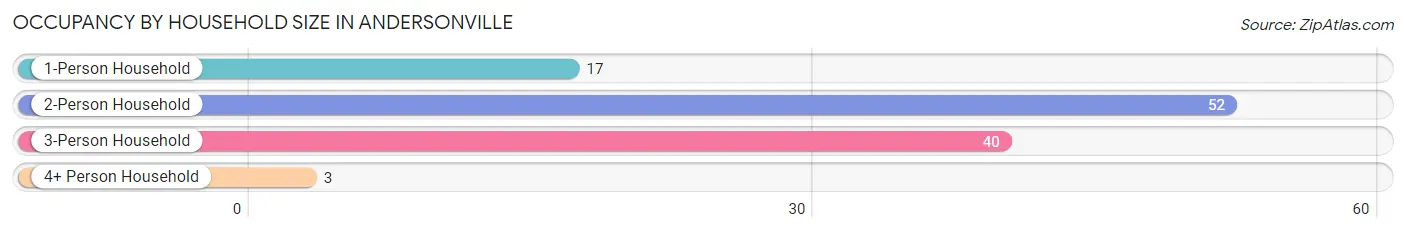
| Household Size | # Housing Units | % Housing Units |
| 1-Person Household | 17 | 15.2% |
| 2-Person Household | 52 | 46.4% |
| 3-Person Household | 40 | 35.7% |
| 4+ Person Household | 3 | 2.7% |
| Total Housing Units | 112 | 100.0% |
Occupancy by Ownership by Household Size in Andersonville
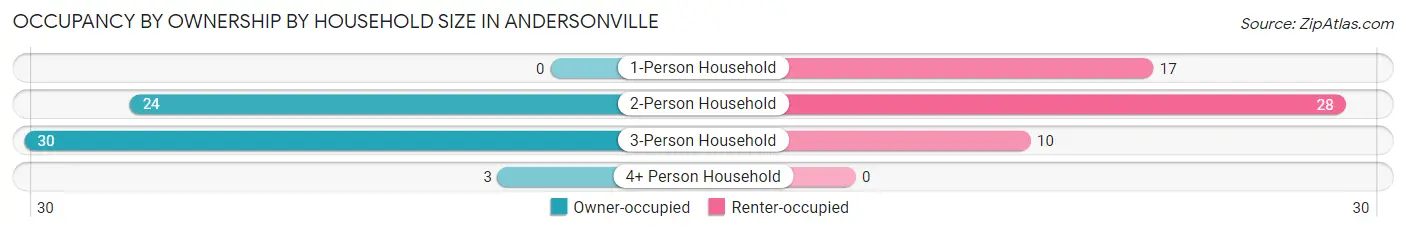
| Household Size | Owner-occupied | Renter-occupied |
| 1-Person Household | 0 (0.0%) | 17 (100.0%) |
| 2-Person Household | 24 (46.2%) | 28 (53.8%) |
| 3-Person Household | 30 (75.0%) | 10 (25.0%) |
| 4+ Person Household | 3 (100.0%) | 0 (0.0%) |
| Total Housing Units | 57 (50.9%) | 55 (49.1%) |
Occupancy by Educational Attainment in Andersonville
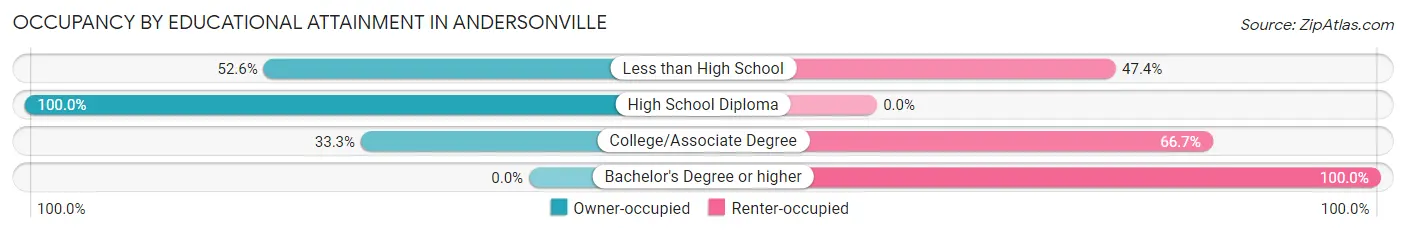
| Household Size | Owner-occupied | Renter-occupied |
| Less than High School | 20 (52.6%) | 18 (47.4%) |
| High School Diploma | 27 (100.0%) | 0 (0.0%) |
| College/Associate Degree | 10 (33.3%) | 20 (66.7%) |
| Bachelor's Degree or higher | 0 (0.0%) | 17 (100.0%) |
Occupancy by Age of Householder in Andersonville
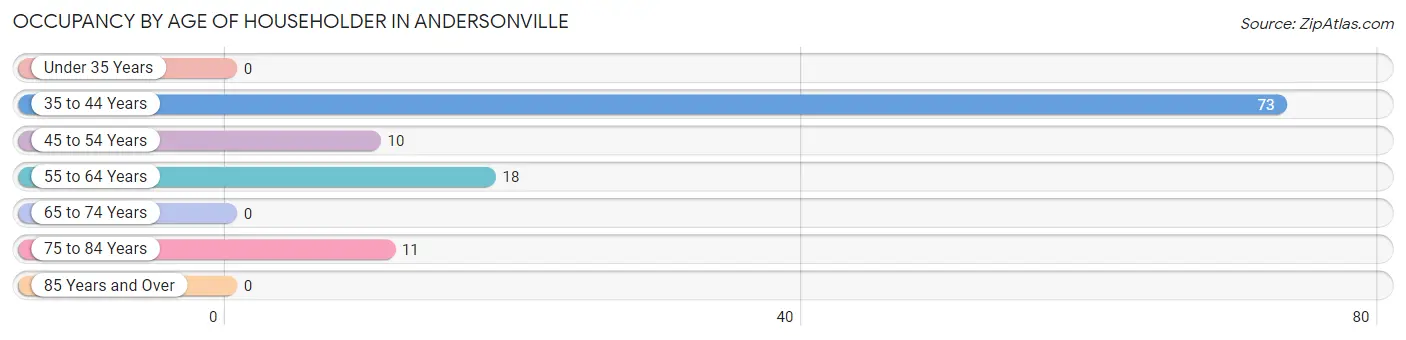
| Age Bracket | # Households | % Households |
| Under 35 Years | 0 | 0.0% |
| 35 to 44 Years | 73 | 65.2% |
| 45 to 54 Years | 10 | 8.9% |
| 55 to 64 Years | 18 | 16.1% |
| 65 to 74 Years | 0 | 0.0% |
| 75 to 84 Years | 11 | 9.8% |
| 85 Years and Over | 0 | 0.0% |
| Total | 112 | 100.0% |
Housing Finances in Andersonville
Median Income by Occupancy in Andersonville
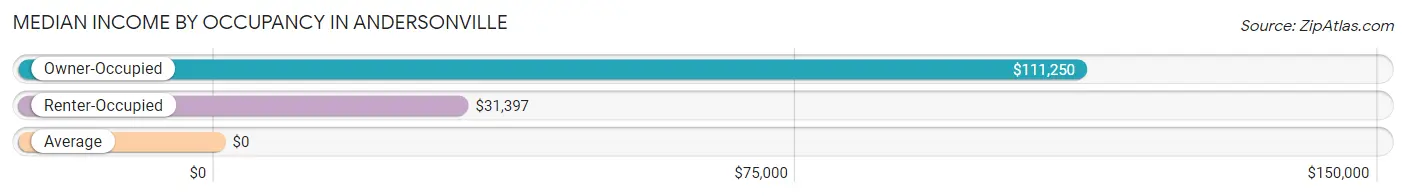
| Occupancy Type | # Households | Median Income |
| Owner-Occupied | 57 (50.9%) | $111,250 |
| Renter-Occupied | 55 (49.1%) | $31,397 |
| Average | 112 (100.0%) | $0 |
Occupancy by Householder Income Bracket in Andersonville
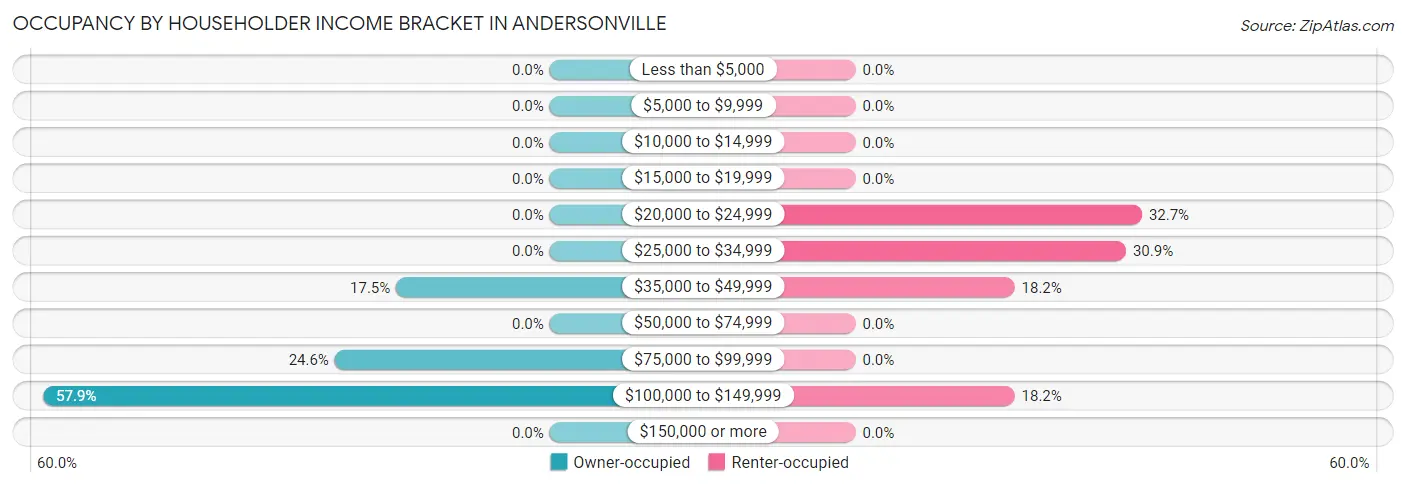
| Income Bracket | Owner-occupied | Renter-occupied |
| Less than $5,000 | 0 (0.0%) | 0 (0.0%) |
| $5,000 to $9,999 | 0 (0.0%) | 0 (0.0%) |
| $10,000 to $14,999 | 0 (0.0%) | 0 (0.0%) |
| $15,000 to $19,999 | 0 (0.0%) | 0 (0.0%) |
| $20,000 to $24,999 | 0 (0.0%) | 18 (32.7%) |
| $25,000 to $34,999 | 0 (0.0%) | 17 (30.9%) |
| $35,000 to $49,999 | 10 (17.5%) | 10 (18.2%) |
| $50,000 to $74,999 | 0 (0.0%) | 0 (0.0%) |
| $75,000 to $99,999 | 14 (24.6%) | 0 (0.0%) |
| $100,000 to $149,999 | 33 (57.9%) | 10 (18.2%) |
| $150,000 or more | 0 (0.0%) | 0 (0.0%) |
| Total | 57 (100.0%) | 55 (100.0%) |
Monthly Housing Cost Tiers in Andersonville
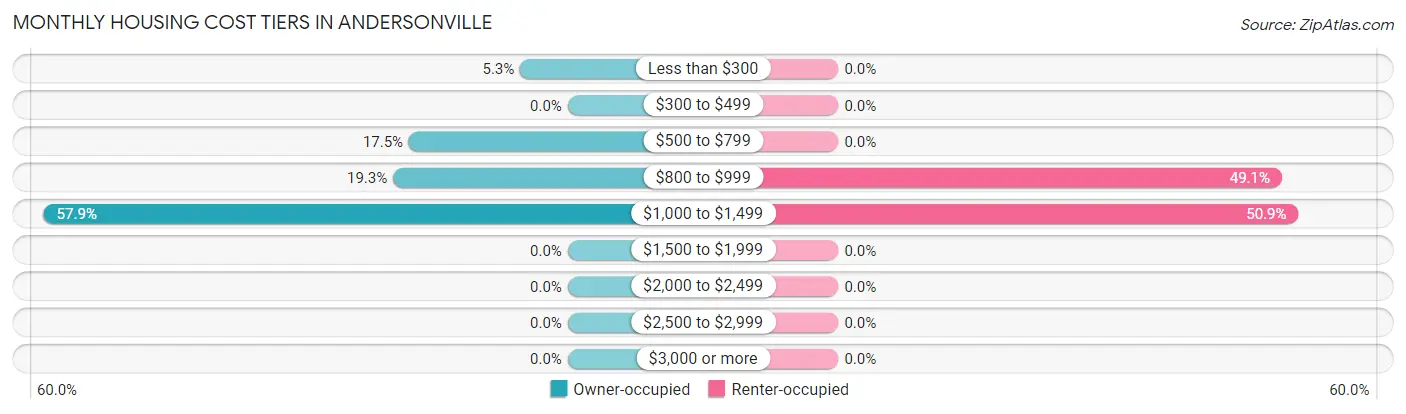
| Monthly Cost | Owner-occupied | Renter-occupied |
| Less than $300 | 3 (5.3%) | 0 (0.0%) |
| $300 to $499 | 0 (0.0%) | 0 (0.0%) |
| $500 to $799 | 10 (17.5%) | 0 (0.0%) |
| $800 to $999 | 11 (19.3%) | 27 (49.1%) |
| $1,000 to $1,499 | 33 (57.9%) | 28 (50.9%) |
| $1,500 to $1,999 | 0 (0.0%) | 0 (0.0%) |
| $2,000 to $2,499 | 0 (0.0%) | 0 (0.0%) |
| $2,500 to $2,999 | 0 (0.0%) | 0 (0.0%) |
| $3,000 or more | 0 (0.0%) | 0 (0.0%) |
| Total | 57 (100.0%) | 55 (100.0%) |
Physical Housing Characteristics in Andersonville
Housing Structures in Andersonville
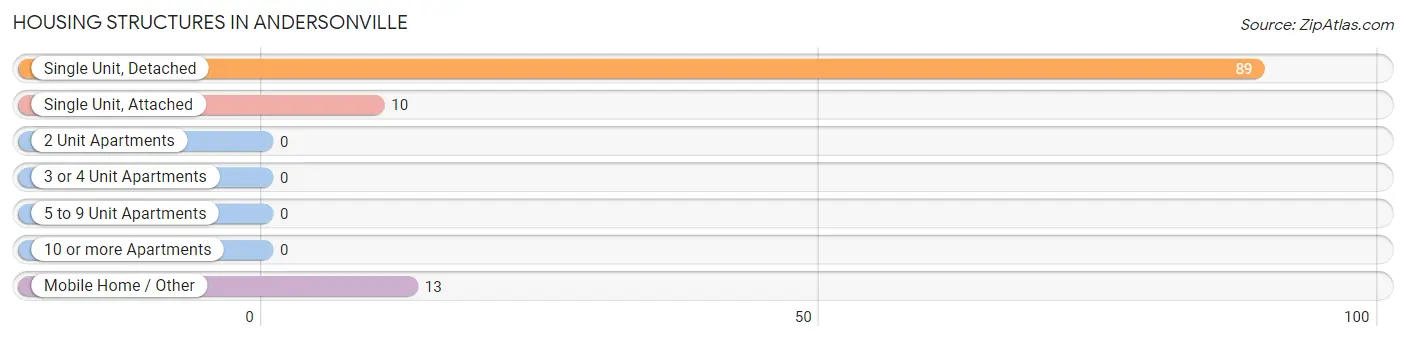
| Structure Type | # Housing Units | % Housing Units |
| Single Unit, Detached | 89 | 79.5% |
| Single Unit, Attached | 10 | 8.9% |
| 2 Unit Apartments | 0 | 0.0% |
| 3 or 4 Unit Apartments | 0 | 0.0% |
| 5 to 9 Unit Apartments | 0 | 0.0% |
| 10 or more Apartments | 0 | 0.0% |
| Mobile Home / Other | 13 | 11.6% |
| Total | 112 | 100.0% |
Housing Structures by Occupancy in Andersonville
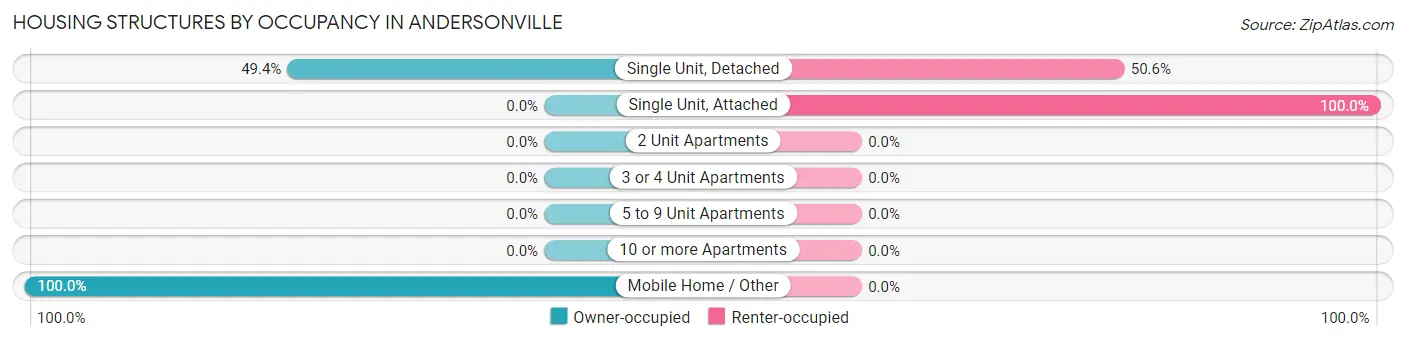
| Structure Type | Owner-occupied | Renter-occupied |
| Single Unit, Detached | 44 (49.4%) | 45 (50.6%) |
| Single Unit, Attached | 0 (0.0%) | 10 (100.0%) |
| 2 Unit Apartments | 0 (0.0%) | 0 (0.0%) |
| 3 or 4 Unit Apartments | 0 (0.0%) | 0 (0.0%) |
| 5 to 9 Unit Apartments | 0 (0.0%) | 0 (0.0%) |
| 10 or more Apartments | 0 (0.0%) | 0 (0.0%) |
| Mobile Home / Other | 13 (100.0%) | 0 (0.0%) |
| Total | 57 (50.9%) | 55 (49.1%) |
Housing Structures by Number of Rooms in Andersonville
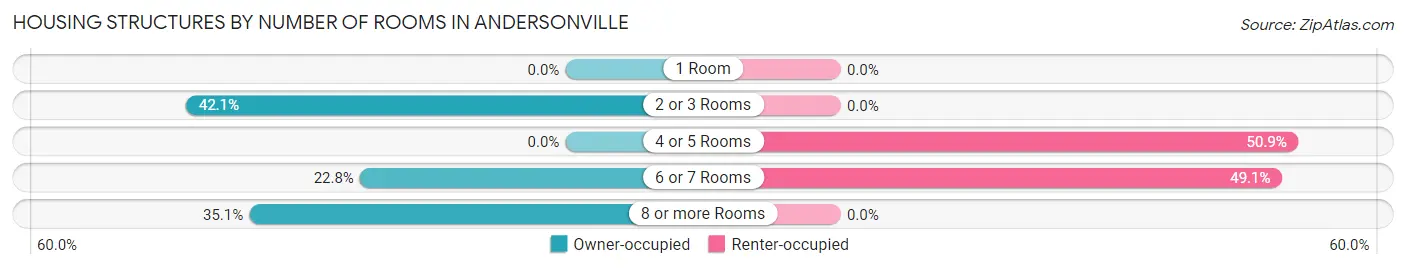
| Number of Rooms | Owner-occupied | Renter-occupied |
| 1 Room | 0 (0.0%) | 0 (0.0%) |
| 2 or 3 Rooms | 24 (42.1%) | 0 (0.0%) |
| 4 or 5 Rooms | 0 (0.0%) | 28 (50.9%) |
| 6 or 7 Rooms | 13 (22.8%) | 27 (49.1%) |
| 8 or more Rooms | 20 (35.1%) | 0 (0.0%) |
| Total | 57 (100.0%) | 55 (100.0%) |
Housing Structure by Heating Type in Andersonville
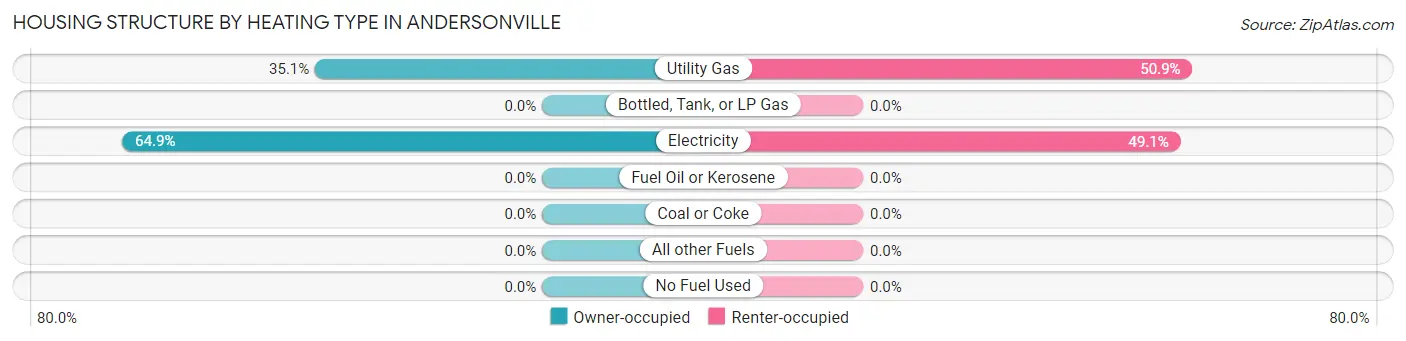
| Heating Type | Owner-occupied | Renter-occupied |
| Utility Gas | 20 (35.1%) | 28 (50.9%) |
| Bottled, Tank, or LP Gas | 0 (0.0%) | 0 (0.0%) |
| Electricity | 37 (64.9%) | 27 (49.1%) |
| Fuel Oil or Kerosene | 0 (0.0%) | 0 (0.0%) |
| Coal or Coke | 0 (0.0%) | 0 (0.0%) |
| All other Fuels | 0 (0.0%) | 0 (0.0%) |
| No Fuel Used | 0 (0.0%) | 0 (0.0%) |
| Total | 57 (100.0%) | 55 (100.0%) |
Household Vehicle Usage in Andersonville
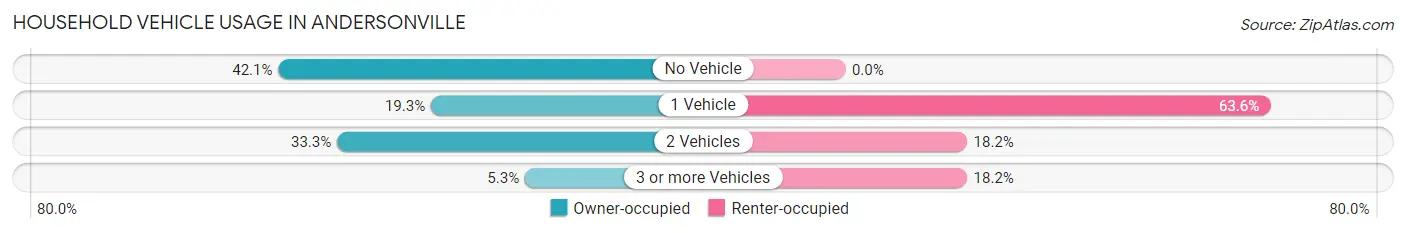
| Vehicles per Household | Owner-occupied | Renter-occupied |
| No Vehicle | 24 (42.1%) | 0 (0.0%) |
| 1 Vehicle | 11 (19.3%) | 35 (63.6%) |
| 2 Vehicles | 19 (33.3%) | 10 (18.2%) |
| 3 or more Vehicles | 3 (5.3%) | 10 (18.2%) |
| Total | 57 (100.0%) | 55 (100.0%) |
Real Estate & Mortgages in Andersonville
Real Estate and Mortgage Overview in Andersonville
| Characteristic | Without Mortgage | With Mortgage |
| Housing Units | 3 | 54 |
| Median Property Value | - | - |
| Median Household Income | - | - |
| Monthly Housing Costs | - | - |
| Real Estate Taxes | - | - |
Property Value by Mortgage Status in Andersonville
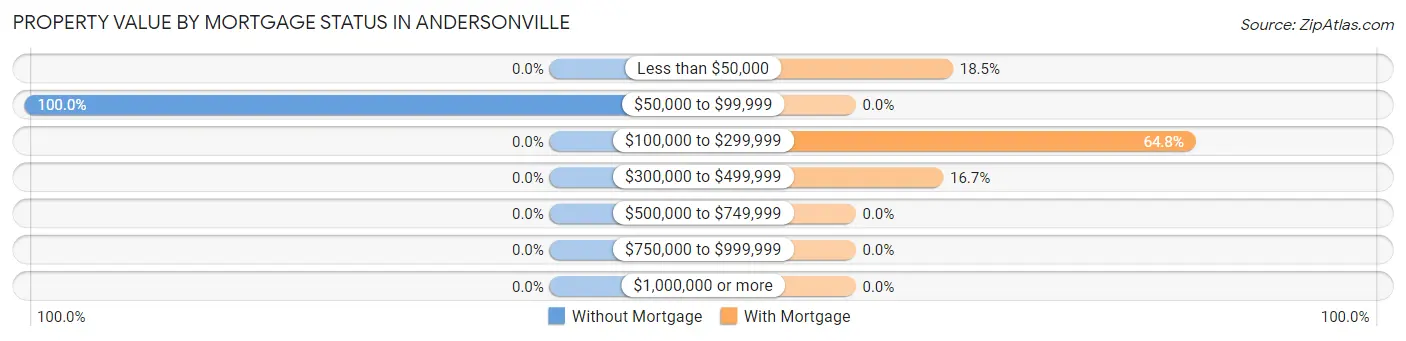
| Property Value | Without Mortgage | With Mortgage |
| Less than $50,000 | 0 (0.0%) | 10 (18.5%) |
| $50,000 to $99,999 | 3 (100.0%) | 0 (0.0%) |
| $100,000 to $299,999 | 0 (0.0%) | 35 (64.8%) |
| $300,000 to $499,999 | 0 (0.0%) | 9 (16.7%) |
| $500,000 to $749,999 | 0 (0.0%) | 0 (0.0%) |
| $750,000 to $999,999 | 0 (0.0%) | 0 (0.0%) |
| $1,000,000 or more | 0 (0.0%) | 0 (0.0%) |
| Total | 3 (100.0%) | 54 (100.0%) |
Household Income by Mortgage Status in Andersonville
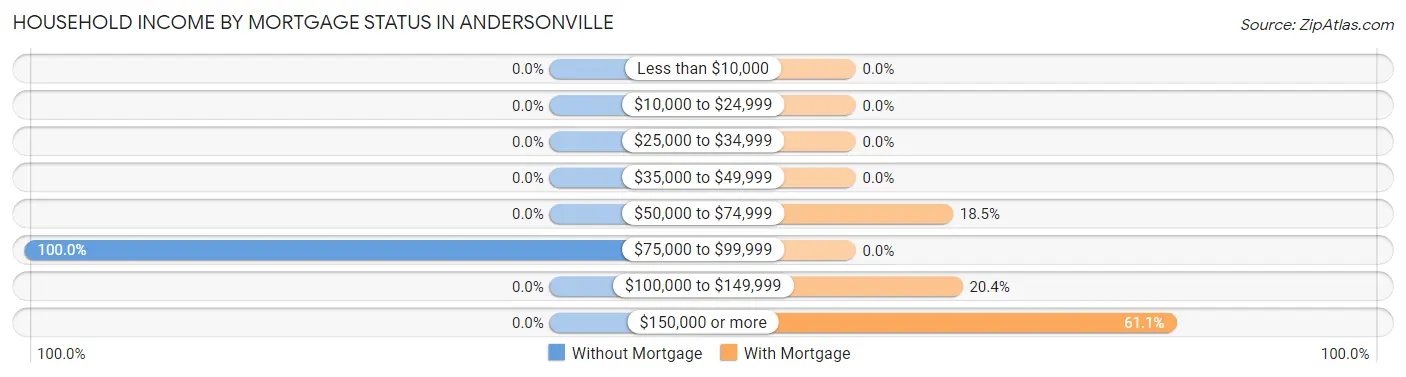
| Household Income | Without Mortgage | With Mortgage |
| Less than $10,000 | 0 (0.0%) | 0 (0.0%) |
| $10,000 to $24,999 | 0 (0.0%) | 0 (0.0%) |
| $25,000 to $34,999 | 0 (0.0%) | 0 (0.0%) |
| $35,000 to $49,999 | 0 (0.0%) | 0 (0.0%) |
| $50,000 to $74,999 | 0 (0.0%) | 10 (18.5%) |
| $75,000 to $99,999 | 3 (100.0%) | 0 (0.0%) |
| $100,000 to $149,999 | 0 (0.0%) | 11 (20.4%) |
| $150,000 or more | 0 (0.0%) | 33 (61.1%) |
| Total | 3 (100.0%) | 54 (100.0%) |
Property Value to Household Income Ratio in Andersonville
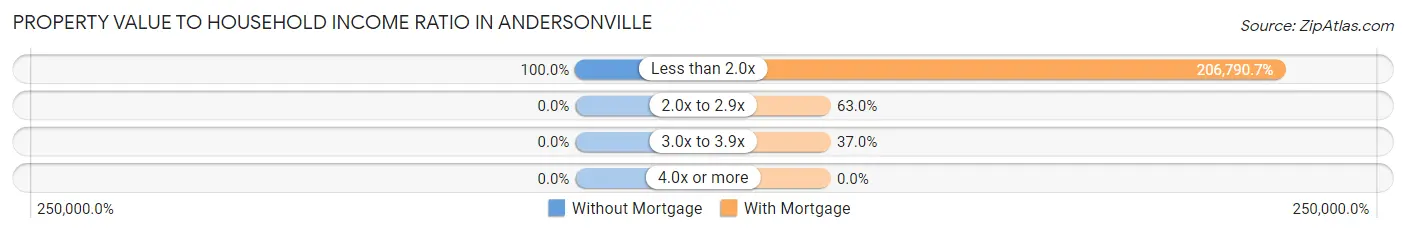
| Value-to-Income Ratio | Without Mortgage | With Mortgage |
| Less than 2.0x | 3 (100.0%) | 111,667 (206,790.7%) |
| 2.0x to 2.9x | 0 (0.0%) | 34 (63.0%) |
| 3.0x to 3.9x | 0 (0.0%) | 20 (37.0%) |
| 4.0x or more | 0 (0.0%) | 0 (0.0%) |
| Total | 3 (100.0%) | 54 (100.0%) |
Real Estate Taxes by Mortgage Status in Andersonville
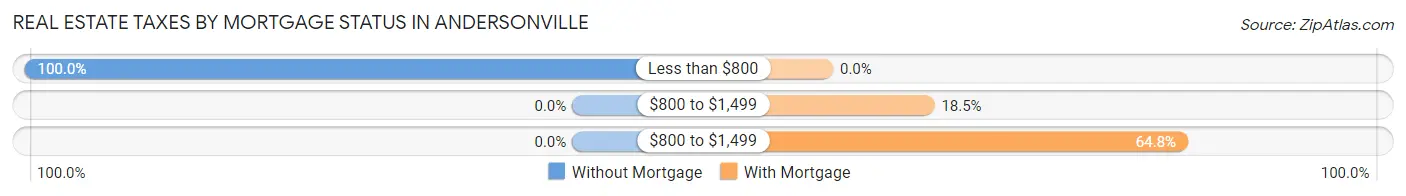
| Property Taxes | Without Mortgage | With Mortgage |
| Less than $800 | 3 (100.0%) | 0 (0.0%) |
| $800 to $1,499 | 0 (0.0%) | 10 (18.5%) |
| $800 to $1,499 | 0 (0.0%) | 35 (64.8%) |
| Total | 3 (100.0%) | 54 (100.0%) |
Health & Disability in Andersonville
Health Insurance Coverage by Age in Andersonville
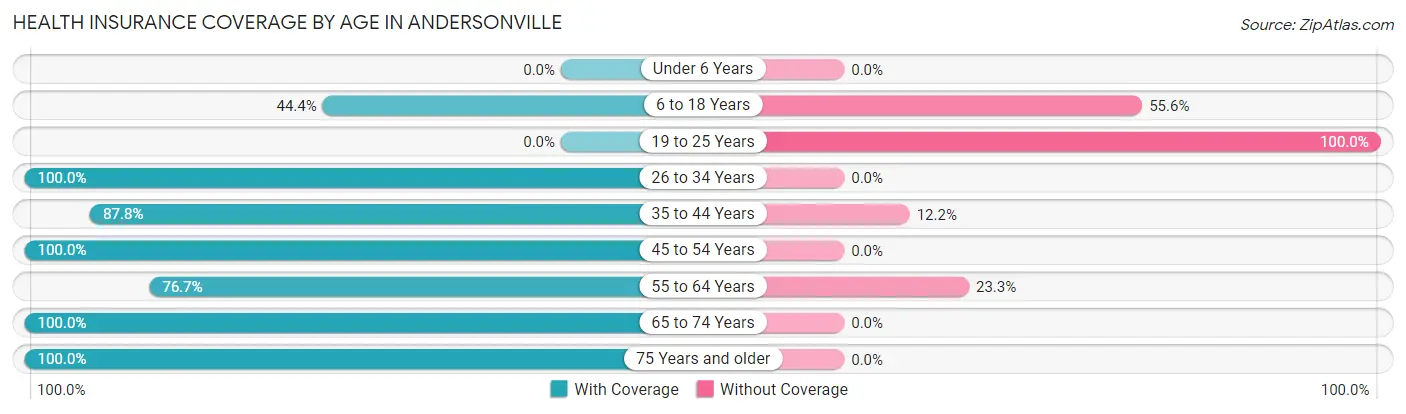
| Age Bracket | With Coverage | Without Coverage |
| Under 6 Years | 0 (0.0%) | 0 (0.0%) |
| 6 to 18 Years | 8 (44.4%) | 10 (55.6%) |
| 19 to 25 Years | 0 (0.0%) | 20 (100.0%) |
| 26 to 34 Years | 27 (100.0%) | 0 (0.0%) |
| 35 to 44 Years | 72 (87.8%) | 10 (12.2%) |
| 45 to 54 Years | 37 (100.0%) | 0 (0.0%) |
| 55 to 64 Years | 33 (76.7%) | 10 (23.3%) |
| 65 to 74 Years | 18 (100.0%) | 0 (0.0%) |
| 75 Years and older | 29 (100.0%) | 0 (0.0%) |
| Total | 224 (81.8%) | 50 (18.2%) |
Health Insurance Coverage by Citizenship Status in Andersonville
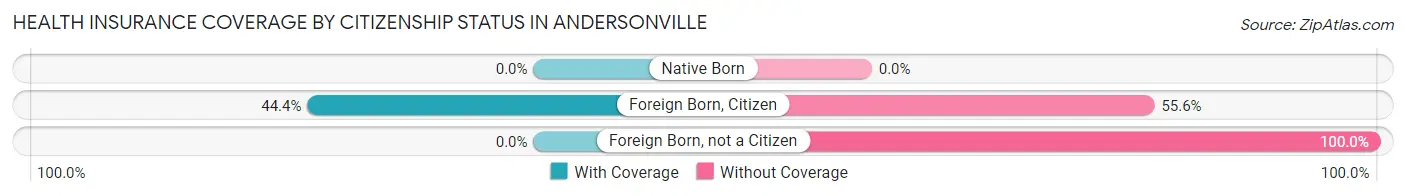
| Citizenship Status | With Coverage | Without Coverage |
| Native Born | 0 (0.0%) | 0 (0.0%) |
| Foreign Born, Citizen | 8 (44.4%) | 10 (55.6%) |
| Foreign Born, not a Citizen | 0 (0.0%) | 20 (100.0%) |
Health Insurance Coverage by Household Income in Andersonville
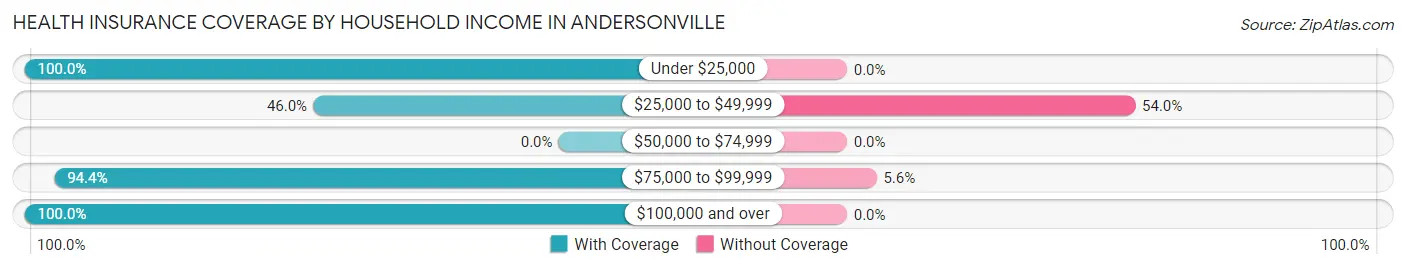
| Household Income | With Coverage | Without Coverage |
| Under $25,000 | 36 (100.0%) | 0 (0.0%) |
| $25,000 to $49,999 | 40 (46.0%) | 47 (54.0%) |
| $50,000 to $74,999 | 0 (0.0%) | 0 (0.0%) |
| $75,000 to $99,999 | 51 (94.4%) | 3 (5.6%) |
| $100,000 and over | 97 (100.0%) | 0 (0.0%) |
Public vs Private Health Insurance Coverage by Age in Andersonville
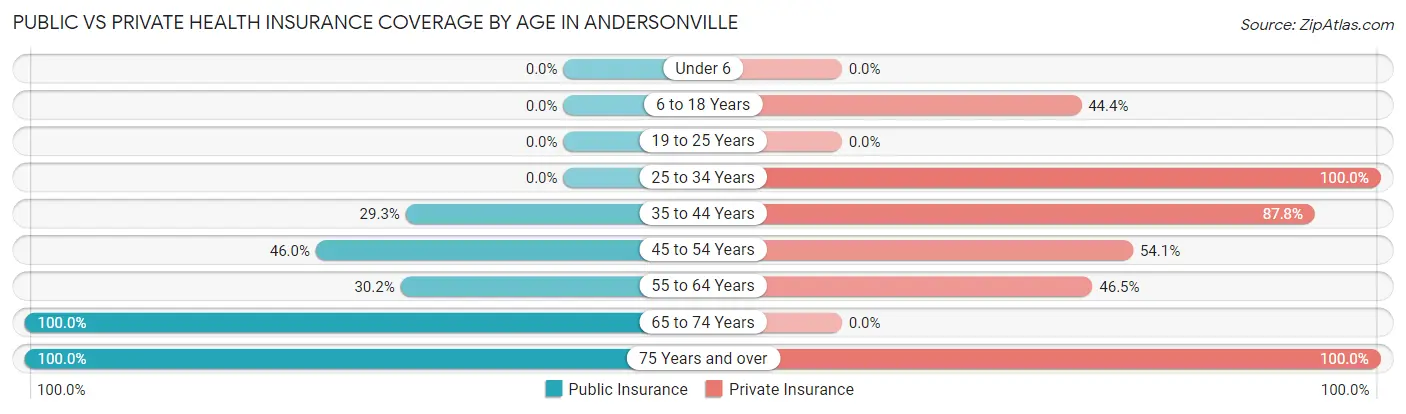
| Age Bracket | Public Insurance | Private Insurance |
| Under 6 | 0 (0.0%) | 0 (0.0%) |
| 6 to 18 Years | 0 (0.0%) | 8 (44.4%) |
| 19 to 25 Years | 0 (0.0%) | 0 (0.0%) |
| 25 to 34 Years | 0 (0.0%) | 27 (100.0%) |
| 35 to 44 Years | 24 (29.3%) | 72 (87.8%) |
| 45 to 54 Years | 17 (46.0%) | 20 (54.0%) |
| 55 to 64 Years | 13 (30.2%) | 20 (46.5%) |
| 65 to 74 Years | 18 (100.0%) | 0 (0.0%) |
| 75 Years and over | 29 (100.0%) | 29 (100.0%) |
| Total | 101 (36.9%) | 176 (64.2%) |
Disability Status by Sex by Age in Andersonville
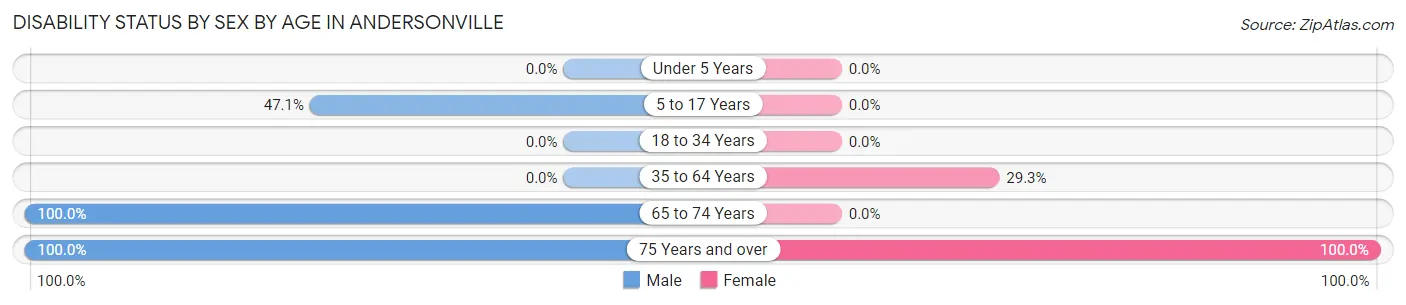
| Age Bracket | Male | Female |
| Under 5 Years | 0 (0.0%) | 0 (0.0%) |
| 5 to 17 Years | 8 (47.1%) | 0 (0.0%) |
| 18 to 34 Years | 0 (0.0%) | 0 (0.0%) |
| 35 to 64 Years | 0 (0.0%) | 31 (29.2%) |
| 65 to 74 Years | 18 (100.0%) | 0 (0.0%) |
| 75 Years and over | 18 (100.0%) | 11 (100.0%) |
Disability Class by Sex by Age in Andersonville
Disability Class: Hearing Difficulty
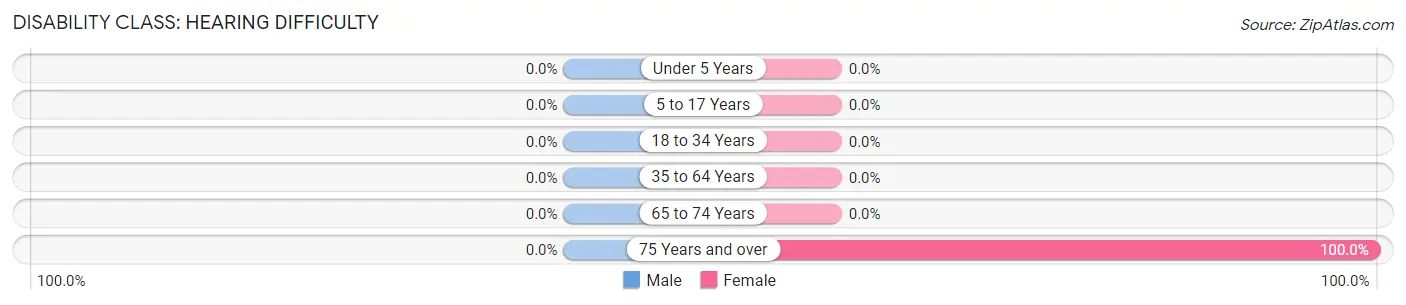
| Age Bracket | Male | Female |
| Under 5 Years | 0 (0.0%) | 0 (0.0%) |
| 5 to 17 Years | 0 (0.0%) | 0 (0.0%) |
| 18 to 34 Years | 0 (0.0%) | 0 (0.0%) |
| 35 to 64 Years | 0 (0.0%) | 0 (0.0%) |
| 65 to 74 Years | 0 (0.0%) | 0 (0.0%) |
| 75 Years and over | 0 (0.0%) | 11 (100.0%) |
Disability Class: Vision Difficulty
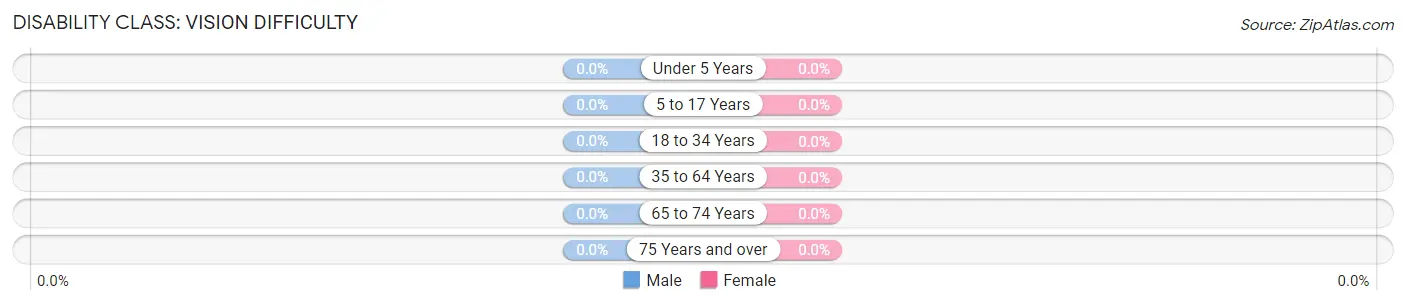
| Age Bracket | Male | Female |
| Under 5 Years | 0 (0.0%) | 0 (0.0%) |
| 5 to 17 Years | 0 (0.0%) | 0 (0.0%) |
| 18 to 34 Years | 0 (0.0%) | 0 (0.0%) |
| 35 to 64 Years | 0 (0.0%) | 0 (0.0%) |
| 65 to 74 Years | 0 (0.0%) | 0 (0.0%) |
| 75 Years and over | 0 (0.0%) | 0 (0.0%) |
Disability Class: Cognitive Difficulty
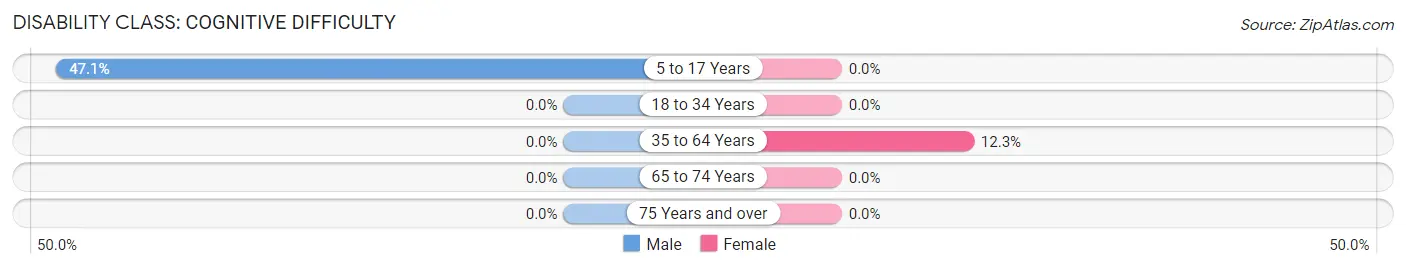
| Age Bracket | Male | Female |
| 5 to 17 Years | 8 (47.1%) | 0 (0.0%) |
| 18 to 34 Years | 0 (0.0%) | 0 (0.0%) |
| 35 to 64 Years | 0 (0.0%) | 13 (12.3%) |
| 65 to 74 Years | 0 (0.0%) | 0 (0.0%) |
| 75 Years and over | 0 (0.0%) | 0 (0.0%) |
Disability Class: Ambulatory Difficulty
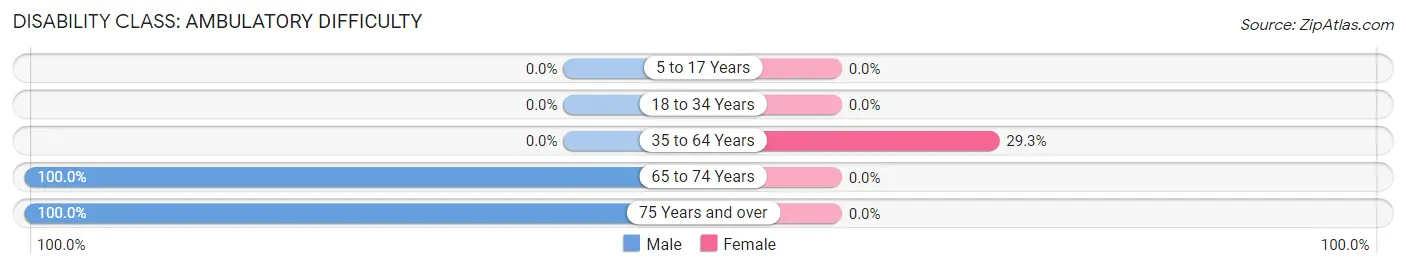
| Age Bracket | Male | Female |
| 5 to 17 Years | 0 (0.0%) | 0 (0.0%) |
| 18 to 34 Years | 0 (0.0%) | 0 (0.0%) |
| 35 to 64 Years | 0 (0.0%) | 31 (29.2%) |
| 65 to 74 Years | 18 (100.0%) | 0 (0.0%) |
| 75 Years and over | 18 (100.0%) | 0 (0.0%) |
Disability Class: Self-Care Difficulty
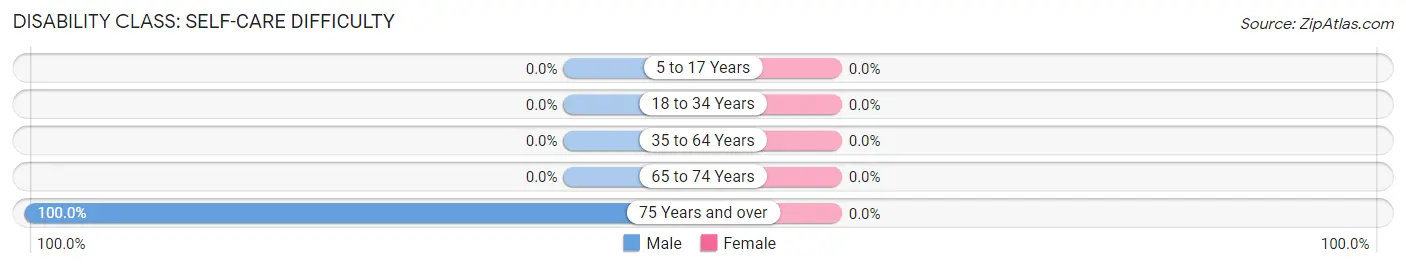
| Age Bracket | Male | Female |
| 5 to 17 Years | 0 (0.0%) | 0 (0.0%) |
| 18 to 34 Years | 0 (0.0%) | 0 (0.0%) |
| 35 to 64 Years | 0 (0.0%) | 0 (0.0%) |
| 65 to 74 Years | 0 (0.0%) | 0 (0.0%) |
| 75 Years and over | 18 (100.0%) | 0 (0.0%) |
Technology Access in Andersonville
Computing Device Access in Andersonville
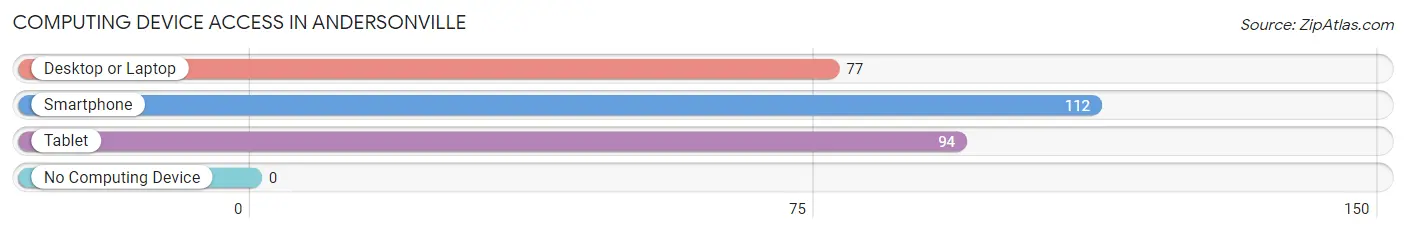
| Device Type | # Households | % Households |
| Desktop or Laptop | 77 | 68.8% |
| Smartphone | 112 | 100.0% |
| Tablet | 94 | 83.9% |
| No Computing Device | 0 | 0.0% |
| Total | 112 | 100.0% |
Internet Access in Andersonville
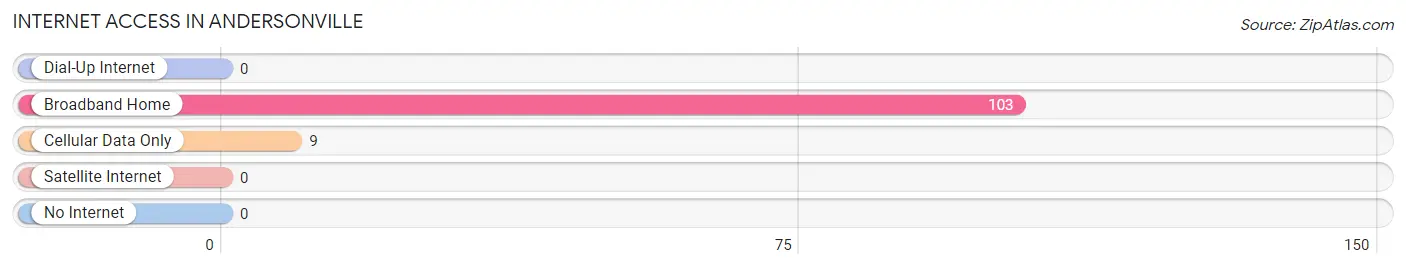
| Internet Type | # Households | % Households |
| Dial-Up Internet | 0 | 0.0% |
| Broadband Home | 103 | 92.0% |
| Cellular Data Only | 9 | 8.0% |
| Satellite Internet | 0 | 0.0% |
| No Internet | 0 | 0.0% |
| Total | 112 | 100.0% |
Andersonville Summary
Andersonville, Tennessee is a small town located in the eastern part of the state, in the foothills of the Great Smoky Mountains. It is situated in the Anderson County, and is part of the Knoxville Metropolitan Statistical Area. The town has a population of approximately 1,000 people, and is known for its rural charm and small-town atmosphere.
History
The area that is now Andersonville was first settled in the late 1700s by a group of settlers from North Carolina. The town was originally known as “New Hope”, and was later renamed “Andersonville” in honor of the first settler, William Anderson. The town was officially incorporated in 1875.
In the late 1800s, Andersonville was a thriving agricultural community, with a variety of crops being grown in the area. The town was also home to several small businesses, including a general store, a blacksmith shop, and a sawmill.
In the early 1900s, Andersonville began to experience a decline in population as many of the town’s residents moved away in search of better economic opportunities. The town’s population continued to decline until the 1950s, when the town began to experience a resurgence in population growth.
Geography
Andersonville is located in the eastern part of Tennessee, in the foothills of the Great Smoky Mountains. The town is situated in Anderson County, and is part of the Knoxville Metropolitan Statistical Area. The town is located approximately 25 miles east of Knoxville, and is situated at an elevation of 1,000 feet.
The town is located in a valley, surrounded by hills and mountains. The town is situated along the Clinch River, which flows through the town and provides a source of recreation for the town’s residents.
Economy
The economy of Andersonville is largely based on agriculture and tourism. The town is home to several small farms, which produce a variety of crops, including corn, soybeans, and hay. The town is also home to several small businesses, including a general store, a blacksmith shop, and a sawmill.
The town is also a popular tourist destination, due to its rural charm and proximity to the Great Smoky Mountains. The town is home to several bed and breakfasts, as well as a variety of outdoor activities, such as fishing, hiking, and camping.
Demographics
As of the 2010 census, the population of Andersonville was 1,000 people. The town is predominantly white, with approximately 95% of the population being white. The town also has a small Hispanic population, with approximately 4% of the population being Hispanic. The median household income in Andersonville is $35,000, and the median age is 44 years old.
Common Questions
What is Per Capita Income in Andersonville?
Per Capita income in Andersonville is $34,018.
What is the Median Family Income in Andersonville?
Median Family Income in Andersonville is $111,250.
What is Income or Wage Gap in Andersonville?
Income or Wage Gap in Andersonville is 47.2%.
Women in Andersonville earn 52.8 cents for every dollar earned by a man.
What is Inequality or Gini Index in Andersonville?
Inequality or Gini Index in Andersonville is 0.32.
What is the Total Population of Andersonville?
Total Population of Andersonville is 274.
What is the Total Male Population of Andersonville?
Total Male Population of Andersonville is 112.
What is the Total Female Population of Andersonville?
Total Female Population of Andersonville is 162.
What is the Ratio of Males per 100 Females in Andersonville?
There are 69.14 Males per 100 Females in Andersonville.
What is the Ratio of Females per 100 Males in Andersonville?
There are 144.64 Females per 100 Males in Andersonville.
What is the Median Population Age in Andersonville?
Median Population Age in Andersonville is 44.4 Years.
What is the Average Family Size in Andersonville
Average Family Size in Andersonville is 2.9 People.
What is the Average Household Size in Andersonville
Average Household Size in Andersonville is 2.5 People.
How Large is the Labor Force in Andersonville?
There are 187 People in the Labor Forcein in Andersonville.
What is the Percentage of People in the Labor Force in Andersonville?
72.8% of People are in the Labor Force in Andersonville.