Pine Crest, TN Map & Demographics
Pine Crest Map
Pine Crest Overview
$33,601
PER CAPITA INCOME
$59,079
AVG FAMILY INCOME
$54,603
AVG HOUSEHOLD INCOME
4.3%
WAGE / INCOME GAP [ % ]
95.7¢/ $1
WAGE / INCOME GAP [ $ ]
0.37
INEQUALITY / GINI INDEX
2,082
TOTAL POPULATION
1,019
MALE POPULATION
1,063
FEMALE POPULATION
95.86
MALES / 100 FEMALES
104.32
FEMALES / 100 MALES
47.6
MEDIAN AGE
2.6
AVG FAMILY SIZE
2.0
AVG HOUSEHOLD SIZE
1,158
LABOR FORCE [ PEOPLE ]
59.7%
PERCENT IN LABOR FORCE
9.3%
UNEMPLOYMENT RATE
Income in Pine Crest
Income Overview in Pine Crest
Per Capita Income in Pine Crest is $33,601, while median incomes of families and households are $59,079 and $54,603 respectively.
| Characteristic | Number | Measure |
| Per Capita Income | 2,082 | $33,601 |
| Median Family Income | 572 | $59,079 |
| Mean Family Income | 572 | $82,739 |
| Median Household Income | 1,037 | $54,603 |
| Mean Household Income | 1,037 | $65,160 |
| Income Deficit | 572 | $0 |
| Wage / Income Gap (%) | 2,082 | 4.30% |
| Wage / Income Gap ($) | 2,082 | 95.70¢ per $1 |
| Gini / Inequality Index | 2,082 | 0.37 |
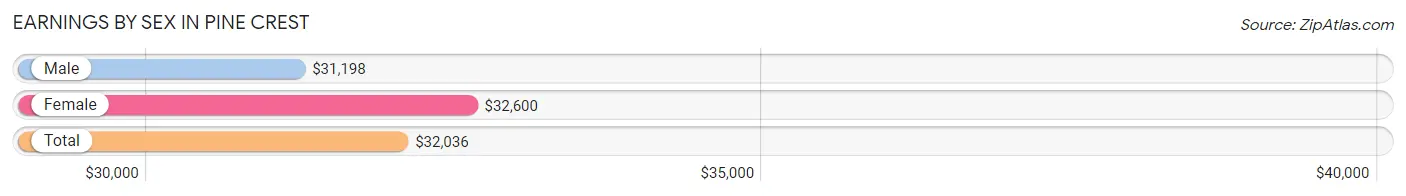
Earnings by Sex in Pine Crest
Average Earnings in Pine Crest are $32,036, $31,198 for men and $32,600 for women, a difference of 4.3%.
| Sex | Number | Average Earnings |
| Male | 601 (54.1%) | $31,198 |
| Female | 510 (45.9%) | $32,600 |
| Total | 1,111 (100.0%) | $32,036 |
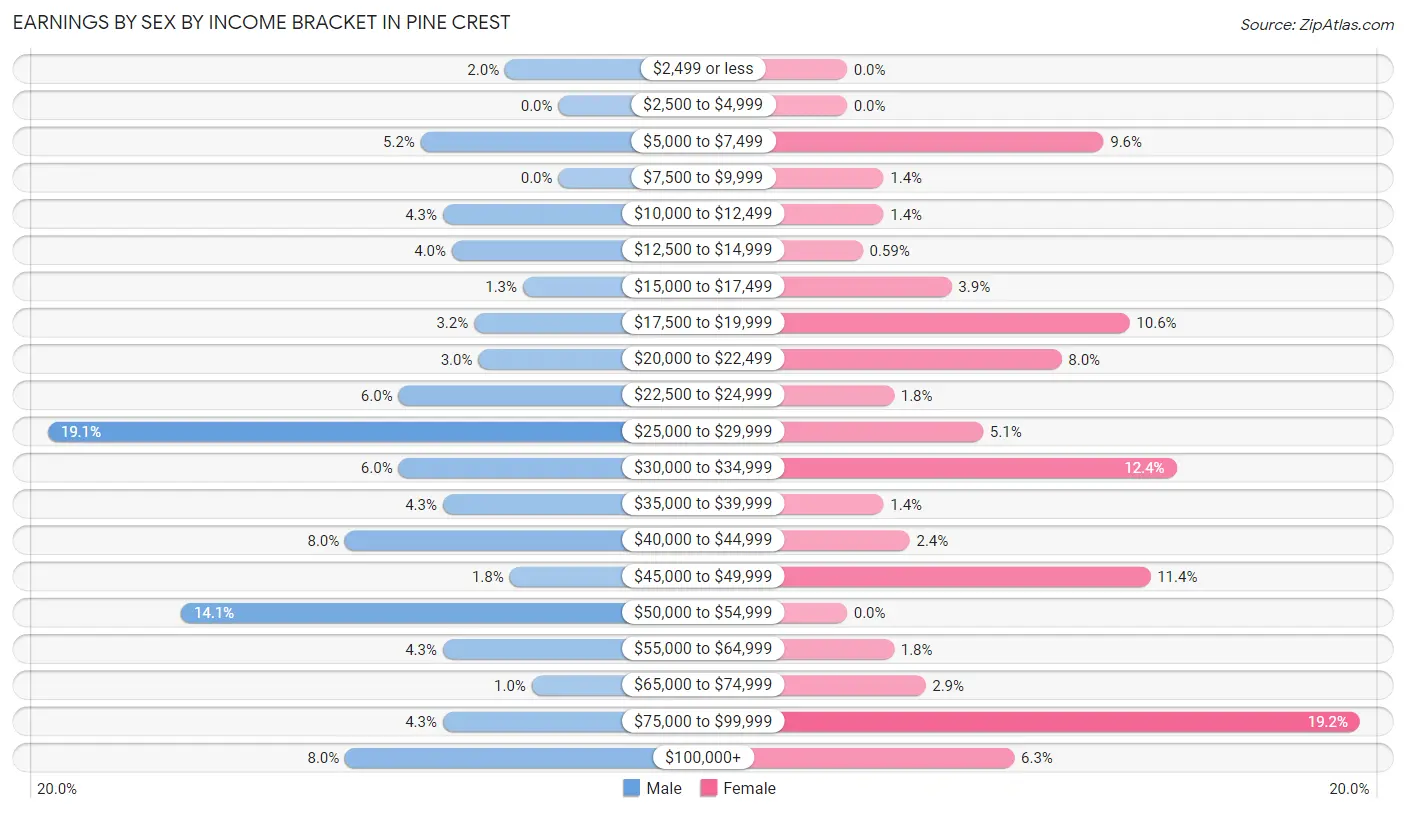
Earnings by Sex by Income Bracket in Pine Crest
The most common earnings brackets in Pine Crest are $25,000 to $29,999 for men (115 | 19.1%) and $75,000 to $99,999 for women (98 | 19.2%).
| Income | Male | Female |
| $2,499 or less | 12 (2.0%) | 0 (0.0%) |
| $2,500 to $4,999 | 0 (0.0%) | 0 (0.0%) |
| $5,000 to $7,499 | 31 (5.2%) | 49 (9.6%) |
| $7,500 to $9,999 | 0 (0.0%) | 7 (1.4%) |
| $10,000 to $12,499 | 26 (4.3%) | 7 (1.4%) |
| $12,500 to $14,999 | 24 (4.0%) | 3 (0.6%) |
| $15,000 to $17,499 | 8 (1.3%) | 20 (3.9%) |
| $17,500 to $19,999 | 19 (3.2%) | 54 (10.6%) |
| $20,000 to $22,499 | 18 (3.0%) | 41 (8.0%) |
| $22,500 to $24,999 | 36 (6.0%) | 9 (1.8%) |
| $25,000 to $29,999 | 115 (19.1%) | 26 (5.1%) |
| $30,000 to $34,999 | 36 (6.0%) | 63 (12.3%) |
| $35,000 to $39,999 | 26 (4.3%) | 7 (1.4%) |
| $40,000 to $44,999 | 48 (8.0%) | 12 (2.4%) |
| $45,000 to $49,999 | 11 (1.8%) | 58 (11.4%) |
| $50,000 to $54,999 | 85 (14.1%) | 0 (0.0%) |
| $55,000 to $64,999 | 26 (4.3%) | 9 (1.8%) |
| $65,000 to $74,999 | 6 (1.0%) | 15 (2.9%) |
| $75,000 to $99,999 | 26 (4.3%) | 98 (19.2%) |
| $100,000+ | 48 (8.0%) | 32 (6.3%) |
| Total | 601 (100.0%) | 510 (100.0%) |
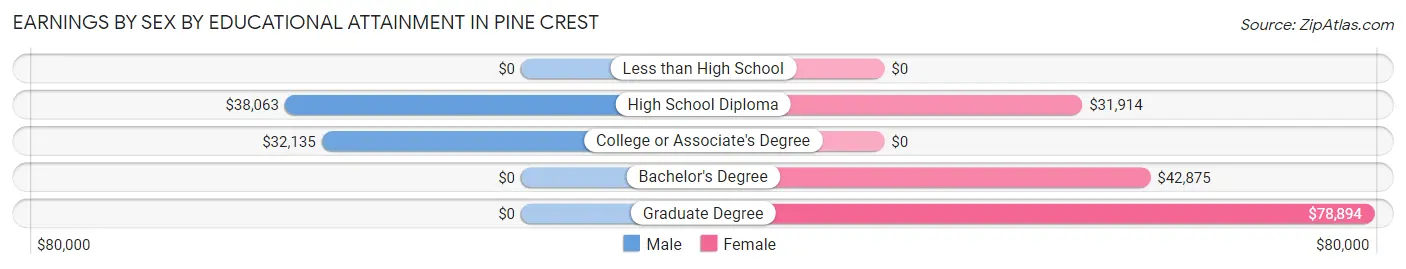
Earnings by Sex by Educational Attainment in Pine Crest
Average earnings in Pine Crest are $34,167 for men and $38,393 for women, a difference of 11.0%. Men with an educational attainment of high school diploma enjoy the highest average annual earnings of $38,063, while those with college or associate's degree education earn the least with $32,135. Women with an educational attainment of graduate degree earn the most with the average annual earnings of $78,894, while those with high school diploma education have the smallest earnings of $31,914.
| Educational Attainment | Male Income | Female Income |
| Less than High School | - | - |
| High School Diploma | $38,063 | $31,914 |
| College or Associate's Degree | $32,135 | $0 |
| Bachelor's Degree | - | - |
| Graduate Degree | - | - |
| Total | $34,167 | $38,393 |
Family Income in Pine Crest
Family Income Brackets in Pine Crest
According to the Pine Crest family income data, there are 181 families falling into the $50,000 to $74,999 income range, which is the most common income bracket and makes up 31.6% of all families.
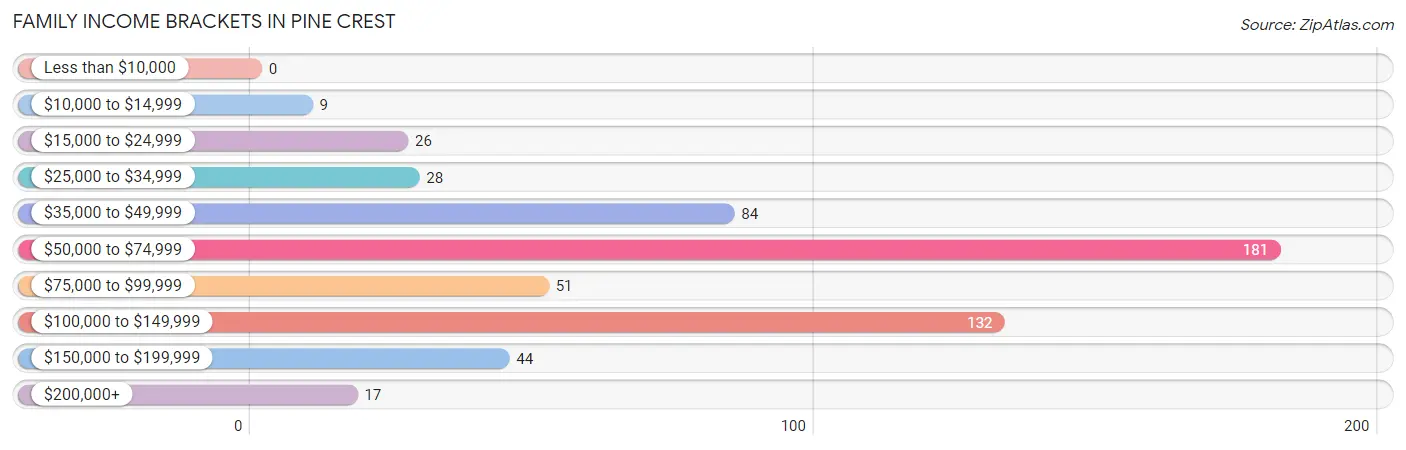
| Income Bracket | # Families | % Families |
| Less than $10,000 | 0 | 0.0% |
| $10,000 to $14,999 | 9 | 1.6% |
| $15,000 to $24,999 | 26 | 4.5% |
| $25,000 to $34,999 | 28 | 4.9% |
| $35,000 to $49,999 | 84 | 14.7% |
| $50,000 to $74,999 | 181 | 31.6% |
| $75,000 to $99,999 | 51 | 8.9% |
| $100,000 to $149,999 | 132 | 23.1% |
| $150,000 to $199,999 | 44 | 7.7% |
| $200,000+ | 17 | 3.0% |
Family Income by Famaliy Size in Pine Crest
2-person families (365 | 63.8%) account for the highest median family income in Pine Crest with $55,625 per family, while 2-person families (365 | 63.8%) have the highest median income of $27,812 per family member.
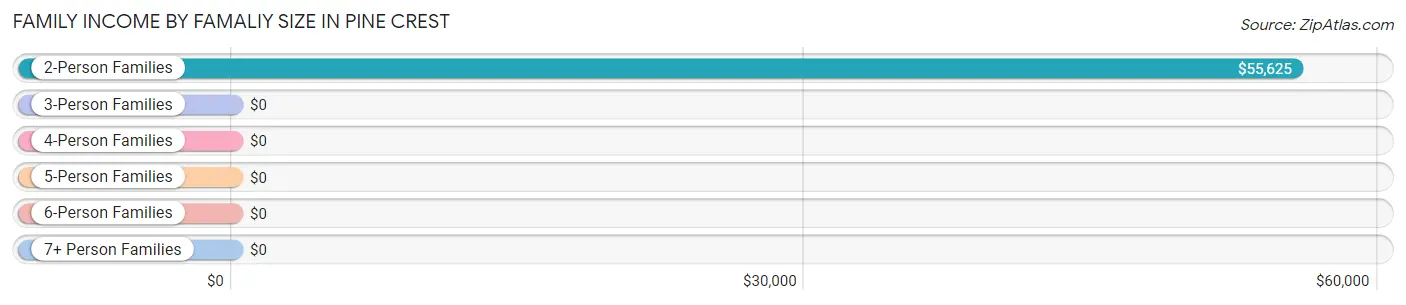
| Income Bracket | # Families | Median Income |
| 2-Person Families | 365 (63.8%) | $55,625 |
| 3-Person Families | 176 (30.8%) | $0 |
| 4-Person Families | 25 (4.4%) | $0 |
| 5-Person Families | 6 (1.1%) | $0 |
| 6-Person Families | 0 (0.0%) | $0 |
| 7+ Person Families | 0 (0.0%) | $0 |
| Total | 572 (100.0%) | $59,079 |
Family Income by Number of Earners in Pine Crest
The median family income in Pine Crest is $59,079, with families comprising 3+ earners (34) having the highest median family income of $184,464, while families with no earners (133) have the lowest median family income of $45,625, accounting for 5.9% and 23.3% of families, respectively.
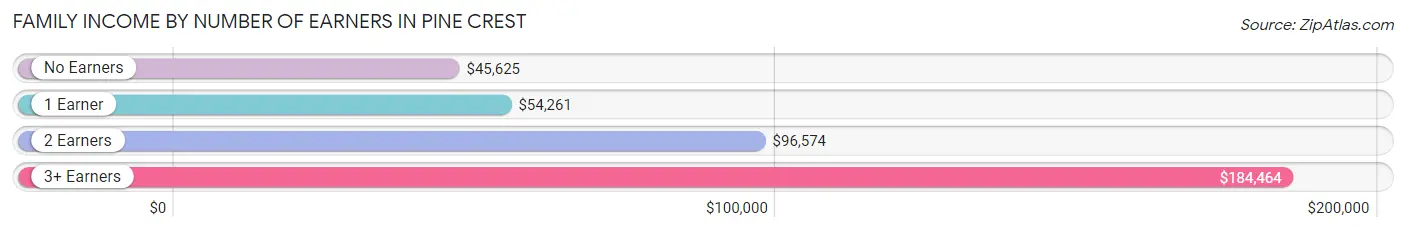
| Number of Earners | # Families | Median Income |
| No Earners | 133 (23.3%) | $45,625 |
| 1 Earner | 191 (33.4%) | $54,261 |
| 2 Earners | 214 (37.4%) | $96,574 |
| 3+ Earners | 34 (5.9%) | $184,464 |
| Total | 572 (100.0%) | $59,079 |
Household Income in Pine Crest
Household Income Brackets in Pine Crest
With 361 households falling in the category, the $50,000 to $74,999 income range is the most frequent in Pine Crest, accounting for 34.8% of all households. In contrast, only 17 households (1.6%) fall into the $200,000+ income bracket, making it the least populous group.
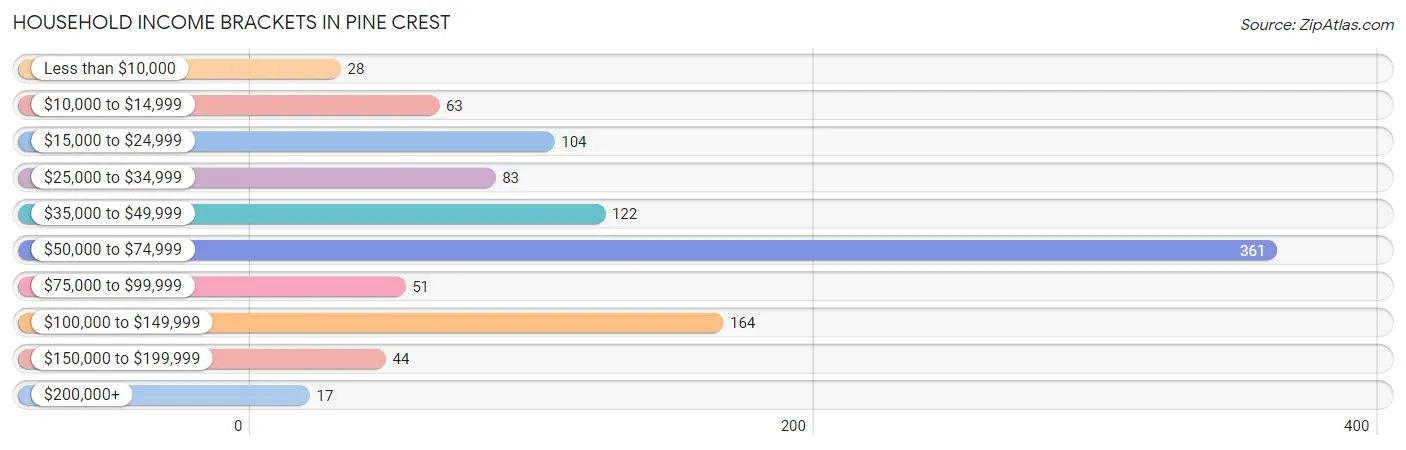
| Income Bracket | # Households | % Households |
| Less than $10,000 | 28 | 2.7% |
| $10,000 to $14,999 | 63 | 6.1% |
| $15,000 to $24,999 | 104 | 10.0% |
| $25,000 to $34,999 | 83 | 8.0% |
| $35,000 to $49,999 | 122 | 11.8% |
| $50,000 to $74,999 | 361 | 34.8% |
| $75,000 to $99,999 | 51 | 4.9% |
| $100,000 to $149,999 | 164 | 15.8% |
| $150,000 to $199,999 | 44 | 4.2% |
| $200,000+ | 17 | 1.6% |
Household Income by Householder Age in Pine Crest
The median household income in Pine Crest is $54,603, with the highest median household income of $58,079 found in the 45 to 64 years age bracket for the primary householder. A total of 265 households (25.6%) fall into this category. Meanwhile, the 15 to 24 years age bracket for the primary householder has the lowest median household income of $0, with 42 households (4.1%) in this group.
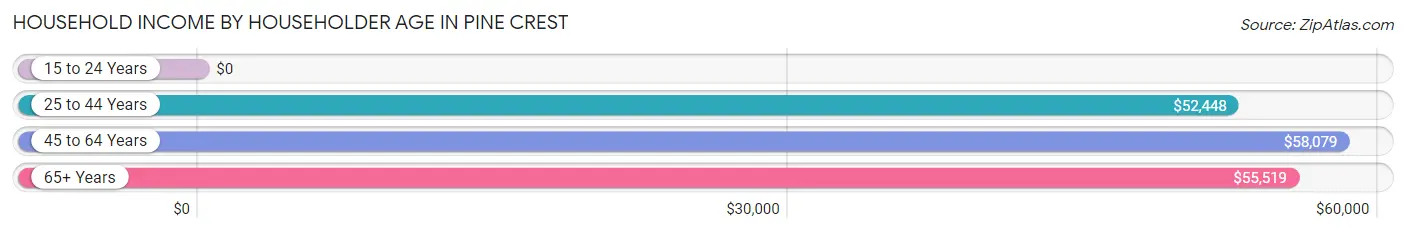
| Income Bracket | # Households | Median Income |
| 15 to 24 Years | 42 (4.1%) | $0 |
| 25 to 44 Years | 297 (28.6%) | $52,448 |
| 45 to 64 Years | 265 (25.6%) | $58,079 |
| 65+ Years | 433 (41.8%) | $55,519 |
| Total | 1,037 (100.0%) | $54,603 |
Poverty in Pine Crest
Income Below Poverty by Sex and Age in Pine Crest
With 9.2% poverty level for males and 7.1% for females among the residents of Pine Crest, 18 to 24 year old males and 18 to 24 year old females are the most vulnerable to poverty, with 48 males (44.9%) and 27 females (22.5%) in their respective age groups living below the poverty level.
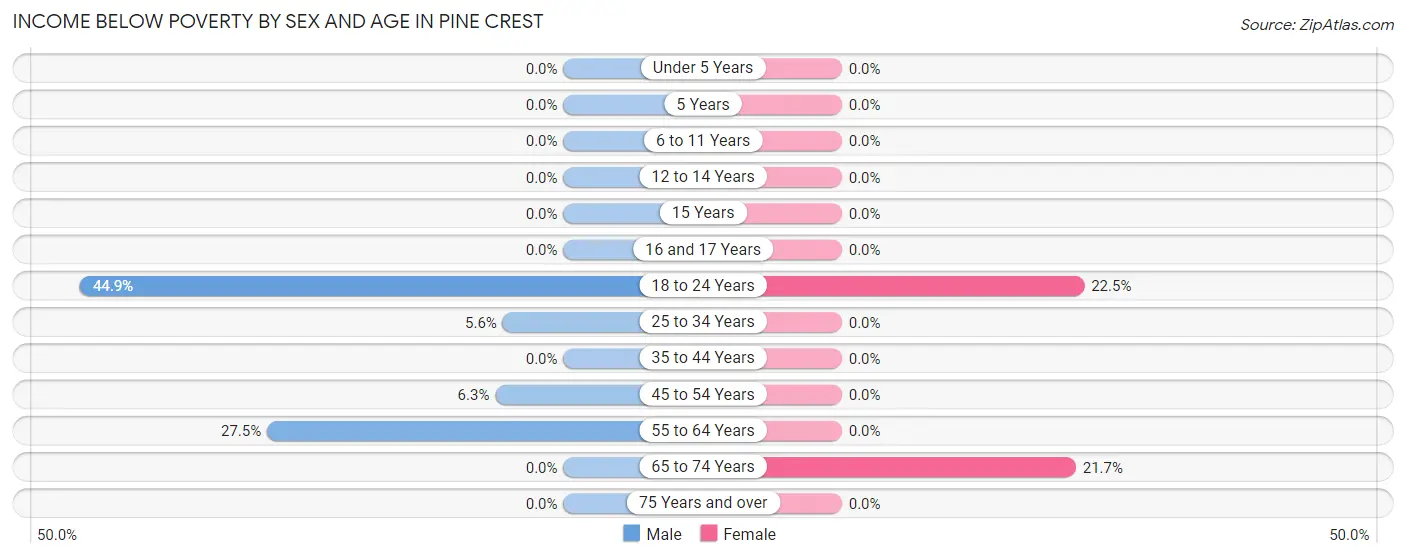
| Age Bracket | Male | Female |
| Under 5 Years | 0 (0.0%) | 0 (0.0%) |
| 5 Years | 0 (0.0%) | 0 (0.0%) |
| 6 to 11 Years | 0 (0.0%) | 0 (0.0%) |
| 12 to 14 Years | 0 (0.0%) | 0 (0.0%) |
| 15 Years | 0 (0.0%) | 0 (0.0%) |
| 16 and 17 Years | 0 (0.0%) | 0 (0.0%) |
| 18 to 24 Years | 48 (44.9%) | 27 (22.5%) |
| 25 to 34 Years | 13 (5.6%) | 0 (0.0%) |
| 35 to 44 Years | 0 (0.0%) | 0 (0.0%) |
| 45 to 54 Years | 11 (6.3%) | 0 (0.0%) |
| 55 to 64 Years | 22 (27.5%) | 0 (0.0%) |
| 65 to 74 Years | 0 (0.0%) | 48 (21.7%) |
| 75 Years and over | 0 (0.0%) | 0 (0.0%) |
| Total | 94 (9.2%) | 75 (7.1%) |
Income Above Poverty by Sex and Age in Pine Crest
According to the poverty statistics in Pine Crest, males aged under 5 years and females aged under 5 years are the age groups that are most secure financially, with 100.0% of males and 100.0% of females in these age groups living above the poverty line.
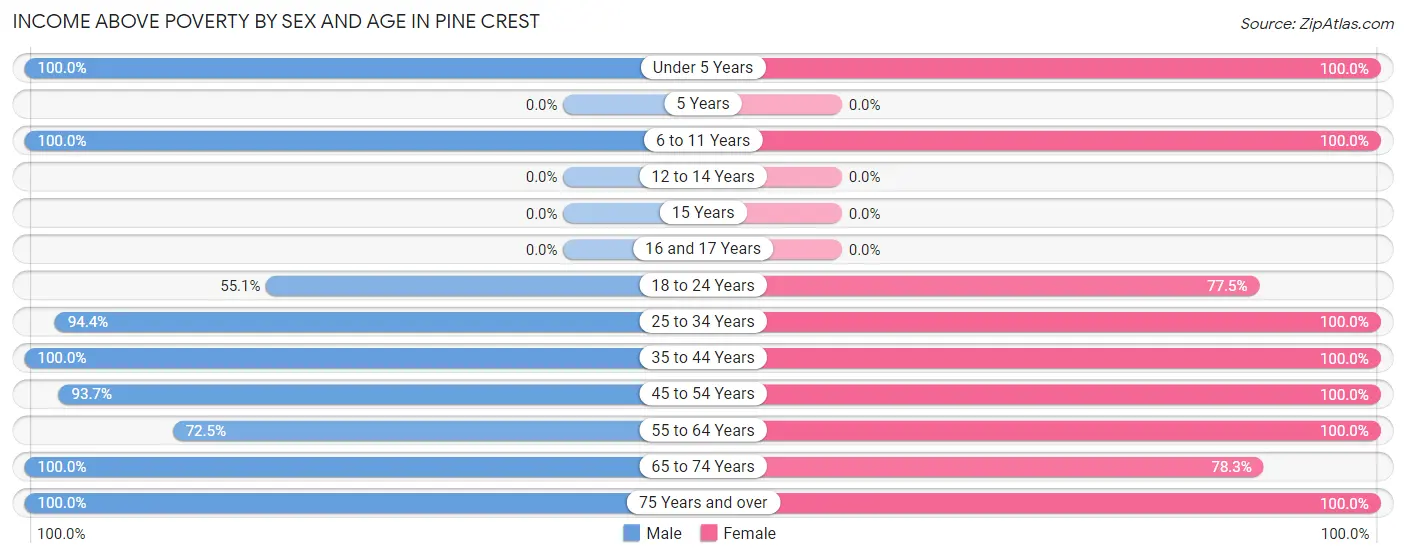
| Age Bracket | Male | Female |
| Under 5 Years | 29 (100.0%) | 44 (100.0%) |
| 5 Years | 0 (0.0%) | 0 (0.0%) |
| 6 to 11 Years | 13 (100.0%) | 56 (100.0%) |
| 12 to 14 Years | 0 (0.0%) | 0 (0.0%) |
| 15 Years | 0 (0.0%) | 0 (0.0%) |
| 16 and 17 Years | 0 (0.0%) | 0 (0.0%) |
| 18 to 24 Years | 59 (55.1%) | 93 (77.5%) |
| 25 to 34 Years | 218 (94.4%) | 209 (100.0%) |
| 35 to 44 Years | 45 (100.0%) | 102 (100.0%) |
| 45 to 54 Years | 163 (93.7%) | 152 (100.0%) |
| 55 to 64 Years | 58 (72.5%) | 121 (100.0%) |
| 65 to 74 Years | 167 (100.0%) | 173 (78.3%) |
| 75 Years and over | 173 (100.0%) | 38 (100.0%) |
| Total | 925 (90.8%) | 988 (92.9%) |
Income Below Poverty Among Married-Couple Families in Pine Crest
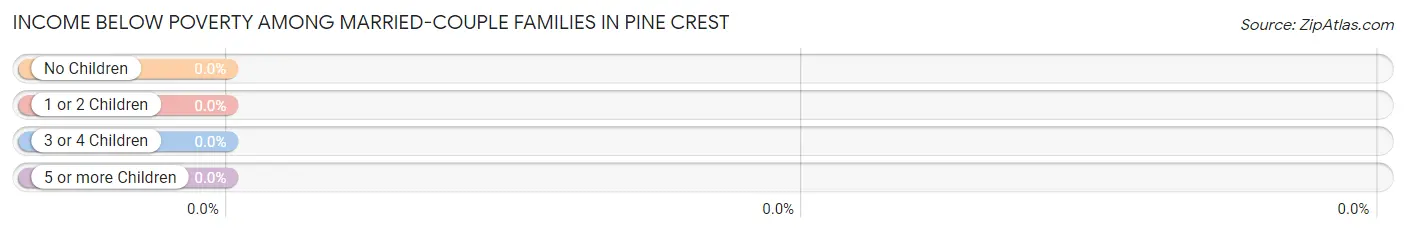
| Children | Above Poverty | Below Poverty |
| No Children | 349 (100.0%) | 0 (0.0%) |
| 1 or 2 Children | 122 (100.0%) | 0 (0.0%) |
| 3 or 4 Children | 0 (0.0%) | 0 (0.0%) |
| 5 or more Children | 0 (0.0%) | 0 (0.0%) |
| Total | 471 (100.0%) | 0 (0.0%) |
Income Below Poverty Among Single-Parent Households in Pine Crest
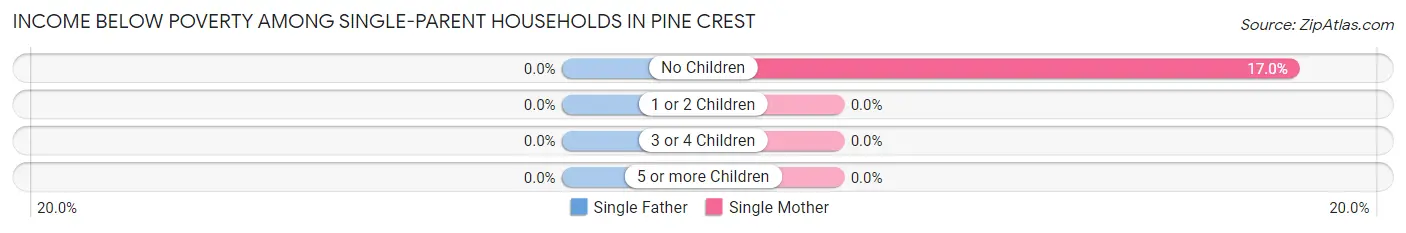
| Children | Single Father | Single Mother |
| No Children | 0 (0.0%) | 9 (17.0%) |
| 1 or 2 Children | 0 (0.0%) | 0 (0.0%) |
| 3 or 4 Children | 0 (0.0%) | 0 (0.0%) |
| 5 or more Children | 0 (0.0%) | 0 (0.0%) |
| Total | 0 (0.0%) | 9 (13.2%) |
Income Below Poverty Among Married-Couple vs Single-Parent Households in Pine Crest
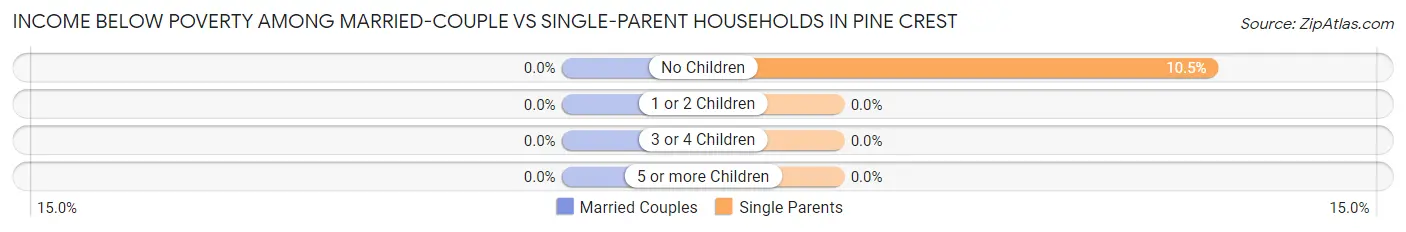
| Children | Married-Couple Families | Single-Parent Households |
| No Children | 0 (0.0%) | 9 (10.5%) |
| 1 or 2 Children | 0 (0.0%) | 0 (0.0%) |
| 3 or 4 Children | 0 (0.0%) | 0 (0.0%) |
| 5 or more Children | 0 (0.0%) | 0 (0.0%) |
| Total | 0 (0.0%) | 9 (8.9%) |
Race in Pine Crest
The most populous races in Pine Crest are White / Caucasian (2,052 | 98.6%), Black / African American (24 | 1.1%), and Hispanic or Latino (7 | 0.3%).
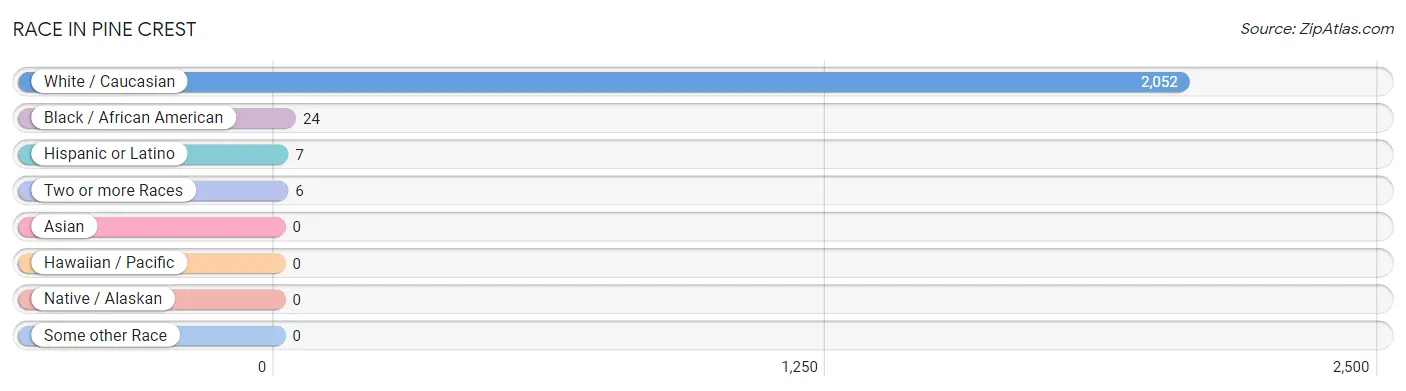
| Race | # Population | % Population |
| Asian | 0 | 0.0% |
| Black / African American | 24 | 1.1% |
| Hawaiian / Pacific | 0 | 0.0% |
| Hispanic or Latino | 7 | 0.3% |
| Native / Alaskan | 0 | 0.0% |
| White / Caucasian | 2,052 | 98.6% |
| Two or more Races | 6 | 0.3% |
| Some other Race | 0 | 0.0% |
| Total | 2,082 | 100.0% |
Ancestry in Pine Crest
The most populous ancestries reported in Pine Crest are American (446 | 21.4%), Irish (444 | 21.3%), German (348 | 16.7%), English (306 | 14.7%), and Scotch-Irish (128 | 6.1%), together accounting for 80.3% of all Pine Crest residents.
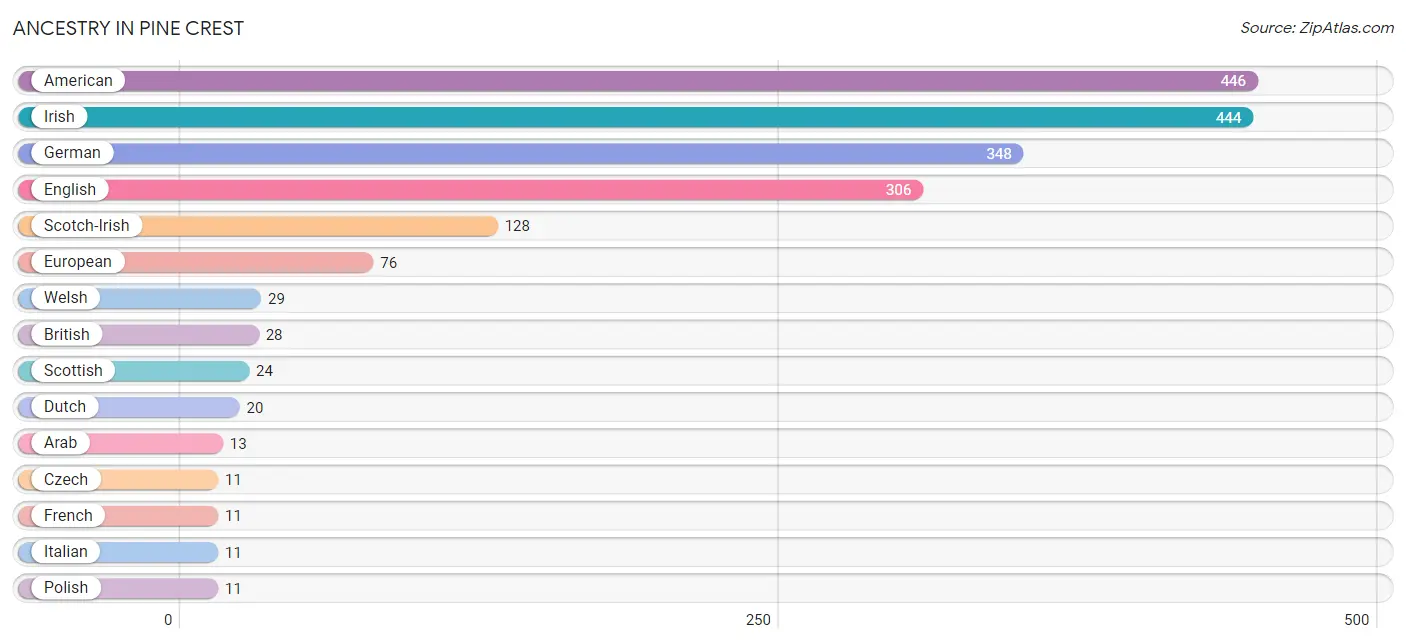
| Ancestry | # Population | % Population |
| American | 446 | 21.4% |
| Arab | 13 | 0.6% |
| British | 28 | 1.3% |
| Cherokee | 6 | 0.3% |
| Czech | 11 | 0.5% |
| Dutch | 20 | 1.0% |
| English | 306 | 14.7% |
| European | 76 | 3.6% |
| French | 11 | 0.5% |
| German | 348 | 16.7% |
| Irish | 444 | 21.3% |
| Italian | 11 | 0.5% |
| Mexican | 7 | 0.3% |
| Polish | 11 | 0.5% |
| Scotch-Irish | 128 | 6.1% |
| Scottish | 24 | 1.1% |
| Welsh | 29 | 1.4% | View All 17 Rows |
Immigrants in Pine Crest

| Immigration Origin | # Population | % Population | View All 0 Rows |
Sex and Age in Pine Crest
Sex and Age in Pine Crest
The most populous age groups in Pine Crest are 30 to 34 Years (182 | 17.9%) for men and 25 to 29 Years (141 | 13.3%) for women.
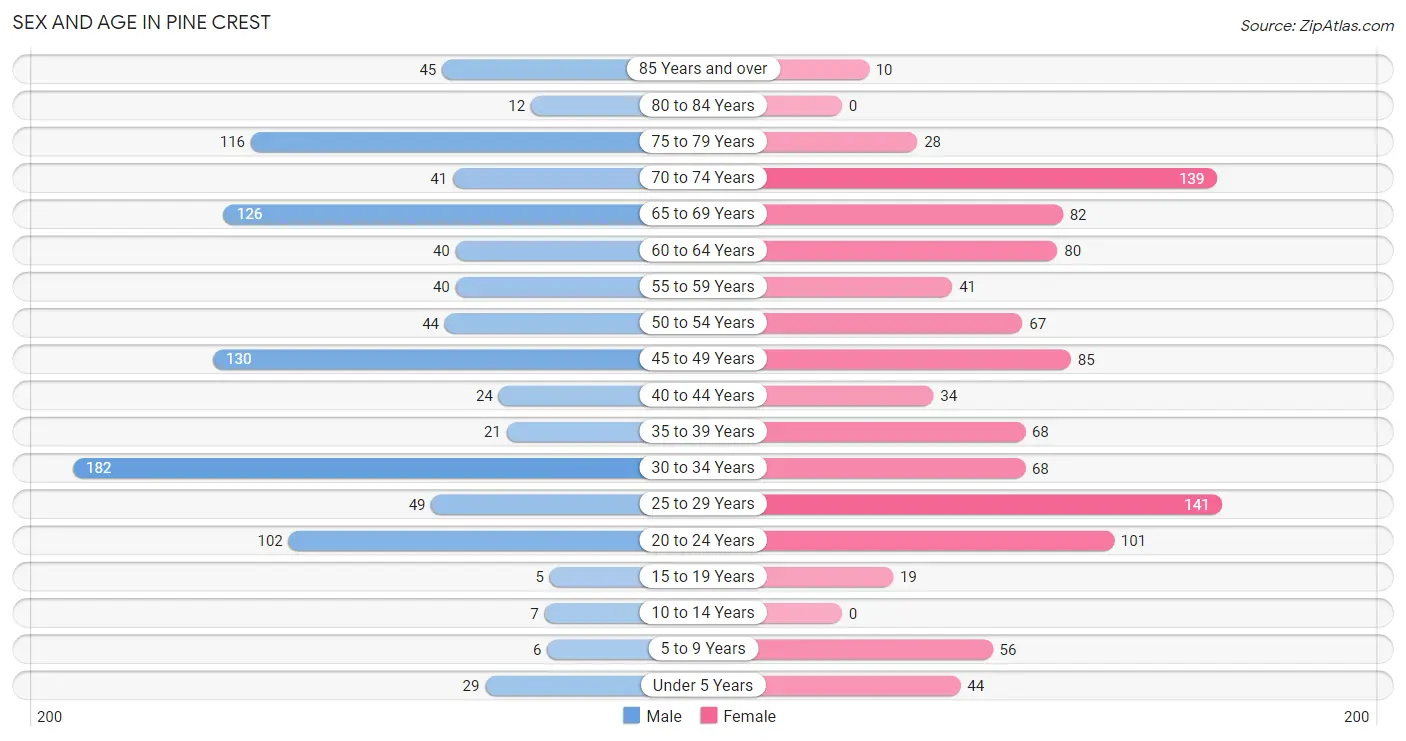
| Age Bracket | Male | Female |
| Under 5 Years | 29 (2.9%) | 44 (4.1%) |
| 5 to 9 Years | 6 (0.6%) | 56 (5.3%) |
| 10 to 14 Years | 7 (0.7%) | 0 (0.0%) |
| 15 to 19 Years | 5 (0.5%) | 19 (1.8%) |
| 20 to 24 Years | 102 (10.0%) | 101 (9.5%) |
| 25 to 29 Years | 49 (4.8%) | 141 (13.3%) |
| 30 to 34 Years | 182 (17.9%) | 68 (6.4%) |
| 35 to 39 Years | 21 (2.1%) | 68 (6.4%) |
| 40 to 44 Years | 24 (2.4%) | 34 (3.2%) |
| 45 to 49 Years | 130 (12.8%) | 85 (8.0%) |
| 50 to 54 Years | 44 (4.3%) | 67 (6.3%) |
| 55 to 59 Years | 40 (3.9%) | 41 (3.9%) |
| 60 to 64 Years | 40 (3.9%) | 80 (7.5%) |
| 65 to 69 Years | 126 (12.4%) | 82 (7.7%) |
| 70 to 74 Years | 41 (4.0%) | 139 (13.1%) |
| 75 to 79 Years | 116 (11.4%) | 28 (2.6%) |
| 80 to 84 Years | 12 (1.2%) | 0 (0.0%) |
| 85 Years and over | 45 (4.4%) | 10 (0.9%) |
| Total | 1,019 (100.0%) | 1,063 (100.0%) |
Families and Households in Pine Crest
Median Family Size in Pine Crest
The median family size in Pine Crest is 2.56 persons per family, with married-couple families (471 | 82.3%) accounting for the largest median family size of 2.61 persons per family. On the other hand, single male/father families (33 | 5.8%) represent the smallest median family size with 2.06 persons per family.
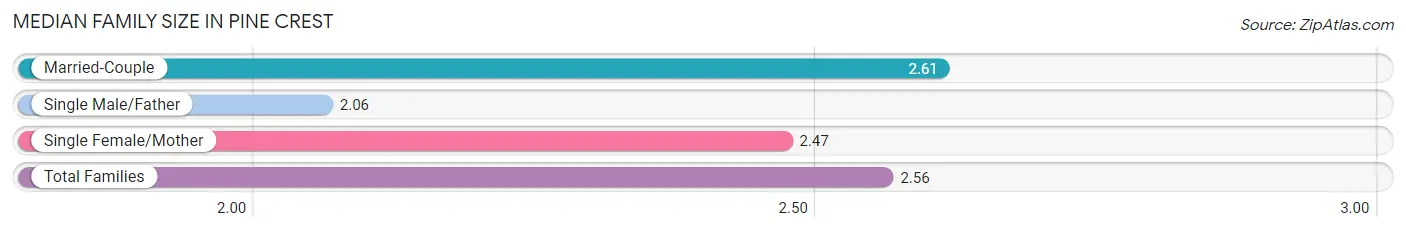
| Family Type | # Families | Family Size |
| Married-Couple | 471 (82.3%) | 2.61 |
| Single Male/Father | 33 (5.8%) | 2.06 |
| Single Female/Mother | 68 (11.9%) | 2.47 |
| Total Families | 572 (100.0%) | 2.56 |
Median Household Size in Pine Crest
The median household size in Pine Crest is 2.01 persons per household, with married-couple households (471 | 45.4%) accounting for the largest median household size of 2.61 persons per household. non-family households (465 | 44.8%) represent the smallest median household size with 1.33 persons per household.
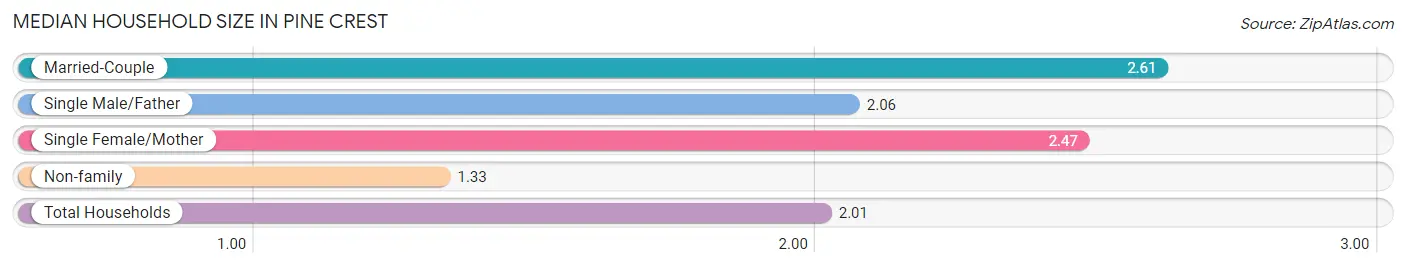
| Household Type | # Households | Household Size |
| Married-Couple | 471 (45.4%) | 2.61 |
| Single Male/Father | 33 (3.2%) | 2.06 |
| Single Female/Mother | 68 (6.6%) | 2.47 |
| Non-family | 465 (44.8%) | 1.33 |
| Total Households | 1,037 (100.0%) | 2.01 |
Household Size by Marriage Status in Pine Crest
Out of a total of 1,037 households in Pine Crest, 572 (55.2%) are family households, while 465 (44.8%) are nonfamily households. The most numerous type of family households are 2-person households, comprising 365, and the most common type of nonfamily households are 1-person households, comprising 376.
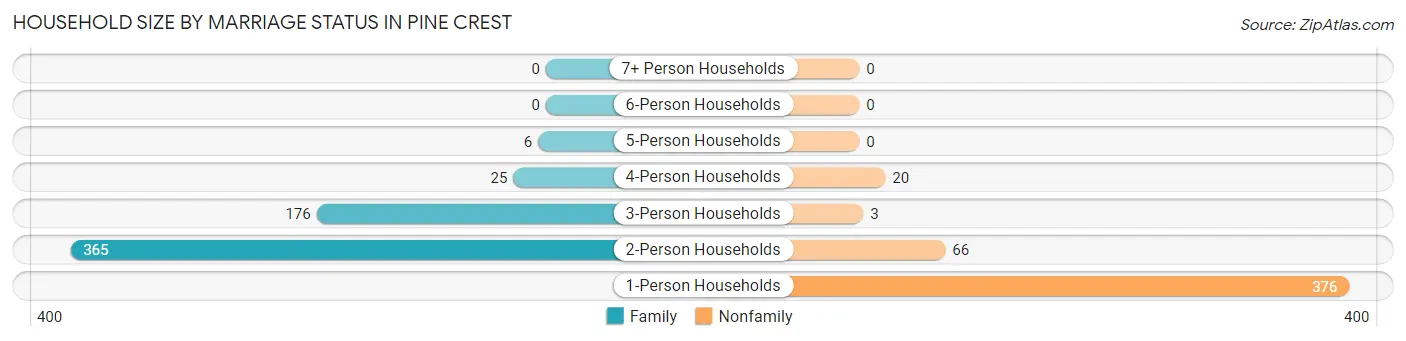
| Household Size | Family Households | Nonfamily Households |
| 1-Person Households | - | 376 (36.3%) |
| 2-Person Households | 365 (35.2%) | 66 (6.4%) |
| 3-Person Households | 176 (17.0%) | 3 (0.3%) |
| 4-Person Households | 25 (2.4%) | 20 (1.9%) |
| 5-Person Households | 6 (0.6%) | 0 (0.0%) |
| 6-Person Households | 0 (0.0%) | 0 (0.0%) |
| 7+ Person Households | 0 (0.0%) | 0 (0.0%) |
| Total | 572 (55.2%) | 465 (44.8%) |
Female Fertility in Pine Crest
Fertility by Age in Pine Crest
Average fertility rate in Pine Crest is 39.0 births per 1,000 women. Women in the age bracket of 20 to 34 years have the highest fertility rate with 71.0 births per 1,000 women. Women in the age bracket of 20 to 34 years acount for 100.0% of all women with births.
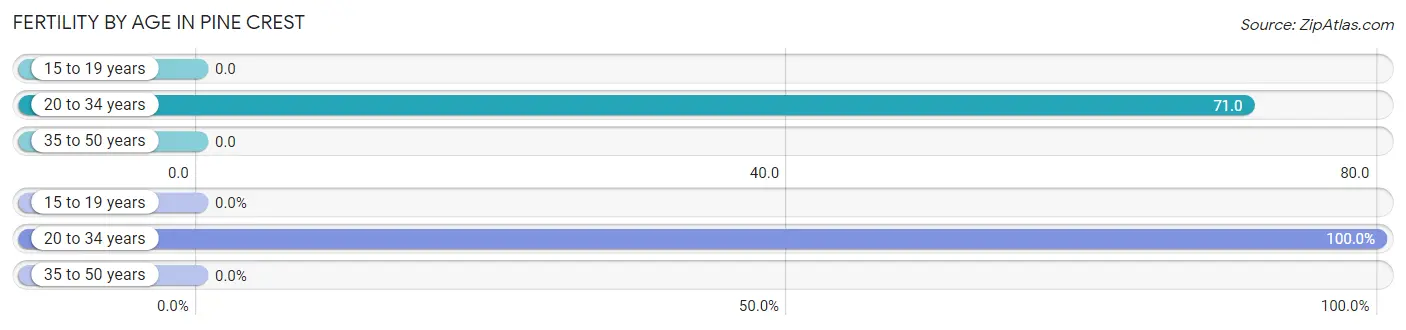
| Age Bracket | Women with Births | Births / 1,000 Women |
| 15 to 19 years | 0 (0.0%) | 0.0 |
| 20 to 34 years | 22 (100.0%) | 71.0 |
| 35 to 50 years | 0 (0.0%) | 0.0 |
| Total | 22 (100.0%) | 39.0 |
Fertility by Age by Marriage Status in Pine Crest
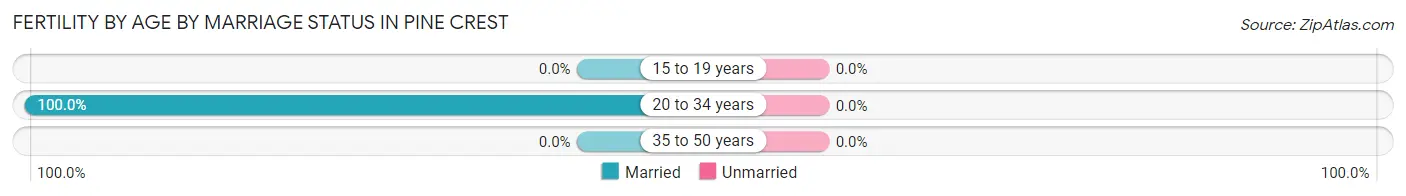
| Age Bracket | Married | Unmarried |
| 15 to 19 years | 0 (0.0%) | 0 (0.0%) |
| 20 to 34 years | 22 (100.0%) | 0 (0.0%) |
| 35 to 50 years | 0 (0.0%) | 0 (0.0%) |
| Total | 22 (100.0%) | 0 (0.0%) |
Fertility by Education in Pine Crest
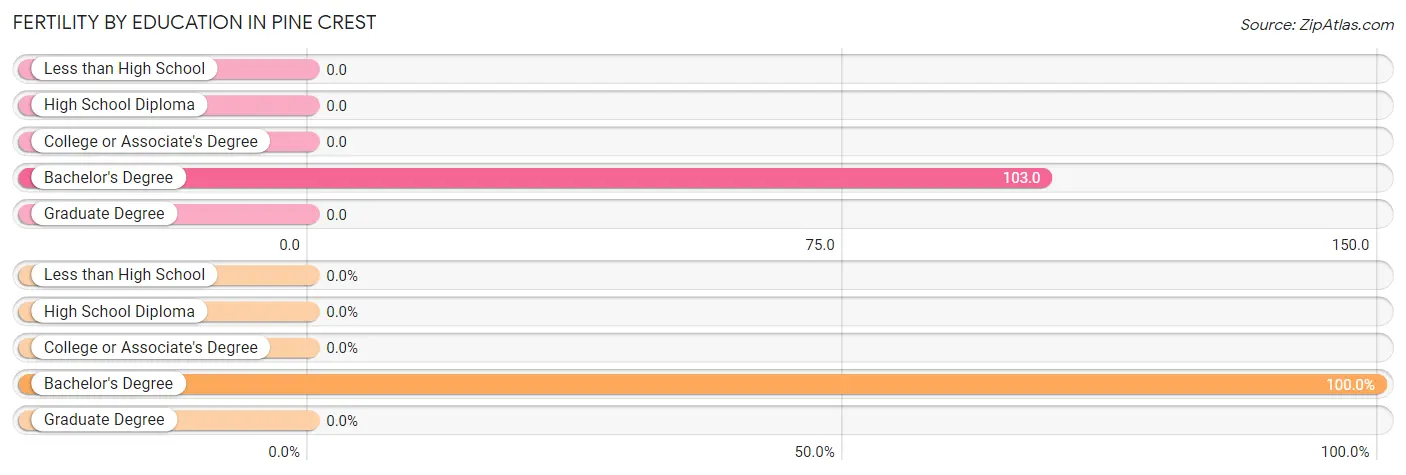
| Educational Attainment | Women with Births | Births / 1,000 Women |
| Less than High School | 0 (0.0%) | 0.0 |
| High School Diploma | 0 (0.0%) | 0.0 |
| College or Associate's Degree | 0 (0.0%) | 0.0 |
| Bachelor's Degree | 22 (100.0%) | 103.0 |
| Graduate Degree | 0 (0.0%) | 0.0 |
| Total | 22 (100.0%) | 39.0 |
Fertility by Education by Marriage Status in Pine Crest
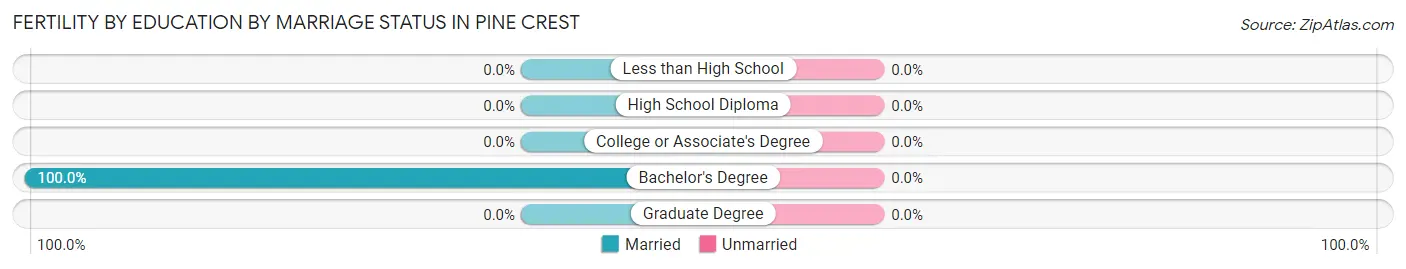
| Educational Attainment | Married | Unmarried |
| Less than High School | 0 (0.0%) | 0 (0.0%) |
| High School Diploma | 0 (0.0%) | 0 (0.0%) |
| College or Associate's Degree | 0 (0.0%) | 0 (0.0%) |
| Bachelor's Degree | 22 (100.0%) | 0 (0.0%) |
| Graduate Degree | 0 (0.0%) | 0 (0.0%) |
| Total | 22 (100.0%) | 0 (0.0%) |
Employment Characteristics in Pine Crest
Employment by Class of Employer in Pine Crest
Among the 1,044 employed individuals in Pine Crest, private company employees (709 | 67.9%), self-employed (not incorporated) (107 | 10.2%), and not-for-profit organizations (89 | 8.5%) make up the most common classes of employment.
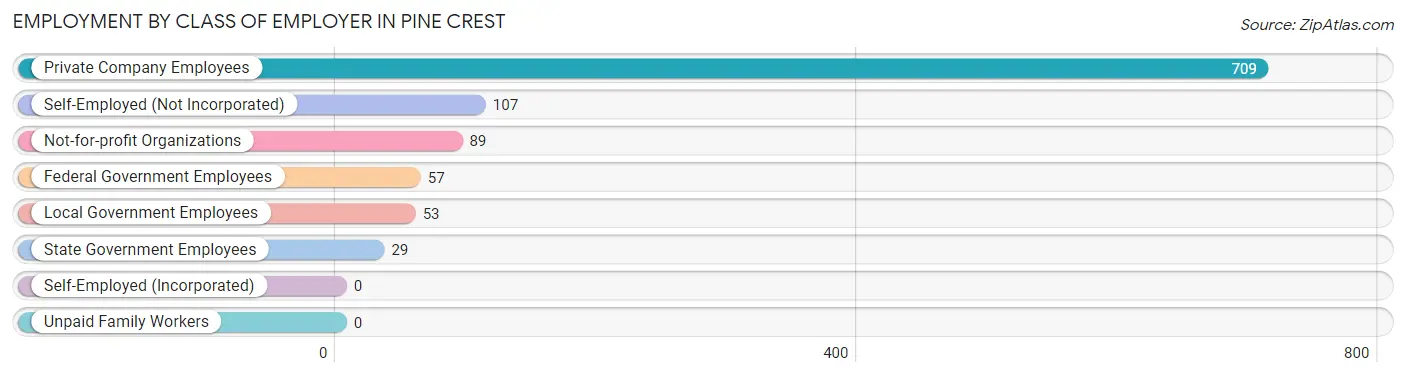
| Employer Class | # Employees | % Employees |
| Private Company Employees | 709 | 67.9% |
| Self-Employed (Incorporated) | 0 | 0.0% |
| Self-Employed (Not Incorporated) | 107 | 10.2% |
| Not-for-profit Organizations | 89 | 8.5% |
| Local Government Employees | 53 | 5.1% |
| State Government Employees | 29 | 2.8% |
| Federal Government Employees | 57 | 5.5% |
| Unpaid Family Workers | 0 | 0.0% |
| Total | 1,044 | 100.0% |
Employment Status by Age in Pine Crest
According to the labor force statistics for Pine Crest, out of the total population over 16 years of age (1,940), 59.7% or 1,158 individuals are in the labor force, with 9.3% or 108 of them unemployed. The age group with the highest labor force participation rate is 35 to 44 years, with 100.0% or 147 individuals in the labor force. Within the labor force, the 65 to 74 years age range has the highest percentage of unemployed individuals, with 46.8% or 65 of them being unemployed.
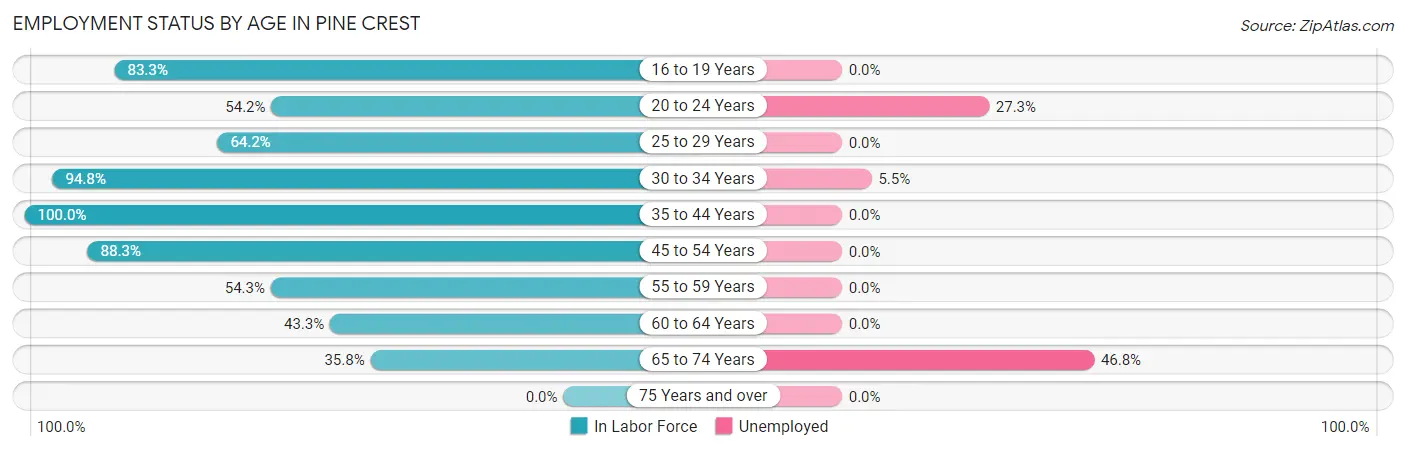
| Age Bracket | In Labor Force | Unemployed |
| 16 to 19 Years | 20 (83.3%) | 0 (0.0%) |
| 20 to 24 Years | 110 (54.2%) | 30 (27.3%) |
| 25 to 29 Years | 122 (64.2%) | 0 (0.0%) |
| 30 to 34 Years | 237 (94.8%) | 13 (5.5%) |
| 35 to 44 Years | 147 (100.0%) | 0 (0.0%) |
| 45 to 54 Years | 288 (88.3%) | 0 (0.0%) |
| 55 to 59 Years | 44 (54.3%) | 0 (0.0%) |
| 60 to 64 Years | 52 (43.3%) | 0 (0.0%) |
| 65 to 74 Years | 139 (35.8%) | 65 (46.8%) |
| 75 Years and over | 0 (0.0%) | 0 (0.0%) |
| Total | 1,158 (59.7%) | 108 (9.3%) |
Employment Status by Educational Attainment in Pine Crest
According to labor force statistics for Pine Crest, 79.9% of individuals (890) out of the total population between 25 and 64 years of age (1,114) are in the labor force, with 1.5% or 13 of them being unemployed. The group with the highest labor force participation rate are those with the educational attainment of bachelor's degree or higher, with 93.3% or 392 individuals in the labor force. Within the labor force, individuals with bachelor's degree or higher education have the highest percentage of unemployment, with 3.3% or 13 of them being unemployed.
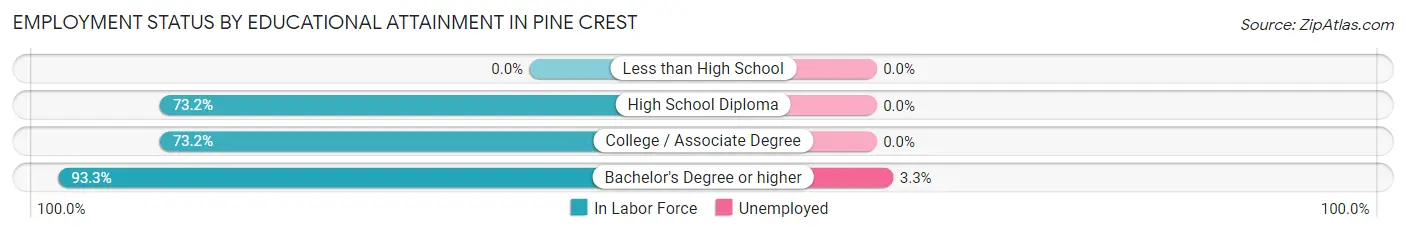
| Educational Attainment | In Labor Force | Unemployed |
| Less than High School | 0 (0.0%) | 0 (0.0%) |
| High School Diploma | 167 (73.2%) | 0 (0.0%) |
| College / Associate Degree | 331 (73.2%) | 0 (0.0%) |
| Bachelor's Degree or higher | 392 (93.3%) | 14 (3.3%) |
| Total | 890 (79.9%) | 17 (1.5%) |
Employment Occupations by Sex in Pine Crest
Management, Business, Science and Arts Occupations
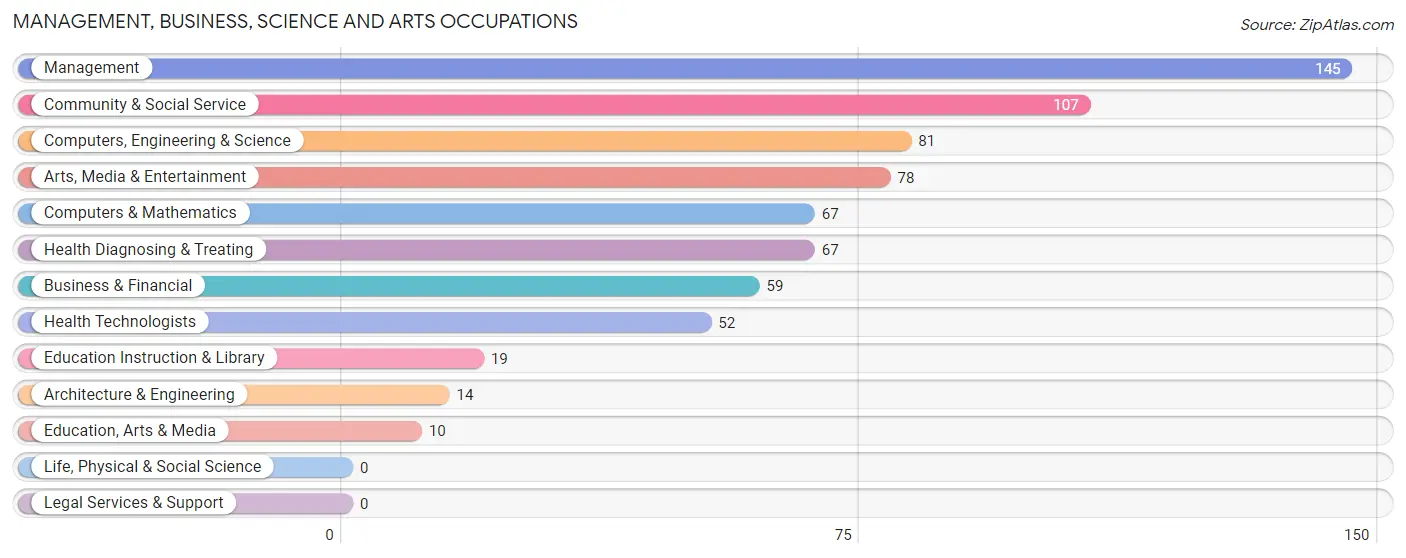
The most common Management, Business, Science and Arts occupations in Pine Crest are Management (145 | 13.8%), Community & Social Service (107 | 10.2%), Computers, Engineering & Science (81 | 7.7%), Arts, Media & Entertainment (78 | 7.4%), and Computers & Mathematics (67 | 6.4%).
Management, Business, Science and Arts Occupations by Sex
Within the Management, Business, Science and Arts occupations in Pine Crest, the most male-oriented occupations are Architecture & Engineering (100.0%), Business & Financial (74.6%), and Education Instruction & Library (63.2%), while the most female-oriented occupations are Education, Arts & Media (100.0%), Computers & Mathematics (77.6%), and Computers, Engineering & Science (64.2%).
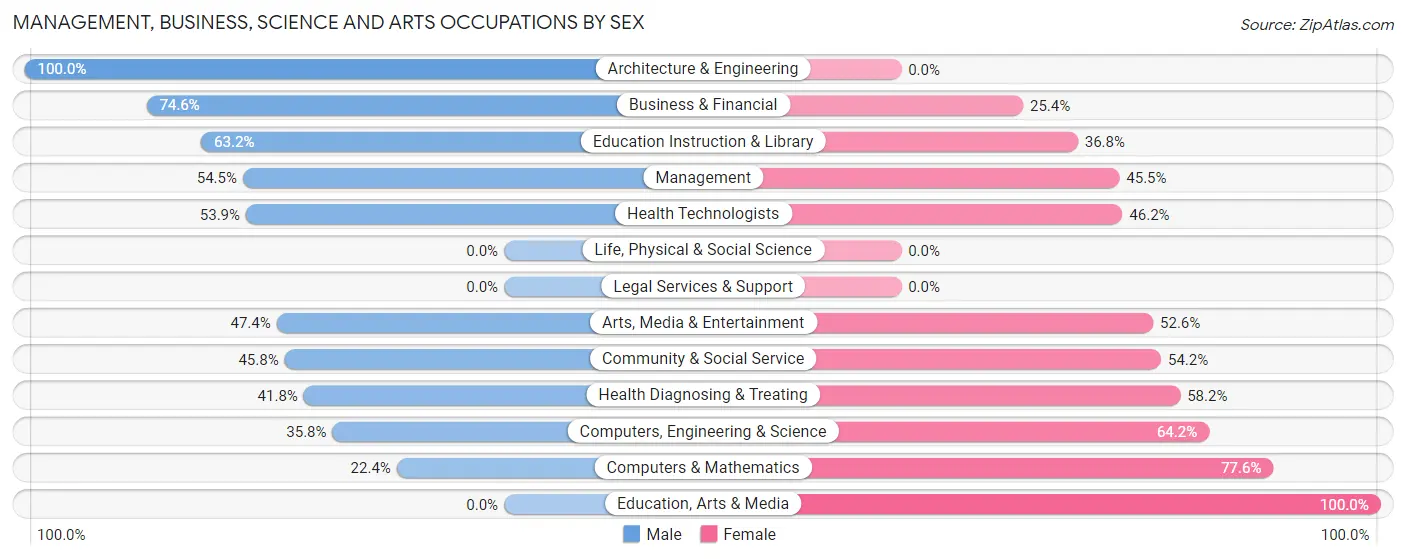
| Occupation | Male | Female |
| Management | 79 (54.5%) | 66 (45.5%) |
| Business & Financial | 44 (74.6%) | 15 (25.4%) |
| Computers, Engineering & Science | 29 (35.8%) | 52 (64.2%) |
| Computers & Mathematics | 15 (22.4%) | 52 (77.6%) |
| Architecture & Engineering | 14 (100.0%) | 0 (0.0%) |
| Life, Physical & Social Science | 0 (0.0%) | 0 (0.0%) |
| Community & Social Service | 49 (45.8%) | 58 (54.2%) |
| Education, Arts & Media | 0 (0.0%) | 10 (100.0%) |
| Legal Services & Support | 0 (0.0%) | 0 (0.0%) |
| Education Instruction & Library | 12 (63.2%) | 7 (36.8%) |
| Arts, Media & Entertainment | 37 (47.4%) | 41 (52.6%) |
| Health Diagnosing & Treating | 28 (41.8%) | 39 (58.2%) |
| Health Technologists | 28 (53.8%) | 24 (46.2%) |
| Total (Category) | 229 (49.9%) | 230 (50.1%) |
| Total (Overall) | 552 (52.5%) | 499 (47.5%) |
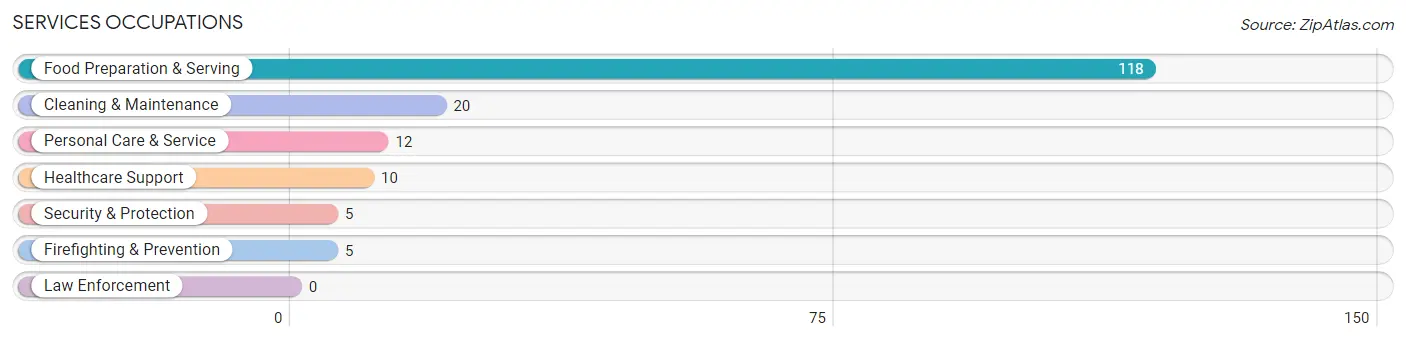
Services Occupations
The most common Services occupations in Pine Crest are Food Preparation & Serving (118 | 11.2%), Cleaning & Maintenance (20 | 1.9%), Personal Care & Service (12 | 1.1%), Healthcare Support (10 | 0.9%), and Security & Protection (5 | 0.5%).
Services Occupations by Sex
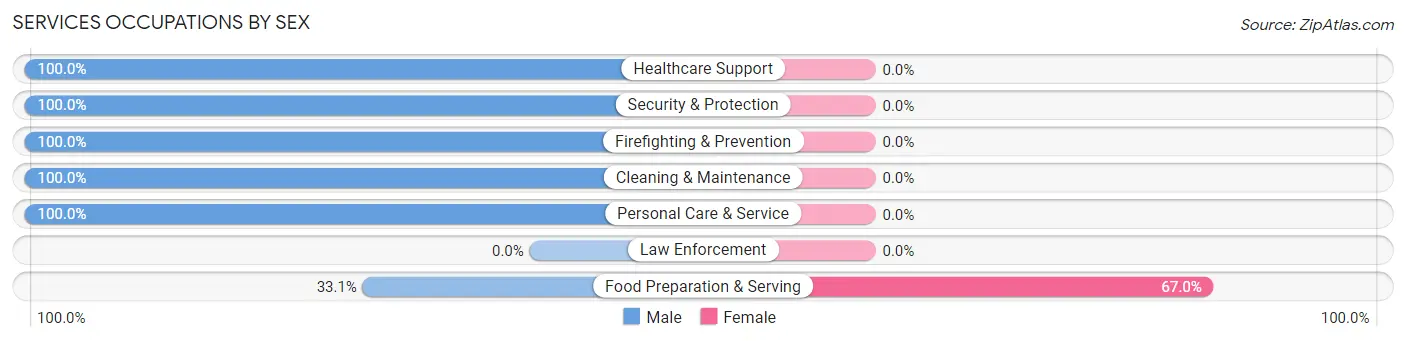
| Occupation | Male | Female |
| Healthcare Support | 10 (100.0%) | 0 (0.0%) |
| Security & Protection | 5 (100.0%) | 0 (0.0%) |
| Firefighting & Prevention | 5 (100.0%) | 0 (0.0%) |
| Law Enforcement | 0 (0.0%) | 0 (0.0%) |
| Food Preparation & Serving | 39 (33.1%) | 79 (66.9%) |
| Cleaning & Maintenance | 20 (100.0%) | 0 (0.0%) |
| Personal Care & Service | 12 (100.0%) | 0 (0.0%) |
| Total (Category) | 86 (52.1%) | 79 (47.9%) |
| Total (Overall) | 552 (52.5%) | 499 (47.5%) |
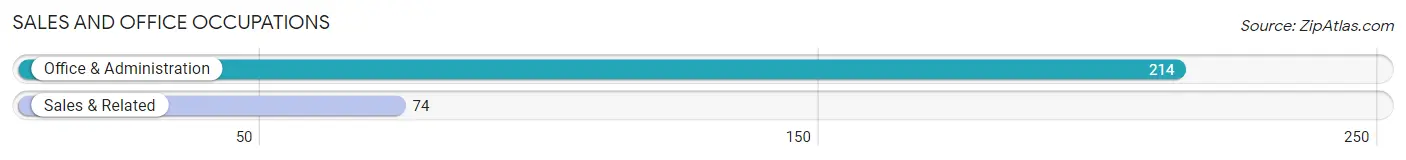
Sales and Office Occupations
The most common Sales and Office occupations in Pine Crest are Office & Administration (214 | 20.4%), and Sales & Related (74 | 7.0%).
Sales and Office Occupations by Sex

| Occupation | Male | Female |
| Sales & Related | 70 (94.6%) | 4 (5.4%) |
| Office & Administration | 47 (22.0%) | 167 (78.0%) |
| Total (Category) | 117 (40.6%) | 171 (59.4%) |
| Total (Overall) | 552 (52.5%) | 499 (47.5%) |
Natural Resources, Construction and Maintenance Occupations
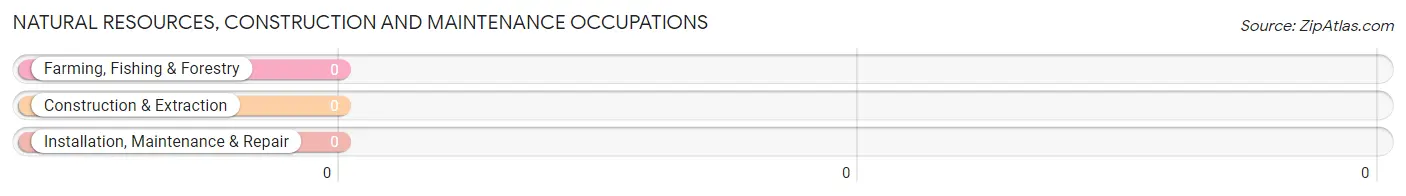
Natural Resources, Construction and Maintenance Occupations by Sex
| Occupation | Male | Female |
| Farming, Fishing & Forestry | 0 (0.0%) | 0 (0.0%) |
| Construction & Extraction | 0 (0.0%) | 0 (0.0%) |
| Installation, Maintenance & Repair | 0 (0.0%) | 0 (0.0%) |
| Total (Category) | 0 (0.0%) | 0 (0.0%) |
| Total (Overall) | 552 (52.5%) | 499 (47.5%) |
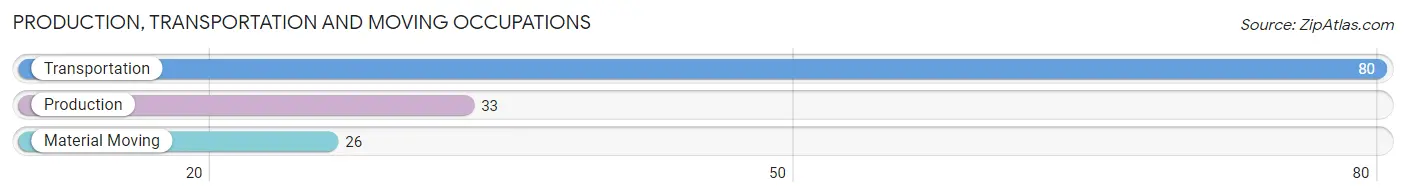
Production, Transportation and Moving Occupations
The most common Production, Transportation and Moving occupations in Pine Crest are Transportation (80 | 7.6%), Production (33 | 3.1%), and Material Moving (26 | 2.5%).
Production, Transportation and Moving Occupations by Sex
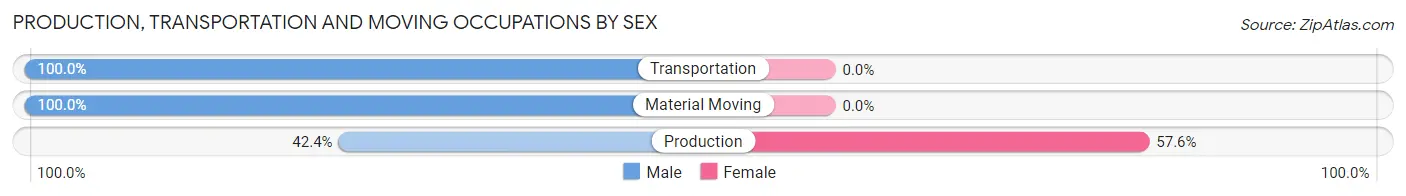
| Occupation | Male | Female |
| Production | 14 (42.4%) | 19 (57.6%) |
| Transportation | 80 (100.0%) | 0 (0.0%) |
| Material Moving | 26 (100.0%) | 0 (0.0%) |
| Total (Category) | 120 (86.3%) | 19 (13.7%) |
| Total (Overall) | 552 (52.5%) | 499 (47.5%) |
Employment Industries by Sex in Pine Crest
Employment Industries in Pine Crest
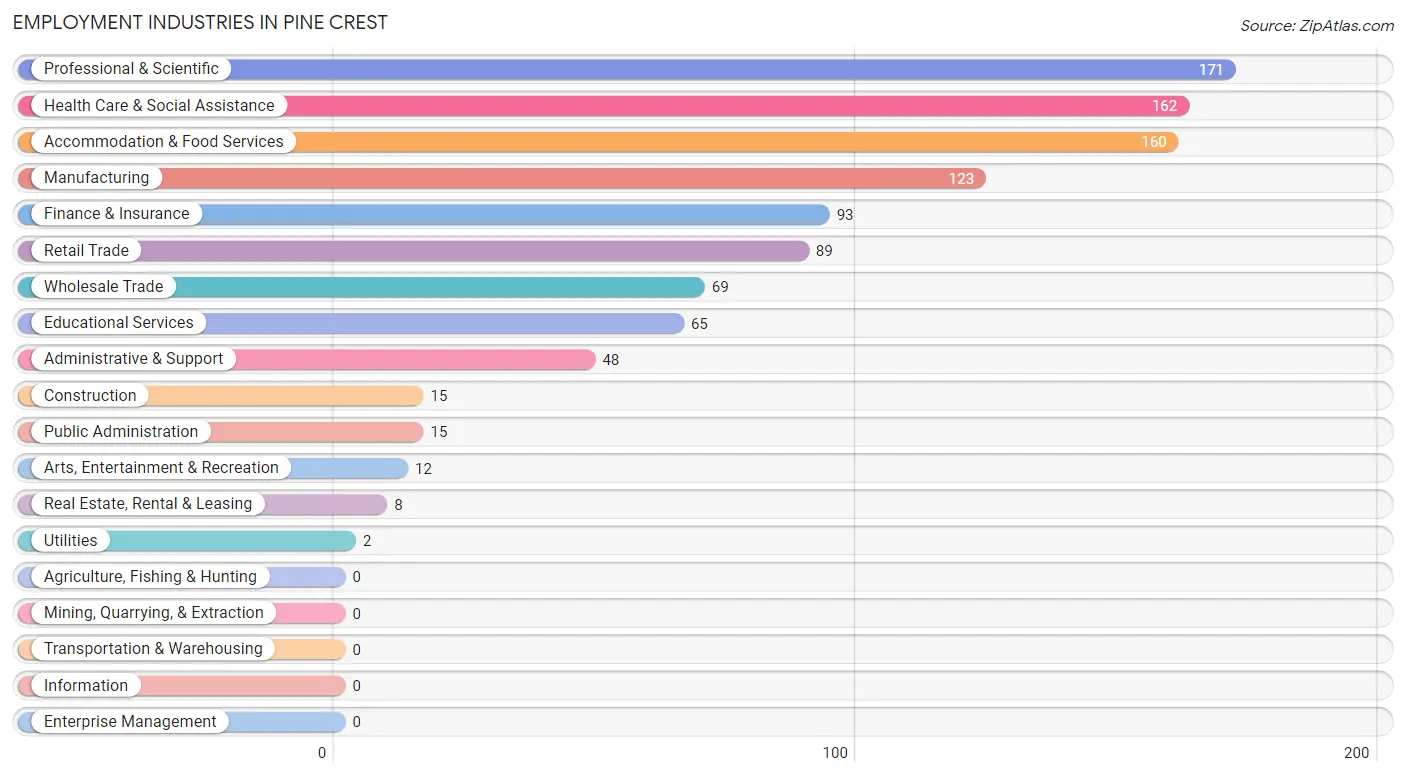
The major employment industries in Pine Crest include Professional & Scientific (171 | 16.3%), Health Care & Social Assistance (162 | 15.4%), Accommodation & Food Services (160 | 15.2%), Manufacturing (123 | 11.7%), and Finance & Insurance (93 | 8.8%).
Employment Industries by Sex in Pine Crest
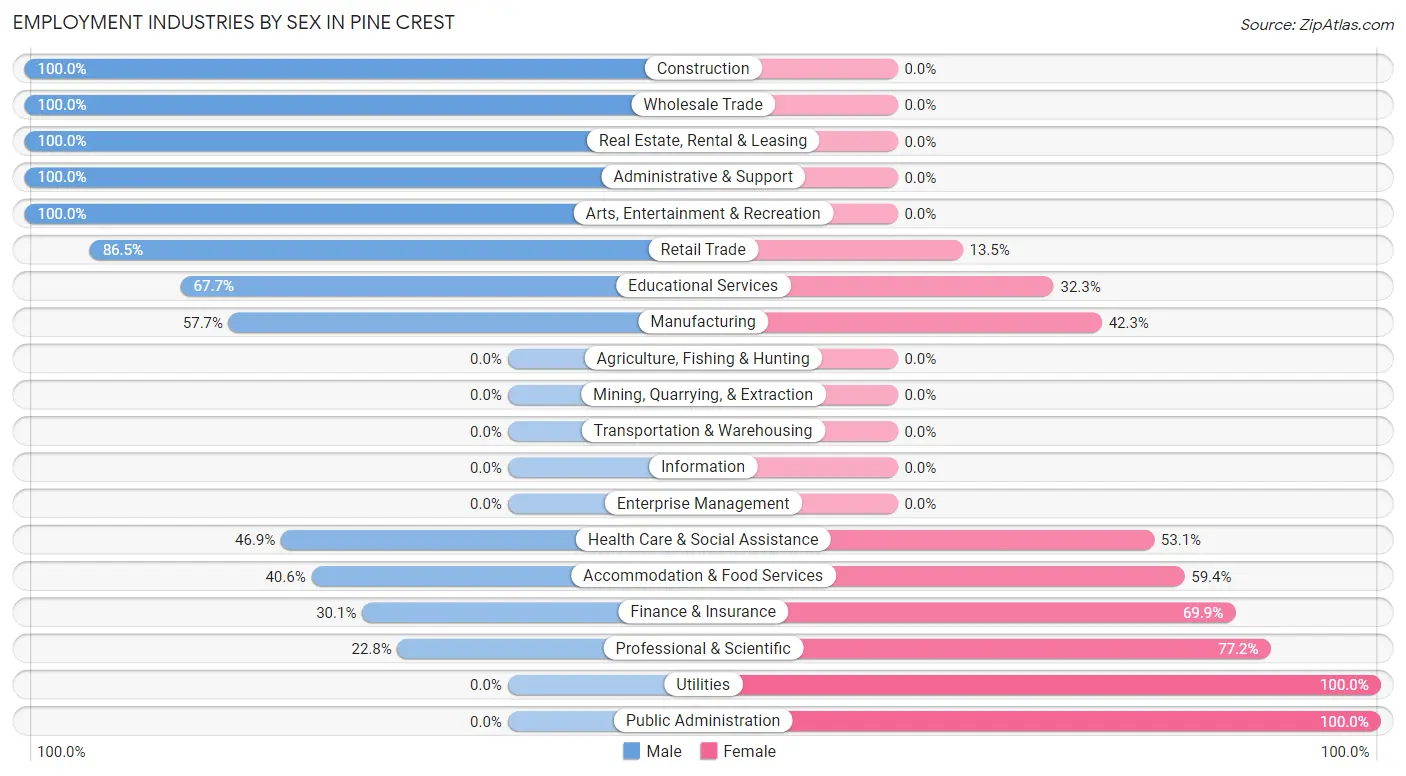
The Pine Crest industries that see more men than women are Construction (100.0%), Wholesale Trade (100.0%), and Real Estate, Rental & Leasing (100.0%), whereas the industries that tend to have a higher number of women are Utilities (100.0%), Public Administration (100.0%), and Professional & Scientific (77.2%).
| Industry | Male | Female |
| Agriculture, Fishing & Hunting | 0 (0.0%) | 0 (0.0%) |
| Mining, Quarrying, & Extraction | 0 (0.0%) | 0 (0.0%) |
| Construction | 15 (100.0%) | 0 (0.0%) |
| Manufacturing | 71 (57.7%) | 52 (42.3%) |
| Wholesale Trade | 69 (100.0%) | 0 (0.0%) |
| Retail Trade | 77 (86.5%) | 12 (13.5%) |
| Transportation & Warehousing | 0 (0.0%) | 0 (0.0%) |
| Utilities | 0 (0.0%) | 2 (100.0%) |
| Information | 0 (0.0%) | 0 (0.0%) |
| Finance & Insurance | 28 (30.1%) | 65 (69.9%) |
| Real Estate, Rental & Leasing | 8 (100.0%) | 0 (0.0%) |
| Professional & Scientific | 39 (22.8%) | 132 (77.2%) |
| Enterprise Management | 0 (0.0%) | 0 (0.0%) |
| Administrative & Support | 48 (100.0%) | 0 (0.0%) |
| Educational Services | 44 (67.7%) | 21 (32.3%) |
| Health Care & Social Assistance | 76 (46.9%) | 86 (53.1%) |
| Arts, Entertainment & Recreation | 12 (100.0%) | 0 (0.0%) |
| Accommodation & Food Services | 65 (40.6%) | 95 (59.4%) |
| Public Administration | 0 (0.0%) | 15 (100.0%) |
| Total | 552 (52.5%) | 499 (47.5%) |
Education in Pine Crest
School Enrollment in Pine Crest
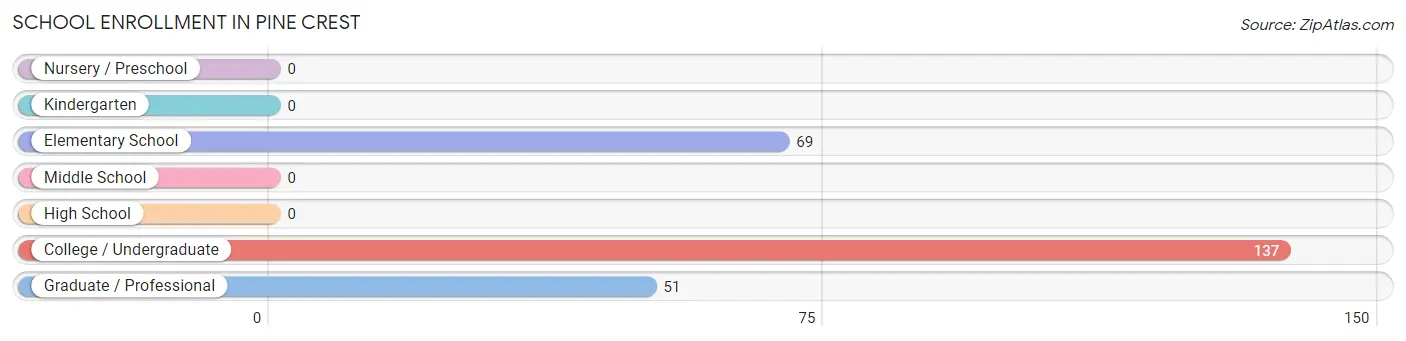
The most common levels of schooling among the 257 students in Pine Crest are college / undergraduate (137 | 53.3%), elementary school (69 | 26.9%), and graduate / professional (51 | 19.8%).
| School Level | # Students | % Students |
| Nursery / Preschool | 0 | 0.0% |
| Kindergarten | 0 | 0.0% |
| Elementary School | 69 | 26.9% |
| Middle School | 0 | 0.0% |
| High School | 0 | 0.0% |
| College / Undergraduate | 137 | 53.3% |
| Graduate / Professional | 51 | 19.8% |
| Total | 257 | 100.0% |
School Enrollment by Age by Funding Source in Pine Crest
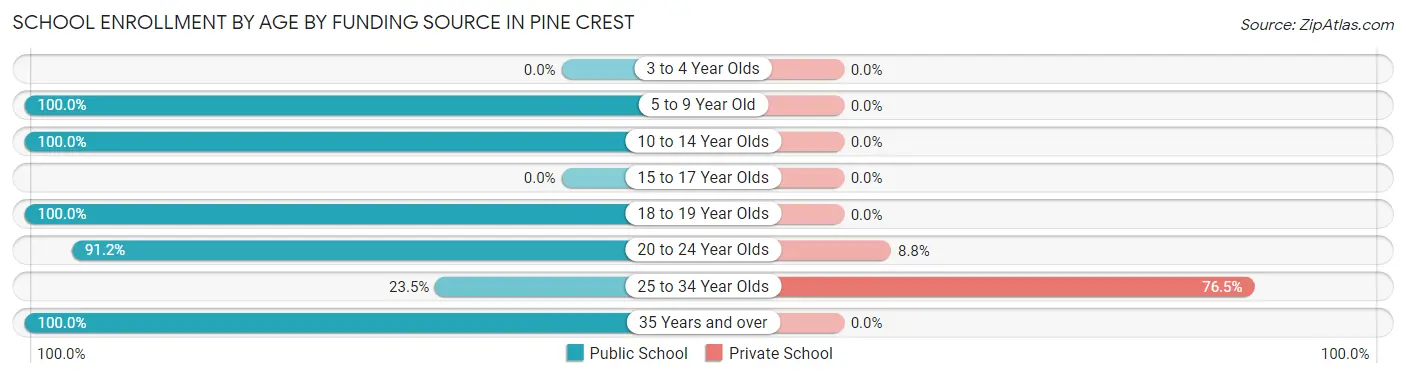
Out of a total of 257 students who are enrolled in schools in Pine Crest, 48 (18.7%) attend a private institution, while the remaining 209 (81.3%) are enrolled in public schools. The age group of 25 to 34 year olds has the highest likelihood of being enrolled in private schools, with 39 (76.5% in the age bracket) enrolled. Conversely, the age group of 5 to 9 year old has the lowest likelihood of being enrolled in a private school, with 62 (100.0% in the age bracket) attending a public institution.
| Age Bracket | Public School | Private School |
| 3 to 4 Year Olds | 0 (0.0%) | 0 (0.0%) |
| 5 to 9 Year Old | 62 (100.0%) | 0 (0.0%) |
| 10 to 14 Year Olds | 7 (100.0%) | 0 (0.0%) |
| 15 to 17 Year Olds | 0 (0.0%) | 0 (0.0%) |
| 18 to 19 Year Olds | 24 (100.0%) | 0 (0.0%) |
| 20 to 24 Year Olds | 93 (91.2%) | 9 (8.8%) |
| 25 to 34 Year Olds | 12 (23.5%) | 39 (76.5%) |
| 35 Years and over | 11 (100.0%) | 0 (0.0%) |
| Total | 209 (81.3%) | 48 (18.7%) |
Educational Attainment by Field of Study in Pine Crest
Visual & performing arts (87 | 13.6%), education (86 | 13.4%), science & technology (80 | 12.5%), business (72 | 11.2%), and bio, nature & agricultural (59 | 9.2%) are the most common fields of study among 642 individuals in Pine Crest who have obtained a bachelor's degree or higher.
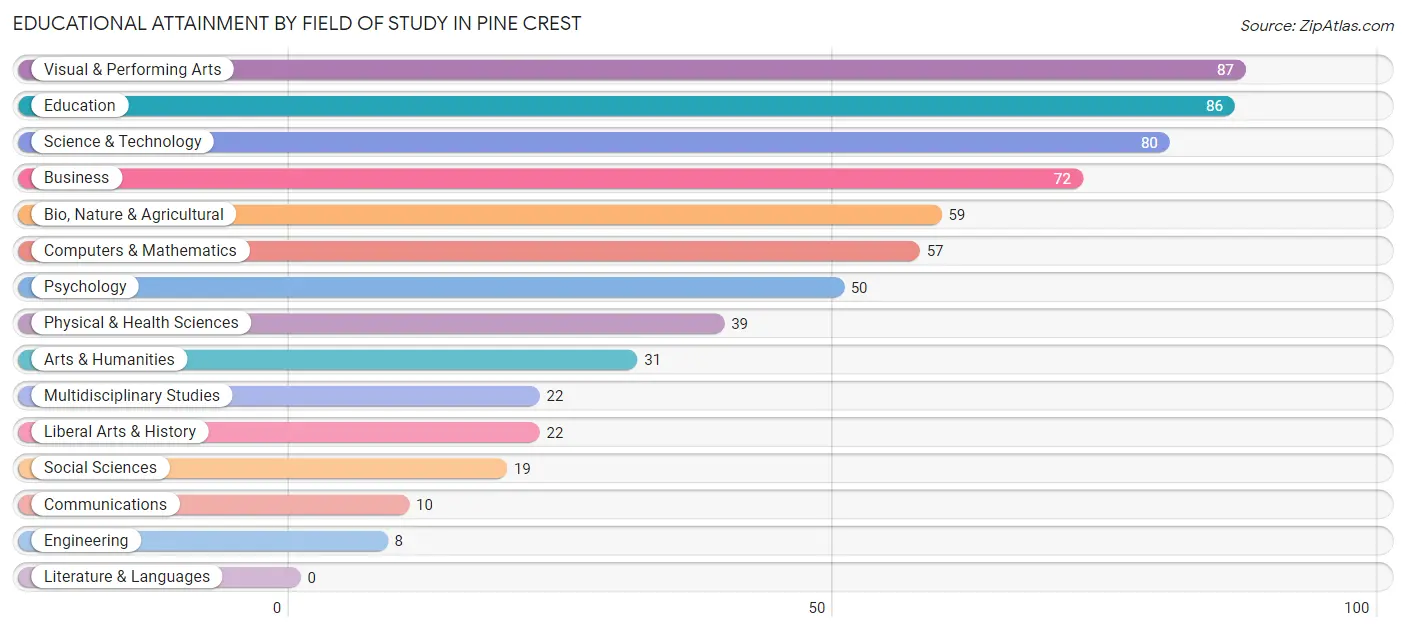
| Field of Study | # Graduates | % Graduates |
| Computers & Mathematics | 57 | 8.9% |
| Bio, Nature & Agricultural | 59 | 9.2% |
| Physical & Health Sciences | 39 | 6.1% |
| Psychology | 50 | 7.8% |
| Social Sciences | 19 | 3.0% |
| Engineering | 8 | 1.3% |
| Multidisciplinary Studies | 22 | 3.4% |
| Science & Technology | 80 | 12.5% |
| Business | 72 | 11.2% |
| Education | 86 | 13.4% |
| Literature & Languages | 0 | 0.0% |
| Liberal Arts & History | 22 | 3.4% |
| Visual & Performing Arts | 87 | 13.6% |
| Communications | 10 | 1.6% |
| Arts & Humanities | 31 | 4.8% |
| Total | 642 | 100.0% |
Transportation & Commute in Pine Crest
Vehicle Availability by Sex in Pine Crest
The most prevalent vehicle ownership categories in Pine Crest are males with 2 vehicles (226, accounting for 40.9%) and females with 2 vehicles (193, making up 45.9%).
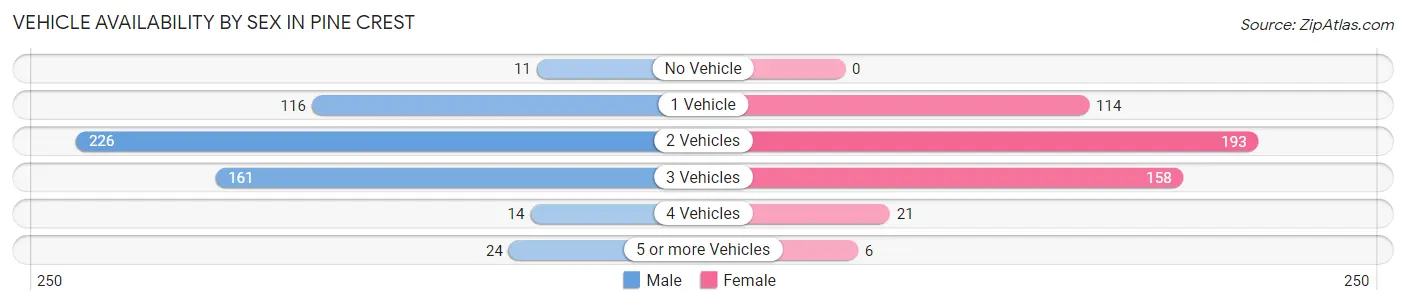
| Vehicles Available | Male | Female |
| No Vehicle | 11 (2.0%) | 0 (0.0%) |
| 1 Vehicle | 116 (21.0%) | 114 (23.2%) |
| 2 Vehicles | 226 (40.9%) | 193 (39.2%) |
| 3 Vehicles | 161 (29.2%) | 158 (32.1%) |
| 4 Vehicles | 14 (2.5%) | 21 (4.3%) |
| 5 or more Vehicles | 24 (4.3%) | 6 (1.2%) |
| Total | 552 (100.0%) | 492 (100.0%) |
Commute Time in Pine Crest
The most frequently occuring commute durations in Pine Crest are 15 to 19 minutes (263 commuters, 27.0%), 10 to 14 minutes (157 commuters, 16.1%), and 30 to 34 minutes (137 commuters, 14.0%).
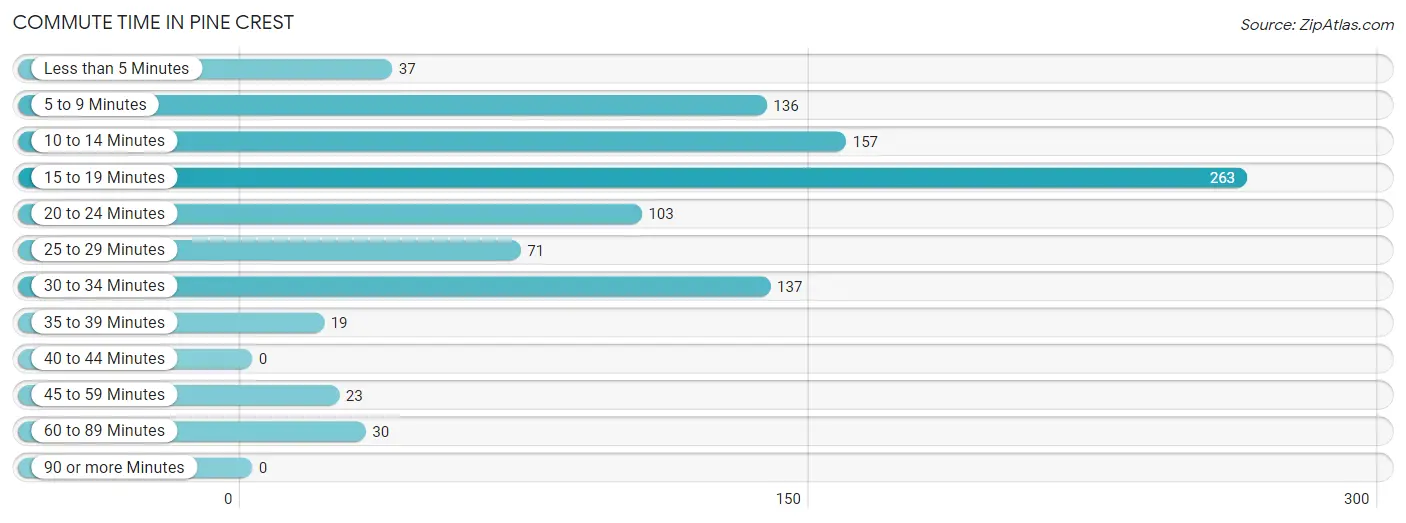
| Commute Time | # Commuters | % Commuters |
| Less than 5 Minutes | 37 | 3.8% |
| 5 to 9 Minutes | 136 | 13.9% |
| 10 to 14 Minutes | 157 | 16.1% |
| 15 to 19 Minutes | 263 | 27.0% |
| 20 to 24 Minutes | 103 | 10.5% |
| 25 to 29 Minutes | 71 | 7.3% |
| 30 to 34 Minutes | 137 | 14.0% |
| 35 to 39 Minutes | 19 | 1.9% |
| 40 to 44 Minutes | 0 | 0.0% |
| 45 to 59 Minutes | 23 | 2.4% |
| 60 to 89 Minutes | 30 | 3.1% |
| 90 or more Minutes | 0 | 0.0% |
Commute Time by Sex in Pine Crest
The most common commute times in Pine Crest are 10 to 14 minutes (97 commuters, 18.2%) for males and 15 to 19 minutes (174 commuters, 39.4%) for females.
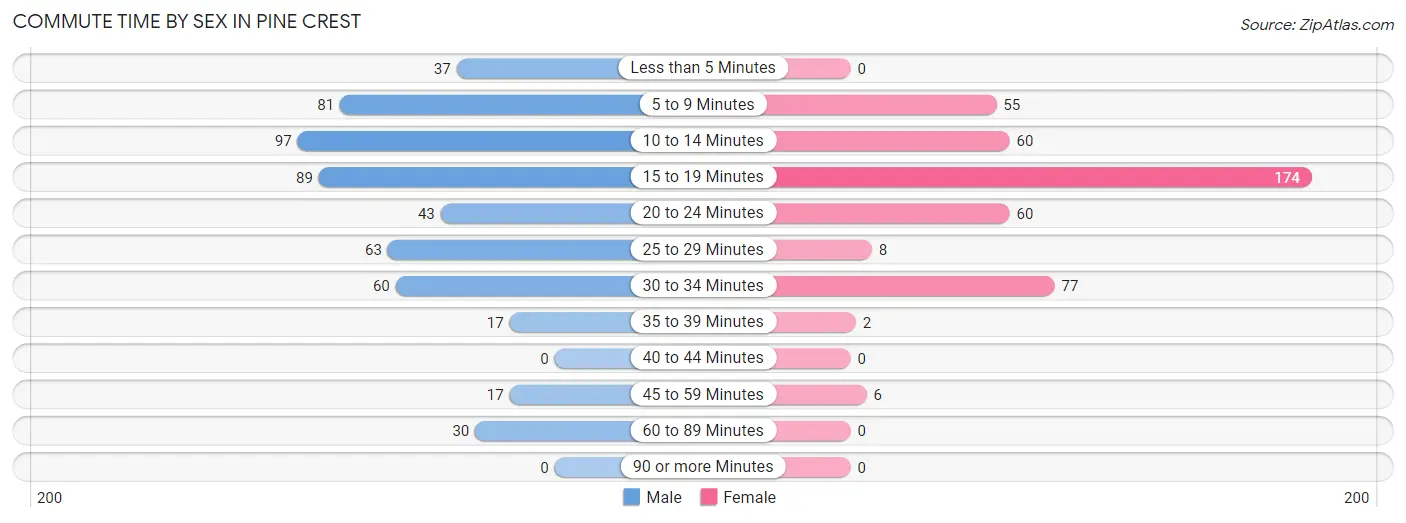
| Commute Time | Male | Female |
| Less than 5 Minutes | 37 (6.9%) | 0 (0.0%) |
| 5 to 9 Minutes | 81 (15.2%) | 55 (12.4%) |
| 10 to 14 Minutes | 97 (18.2%) | 60 (13.6%) |
| 15 to 19 Minutes | 89 (16.7%) | 174 (39.4%) |
| 20 to 24 Minutes | 43 (8.1%) | 60 (13.6%) |
| 25 to 29 Minutes | 63 (11.8%) | 8 (1.8%) |
| 30 to 34 Minutes | 60 (11.2%) | 77 (17.4%) |
| 35 to 39 Minutes | 17 (3.2%) | 2 (0.4%) |
| 40 to 44 Minutes | 0 (0.0%) | 0 (0.0%) |
| 45 to 59 Minutes | 17 (3.2%) | 6 (1.4%) |
| 60 to 89 Minutes | 30 (5.6%) | 0 (0.0%) |
| 90 or more Minutes | 0 (0.0%) | 0 (0.0%) |
Time of Departure to Work by Sex in Pine Crest
The most frequent times of departure to work in Pine Crest are 4:00 PM to 11:59 PM (108, 20.2%) for males and 7:00 AM to 7:29 AM (161, 36.4%) for females.
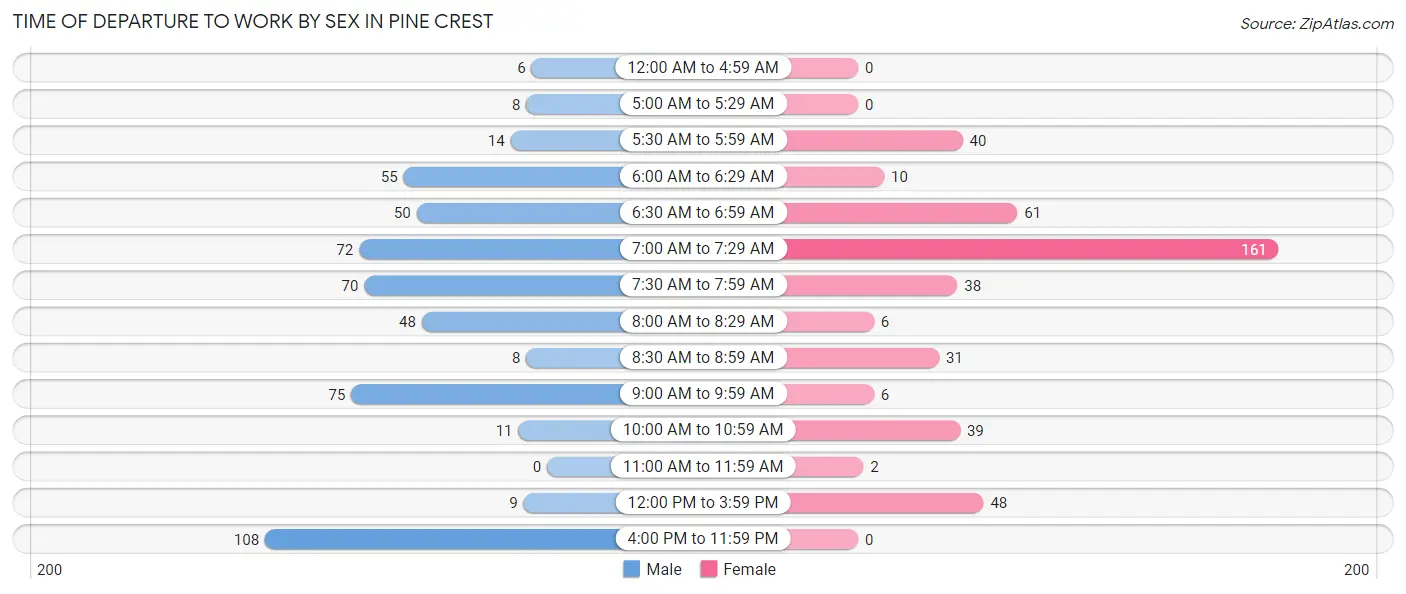
| Time of Departure | Male | Female |
| 12:00 AM to 4:59 AM | 6 (1.1%) | 0 (0.0%) |
| 5:00 AM to 5:29 AM | 8 (1.5%) | 0 (0.0%) |
| 5:30 AM to 5:59 AM | 14 (2.6%) | 40 (9.0%) |
| 6:00 AM to 6:29 AM | 55 (10.3%) | 10 (2.3%) |
| 6:30 AM to 6:59 AM | 50 (9.4%) | 61 (13.8%) |
| 7:00 AM to 7:29 AM | 72 (13.5%) | 161 (36.4%) |
| 7:30 AM to 7:59 AM | 70 (13.1%) | 38 (8.6%) |
| 8:00 AM to 8:29 AM | 48 (9.0%) | 6 (1.4%) |
| 8:30 AM to 8:59 AM | 8 (1.5%) | 31 (7.0%) |
| 9:00 AM to 9:59 AM | 75 (14.0%) | 6 (1.4%) |
| 10:00 AM to 10:59 AM | 11 (2.1%) | 39 (8.8%) |
| 11:00 AM to 11:59 AM | 0 (0.0%) | 2 (0.4%) |
| 12:00 PM to 3:59 PM | 9 (1.7%) | 48 (10.9%) |
| 4:00 PM to 11:59 PM | 108 (20.2%) | 0 (0.0%) |
| Total | 534 (100.0%) | 442 (100.0%) |
Housing Occupancy in Pine Crest
Occupancy by Ownership in Pine Crest
Of the total 1,037 dwellings in Pine Crest, owner-occupied units account for 665 (64.1%), while renter-occupied units make up 372 (35.9%).
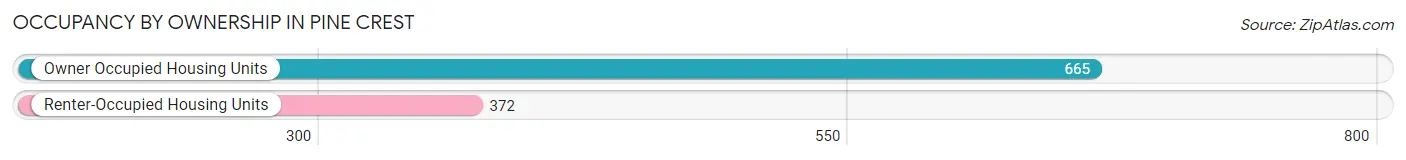
| Occupancy | # Housing Units | % Housing Units |
| Owner Occupied Housing Units | 665 | 64.1% |
| Renter-Occupied Housing Units | 372 | 35.9% |
| Total Occupied Housing Units | 1,037 | 100.0% |
Occupancy by Household Size in Pine Crest
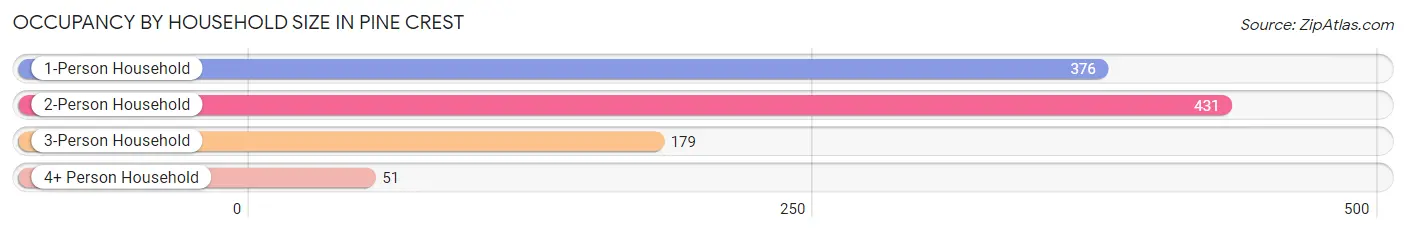
| Household Size | # Housing Units | % Housing Units |
| 1-Person Household | 376 | 36.3% |
| 2-Person Household | 431 | 41.6% |
| 3-Person Household | 179 | 17.3% |
| 4+ Person Household | 51 | 4.9% |
| Total Housing Units | 1,037 | 100.0% |
Occupancy by Ownership by Household Size in Pine Crest
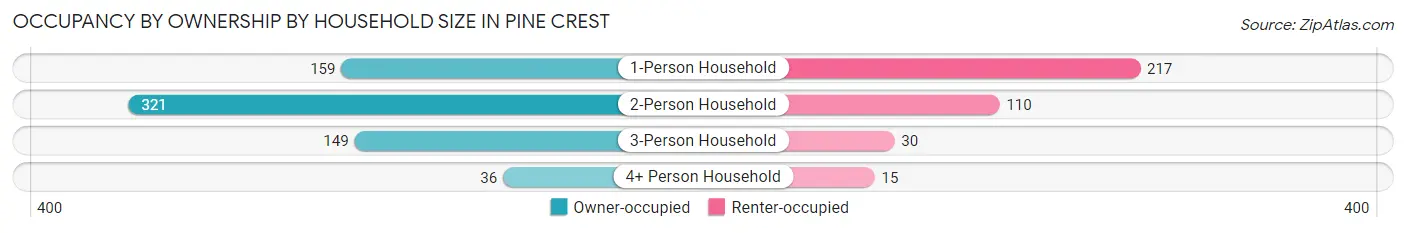
| Household Size | Owner-occupied | Renter-occupied |
| 1-Person Household | 159 (42.3%) | 217 (57.7%) |
| 2-Person Household | 321 (74.5%) | 110 (25.5%) |
| 3-Person Household | 149 (83.2%) | 30 (16.8%) |
| 4+ Person Household | 36 (70.6%) | 15 (29.4%) |
| Total Housing Units | 665 (64.1%) | 372 (35.9%) |
Occupancy by Educational Attainment in Pine Crest
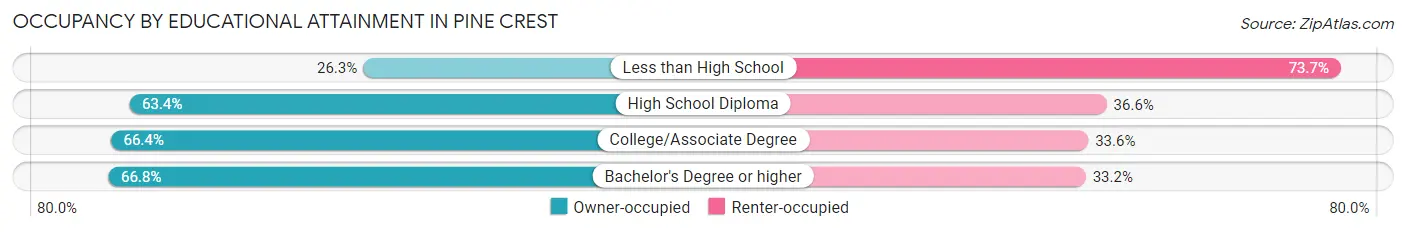
| Household Size | Owner-occupied | Renter-occupied |
| Less than High School | 10 (26.3%) | 28 (73.7%) |
| High School Diploma | 203 (63.4%) | 117 (36.6%) |
| College/Associate Degree | 213 (66.4%) | 108 (33.6%) |
| Bachelor's Degree or higher | 239 (66.8%) | 119 (33.2%) |
Occupancy by Age of Householder in Pine Crest
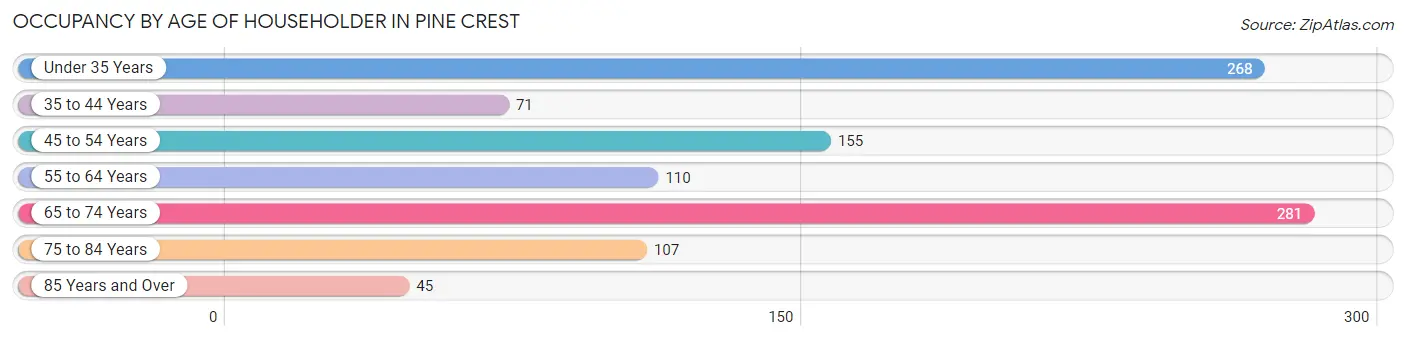
| Age Bracket | # Households | % Households |
| Under 35 Years | 268 | 25.8% |
| 35 to 44 Years | 71 | 6.9% |
| 45 to 54 Years | 155 | 14.9% |
| 55 to 64 Years | 110 | 10.6% |
| 65 to 74 Years | 281 | 27.1% |
| 75 to 84 Years | 107 | 10.3% |
| 85 Years and Over | 45 | 4.3% |
| Total | 1,037 | 100.0% |
Housing Finances in Pine Crest
Median Income by Occupancy in Pine Crest
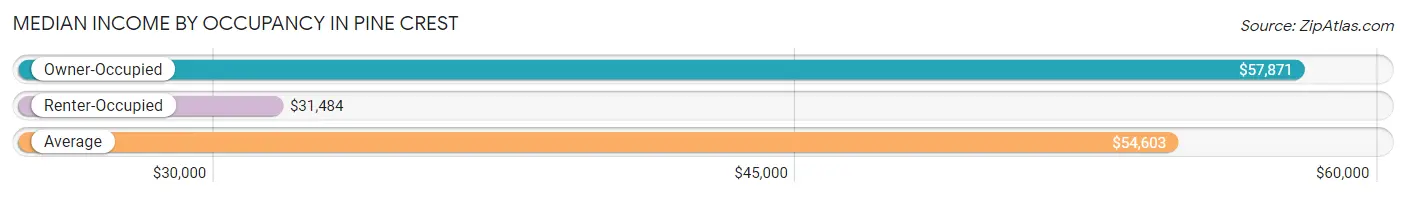
| Occupancy Type | # Households | Median Income |
| Owner-Occupied | 665 (64.1%) | $57,871 |
| Renter-Occupied | 372 (35.9%) | $31,484 |
| Average | 1,037 (100.0%) | $54,603 |
Occupancy by Householder Income Bracket in Pine Crest
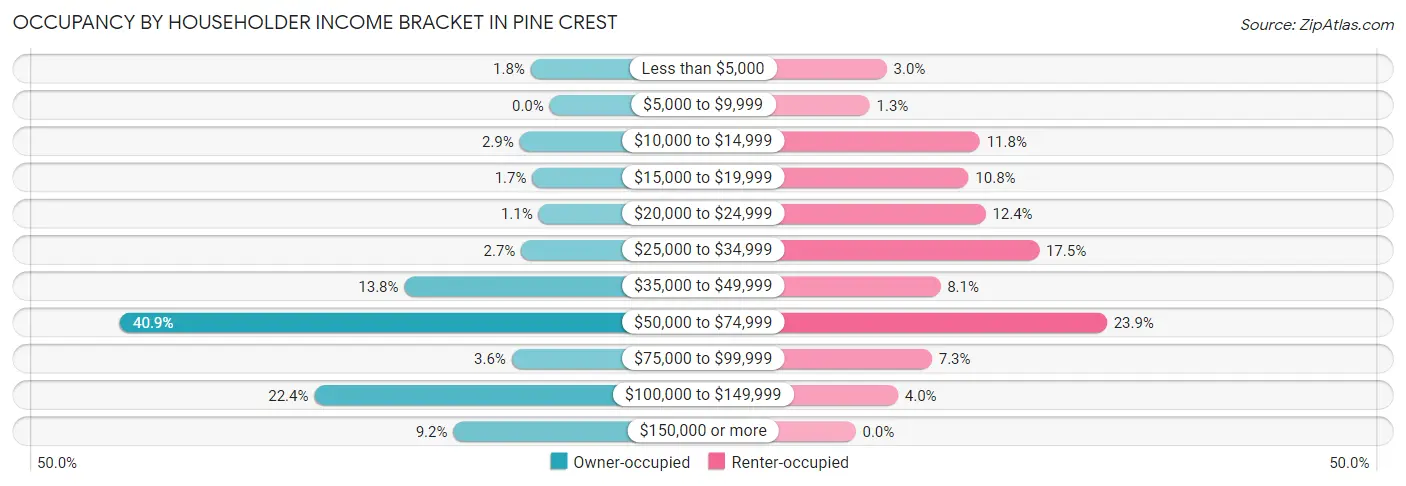
| Income Bracket | Owner-occupied | Renter-occupied |
| Less than $5,000 | 12 (1.8%) | 11 (3.0%) |
| $5,000 to $9,999 | 0 (0.0%) | 5 (1.3%) |
| $10,000 to $14,999 | 19 (2.9%) | 44 (11.8%) |
| $15,000 to $19,999 | 11 (1.7%) | 40 (10.7%) |
| $20,000 to $24,999 | 7 (1.1%) | 46 (12.4%) |
| $25,000 to $34,999 | 18 (2.7%) | 65 (17.5%) |
| $35,000 to $49,999 | 92 (13.8%) | 30 (8.1%) |
| $50,000 to $74,999 | 272 (40.9%) | 89 (23.9%) |
| $75,000 to $99,999 | 24 (3.6%) | 27 (7.3%) |
| $100,000 to $149,999 | 149 (22.4%) | 15 (4.0%) |
| $150,000 or more | 61 (9.2%) | 0 (0.0%) |
| Total | 665 (100.0%) | 372 (100.0%) |
Monthly Housing Cost Tiers in Pine Crest
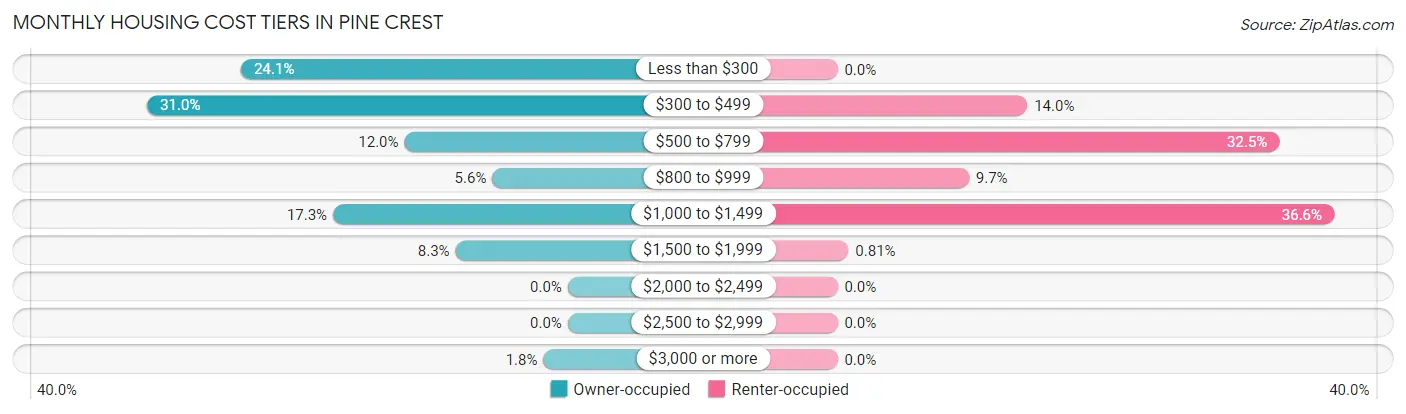
| Monthly Cost | Owner-occupied | Renter-occupied |
| Less than $300 | 160 (24.1%) | 0 (0.0%) |
| $300 to $499 | 206 (31.0%) | 52 (14.0%) |
| $500 to $799 | 80 (12.0%) | 121 (32.5%) |
| $800 to $999 | 37 (5.6%) | 36 (9.7%) |
| $1,000 to $1,499 | 115 (17.3%) | 136 (36.6%) |
| $1,500 to $1,999 | 55 (8.3%) | 3 (0.8%) |
| $2,000 to $2,499 | 0 (0.0%) | 0 (0.0%) |
| $2,500 to $2,999 | 0 (0.0%) | 0 (0.0%) |
| $3,000 or more | 12 (1.8%) | 0 (0.0%) |
| Total | 665 (100.0%) | 372 (100.0%) |
Physical Housing Characteristics in Pine Crest
Housing Structures in Pine Crest
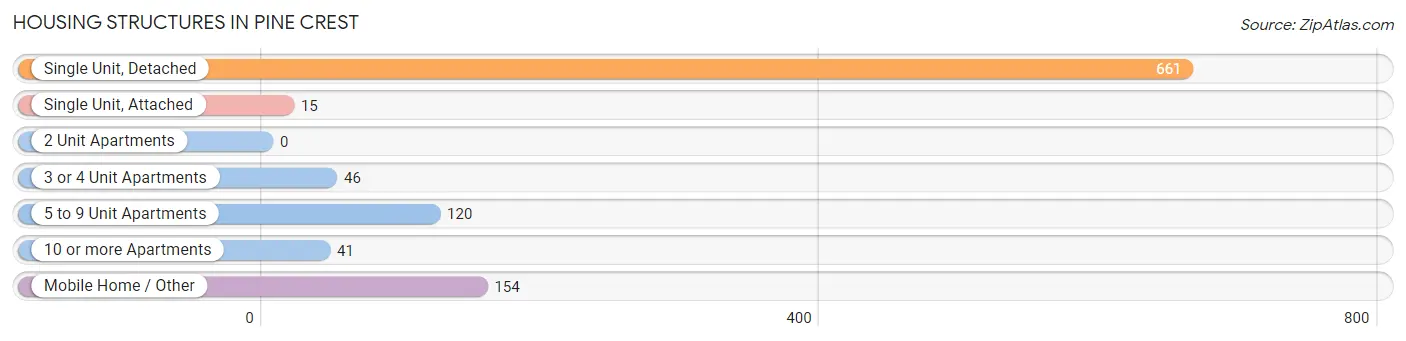
| Structure Type | # Housing Units | % Housing Units |
| Single Unit, Detached | 661 | 63.7% |
| Single Unit, Attached | 15 | 1.5% |
| 2 Unit Apartments | 0 | 0.0% |
| 3 or 4 Unit Apartments | 46 | 4.4% |
| 5 to 9 Unit Apartments | 120 | 11.6% |
| 10 or more Apartments | 41 | 4.0% |
| Mobile Home / Other | 154 | 14.8% |
| Total | 1,037 | 100.0% |
Housing Structures by Occupancy in Pine Crest
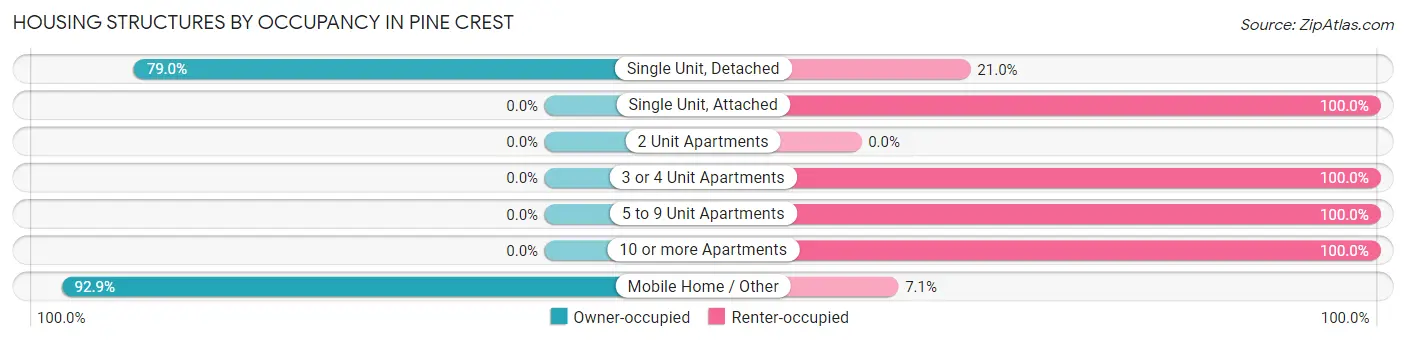
| Structure Type | Owner-occupied | Renter-occupied |
| Single Unit, Detached | 522 (79.0%) | 139 (21.0%) |
| Single Unit, Attached | 0 (0.0%) | 15 (100.0%) |
| 2 Unit Apartments | 0 (0.0%) | 0 (0.0%) |
| 3 or 4 Unit Apartments | 0 (0.0%) | 46 (100.0%) |
| 5 to 9 Unit Apartments | 0 (0.0%) | 120 (100.0%) |
| 10 or more Apartments | 0 (0.0%) | 41 (100.0%) |
| Mobile Home / Other | 143 (92.9%) | 11 (7.1%) |
| Total | 665 (64.1%) | 372 (35.9%) |
Housing Structures by Number of Rooms in Pine Crest
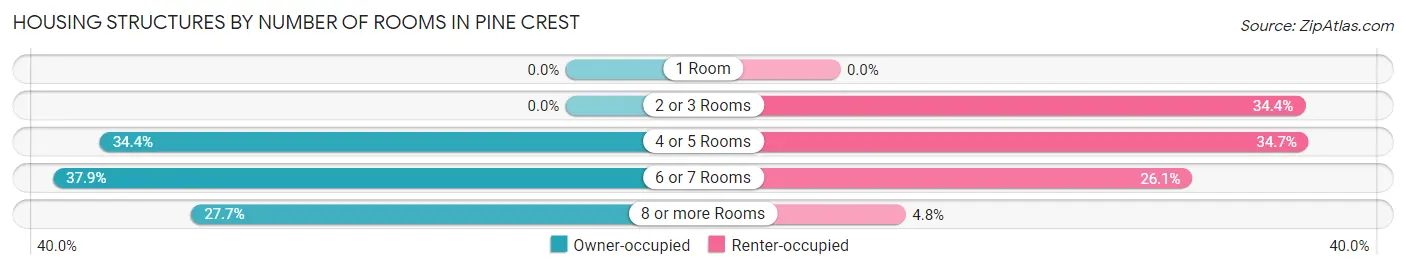
| Number of Rooms | Owner-occupied | Renter-occupied |
| 1 Room | 0 (0.0%) | 0 (0.0%) |
| 2 or 3 Rooms | 0 (0.0%) | 128 (34.4%) |
| 4 or 5 Rooms | 229 (34.4%) | 129 (34.7%) |
| 6 or 7 Rooms | 252 (37.9%) | 97 (26.1%) |
| 8 or more Rooms | 184 (27.7%) | 18 (4.8%) |
| Total | 665 (100.0%) | 372 (100.0%) |
Housing Structure by Heating Type in Pine Crest
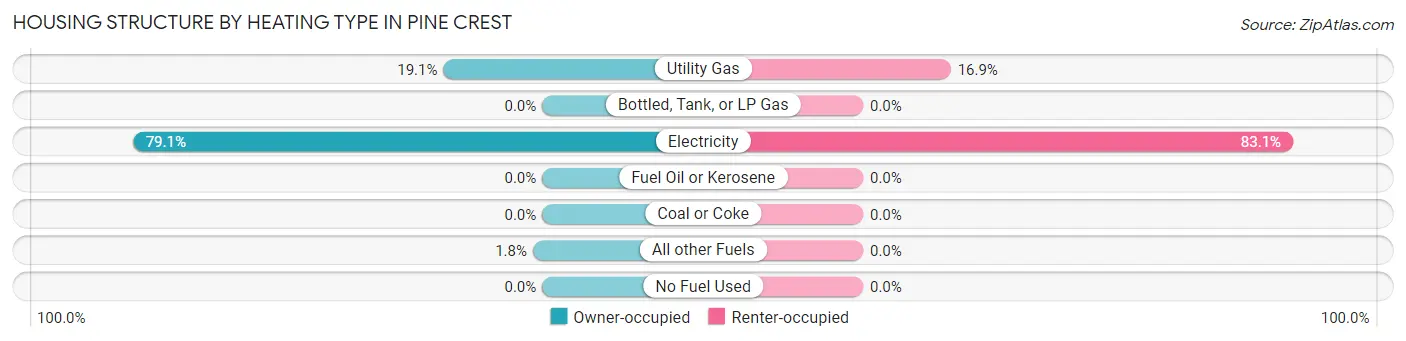
| Heating Type | Owner-occupied | Renter-occupied |
| Utility Gas | 127 (19.1%) | 63 (16.9%) |
| Bottled, Tank, or LP Gas | 0 (0.0%) | 0 (0.0%) |
| Electricity | 526 (79.1%) | 309 (83.1%) |
| Fuel Oil or Kerosene | 0 (0.0%) | 0 (0.0%) |
| Coal or Coke | 0 (0.0%) | 0 (0.0%) |
| All other Fuels | 12 (1.8%) | 0 (0.0%) |
| No Fuel Used | 0 (0.0%) | 0 (0.0%) |
| Total | 665 (100.0%) | 372 (100.0%) |
Household Vehicle Usage in Pine Crest
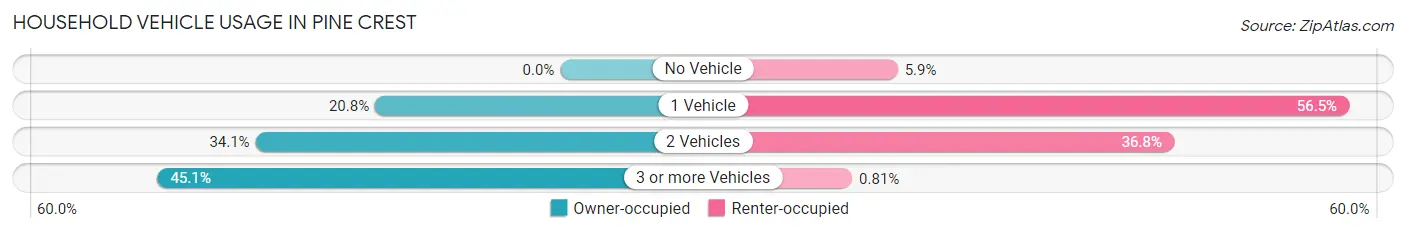
| Vehicles per Household | Owner-occupied | Renter-occupied |
| No Vehicle | 0 (0.0%) | 22 (5.9%) |
| 1 Vehicle | 138 (20.7%) | 210 (56.5%) |
| 2 Vehicles | 227 (34.1%) | 137 (36.8%) |
| 3 or more Vehicles | 300 (45.1%) | 3 (0.8%) |
| Total | 665 (100.0%) | 372 (100.0%) |
Real Estate & Mortgages in Pine Crest
Real Estate and Mortgage Overview in Pine Crest
| Characteristic | Without Mortgage | With Mortgage |
| Housing Units | 412 | 253 |
| Median Property Value | $158,300 | $146,500 |
| Median Household Income | $56,308 | $47 |
| Monthly Housing Costs | $355 | $0 |
| Real Estate Taxes | $846 | $0 |
Property Value by Mortgage Status in Pine Crest
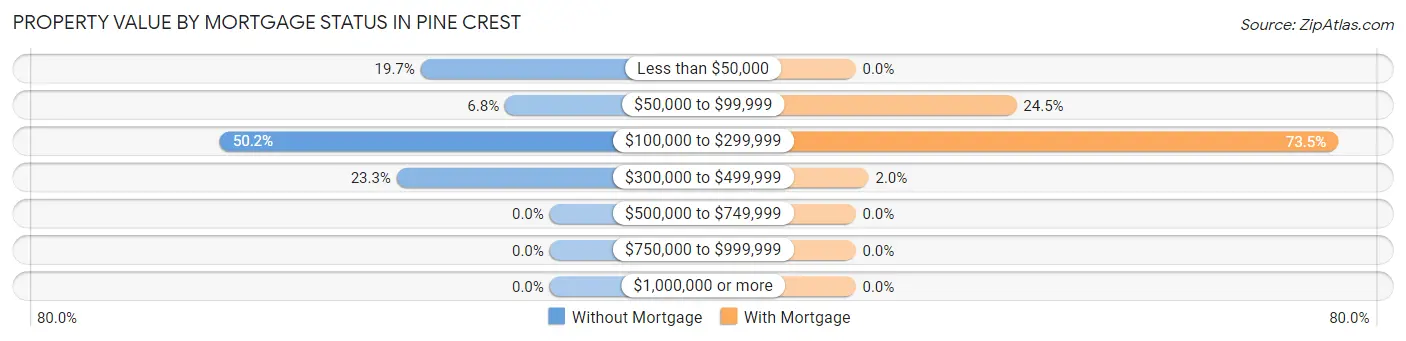
| Property Value | Without Mortgage | With Mortgage |
| Less than $50,000 | 81 (19.7%) | 0 (0.0%) |
| $50,000 to $99,999 | 28 (6.8%) | 62 (24.5%) |
| $100,000 to $299,999 | 207 (50.2%) | 186 (73.5%) |
| $300,000 to $499,999 | 96 (23.3%) | 5 (2.0%) |
| $500,000 to $749,999 | 0 (0.0%) | 0 (0.0%) |
| $750,000 to $999,999 | 0 (0.0%) | 0 (0.0%) |
| $1,000,000 or more | 0 (0.0%) | 0 (0.0%) |
| Total | 412 (100.0%) | 253 (100.0%) |
Household Income by Mortgage Status in Pine Crest
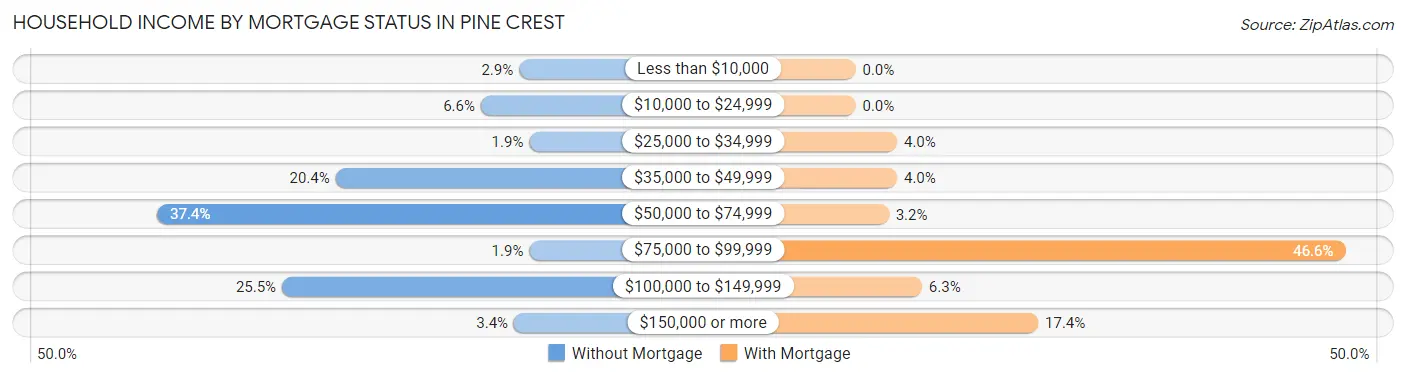
| Household Income | Without Mortgage | With Mortgage |
| Less than $10,000 | 12 (2.9%) | 0 (0.0%) |
| $10,000 to $24,999 | 27 (6.6%) | 0 (0.0%) |
| $25,000 to $34,999 | 8 (1.9%) | 10 (4.0%) |
| $35,000 to $49,999 | 84 (20.4%) | 10 (4.0%) |
| $50,000 to $74,999 | 154 (37.4%) | 8 (3.2%) |
| $75,000 to $99,999 | 8 (1.9%) | 118 (46.6%) |
| $100,000 to $149,999 | 105 (25.5%) | 16 (6.3%) |
| $150,000 or more | 14 (3.4%) | 44 (17.4%) |
| Total | 412 (100.0%) | 253 (100.0%) |
Property Value to Household Income Ratio in Pine Crest
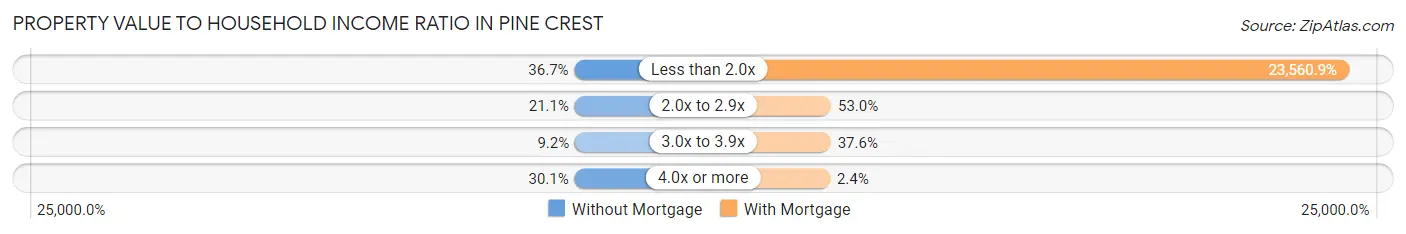
| Value-to-Income Ratio | Without Mortgage | With Mortgage |
| Less than 2.0x | 151 (36.6%) | 59,609 (23,560.9%) |
| 2.0x to 2.9x | 87 (21.1%) | 134 (53.0%) |
| 3.0x to 3.9x | 38 (9.2%) | 95 (37.6%) |
| 4.0x or more | 124 (30.1%) | 6 (2.4%) |
| Total | 412 (100.0%) | 253 (100.0%) |
Real Estate Taxes by Mortgage Status in Pine Crest
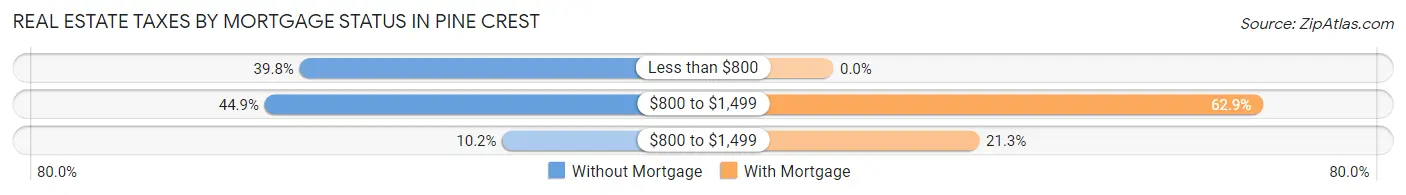
| Property Taxes | Without Mortgage | With Mortgage |
| Less than $800 | 164 (39.8%) | 0 (0.0%) |
| $800 to $1,499 | 185 (44.9%) | 159 (62.8%) |
| $800 to $1,499 | 42 (10.2%) | 54 (21.3%) |
| Total | 412 (100.0%) | 253 (100.0%) |
Health & Disability in Pine Crest
Health Insurance Coverage by Age in Pine Crest
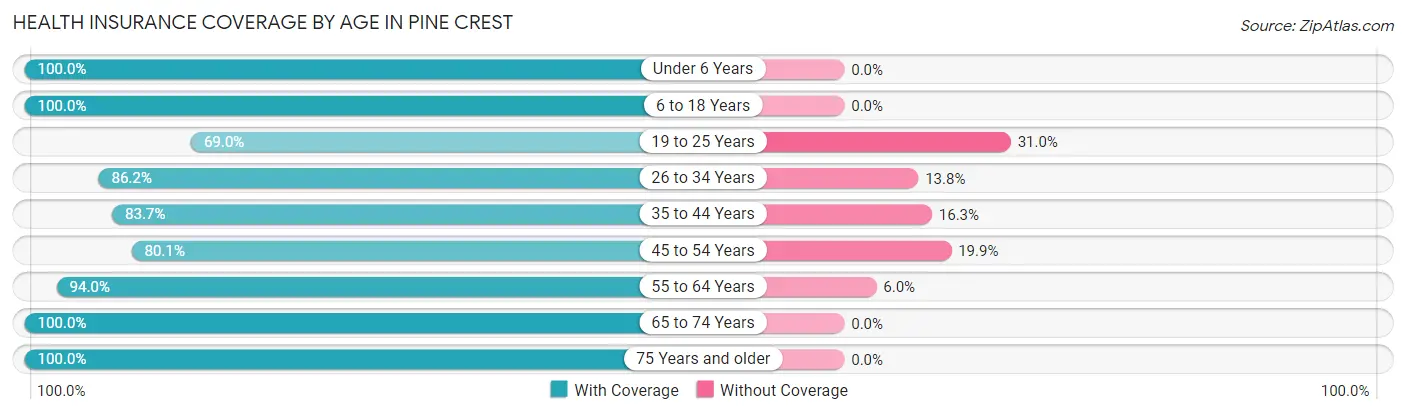
| Age Bracket | With Coverage | Without Coverage |
| Under 6 Years | 73 (100.0%) | 0 (0.0%) |
| 6 to 18 Years | 76 (100.0%) | 0 (0.0%) |
| 19 to 25 Years | 160 (69.0%) | 72 (31.0%) |
| 26 to 34 Years | 369 (86.2%) | 59 (13.8%) |
| 35 to 44 Years | 123 (83.7%) | 24 (16.3%) |
| 45 to 54 Years | 261 (80.1%) | 65 (19.9%) |
| 55 to 64 Years | 189 (94.0%) | 12 (6.0%) |
| 65 to 74 Years | 388 (100.0%) | 0 (0.0%) |
| 75 Years and older | 211 (100.0%) | 0 (0.0%) |
| Total | 1,850 (88.9%) | 232 (11.1%) |
Health Insurance Coverage by Citizenship Status in Pine Crest
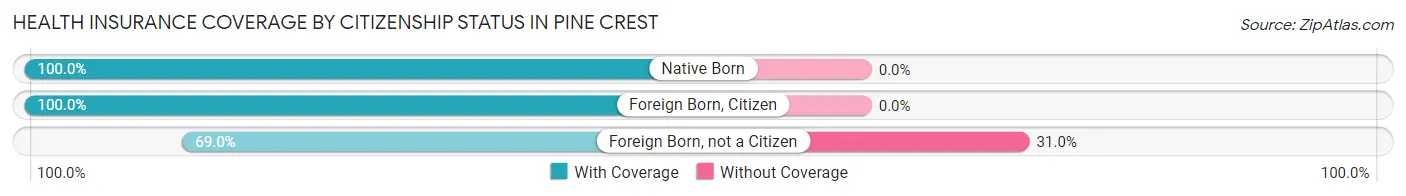
| Citizenship Status | With Coverage | Without Coverage |
| Native Born | 73 (100.0%) | 0 (0.0%) |
| Foreign Born, Citizen | 76 (100.0%) | 0 (0.0%) |
| Foreign Born, not a Citizen | 160 (69.0%) | 72 (31.0%) |
Health Insurance Coverage by Household Income in Pine Crest
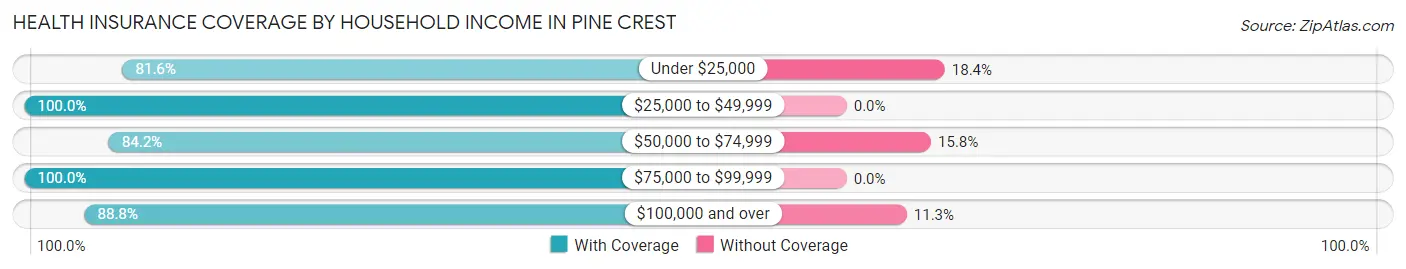
| Household Income | With Coverage | Without Coverage |
| Under $25,000 | 200 (81.6%) | 45 (18.4%) |
| $25,000 to $49,999 | 328 (100.0%) | 0 (0.0%) |
| $50,000 to $74,999 | 613 (84.2%) | 115 (15.8%) |
| $75,000 to $99,999 | 141 (100.0%) | 0 (0.0%) |
| $100,000 and over | 568 (88.7%) | 72 (11.3%) |
Public vs Private Health Insurance Coverage by Age in Pine Crest
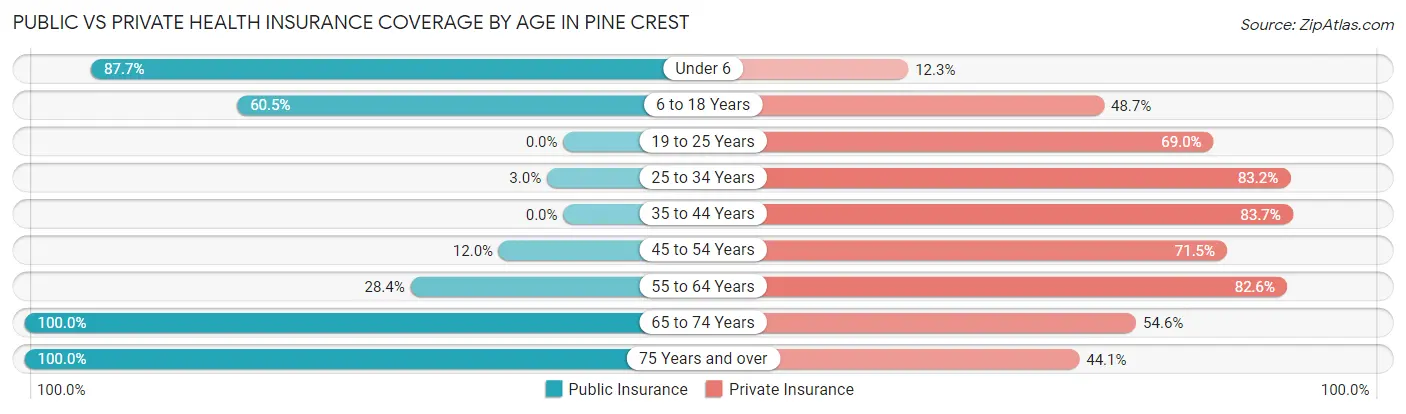
| Age Bracket | Public Insurance | Private Insurance |
| Under 6 | 64 (87.7%) | 9 (12.3%) |
| 6 to 18 Years | 46 (60.5%) | 37 (48.7%) |
| 19 to 25 Years | 0 (0.0%) | 160 (69.0%) |
| 25 to 34 Years | 13 (3.0%) | 356 (83.2%) |
| 35 to 44 Years | 0 (0.0%) | 123 (83.7%) |
| 45 to 54 Years | 39 (12.0%) | 233 (71.5%) |
| 55 to 64 Years | 57 (28.4%) | 166 (82.6%) |
| 65 to 74 Years | 388 (100.0%) | 212 (54.6%) |
| 75 Years and over | 211 (100.0%) | 93 (44.1%) |
| Total | 818 (39.3%) | 1,389 (66.7%) |
Disability Status by Sex by Age in Pine Crest
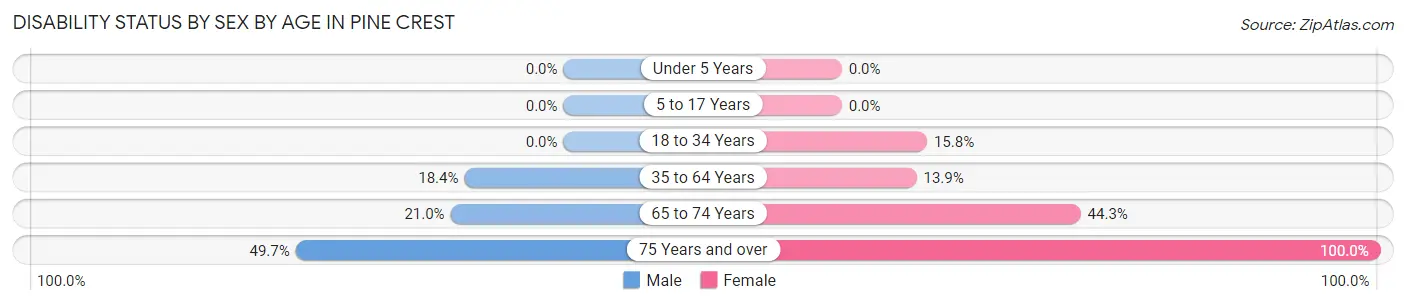
| Age Bracket | Male | Female |
| Under 5 Years | 0 (0.0%) | 0 (0.0%) |
| 5 to 17 Years | 0 (0.0%) | 0 (0.0%) |
| 18 to 34 Years | 0 (0.0%) | 52 (15.8%) |
| 35 to 64 Years | 55 (18.4%) | 52 (13.9%) |
| 65 to 74 Years | 35 (21.0%) | 98 (44.3%) |
| 75 Years and over | 86 (49.7%) | 38 (100.0%) |
Disability Class by Sex by Age in Pine Crest
Disability Class: Hearing Difficulty
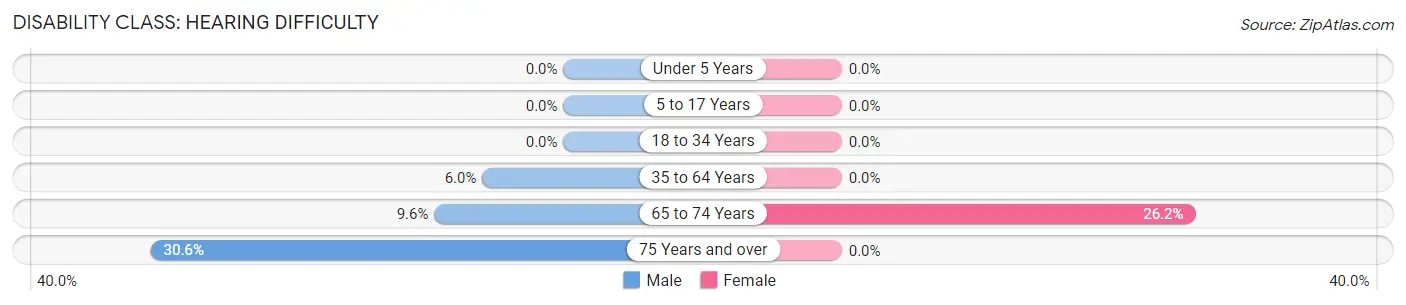
| Age Bracket | Male | Female |
| Under 5 Years | 0 (0.0%) | 0 (0.0%) |
| 5 to 17 Years | 0 (0.0%) | 0 (0.0%) |
| 18 to 34 Years | 0 (0.0%) | 0 (0.0%) |
| 35 to 64 Years | 18 (6.0%) | 0 (0.0%) |
| 65 to 74 Years | 16 (9.6%) | 58 (26.2%) |
| 75 Years and over | 53 (30.6%) | 0 (0.0%) |
Disability Class: Vision Difficulty
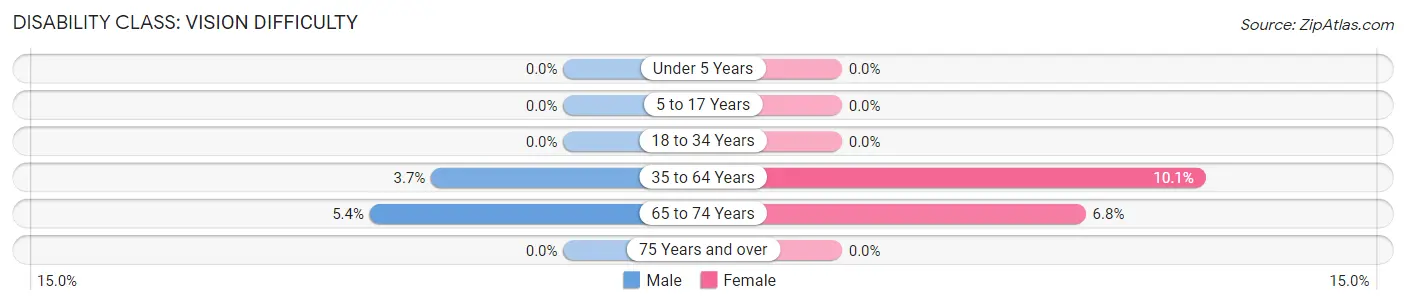
| Age Bracket | Male | Female |
| Under 5 Years | 0 (0.0%) | 0 (0.0%) |
| 5 to 17 Years | 0 (0.0%) | 0 (0.0%) |
| 18 to 34 Years | 0 (0.0%) | 0 (0.0%) |
| 35 to 64 Years | 11 (3.7%) | 38 (10.1%) |
| 65 to 74 Years | 9 (5.4%) | 15 (6.8%) |
| 75 Years and over | 0 (0.0%) | 0 (0.0%) |
Disability Class: Cognitive Difficulty
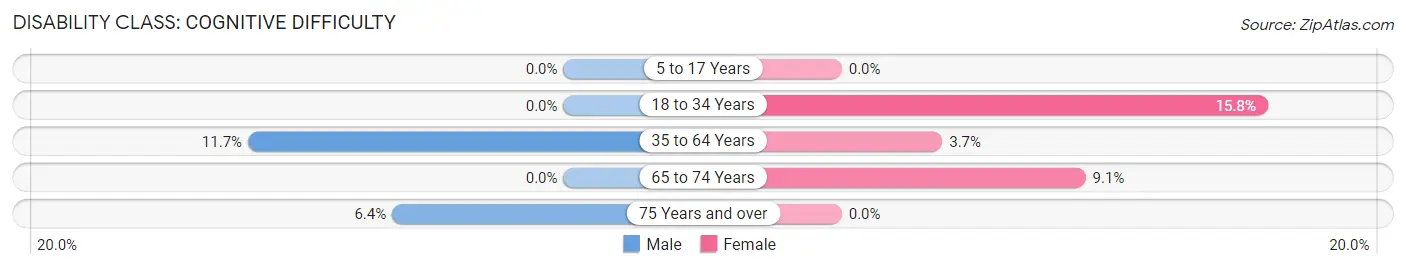
| Age Bracket | Male | Female |
| 5 to 17 Years | 0 (0.0%) | 0 (0.0%) |
| 18 to 34 Years | 0 (0.0%) | 52 (15.8%) |
| 35 to 64 Years | 35 (11.7%) | 14 (3.7%) |
| 65 to 74 Years | 0 (0.0%) | 20 (9.0%) |
| 75 Years and over | 11 (6.4%) | 0 (0.0%) |
Disability Class: Ambulatory Difficulty
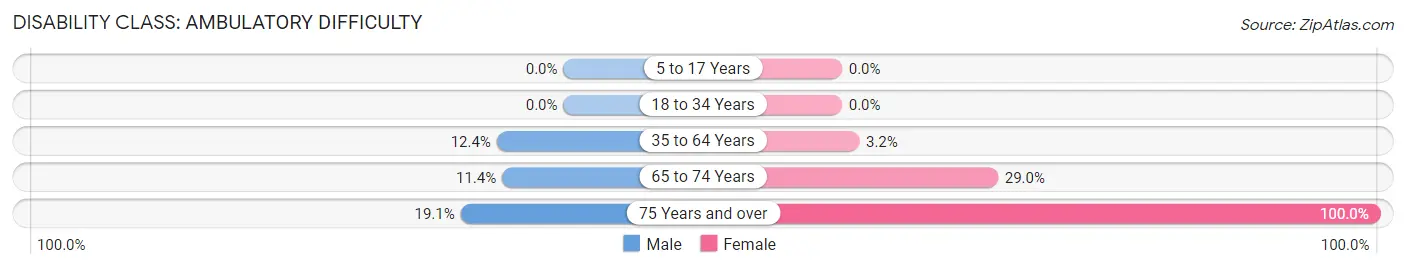
| Age Bracket | Male | Female |
| 5 to 17 Years | 0 (0.0%) | 0 (0.0%) |
| 18 to 34 Years | 0 (0.0%) | 0 (0.0%) |
| 35 to 64 Years | 37 (12.4%) | 12 (3.2%) |
| 65 to 74 Years | 19 (11.4%) | 64 (29.0%) |
| 75 Years and over | 33 (19.1%) | 38 (100.0%) |
Disability Class: Self-Care Difficulty
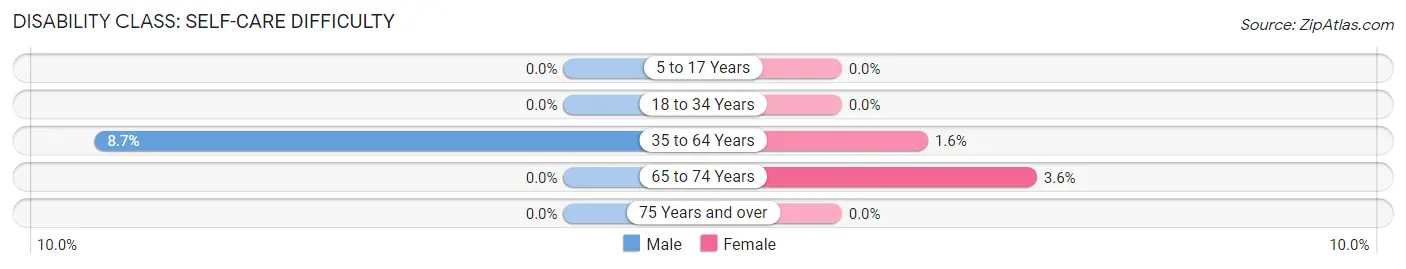
| Age Bracket | Male | Female |
| 5 to 17 Years | 0 (0.0%) | 0 (0.0%) |
| 18 to 34 Years | 0 (0.0%) | 0 (0.0%) |
| 35 to 64 Years | 26 (8.7%) | 6 (1.6%) |
| 65 to 74 Years | 0 (0.0%) | 8 (3.6%) |
| 75 Years and over | 0 (0.0%) | 0 (0.0%) |
Technology Access in Pine Crest
Computing Device Access in Pine Crest
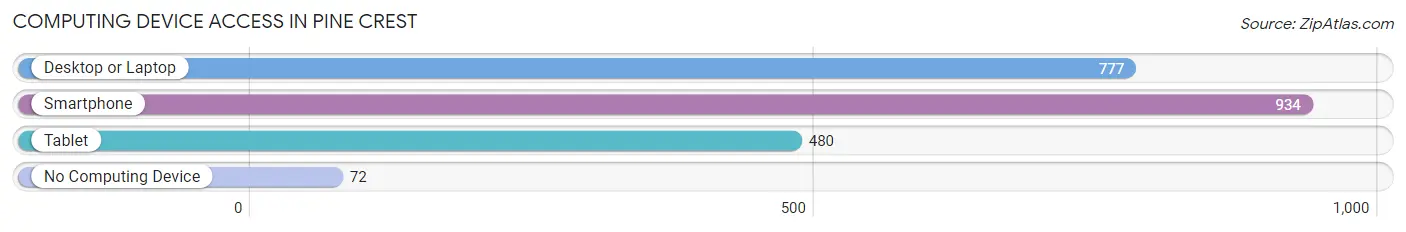
| Device Type | # Households | % Households |
| Desktop or Laptop | 777 | 74.9% |
| Smartphone | 934 | 90.1% |
| Tablet | 480 | 46.3% |
| No Computing Device | 72 | 6.9% |
| Total | 1,037 | 100.0% |
Internet Access in Pine Crest
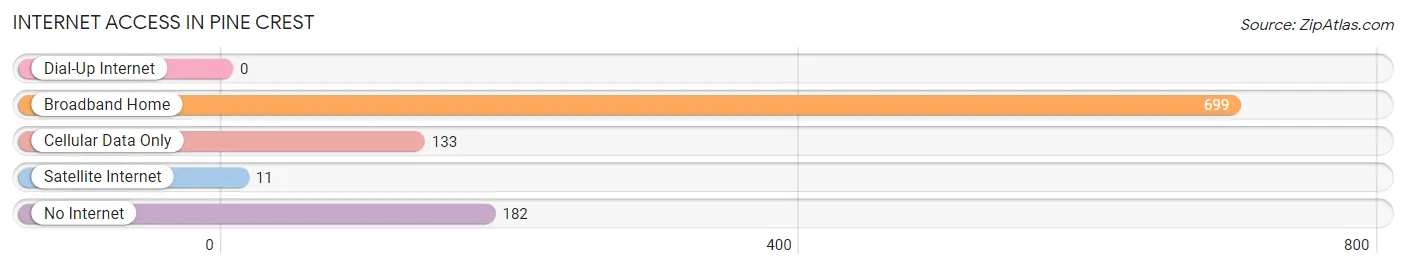
| Internet Type | # Households | % Households |
| Dial-Up Internet | 0 | 0.0% |
| Broadband Home | 699 | 67.4% |
| Cellular Data Only | 133 | 12.8% |
| Satellite Internet | 11 | 1.1% |
| No Internet | 182 | 17.5% |
| Total | 1,037 | 100.0% |
Pine Crest Summary
Pine Crest is a small town located in the foothills of the Appalachian Mountains in Tennessee. It is situated in the eastern part of the state, about 30 miles from the state capital of Nashville. The town has a population of just over 1,000 people and is part of the larger Cumberland County.
History
Pine Crest was founded in 1820 by a group of settlers from North Carolina. The town was originally called “Piney Creek” and was named after the nearby creek. The settlers were attracted to the area due to its abundance of natural resources, including timber and minerals. The town was officially incorporated in 1837 and was renamed Pine Crest.
In the late 19th century, the town experienced a period of growth due to the development of the railroad. This allowed for the transportation of goods and people to and from the town. The railroad also allowed for the development of the coal mining industry in the area, which provided jobs and economic growth.
Geography
Pine Crest is located in the eastern part of Tennessee, in the foothills of the Appalachian Mountains. The town is situated in a valley, surrounded by hills and mountains. The town is located near the Cumberland River, which provides a source of water for the town. The climate in Pine Crest is generally mild, with temperatures ranging from the mid-30s in the winter to the mid-80s in the summer.
Economy
The economy of Pine Crest is largely based on agriculture and tourism. The town is home to several farms, which produce a variety of crops, including corn, soybeans, and hay. The town also has several small businesses, including restaurants, shops, and a few small manufacturing companies.
Tourism is an important part of the economy of Pine Crest. The town is home to several attractions, including the Pine Crest Museum, which showcases the history of the town, and the Pine Crest Golf Course, which is a popular destination for golfers.
Demographics
As of the 2010 census, the population of Pine Crest was 1,072. The town is predominantly white, with a population that is 97.2% white and 1.7% African American. The median household income in Pine Crest is $37,917, and the median age is 43.7 years. The town has a low unemployment rate of 4.2%.
Conclusion
Pine Crest is a small town located in the foothills of the Appalachian Mountains in Tennessee. The town has a population of just over 1,000 people and is part of the larger Cumberland County. The town was founded in 1820 and has a long history of agriculture and tourism. The economy of Pine Crest is largely based on agriculture and tourism, and the town is home to several attractions. The population of Pine Crest is predominantly white, with a median household income of $37,917 and a low unemployment rate of 4.2%.
Common Questions
What is Per Capita Income in Pine Crest?
Per Capita income in Pine Crest is $33,601.
What is the Median Family Income in Pine Crest?
Median Family Income in Pine Crest is $59,079.
What is the Median Household income in Pine Crest?
Median Household Income in Pine Crest is $54,603.
What is Income or Wage Gap in Pine Crest?
Income or Wage Gap in Pine Crest is 4.3%.
Women in Pine Crest earn 95.7 cents for every dollar earned by a man.
What is Inequality or Gini Index in Pine Crest?
Inequality or Gini Index in Pine Crest is 0.37.
What is the Total Population of Pine Crest?
Total Population of Pine Crest is 2,082.
What is the Total Male Population of Pine Crest?
Total Male Population of Pine Crest is 1,019.
What is the Total Female Population of Pine Crest?
Total Female Population of Pine Crest is 1,063.
What is the Ratio of Males per 100 Females in Pine Crest?
There are 95.86 Males per 100 Females in Pine Crest.
What is the Ratio of Females per 100 Males in Pine Crest?
There are 104.32 Females per 100 Males in Pine Crest.
What is the Median Population Age in Pine Crest?
Median Population Age in Pine Crest is 47.6 Years.
What is the Average Family Size in Pine Crest
Average Family Size in Pine Crest is 2.6 People.
What is the Average Household Size in Pine Crest
Average Household Size in Pine Crest is 2.0 People.
How Large is the Labor Force in Pine Crest?
There are 1,158 People in the Labor Forcein in Pine Crest.
What is the Percentage of People in the Labor Force in Pine Crest?
59.7% of People are in the Labor Force in Pine Crest.
What is the Unemployment Rate in Pine Crest?
Unemployment Rate in Pine Crest is 9.3%.