Zip Codes with the Highest Percentage of Population Employed in Food Preparation & Serving in Chattanooga, TN
RELATED REPORTS & OPTIONS
Food Preparation & Serving
Chattanooga
Compare Zip Codes
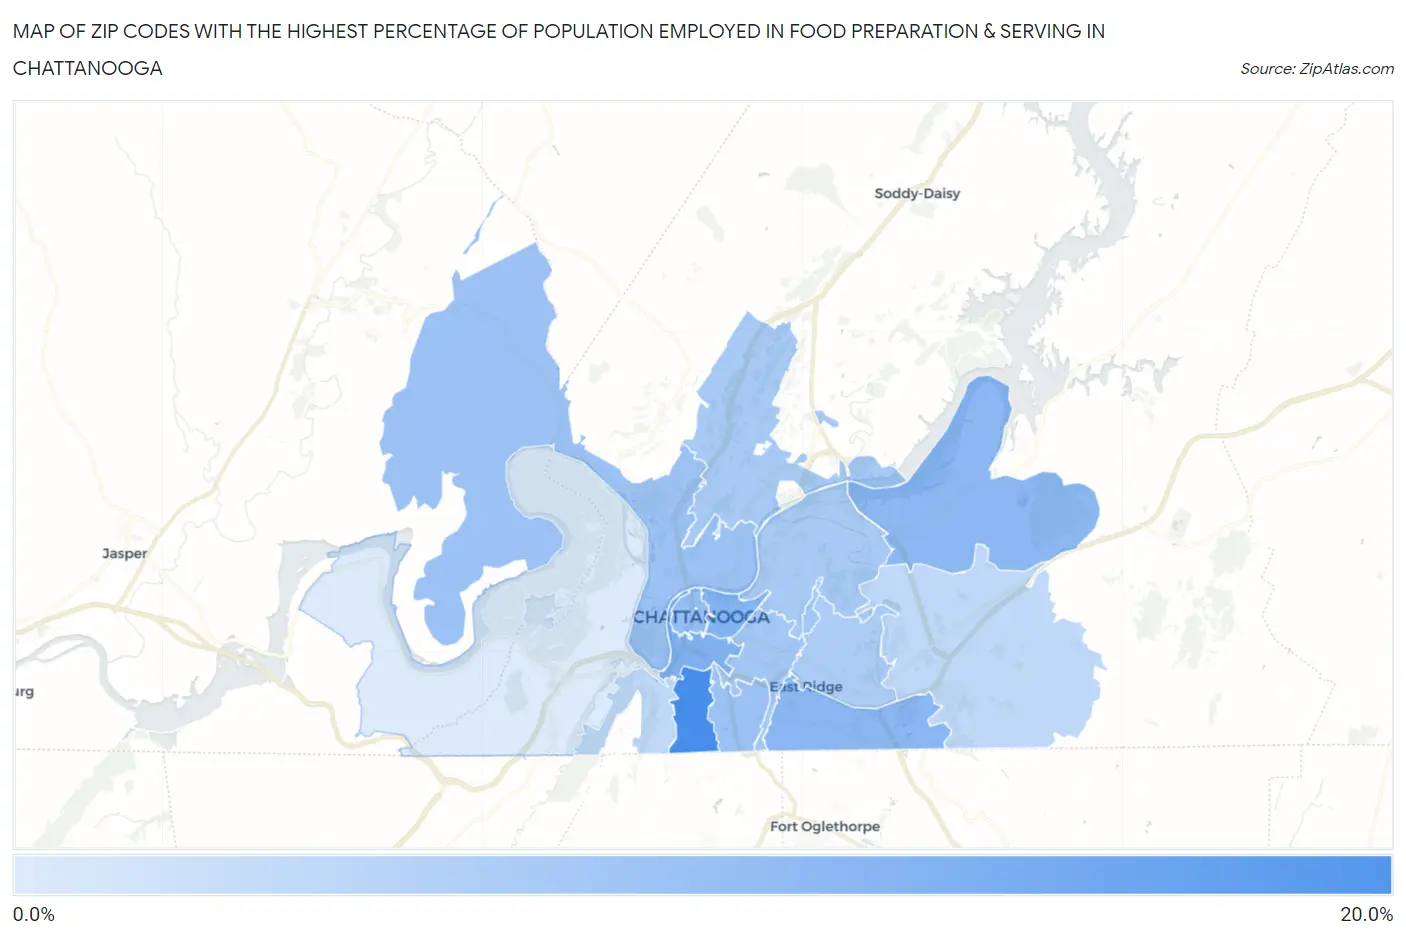
Map of Zip Codes with the Highest Percentage of Population Employed in Food Preparation & Serving in Chattanooga
1.1%
16.4%
Zip Codes with the Highest Percentage of Population Employed in Food Preparation & Serving in Chattanooga, TN
| Zip Code | % Employed | vs State | vs National | |
| 1. | 37410 | 16.4% | 5.4%(+11.0)#12 | 5.3%(+11.1)#809 |
| 2. | 37408 | 10.2% | 5.4%(+4.75)#44 | 5.3%(+4.88)#2,502 |
| 3. | 37403 | 9.9% | 5.4%(+4.52)#45 | 5.3%(+4.66)#2,675 |
| 4. | 37412 | 9.3% | 5.4%(+3.87)#57 | 5.3%(+4.00)#3,246 |
| 5. | 37416 | 9.1% | 5.4%(+3.68)#60 | 5.3%(+3.82)#3,413 |
| 6. | 37402 | 8.2% | 5.4%(+2.80)#91 | 5.3%(+2.93)#4,410 |
| 7. | 37407 | 7.8% | 5.4%(+2.35)#111 | 5.3%(+2.48)#5,106 |
| 8. | 37405 | 7.4% | 5.4%(+1.96)#128 | 5.3%(+2.09)#5,787 |
| 9. | 37404 | 6.7% | 5.4%(+1.31)#155 | 5.3%(+1.44)#7,260 |
| 10. | 37406 | 6.3% | 5.4%(+0.893)#173 | 5.3%(+1.03)#8,401 |
| 11. | 37415 | 6.2% | 5.4%(+0.792)#179 | 5.3%(+0.925)#8,699 |
| 12. | 37411 | 5.8% | 5.4%(+0.331)#206 | 5.3%(+0.464)#10,178 |
| 13. | 37409 | 4.1% | 5.4%(-1.36)#340 | 5.3%(-1.23)#16,913 |
| 14. | 37421 | 4.0% | 5.4%(-1.43)#347 | 5.3%(-1.30)#17,186 |
| 15. | 37419 | 1.1% | 5.4%(-4.27)#535 | 5.3%(-4.14)#26,715 |
1
Common Questions
What are the Top 10 Zip Codes with the Highest Percentage of Population Employed in Food Preparation & Serving in Chattanooga, TN?
Top 10 Zip Codes with the Highest Percentage of Population Employed in Food Preparation & Serving in Chattanooga, TN are:
What zip code has the Highest Percentage of Population Employed in Food Preparation & Serving in Chattanooga, TN?
37410 has the Highest Percentage of Population Employed in Food Preparation & Serving in Chattanooga, TN with 16.4%.
What is the Percentage of Population Employed in Food Preparation & Serving in Chattanooga, TN?
Percentage of Population Employed in Food Preparation & Serving in Chattanooga is 7.1%.
What is the Percentage of Population Employed in Food Preparation & Serving in Tennessee?
Percentage of Population Employed in Food Preparation & Serving in Tennessee is 5.4%.
What is the Percentage of Population Employed in Food Preparation & Serving in the United States?
Percentage of Population Employed in Food Preparation & Serving in the United States is 5.3%.