Graball, TN Map & Demographics
Graball Map
Graball Overview
$34,244
PER CAPITA INCOME
$117,639
AVG FAMILY INCOME
$117,639
AVG HOUSEHOLD INCOME
2.8%
WAGE / INCOME GAP [ % ]
97.2¢/ $1
WAGE / INCOME GAP [ $ ]
0.16
INEQUALITY / GINI INDEX
142
TOTAL POPULATION
69
MALE POPULATION
73
FEMALE POPULATION
94.52
MALES / 100 FEMALES
105.80
FEMALES / 100 MALES
44.1
MEDIAN AGE
3.3
AVG FAMILY SIZE
3.3
AVG HOUSEHOLD SIZE
85
LABOR FORCE [ PEOPLE ]
67.5%
PERCENT IN LABOR FORCE
16.5%
UNEMPLOYMENT RATE
Income in Graball
Income Overview in Graball
Per Capita Income in Graball is $34,244, while median incomes of families and households are $117,639 and $117,639 respectively.
| Characteristic | Number | Measure |
| Per Capita Income | 142 | $34,244 |
| Median Family Income | 43 | $117,639 |
| Mean Family Income | 43 | $103,435 |
| Median Household Income | 43 | $117,639 |
| Mean Household Income | 43 | $103,435 |
| Income Deficit | 43 | $0 |
| Wage / Income Gap (%) | 142 | 2.79% |
| Wage / Income Gap ($) | 142 | 97.21¢ per $1 |
| Gini / Inequality Index | 142 | 0.16 |
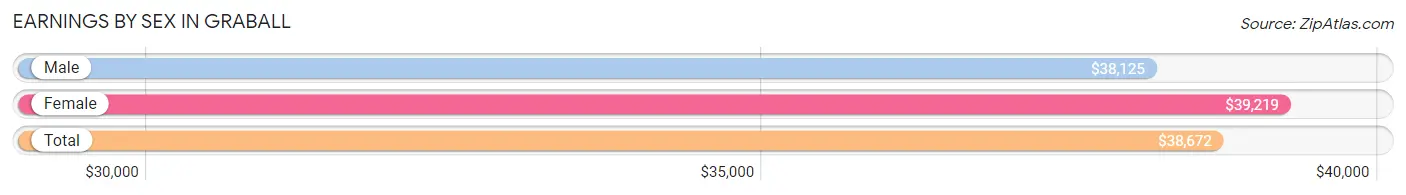
Earnings by Sex in Graball
Average Earnings in Graball are $38,672, $38,125 for men and $39,219 for women, a difference of 2.8%.
| Sex | Number | Average Earnings |
| Male | 50 (53.8%) | $38,125 |
| Female | 43 (46.2%) | $39,219 |
| Total | 93 (100.0%) | $38,672 |
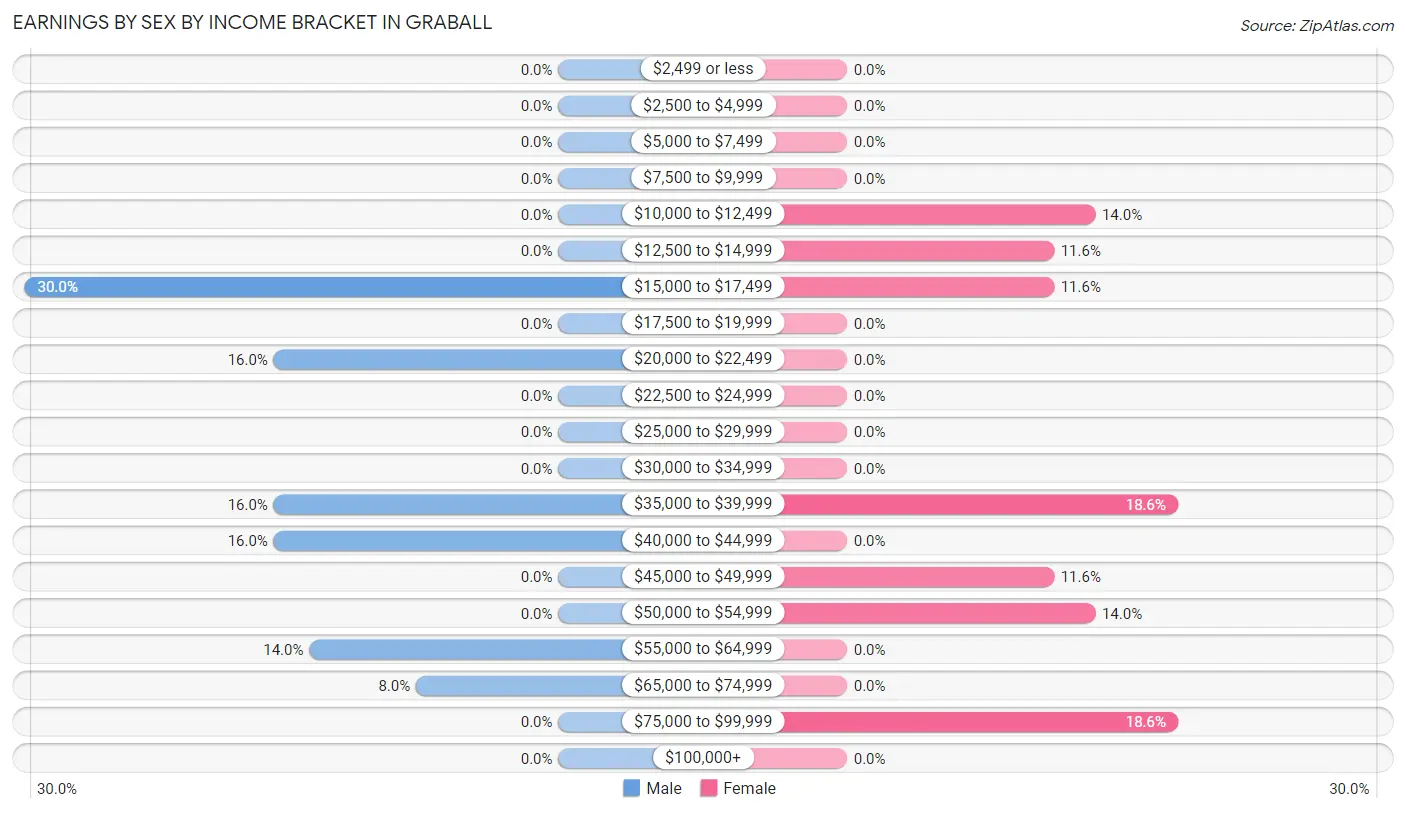
Earnings by Sex by Income Bracket in Graball
The most common earnings brackets in Graball are $15,000 to $17,499 for men (15 | 30.0%) and $35,000 to $39,999 for women (8 | 18.6%).
| Income | Male | Female |
| $2,499 or less | 0 (0.0%) | 0 (0.0%) |
| $2,500 to $4,999 | 0 (0.0%) | 0 (0.0%) |
| $5,000 to $7,499 | 0 (0.0%) | 0 (0.0%) |
| $7,500 to $9,999 | 0 (0.0%) | 0 (0.0%) |
| $10,000 to $12,499 | 0 (0.0%) | 6 (14.0%) |
| $12,500 to $14,999 | 0 (0.0%) | 5 (11.6%) |
| $15,000 to $17,499 | 15 (30.0%) | 5 (11.6%) |
| $17,500 to $19,999 | 0 (0.0%) | 0 (0.0%) |
| $20,000 to $22,499 | 8 (16.0%) | 0 (0.0%) |
| $22,500 to $24,999 | 0 (0.0%) | 0 (0.0%) |
| $25,000 to $29,999 | 0 (0.0%) | 0 (0.0%) |
| $30,000 to $34,999 | 0 (0.0%) | 0 (0.0%) |
| $35,000 to $39,999 | 8 (16.0%) | 8 (18.6%) |
| $40,000 to $44,999 | 8 (16.0%) | 0 (0.0%) |
| $45,000 to $49,999 | 0 (0.0%) | 5 (11.6%) |
| $50,000 to $54,999 | 0 (0.0%) | 6 (14.0%) |
| $55,000 to $64,999 | 7 (14.0%) | 0 (0.0%) |
| $65,000 to $74,999 | 4 (8.0%) | 0 (0.0%) |
| $75,000 to $99,999 | 0 (0.0%) | 8 (18.6%) |
| $100,000+ | 0 (0.0%) | 0 (0.0%) |
| Total | 50 (100.0%) | 43 (100.0%) |
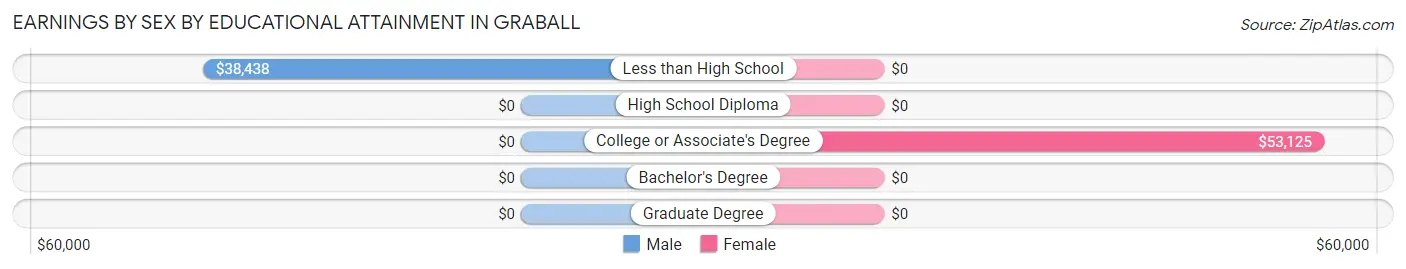
Earnings by Sex by Educational Attainment in Graball
Average earnings in Graball are $43,281 for men and $46,250 for women, a difference of 6.4%. Men with an educational attainment of less than high school enjoy the highest average annual earnings of $38,438, while those with less than high school education earn the least with $38,438. Women with an educational attainment of college or associate's degree earn the most with the average annual earnings of $53,125, while those with college or associate's degree education have the smallest earnings of $53,125.
| Educational Attainment | Male Income | Female Income |
| Less than High School | $38,438 | $0 |
| High School Diploma | - | - |
| College or Associate's Degree | - | - |
| Bachelor's Degree | - | - |
| Graduate Degree | - | - |
| Total | $43,281 | $46,250 |
Family Income in Graball
Family Income Brackets in Graball
According to the Graball family income data, there are 22 families falling into the $100,000 to $149,999 income range, which is the most common income bracket and makes up 51.2% of all families.
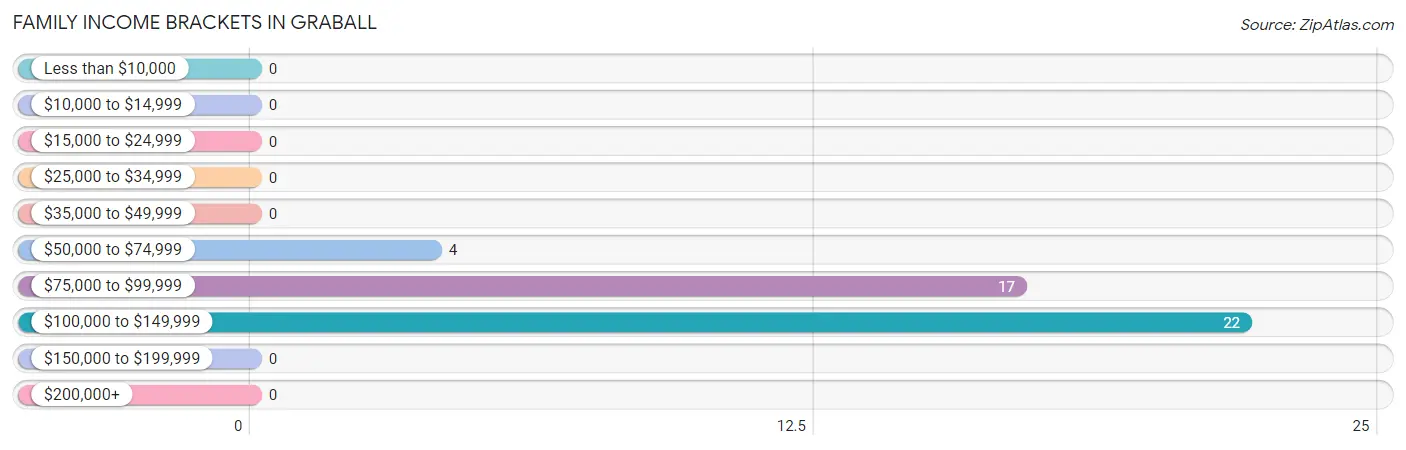
| Income Bracket | # Families | % Families |
| Less than $10,000 | 0 | 0.0% |
| $10,000 to $14,999 | 0 | 0.0% |
| $15,000 to $24,999 | 0 | 0.0% |
| $25,000 to $34,999 | 0 | 0.0% |
| $35,000 to $49,999 | 0 | 0.0% |
| $50,000 to $74,999 | 4 | 9.3% |
| $75,000 to $99,999 | 17 | 39.5% |
| $100,000 to $149,999 | 22 | 51.2% |
| $150,000 to $199,999 | 0 | 0.0% |
| $200,000+ | 0 | 0.0% |
Family Income by Famaliy Size in Graball
3-person families (17 | 39.5%) account for the highest median family income in Graball with $129,375 per family, while 3-person families (17 | 39.5%) have the highest median income of $43,125 per family member.
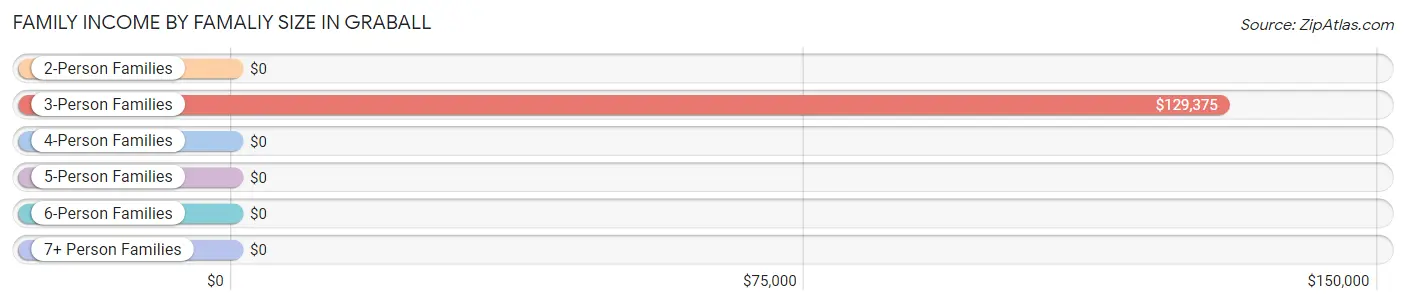
| Income Bracket | # Families | Median Income |
| 2-Person Families | 17 (39.5%) | $0 |
| 3-Person Families | 17 (39.5%) | $129,375 |
| 4-Person Families | 4 (9.3%) | $0 |
| 5-Person Families | 5 (11.6%) | $0 |
| 6-Person Families | 0 (0.0%) | $0 |
| 7+ Person Families | 0 (0.0%) | $0 |
| Total | 43 (100.0%) | $117,639 |
Family Income by Number of Earners in Graball
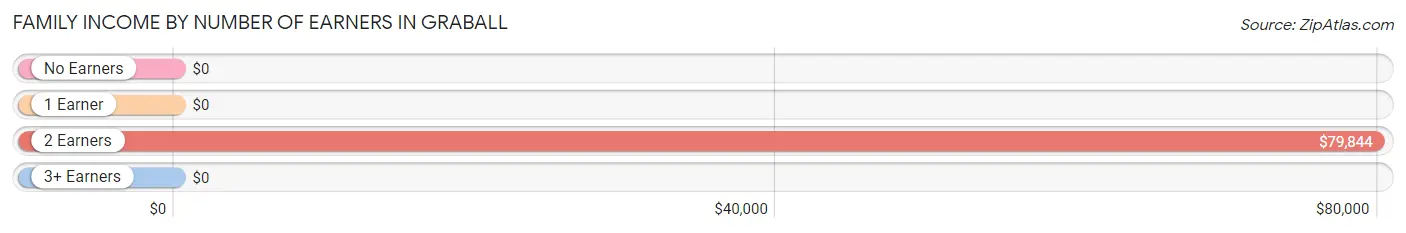
| Number of Earners | # Families | Median Income |
| No Earners | 9 (20.9%) | $0 |
| 1 Earner | 0 (0.0%) | $0 |
| 2 Earners | 23 (53.5%) | $79,844 |
| 3+ Earners | 11 (25.6%) | $0 |
| Total | 43 (100.0%) | $117,639 |
Household Income in Graball
Household Income Brackets in Graball
With 22 households falling in the category, the $100,000 to $149,999 income range is the most frequent in Graball, accounting for 51.2% of all households.
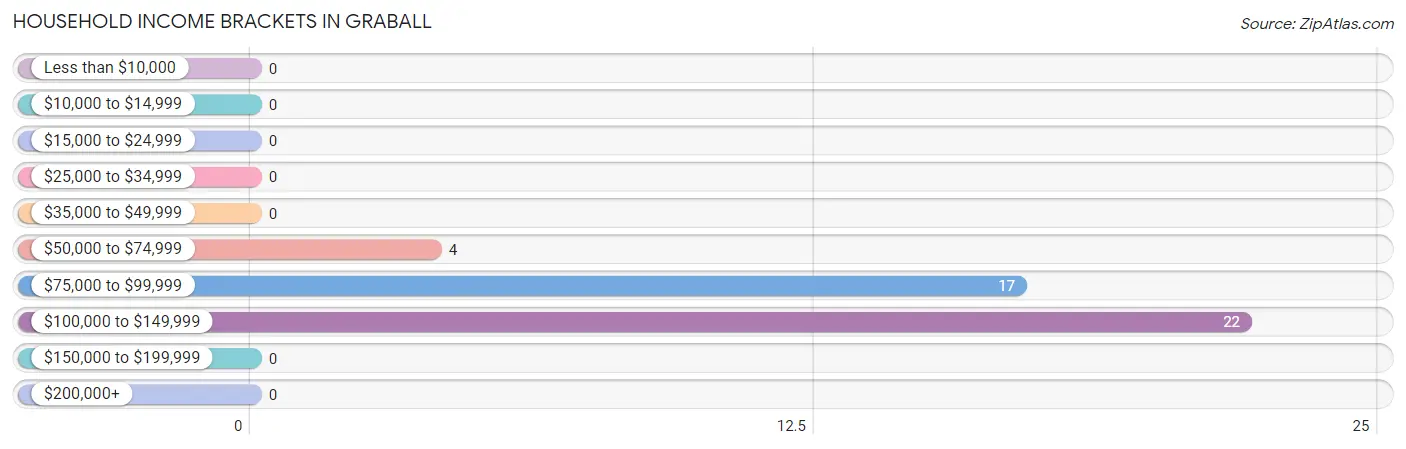
| Income Bracket | # Households | % Households |
| Less than $10,000 | 0 | 0.0% |
| $10,000 to $14,999 | 0 | 0.0% |
| $15,000 to $24,999 | 0 | 0.0% |
| $25,000 to $34,999 | 0 | 0.0% |
| $35,000 to $49,999 | 0 | 0.0% |
| $50,000 to $74,999 | 4 | 9.3% |
| $75,000 to $99,999 | 17 | 39.5% |
| $100,000 to $149,999 | 22 | 51.2% |
| $150,000 to $199,999 | 0 | 0.0% |
| $200,000+ | 0 | 0.0% |
Household Income by Householder Age in Graball
The median household income in Graball is $117,639, with the highest median household income of $118,472 found in the 65+ years age bracket for the primary householder. A total of 23 households (53.5%) fall into this category.
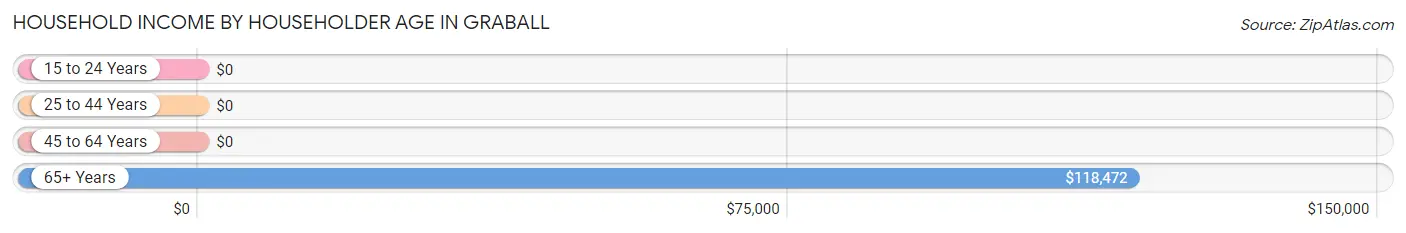
| Income Bracket | # Households | Median Income |
| 15 to 24 Years | 0 (0.0%) | $0 |
| 25 to 44 Years | 13 (30.2%) | $0 |
| 45 to 64 Years | 7 (16.3%) | $0 |
| 65+ Years | 23 (53.5%) | $118,472 |
| Total | 43 (100.0%) | $117,639 |
Poverty in Graball
Income Below Poverty by Sex and Age in Graball
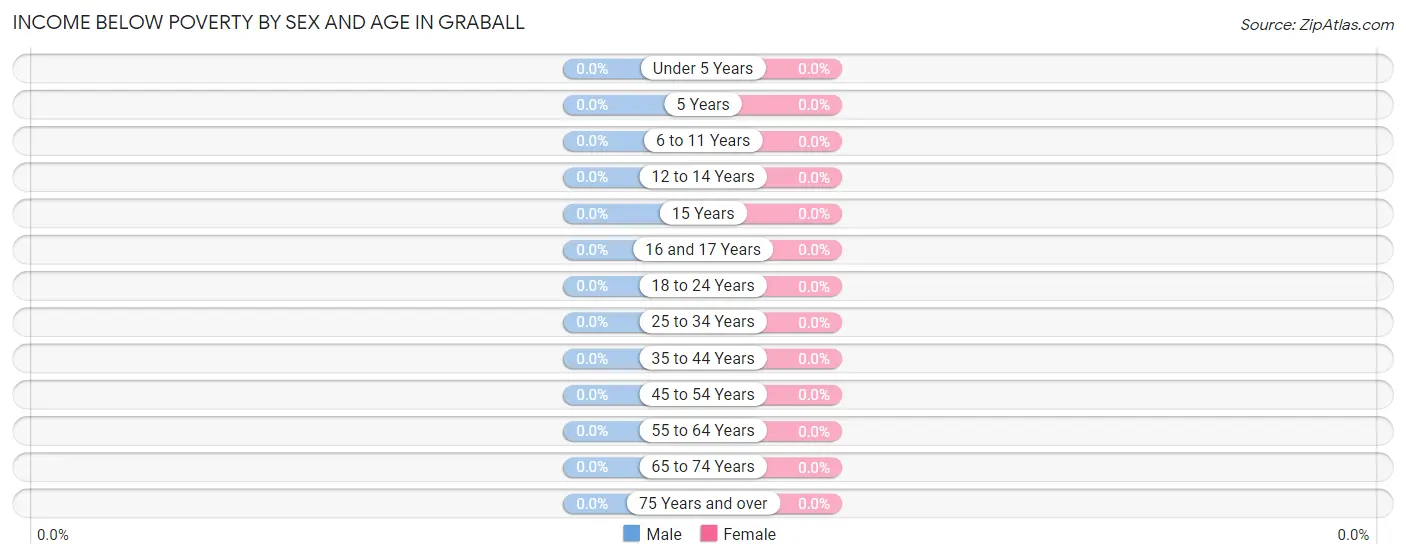
| Age Bracket | Male | Female |
| Under 5 Years | 0 (0.0%) | 0 (0.0%) |
| 5 Years | 0 (0.0%) | 0 (0.0%) |
| 6 to 11 Years | 0 (0.0%) | 0 (0.0%) |
| 12 to 14 Years | 0 (0.0%) | 0 (0.0%) |
| 15 Years | 0 (0.0%) | 0 (0.0%) |
| 16 and 17 Years | 0 (0.0%) | 0 (0.0%) |
| 18 to 24 Years | 0 (0.0%) | 0 (0.0%) |
| 25 to 34 Years | 0 (0.0%) | 0 (0.0%) |
| 35 to 44 Years | 0 (0.0%) | 0 (0.0%) |
| 45 to 54 Years | 0 (0.0%) | 0 (0.0%) |
| 55 to 64 Years | 0 (0.0%) | 0 (0.0%) |
| 65 to 74 Years | 0 (0.0%) | 0 (0.0%) |
| 75 Years and over | 0 (0.0%) | 0 (0.0%) |
| Total | 0 (0.0%) | 0 (0.0%) |
Income Above Poverty by Sex and Age in Graball
According to the poverty statistics in Graball, males aged 5 years and females aged under 5 years are the age groups that are most secure financially, with 100.0% of males and 100.0% of females in these age groups living above the poverty line.
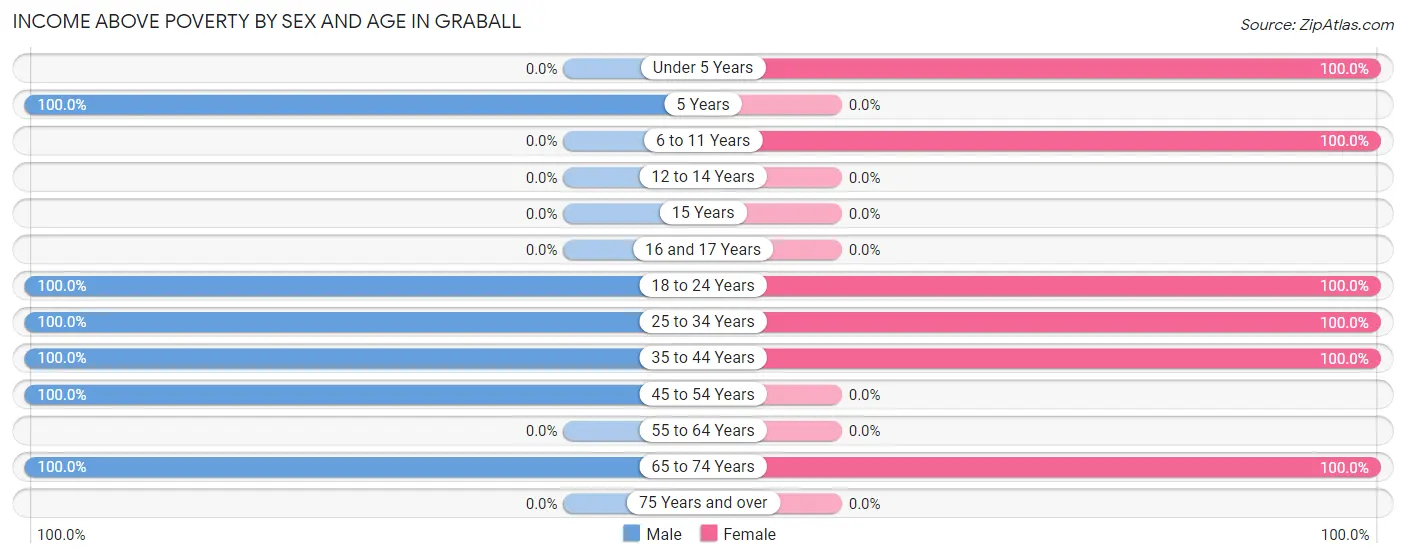
| Age Bracket | Male | Female |
| Under 5 Years | 0 (0.0%) | 5 (100.0%) |
| 5 Years | 4 (100.0%) | 0 (0.0%) |
| 6 to 11 Years | 0 (0.0%) | 7 (100.0%) |
| 12 to 14 Years | 0 (0.0%) | 0 (0.0%) |
| 15 Years | 0 (0.0%) | 0 (0.0%) |
| 16 and 17 Years | 0 (0.0%) | 0 (0.0%) |
| 18 to 24 Years | 17 (100.0%) | 10 (100.0%) |
| 25 to 34 Years | 6 (100.0%) | 6 (100.0%) |
| 35 to 44 Years | 16 (100.0%) | 21 (100.0%) |
| 45 to 54 Years | 12 (100.0%) | 0 (0.0%) |
| 55 to 64 Years | 0 (0.0%) | 0 (0.0%) |
| 65 to 74 Years | 14 (100.0%) | 24 (100.0%) |
| 75 Years and over | 0 (0.0%) | 0 (0.0%) |
| Total | 69 (100.0%) | 73 (100.0%) |
Income Below Poverty Among Married-Couple Families in Graball
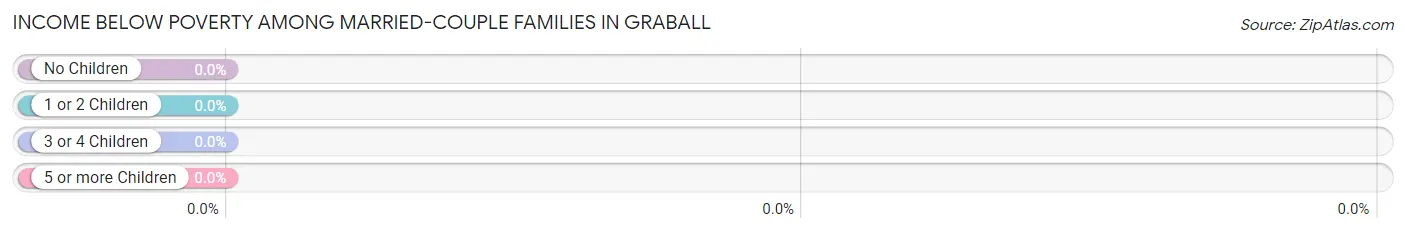
| Children | Above Poverty | Below Poverty |
| No Children | 21 (100.0%) | 0 (0.0%) |
| 1 or 2 Children | 12 (100.0%) | 0 (0.0%) |
| 3 or 4 Children | 0 (0.0%) | 0 (0.0%) |
| 5 or more Children | 0 (0.0%) | 0 (0.0%) |
| Total | 33 (100.0%) | 0 (0.0%) |
Income Below Poverty Among Single-Parent Households in Graball
| Children | Single Father | Single Mother |
| No Children | 0 (0.0%) | 0 (0.0%) |
| 1 or 2 Children | 0 (0.0%) | 0 (0.0%) |
| 3 or 4 Children | 0 (0.0%) | 0 (0.0%) |
| 5 or more Children | 0 (0.0%) | 0 (0.0%) |
| Total | 0 (0.0%) | 0 (0.0%) |
Income Below Poverty Among Married-Couple vs Single-Parent Households in Graball
| Children | Married-Couple Families | Single-Parent Households |
| No Children | 0 (0.0%) | 0 (0.0%) |
| 1 or 2 Children | 0 (0.0%) | 0 (0.0%) |
| 3 or 4 Children | 0 (0.0%) | 0 (0.0%) |
| 5 or more Children | 0 (0.0%) | 0 (0.0%) |
| Total | 0 (0.0%) | 0 (0.0%) |
Race in Graball
The most populous races in Graball are , and White / Caucasian (142 | 100.0%).
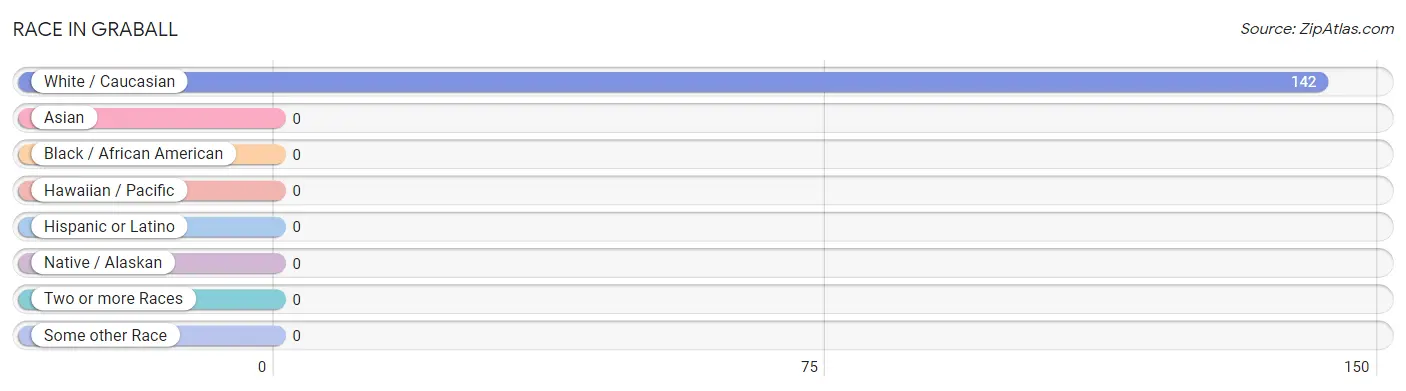
| Race | # Population | % Population |
| Asian | 0 | 0.0% |
| Black / African American | 0 | 0.0% |
| Hawaiian / Pacific | 0 | 0.0% |
| Hispanic or Latino | 0 | 0.0% |
| Native / Alaskan | 0 | 0.0% |
| White / Caucasian | 142 | 100.0% |
| Two or more Races | 0 | 0.0% |
| Some other Race | 0 | 0.0% |
| Total | 142 | 100.0% |
Ancestry in Graball
The most populous ancestries reported in Graball are American (29 | 20.4%), Italian (26 | 18.3%), European (23 | 16.2%), Russian (13 | 9.1%), and Scotch-Irish (10 | 7.0%), together accounting for 71.1% of all Graball residents.
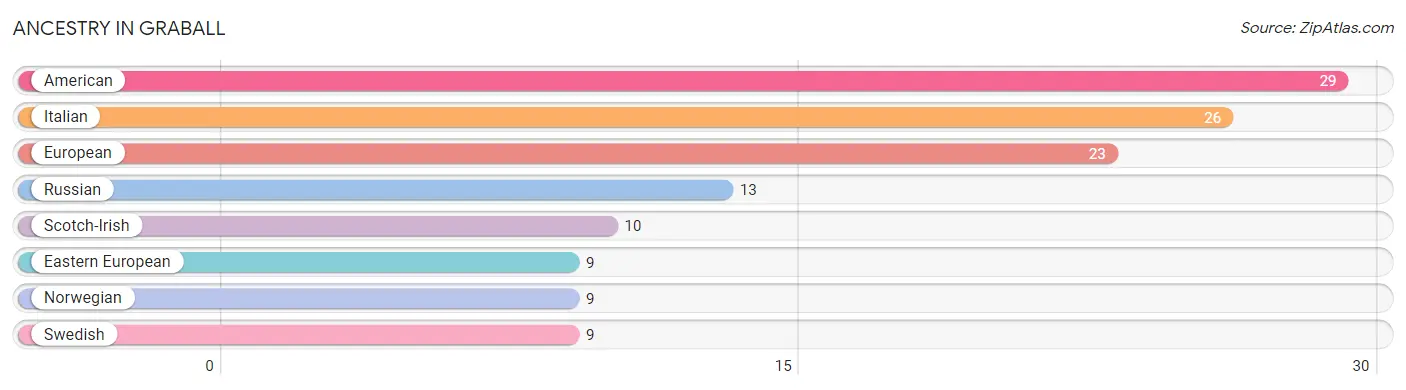
| Ancestry | # Population | % Population |
| American | 29 | 20.4% |
| Eastern European | 9 | 6.3% |
| European | 23 | 16.2% |
| Italian | 26 | 18.3% |
| Norwegian | 9 | 6.3% |
| Russian | 13 | 9.1% |
| Scotch-Irish | 10 | 7.0% |
| Swedish | 9 | 6.3% | View All 8 Rows |
Immigrants in Graball

| Immigration Origin | # Population | % Population | View All 0 Rows |
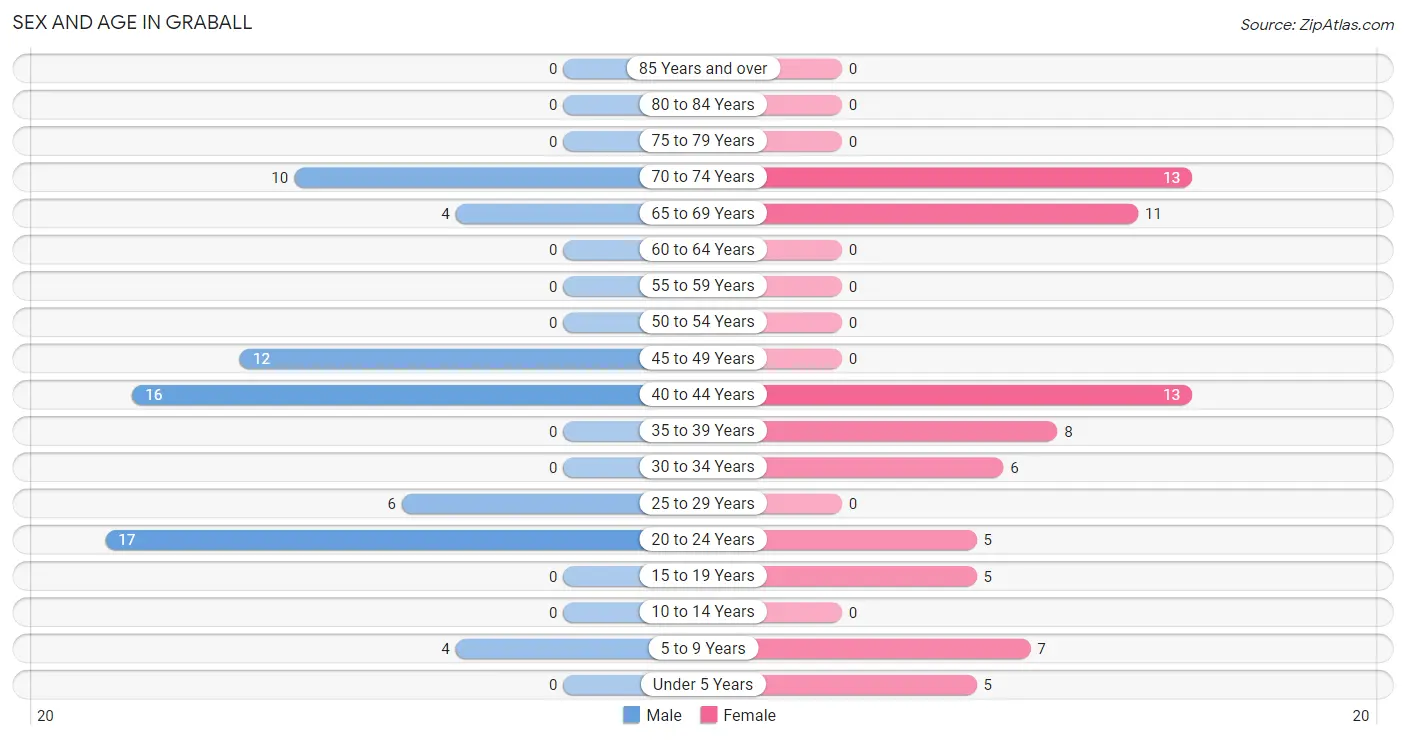
Sex and Age in Graball
Sex and Age in Graball
The most populous age groups in Graball are 20 to 24 Years (17 | 24.6%) for men and 40 to 44 Years (13 | 17.8%) for women.
| Age Bracket | Male | Female |
| Under 5 Years | 0 (0.0%) | 5 (6.9%) |
| 5 to 9 Years | 4 (5.8%) | 7 (9.6%) |
| 10 to 14 Years | 0 (0.0%) | 0 (0.0%) |
| 15 to 19 Years | 0 (0.0%) | 5 (6.9%) |
| 20 to 24 Years | 17 (24.6%) | 5 (6.9%) |
| 25 to 29 Years | 6 (8.7%) | 0 (0.0%) |
| 30 to 34 Years | 0 (0.0%) | 6 (8.2%) |
| 35 to 39 Years | 0 (0.0%) | 8 (11.0%) |
| 40 to 44 Years | 16 (23.2%) | 13 (17.8%) |
| 45 to 49 Years | 12 (17.4%) | 0 (0.0%) |
| 50 to 54 Years | 0 (0.0%) | 0 (0.0%) |
| 55 to 59 Years | 0 (0.0%) | 0 (0.0%) |
| 60 to 64 Years | 0 (0.0%) | 0 (0.0%) |
| 65 to 69 Years | 4 (5.8%) | 11 (15.1%) |
| 70 to 74 Years | 10 (14.5%) | 13 (17.8%) |
| 75 to 79 Years | 0 (0.0%) | 0 (0.0%) |
| 80 to 84 Years | 0 (0.0%) | 0 (0.0%) |
| 85 Years and over | 0 (0.0%) | 0 (0.0%) |
| Total | 69 (100.0%) | 73 (100.0%) |
Families and Households in Graball
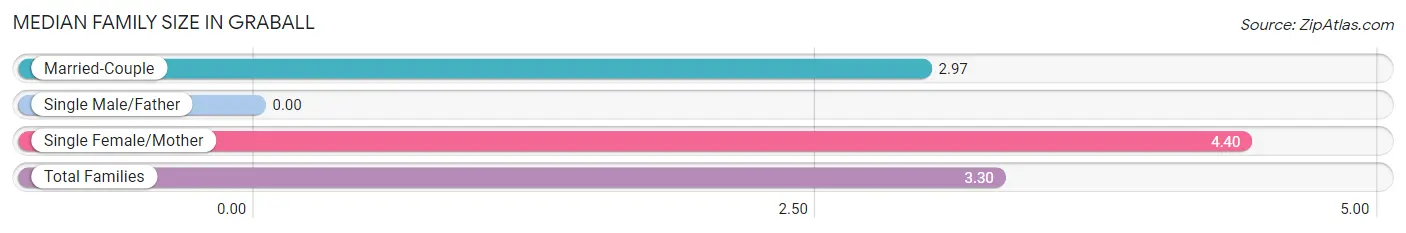
Median Family Size in Graball
| Family Type | # Families | Family Size |
| Married-Couple | 33 (76.7%) | 2.97 |
| Single Male/Father | 0 (0.0%) | - |
| Single Female/Mother | 10 (23.3%) | 4.40 |
| Total Families | 43 (100.0%) | 3.30 |
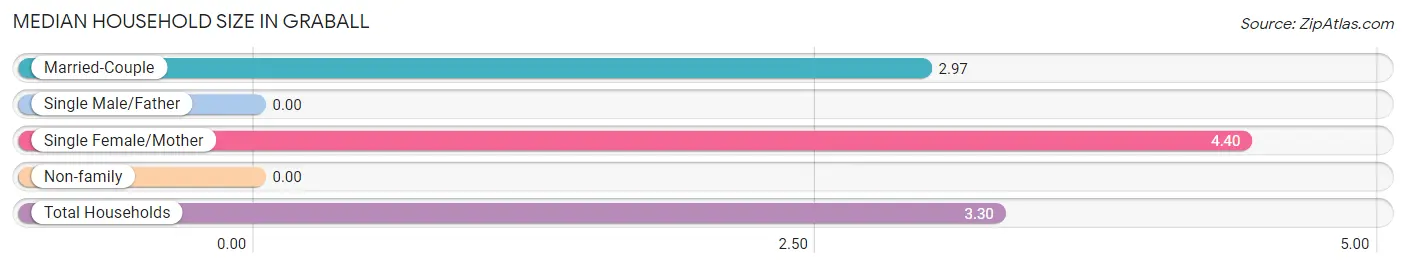
Median Household Size in Graball
| Household Type | # Households | Household Size |
| Married-Couple | 33 (76.7%) | 2.97 |
| Single Male/Father | 0 (0.0%) | - |
| Single Female/Mother | 10 (23.3%) | 4.40 |
| Non-family | 0 (0.0%) | - |
| Total Households | 43 (100.0%) | 3.30 |
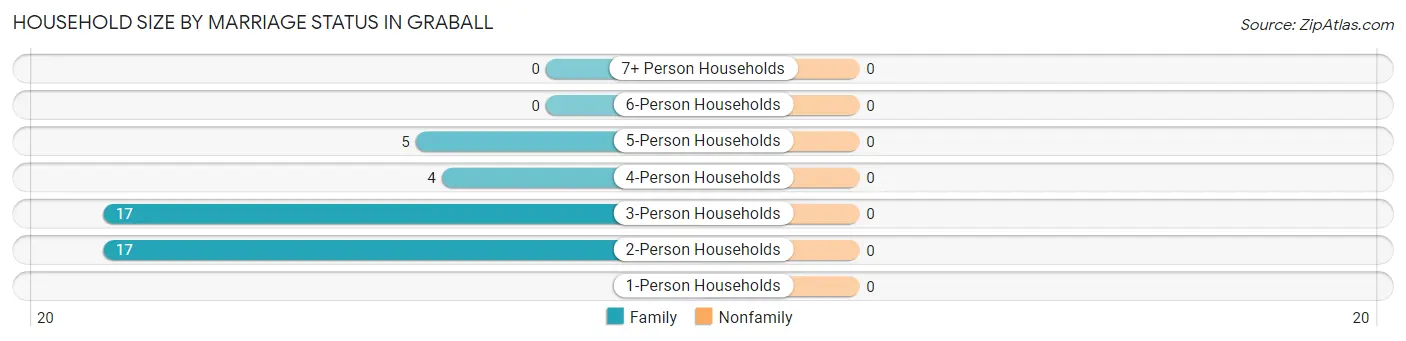
Household Size by Marriage Status in Graball
| Household Size | Family Households | Nonfamily Households |
| 1-Person Households | - | 0 (0.0%) |
| 2-Person Households | 17 (39.5%) | 0 (0.0%) |
| 3-Person Households | 17 (39.5%) | 0 (0.0%) |
| 4-Person Households | 4 (9.3%) | 0 (0.0%) |
| 5-Person Households | 5 (11.6%) | 0 (0.0%) |
| 6-Person Households | 0 (0.0%) | 0 (0.0%) |
| 7+ Person Households | 0 (0.0%) | 0 (0.0%) |
| Total | 43 (100.0%) | 0 (0.0%) |
Female Fertility in Graball
Fertility by Age in Graball
| Age Bracket | Women with Births | Births / 1,000 Women |
| 15 to 19 years | 0 (0.0%) | 0.0 |
| 20 to 34 years | 0 (0.0%) | 0.0 |
| 35 to 50 years | 0 (0.0%) | 0.0 |
| Total | 0 (0.0%) | 0.0 |
Fertility by Age by Marriage Status in Graball
| Age Bracket | Married | Unmarried |
| 15 to 19 years | 0 (0.0%) | 0 (0.0%) |
| 20 to 34 years | 0 (0.0%) | 0 (0.0%) |
| 35 to 50 years | 0 (0.0%) | 0 (0.0%) |
| Total | 0 (0.0%) | 0 (0.0%) |
Fertility by Education in Graball
| Educational Attainment | Women with Births | Births / 1,000 Women |
| Less than High School | 0 (0.0%) | 0.0 |
| High School Diploma | 0 (0.0%) | 0.0 |
| College or Associate's Degree | 0 (0.0%) | 0.0 |
| Bachelor's Degree | 0 (0.0%) | 0.0 |
| Graduate Degree | 0 (0.0%) | 0.0 |
| Total | 0 (0.0%) | 0.0 |
Fertility by Education by Marriage Status in Graball
| Educational Attainment | Married | Unmarried |
| Less than High School | 0 (0.0%) | 0 (0.0%) |
| High School Diploma | 0 (0.0%) | 0 (0.0%) |
| College or Associate's Degree | 0 (0.0%) | 0 (0.0%) |
| Bachelor's Degree | 0 (0.0%) | 0 (0.0%) |
| Graduate Degree | 0 (0.0%) | 0 (0.0%) |
| Total | 0 (0.0%) | 0 (0.0%) |
Employment Characteristics in Graball
Employment by Class of Employer in Graball
Among the 71 employed individuals in Graball, private company employees (37 | 52.1%), self-employed (not incorporated) (23 | 32.4%), and local government employees (6 | 8.5%) make up the most common classes of employment.
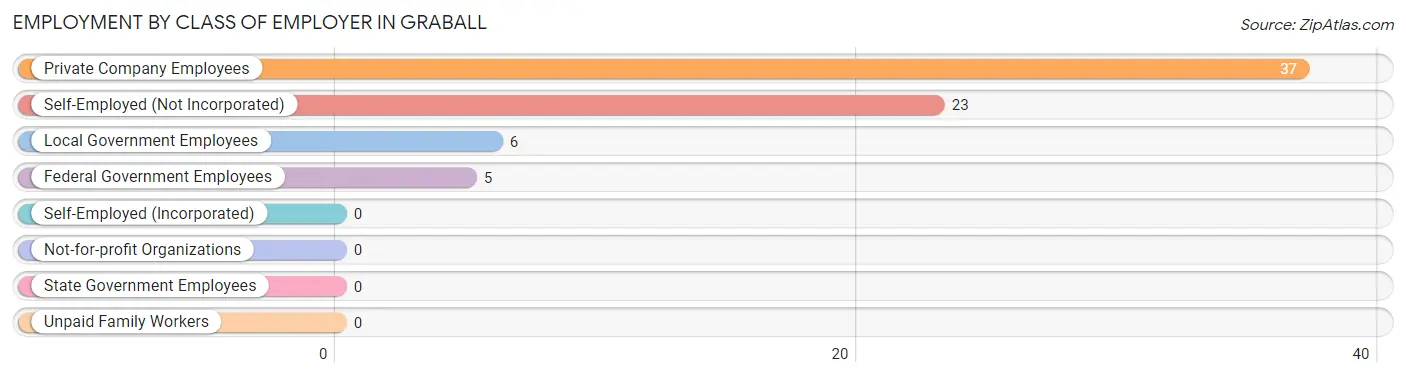
| Employer Class | # Employees | % Employees |
| Private Company Employees | 37 | 52.1% |
| Self-Employed (Incorporated) | 0 | 0.0% |
| Self-Employed (Not Incorporated) | 23 | 32.4% |
| Not-for-profit Organizations | 0 | 0.0% |
| Local Government Employees | 6 | 8.5% |
| State Government Employees | 0 | 0.0% |
| Federal Government Employees | 5 | 7.0% |
| Unpaid Family Workers | 0 | 0.0% |
| Total | 71 | 100.0% |
Employment Status by Age in Graball
According to the labor force statistics for Graball, out of the total population over 16 years of age (126), 67.5% or 85 individuals are in the labor force, with 16.5% or 14 of them unemployed. The age group with the highest labor force participation rate is 16 to 19 years, with 100.0% or 5 individuals in the labor force. Within the labor force, the 20 to 24 years age range has the highest percentage of unemployed individuals, with 63.6% or 14 of them being unemployed.
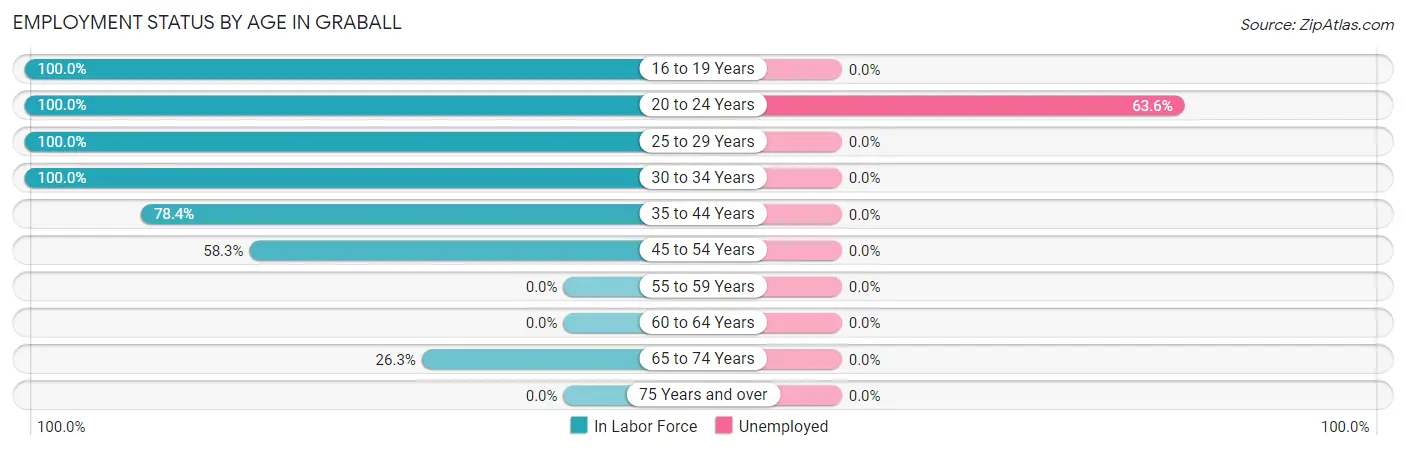
| Age Bracket | In Labor Force | Unemployed |
| 16 to 19 Years | 5 (100.0%) | 0 (0.0%) |
| 20 to 24 Years | 22 (100.0%) | 14 (63.6%) |
| 25 to 29 Years | 6 (100.0%) | 0 (0.0%) |
| 30 to 34 Years | 6 (100.0%) | 0 (0.0%) |
| 35 to 44 Years | 29 (78.4%) | 0 (0.0%) |
| 45 to 54 Years | 7 (58.3%) | 0 (0.0%) |
| 55 to 59 Years | 0 (0.0%) | 0 (0.0%) |
| 60 to 64 Years | 0 (0.0%) | 0 (0.0%) |
| 65 to 74 Years | 10 (26.3%) | 0 (0.0%) |
| 75 Years and over | 0 (0.0%) | 0 (0.0%) |
| Total | 85 (67.5%) | 14 (16.5%) |
Employment Status by Educational Attainment in Graball
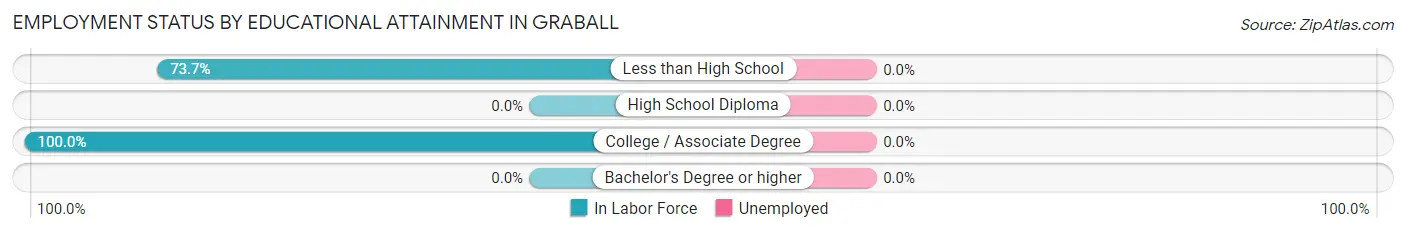
| Educational Attainment | In Labor Force | Unemployed |
| Less than High School | 14 (73.7%) | 0 (0.0%) |
| High School Diploma | 0 (0.0%) | 0 (0.0%) |
| College / Associate Degree | 34 (100.0%) | 0 (0.0%) |
| Bachelor's Degree or higher | 0 (0.0%) | 0 (0.0%) |
| Total | 48 (78.7%) | 0 (0.0%) |
Employment Occupations by Sex in Graball
Management, Business, Science and Arts Occupations
The most common Management, Business, Science and Arts occupations in Graball are Health Diagnosing & Treating (6 | 8.5%), and Management (4 | 5.6%).
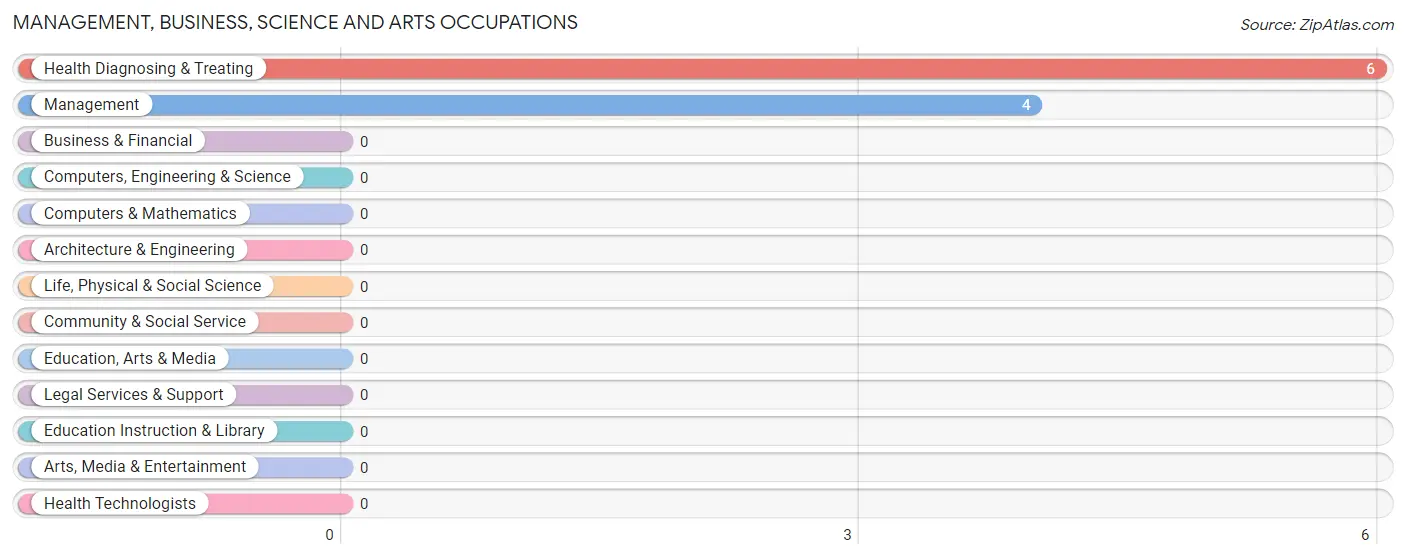
Management, Business, Science and Arts Occupations by Sex
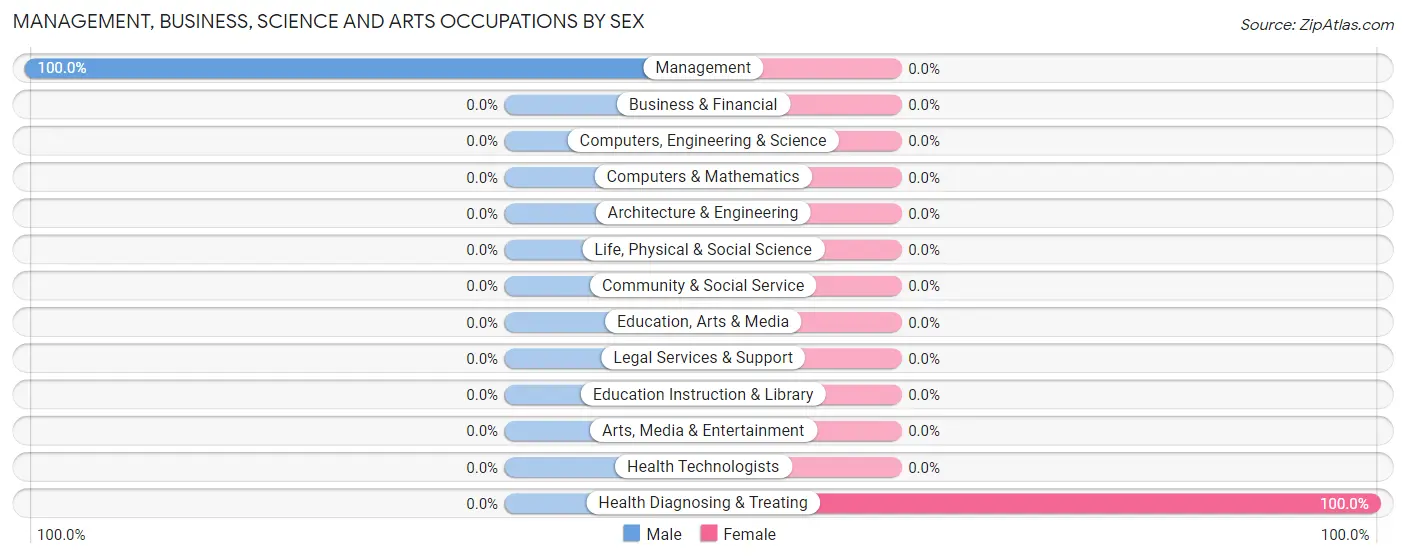
| Occupation | Male | Female |
| Management | 4 (100.0%) | 0 (0.0%) |
| Business & Financial | 0 (0.0%) | 0 (0.0%) |
| Computers, Engineering & Science | 0 (0.0%) | 0 (0.0%) |
| Computers & Mathematics | 0 (0.0%) | 0 (0.0%) |
| Architecture & Engineering | 0 (0.0%) | 0 (0.0%) |
| Life, Physical & Social Science | 0 (0.0%) | 0 (0.0%) |
| Community & Social Service | 0 (0.0%) | 0 (0.0%) |
| Education, Arts & Media | 0 (0.0%) | 0 (0.0%) |
| Legal Services & Support | 0 (0.0%) | 0 (0.0%) |
| Education Instruction & Library | 0 (0.0%) | 0 (0.0%) |
| Arts, Media & Entertainment | 0 (0.0%) | 0 (0.0%) |
| Health Diagnosing & Treating | 0 (0.0%) | 6 (100.0%) |
| Health Technologists | 0 (0.0%) | 0 (0.0%) |
| Total (Category) | 4 (40.0%) | 6 (60.0%) |
| Total (Overall) | 41 (57.8%) | 30 (42.2%) |
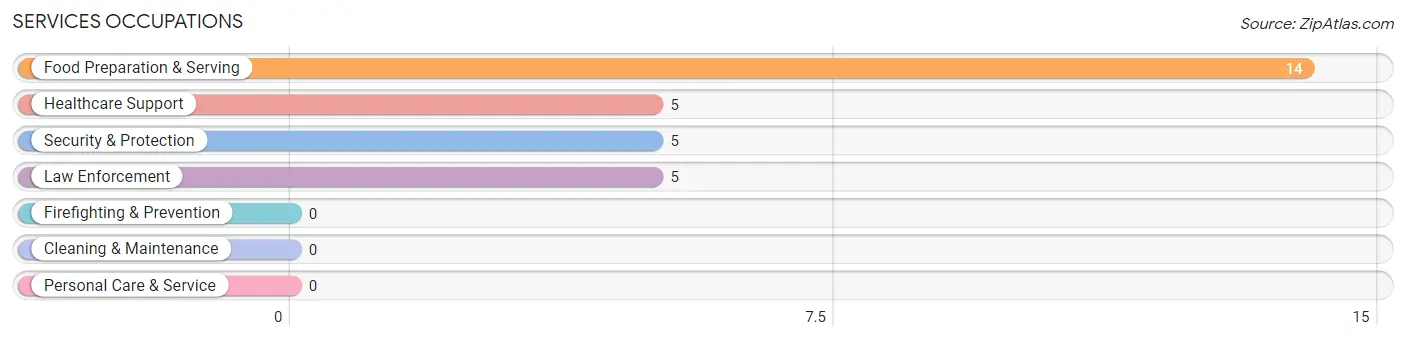
Services Occupations
The most common Services occupations in Graball are Food Preparation & Serving (14 | 19.7%), Healthcare Support (5 | 7.0%), Security & Protection (5 | 7.0%), and Law Enforcement (5 | 7.0%).
Services Occupations by Sex
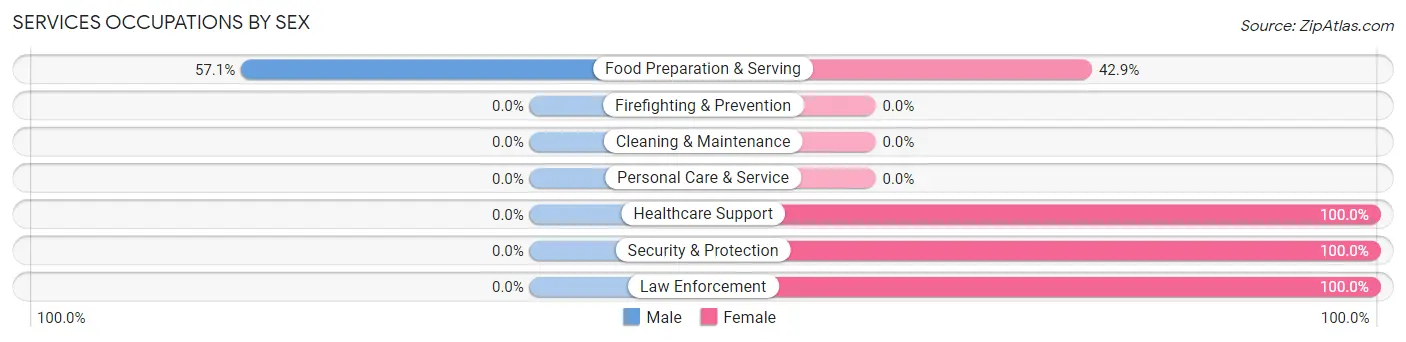
| Occupation | Male | Female |
| Healthcare Support | 0 (0.0%) | 5 (100.0%) |
| Security & Protection | 0 (0.0%) | 5 (100.0%) |
| Firefighting & Prevention | 0 (0.0%) | 0 (0.0%) |
| Law Enforcement | 0 (0.0%) | 5 (100.0%) |
| Food Preparation & Serving | 8 (57.1%) | 6 (42.9%) |
| Cleaning & Maintenance | 0 (0.0%) | 0 (0.0%) |
| Personal Care & Service | 0 (0.0%) | 0 (0.0%) |
| Total (Category) | 8 (33.3%) | 16 (66.7%) |
| Total (Overall) | 41 (57.8%) | 30 (42.2%) |
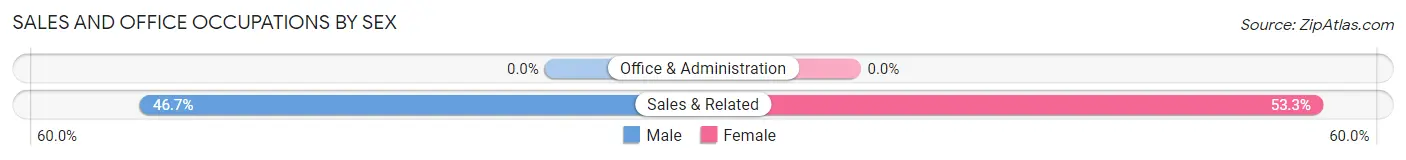
Sales and Office Occupations
The most common Sales and Office occupations in Graball are , and Sales & Related (15 | 21.1%).
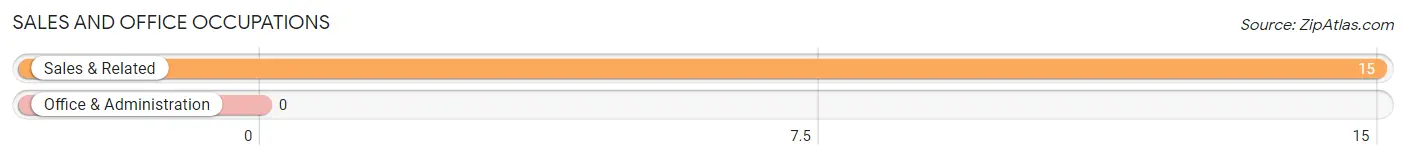
Sales and Office Occupations by Sex
| Occupation | Male | Female |
| Sales & Related | 7 (46.7%) | 8 (53.3%) |
| Office & Administration | 0 (0.0%) | 0 (0.0%) |
| Total (Category) | 7 (46.7%) | 8 (53.3%) |
| Total (Overall) | 41 (57.8%) | 30 (42.2%) |
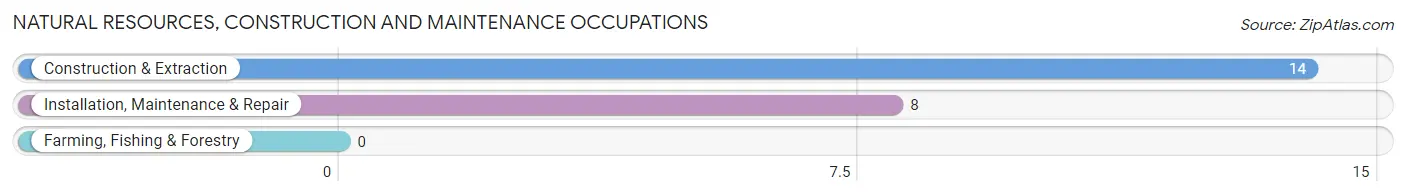
Natural Resources, Construction and Maintenance Occupations
The most common Natural Resources, Construction and Maintenance occupations in Graball are Construction & Extraction (14 | 19.7%), and Installation, Maintenance & Repair (8 | 11.3%).
Natural Resources, Construction and Maintenance Occupations by Sex
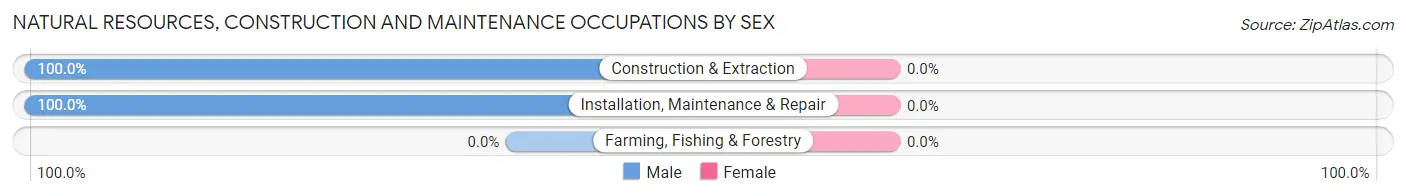
| Occupation | Male | Female |
| Farming, Fishing & Forestry | 0 (0.0%) | 0 (0.0%) |
| Construction & Extraction | 14 (100.0%) | 0 (0.0%) |
| Installation, Maintenance & Repair | 8 (100.0%) | 0 (0.0%) |
| Total (Category) | 22 (100.0%) | 0 (0.0%) |
| Total (Overall) | 41 (57.8%) | 30 (42.2%) |
Production, Transportation and Moving Occupations
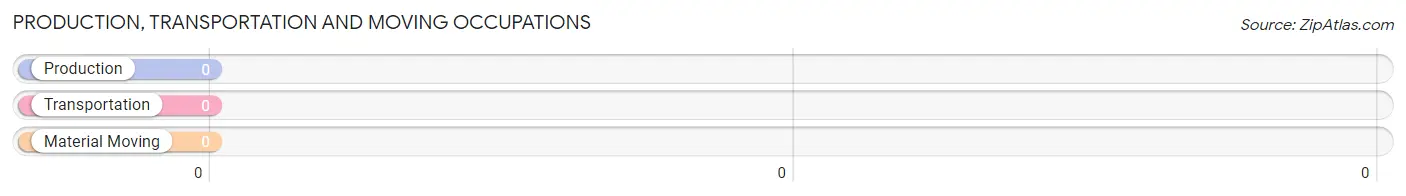
Production, Transportation and Moving Occupations by Sex
| Occupation | Male | Female |
| Production | 0 (0.0%) | 0 (0.0%) |
| Transportation | 0 (0.0%) | 0 (0.0%) |
| Material Moving | 0 (0.0%) | 0 (0.0%) |
| Total (Category) | 0 (0.0%) | 0 (0.0%) |
| Total (Overall) | 41 (57.8%) | 30 (42.2%) |
Employment Industries by Sex in Graball
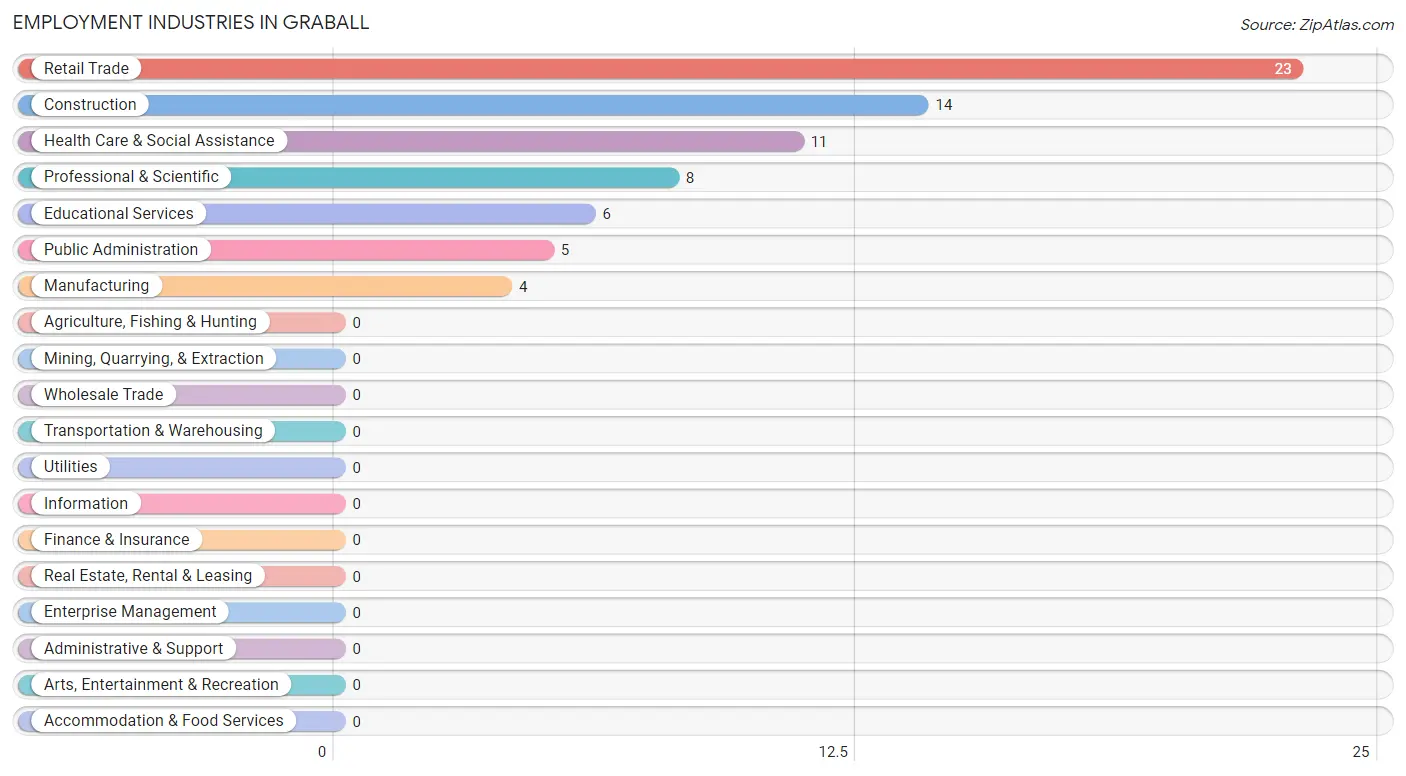
Employment Industries in Graball
The major employment industries in Graball include Retail Trade (23 | 32.4%), Construction (14 | 19.7%), Health Care & Social Assistance (11 | 15.5%), Professional & Scientific (8 | 11.3%), and Educational Services (6 | 8.5%).
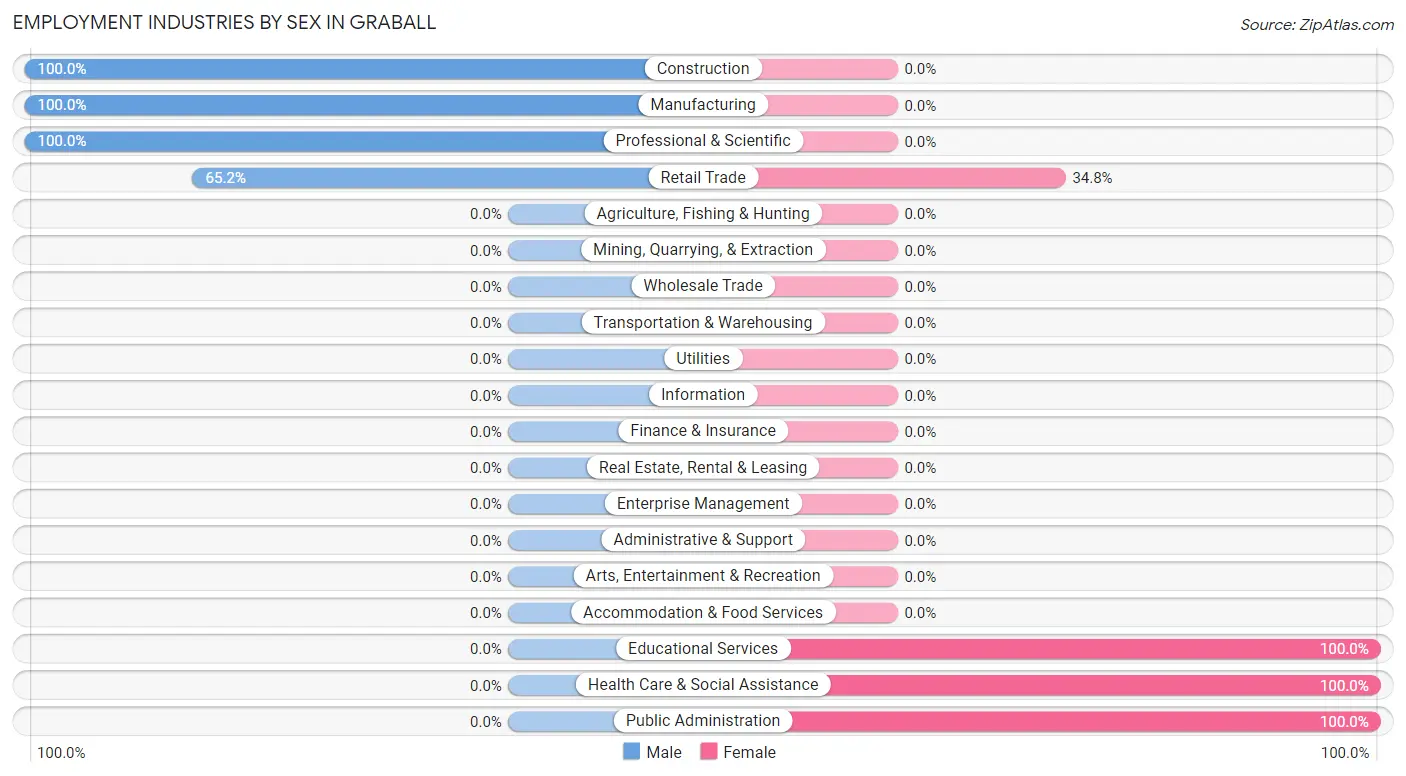
Employment Industries by Sex in Graball
The Graball industries that see more men than women are Construction (100.0%), Manufacturing (100.0%), and Professional & Scientific (100.0%), whereas the industries that tend to have a higher number of women are Educational Services (100.0%), Health Care & Social Assistance (100.0%), and Public Administration (100.0%).
| Industry | Male | Female |
| Agriculture, Fishing & Hunting | 0 (0.0%) | 0 (0.0%) |
| Mining, Quarrying, & Extraction | 0 (0.0%) | 0 (0.0%) |
| Construction | 14 (100.0%) | 0 (0.0%) |
| Manufacturing | 4 (100.0%) | 0 (0.0%) |
| Wholesale Trade | 0 (0.0%) | 0 (0.0%) |
| Retail Trade | 15 (65.2%) | 8 (34.8%) |
| Transportation & Warehousing | 0 (0.0%) | 0 (0.0%) |
| Utilities | 0 (0.0%) | 0 (0.0%) |
| Information | 0 (0.0%) | 0 (0.0%) |
| Finance & Insurance | 0 (0.0%) | 0 (0.0%) |
| Real Estate, Rental & Leasing | 0 (0.0%) | 0 (0.0%) |
| Professional & Scientific | 8 (100.0%) | 0 (0.0%) |
| Enterprise Management | 0 (0.0%) | 0 (0.0%) |
| Administrative & Support | 0 (0.0%) | 0 (0.0%) |
| Educational Services | 0 (0.0%) | 6 (100.0%) |
| Health Care & Social Assistance | 0 (0.0%) | 11 (100.0%) |
| Arts, Entertainment & Recreation | 0 (0.0%) | 0 (0.0%) |
| Accommodation & Food Services | 0 (0.0%) | 0 (0.0%) |
| Public Administration | 0 (0.0%) | 5 (100.0%) |
| Total | 41 (57.8%) | 30 (42.2%) |
Education in Graball
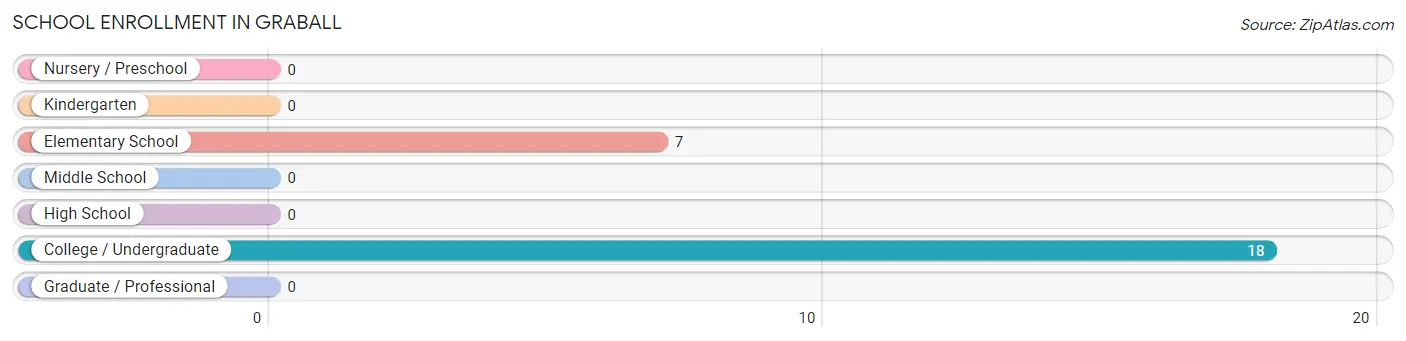
School Enrollment in Graball
The most common levels of schooling among the 25 students in Graball are college / undergraduate (18 | 72.0%), and elementary school (7 | 28.0%).
| School Level | # Students | % Students |
| Nursery / Preschool | 0 | 0.0% |
| Kindergarten | 0 | 0.0% |
| Elementary School | 7 | 28.0% |
| Middle School | 0 | 0.0% |
| High School | 0 | 0.0% |
| College / Undergraduate | 18 | 72.0% |
| Graduate / Professional | 0 | 0.0% |
| Total | 25 | 100.0% |
School Enrollment by Age by Funding Source in Graball
Out of a total of 25 students who are enrolled in schools in Graball, 7 (28.0%) attend a private institution, while the remaining 18 (72.0%) are enrolled in public schools. The age group of 5 to 9 year old has the highest likelihood of being enrolled in private schools, with 7 (100.0% in the age bracket) enrolled. Conversely, the age group of 18 to 19 year olds has the lowest likelihood of being enrolled in a private school, with 5 (100.0% in the age bracket) attending a public institution.
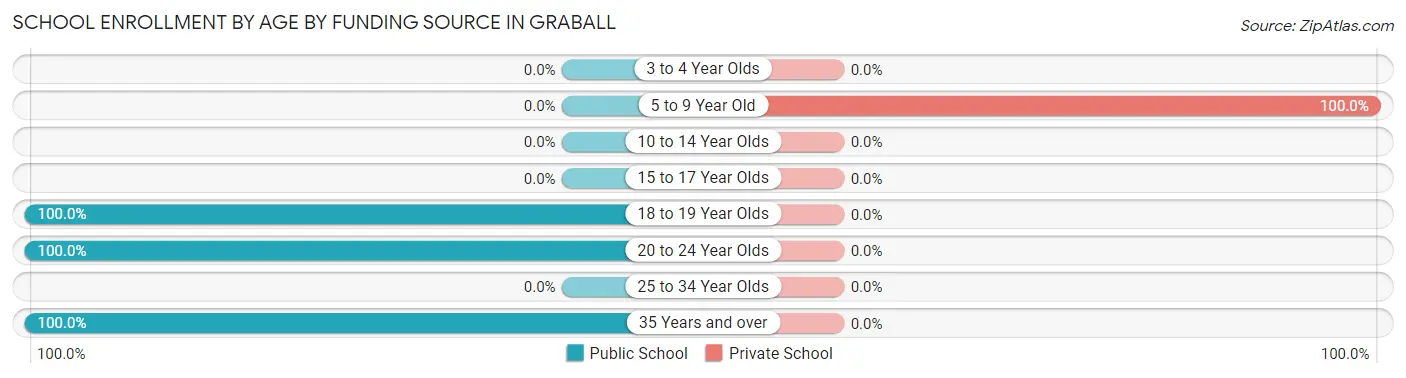
| Age Bracket | Public School | Private School |
| 3 to 4 Year Olds | 0 (0.0%) | 0 (0.0%) |
| 5 to 9 Year Old | 0 (0.0%) | 7 (100.0%) |
| 10 to 14 Year Olds | 0 (0.0%) | 0 (0.0%) |
| 15 to 17 Year Olds | 0 (0.0%) | 0 (0.0%) |
| 18 to 19 Year Olds | 5 (100.0%) | 0 (0.0%) |
| 20 to 24 Year Olds | 8 (100.0%) | 0 (0.0%) |
| 25 to 34 Year Olds | 0 (0.0%) | 0 (0.0%) |
| 35 Years and over | 5 (100.0%) | 0 (0.0%) |
| Total | 18 (72.0%) | 7 (28.0%) |
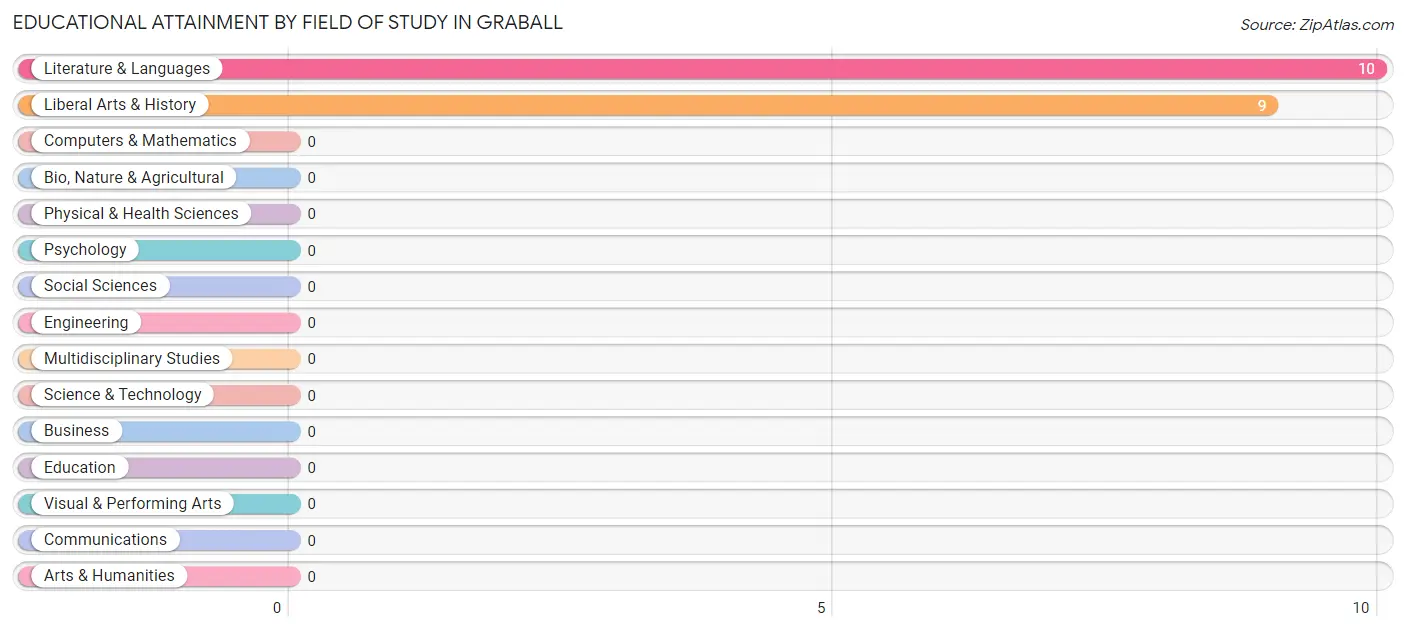
Educational Attainment by Field of Study in Graball
Literature & languages (10 | 52.6%), and liberal arts & history (9 | 47.4%) are the most common fields of study among 19 individuals in Graball who have obtained a bachelor's degree or higher.
| Field of Study | # Graduates | % Graduates |
| Computers & Mathematics | 0 | 0.0% |
| Bio, Nature & Agricultural | 0 | 0.0% |
| Physical & Health Sciences | 0 | 0.0% |
| Psychology | 0 | 0.0% |
| Social Sciences | 0 | 0.0% |
| Engineering | 0 | 0.0% |
| Multidisciplinary Studies | 0 | 0.0% |
| Science & Technology | 0 | 0.0% |
| Business | 0 | 0.0% |
| Education | 0 | 0.0% |
| Literature & Languages | 10 | 52.6% |
| Liberal Arts & History | 9 | 47.4% |
| Visual & Performing Arts | 0 | 0.0% |
| Communications | 0 | 0.0% |
| Arts & Humanities | 0 | 0.0% |
| Total | 19 | 100.0% |
Transportation & Commute in Graball
Vehicle Availability by Sex in Graball
The most prevalent vehicle ownership categories in Graball are males with 3 vehicles (34, accounting for 82.9%) and females with 3 vehicles (12, making up 113.3%).
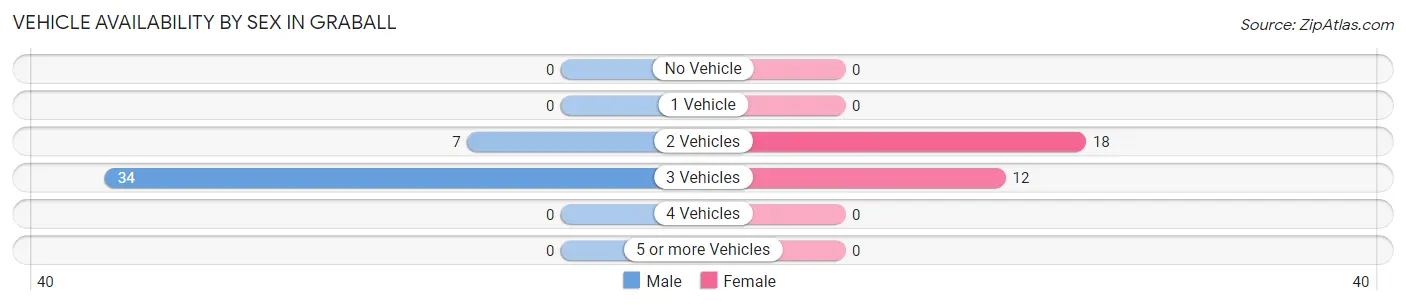
| Vehicles Available | Male | Female |
| No Vehicle | 0 (0.0%) | 0 (0.0%) |
| 1 Vehicle | 0 (0.0%) | 0 (0.0%) |
| 2 Vehicles | 7 (17.1%) | 18 (60.0%) |
| 3 Vehicles | 34 (82.9%) | 12 (40.0%) |
| 4 Vehicles | 0 (0.0%) | 0 (0.0%) |
| 5 or more Vehicles | 0 (0.0%) | 0 (0.0%) |
| Total | 41 (100.0%) | 30 (100.0%) |
Commute Time in Graball
The most frequently occuring commute durations in Graball are 20 to 24 minutes (27 commuters, 38.0%), 10 to 14 minutes (15 commuters, 21.1%), and 25 to 29 minutes (12 commuters, 16.9%).
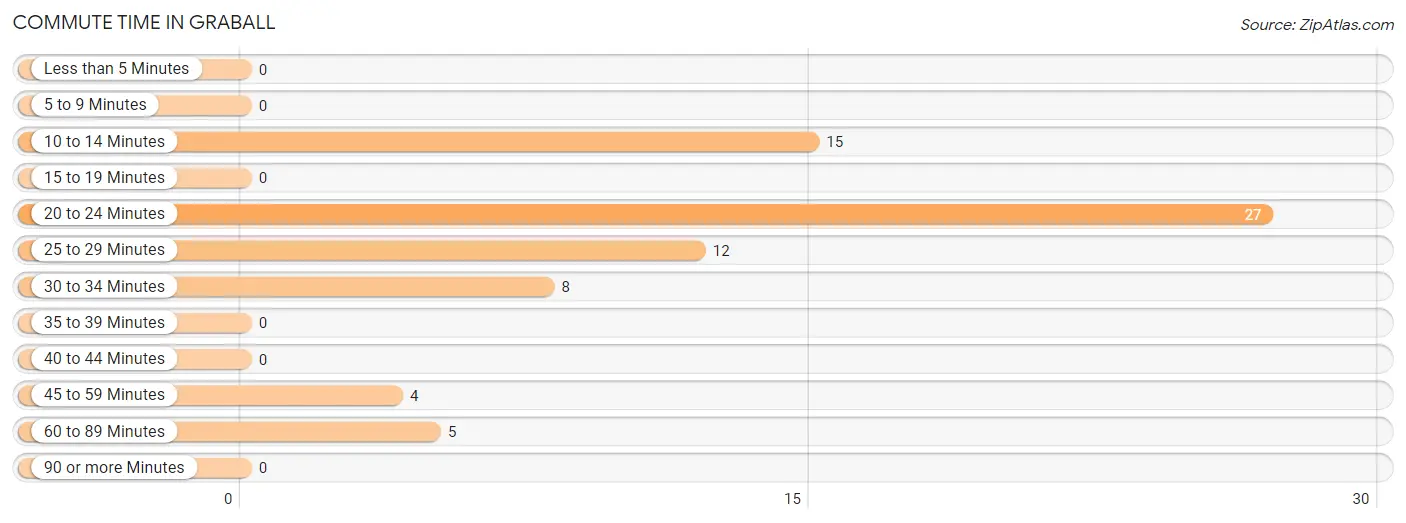
| Commute Time | # Commuters | % Commuters |
| Less than 5 Minutes | 0 | 0.0% |
| 5 to 9 Minutes | 0 | 0.0% |
| 10 to 14 Minutes | 15 | 21.1% |
| 15 to 19 Minutes | 0 | 0.0% |
| 20 to 24 Minutes | 27 | 38.0% |
| 25 to 29 Minutes | 12 | 16.9% |
| 30 to 34 Minutes | 8 | 11.3% |
| 35 to 39 Minutes | 0 | 0.0% |
| 40 to 44 Minutes | 0 | 0.0% |
| 45 to 59 Minutes | 4 | 5.6% |
| 60 to 89 Minutes | 5 | 7.0% |
| 90 or more Minutes | 0 | 0.0% |
Commute Time by Sex in Graball
The most common commute times in Graball are 20 to 24 minutes (16 commuters, 39.0%) for males and 20 to 24 minutes (11 commuters, 36.7%) for females.
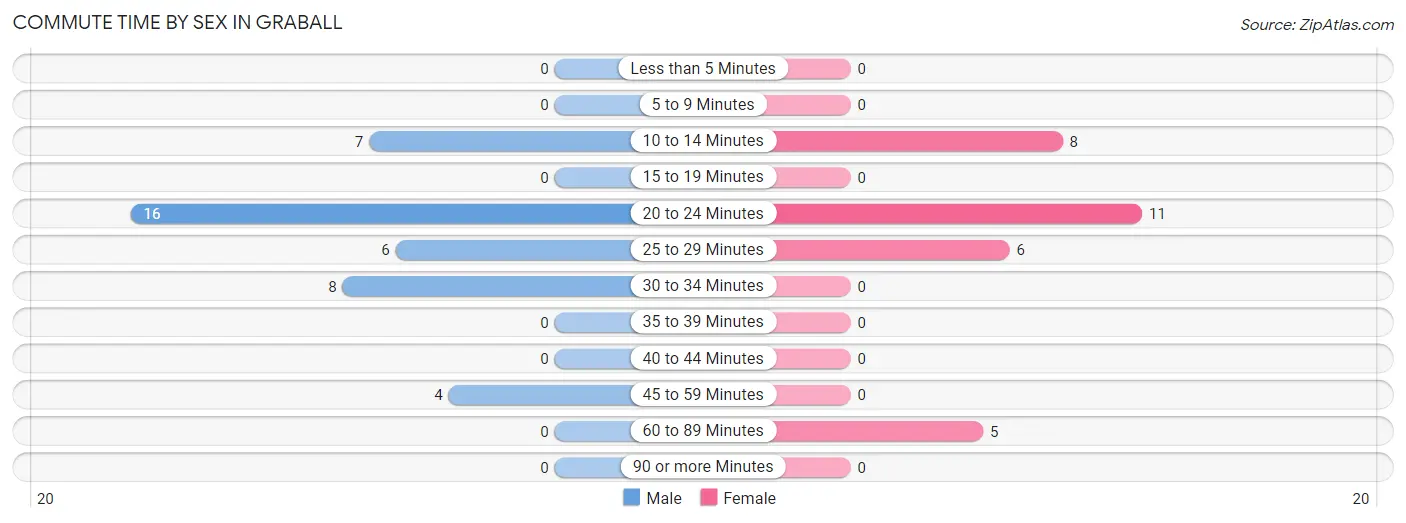
| Commute Time | Male | Female |
| Less than 5 Minutes | 0 (0.0%) | 0 (0.0%) |
| 5 to 9 Minutes | 0 (0.0%) | 0 (0.0%) |
| 10 to 14 Minutes | 7 (17.1%) | 8 (26.7%) |
| 15 to 19 Minutes | 0 (0.0%) | 0 (0.0%) |
| 20 to 24 Minutes | 16 (39.0%) | 11 (36.7%) |
| 25 to 29 Minutes | 6 (14.6%) | 6 (20.0%) |
| 30 to 34 Minutes | 8 (19.5%) | 0 (0.0%) |
| 35 to 39 Minutes | 0 (0.0%) | 0 (0.0%) |
| 40 to 44 Minutes | 0 (0.0%) | 0 (0.0%) |
| 45 to 59 Minutes | 4 (9.8%) | 0 (0.0%) |
| 60 to 89 Minutes | 0 (0.0%) | 5 (16.7%) |
| 90 or more Minutes | 0 (0.0%) | 0 (0.0%) |
Time of Departure to Work by Sex in Graball
The most frequent times of departure to work in Graball are 12:00 PM to 3:59 PM (20, 48.8%) for males and 7:00 AM to 7:29 AM (12, 40.0%) for females.
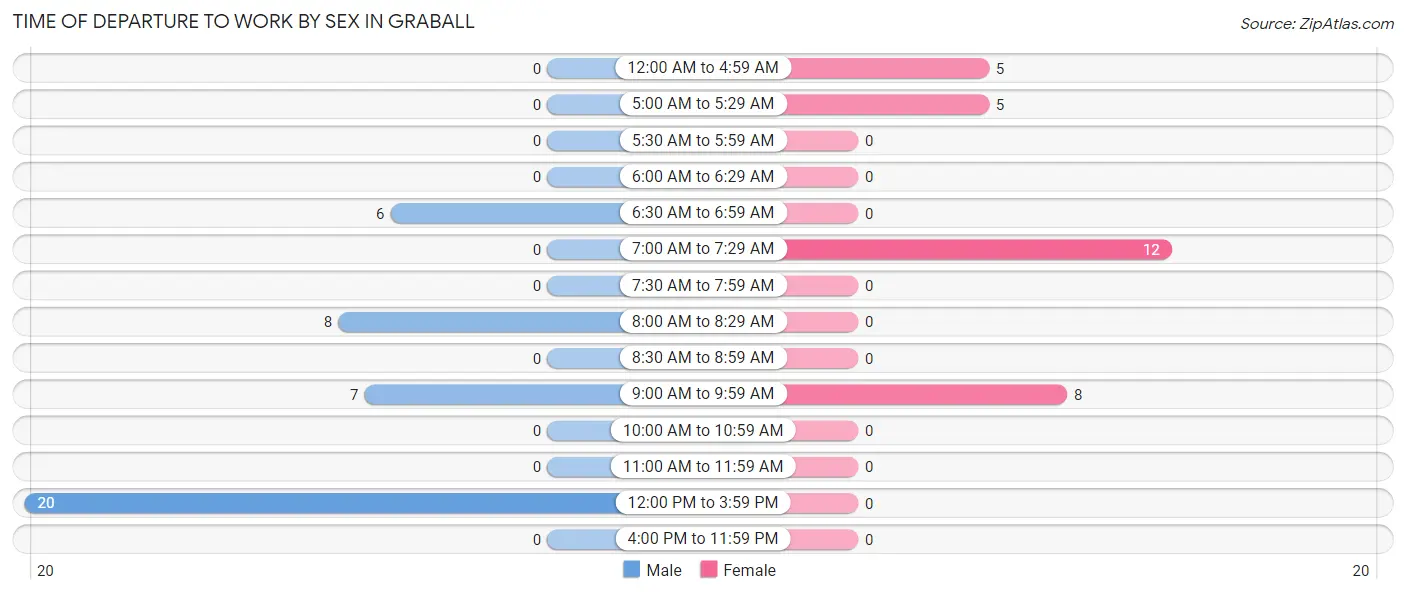
| Time of Departure | Male | Female |
| 12:00 AM to 4:59 AM | 0 (0.0%) | 5 (16.7%) |
| 5:00 AM to 5:29 AM | 0 (0.0%) | 5 (16.7%) |
| 5:30 AM to 5:59 AM | 0 (0.0%) | 0 (0.0%) |
| 6:00 AM to 6:29 AM | 0 (0.0%) | 0 (0.0%) |
| 6:30 AM to 6:59 AM | 6 (14.6%) | 0 (0.0%) |
| 7:00 AM to 7:29 AM | 0 (0.0%) | 12 (40.0%) |
| 7:30 AM to 7:59 AM | 0 (0.0%) | 0 (0.0%) |
| 8:00 AM to 8:29 AM | 8 (19.5%) | 0 (0.0%) |
| 8:30 AM to 8:59 AM | 0 (0.0%) | 0 (0.0%) |
| 9:00 AM to 9:59 AM | 7 (17.1%) | 8 (26.7%) |
| 10:00 AM to 10:59 AM | 0 (0.0%) | 0 (0.0%) |
| 11:00 AM to 11:59 AM | 0 (0.0%) | 0 (0.0%) |
| 12:00 PM to 3:59 PM | 20 (48.8%) | 0 (0.0%) |
| 4:00 PM to 11:59 PM | 0 (0.0%) | 0 (0.0%) |
| Total | 41 (100.0%) | 30 (100.0%) |
Housing Occupancy in Graball
Occupancy by Ownership in Graball
Of the total 43 dwellings in Graball, owner-occupied units account for 38 (88.4%), while renter-occupied units make up 5 (11.6%).
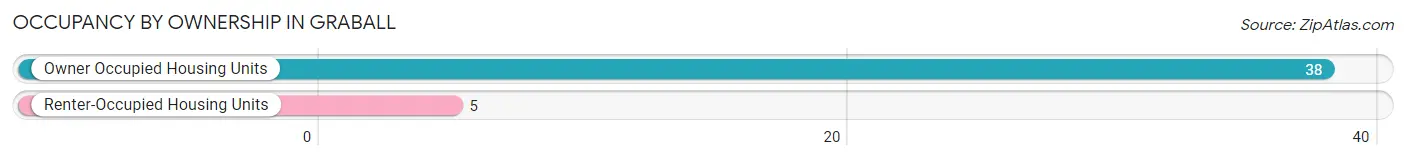
| Occupancy | # Housing Units | % Housing Units |
| Owner Occupied Housing Units | 38 | 88.4% |
| Renter-Occupied Housing Units | 5 | 11.6% |
| Total Occupied Housing Units | 43 | 100.0% |
Occupancy by Household Size in Graball
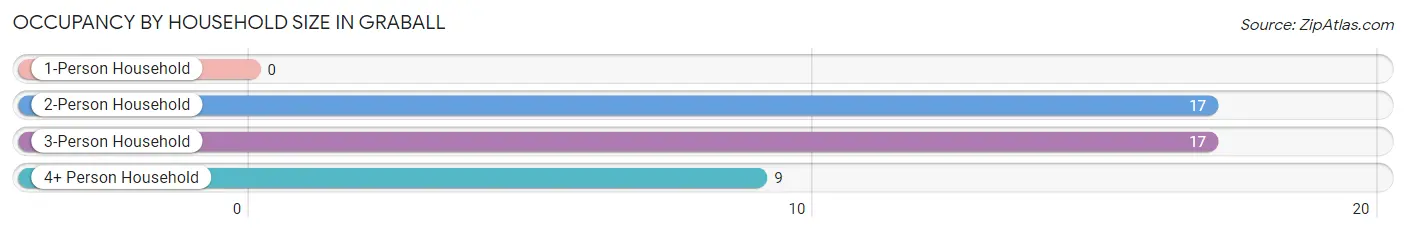
| Household Size | # Housing Units | % Housing Units |
| 1-Person Household | 0 | 0.0% |
| 2-Person Household | 17 | 39.5% |
| 3-Person Household | 17 | 39.5% |
| 4+ Person Household | 9 | 20.9% |
| Total Housing Units | 43 | 100.0% |
Occupancy by Ownership by Household Size in Graball
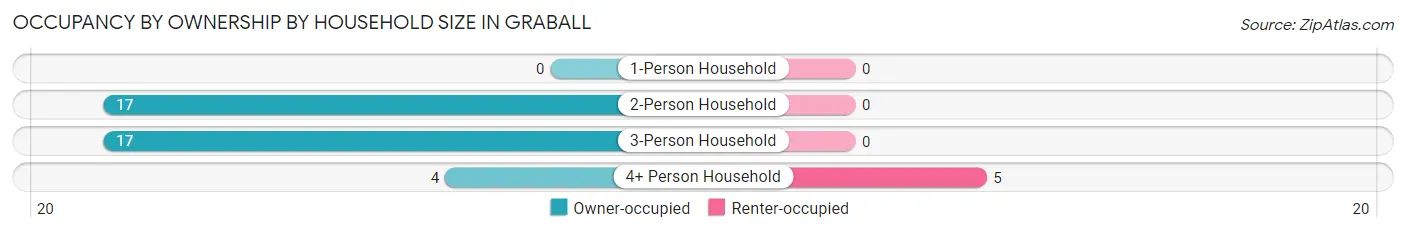
| Household Size | Owner-occupied | Renter-occupied |
| 1-Person Household | 0 (0.0%) | 0 (0.0%) |
| 2-Person Household | 17 (100.0%) | 0 (0.0%) |
| 3-Person Household | 17 (100.0%) | 0 (0.0%) |
| 4+ Person Household | 4 (44.4%) | 5 (55.6%) |
| Total Housing Units | 38 (88.4%) | 5 (11.6%) |
Occupancy by Educational Attainment in Graball
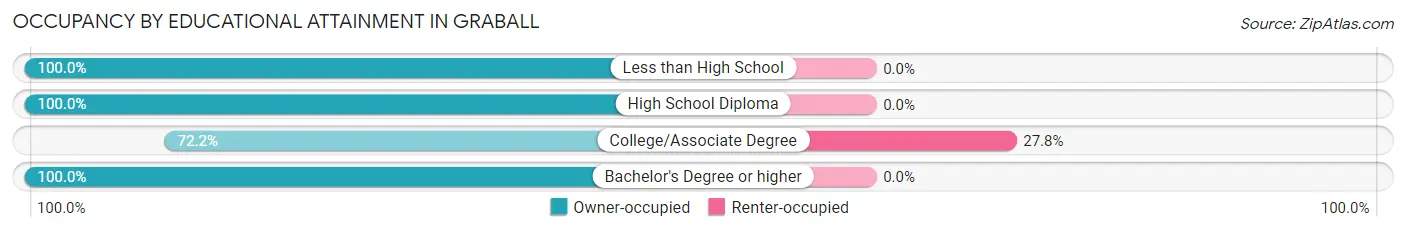
| Household Size | Owner-occupied | Renter-occupied |
| Less than High School | 12 (100.0%) | 0 (0.0%) |
| High School Diploma | 4 (100.0%) | 0 (0.0%) |
| College/Associate Degree | 13 (72.2%) | 5 (27.8%) |
| Bachelor's Degree or higher | 9 (100.0%) | 0 (0.0%) |
Occupancy by Age of Householder in Graball
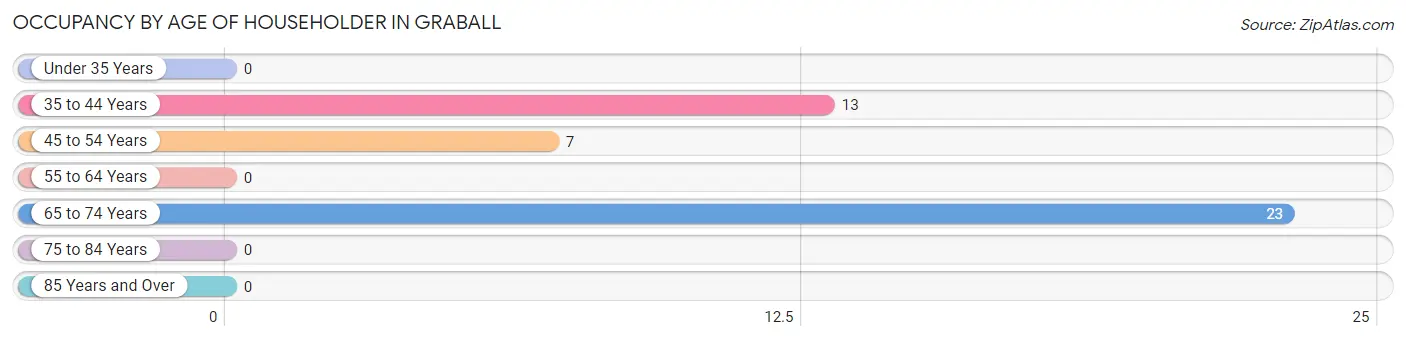
| Age Bracket | # Households | % Households |
| Under 35 Years | 0 | 0.0% |
| 35 to 44 Years | 13 | 30.2% |
| 45 to 54 Years | 7 | 16.3% |
| 55 to 64 Years | 0 | 0.0% |
| 65 to 74 Years | 23 | 53.5% |
| 75 to 84 Years | 0 | 0.0% |
| 85 Years and Over | 0 | 0.0% |
| Total | 43 | 100.0% |
Housing Finances in Graball
Median Income by Occupancy in Graball
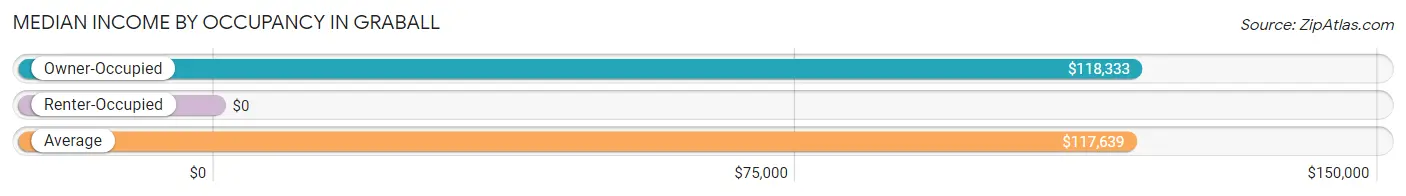
| Occupancy Type | # Households | Median Income |
| Owner-Occupied | 38 (88.4%) | $118,333 |
| Renter-Occupied | 5 (11.6%) | $0 |
| Average | 43 (100.0%) | $117,639 |
Occupancy by Householder Income Bracket in Graball
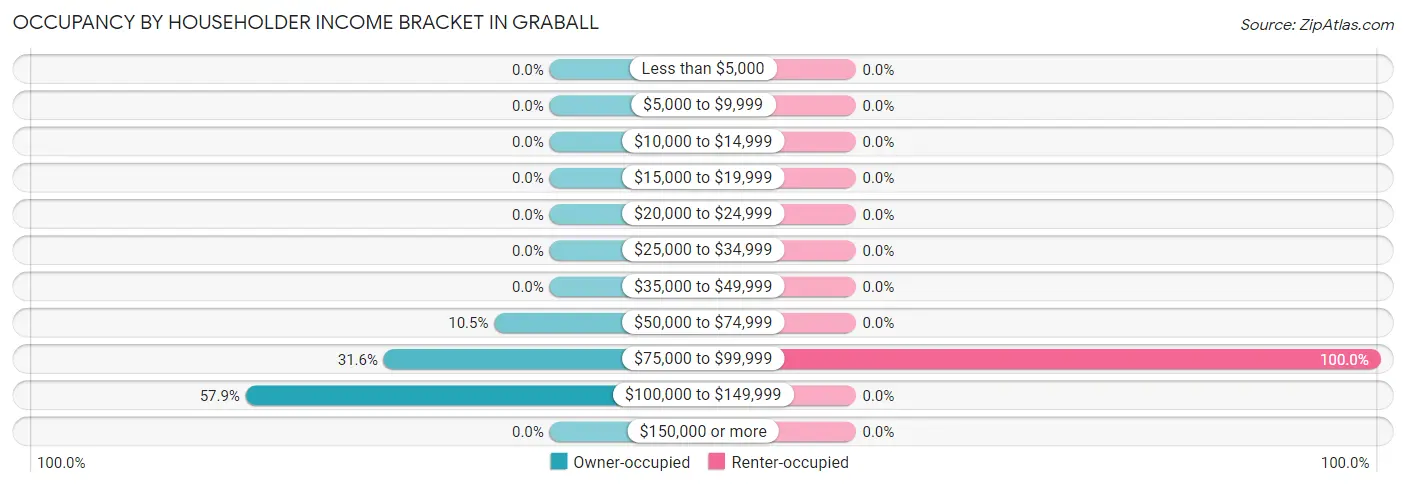
| Income Bracket | Owner-occupied | Renter-occupied |
| Less than $5,000 | 0 (0.0%) | 0 (0.0%) |
| $5,000 to $9,999 | 0 (0.0%) | 0 (0.0%) |
| $10,000 to $14,999 | 0 (0.0%) | 0 (0.0%) |
| $15,000 to $19,999 | 0 (0.0%) | 0 (0.0%) |
| $20,000 to $24,999 | 0 (0.0%) | 0 (0.0%) |
| $25,000 to $34,999 | 0 (0.0%) | 0 (0.0%) |
| $35,000 to $49,999 | 0 (0.0%) | 0 (0.0%) |
| $50,000 to $74,999 | 4 (10.5%) | 0 (0.0%) |
| $75,000 to $99,999 | 12 (31.6%) | 5 (100.0%) |
| $100,000 to $149,999 | 22 (57.9%) | 0 (0.0%) |
| $150,000 or more | 0 (0.0%) | 0 (0.0%) |
| Total | 38 (100.0%) | 5 (100.0%) |
Monthly Housing Cost Tiers in Graball
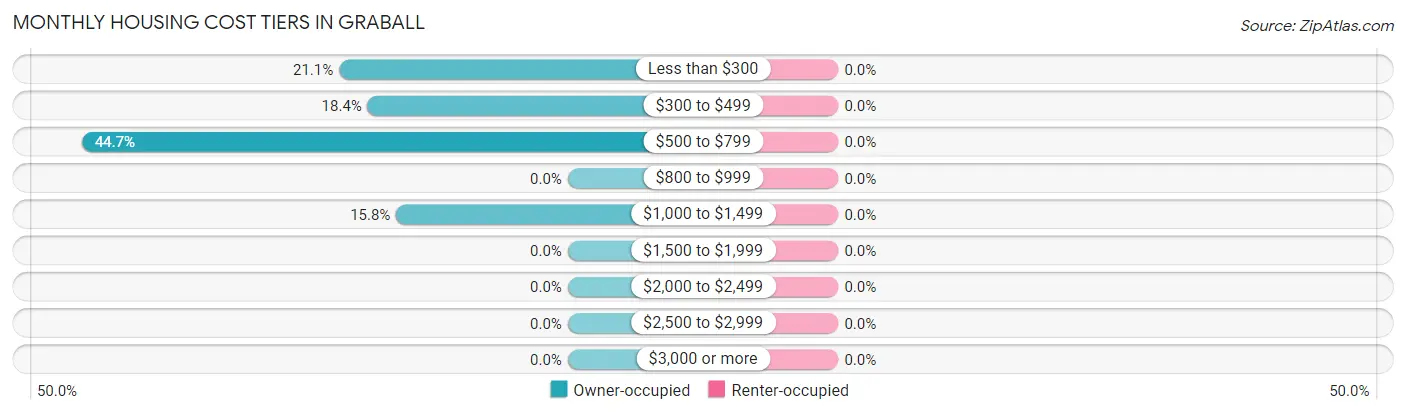
| Monthly Cost | Owner-occupied | Renter-occupied |
| Less than $300 | 8 (21.0%) | 0 (0.0%) |
| $300 to $499 | 7 (18.4%) | 0 (0.0%) |
| $500 to $799 | 17 (44.7%) | 0 (0.0%) |
| $800 to $999 | 0 (0.0%) | 0 (0.0%) |
| $1,000 to $1,499 | 6 (15.8%) | 0 (0.0%) |
| $1,500 to $1,999 | 0 (0.0%) | 0 (0.0%) |
| $2,000 to $2,499 | 0 (0.0%) | 0 (0.0%) |
| $2,500 to $2,999 | 0 (0.0%) | 0 (0.0%) |
| $3,000 or more | 0 (0.0%) | 0 (0.0%) |
| Total | 38 (100.0%) | 5 (100.0%) |
Physical Housing Characteristics in Graball
Housing Structures in Graball

| Structure Type | # Housing Units | % Housing Units |
| Single Unit, Detached | 30 | 69.8% |
| Single Unit, Attached | 0 | 0.0% |
| 2 Unit Apartments | 0 | 0.0% |
| 3 or 4 Unit Apartments | 0 | 0.0% |
| 5 to 9 Unit Apartments | 0 | 0.0% |
| 10 or more Apartments | 0 | 0.0% |
| Mobile Home / Other | 13 | 30.2% |
| Total | 43 | 100.0% |
Housing Structures by Occupancy in Graball
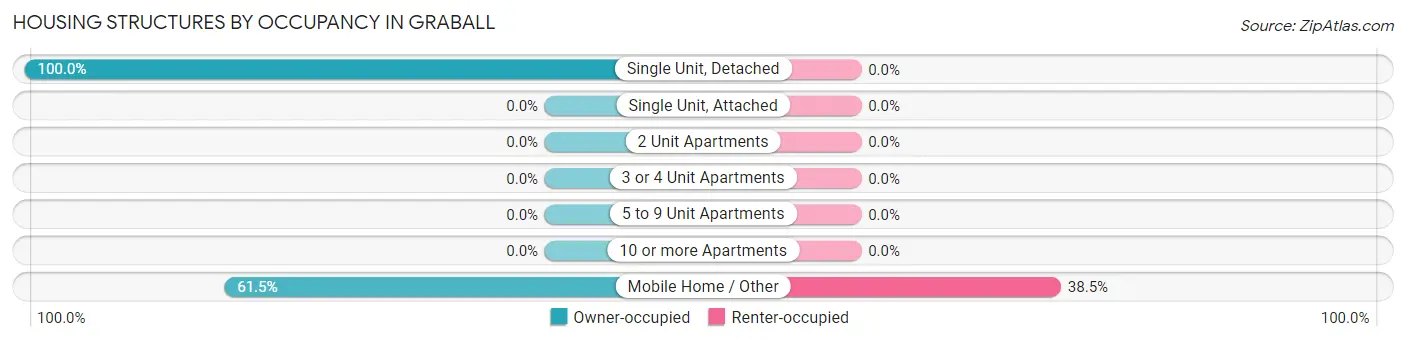
| Structure Type | Owner-occupied | Renter-occupied |
| Single Unit, Detached | 30 (100.0%) | 0 (0.0%) |
| Single Unit, Attached | 0 (0.0%) | 0 (0.0%) |
| 2 Unit Apartments | 0 (0.0%) | 0 (0.0%) |
| 3 or 4 Unit Apartments | 0 (0.0%) | 0 (0.0%) |
| 5 to 9 Unit Apartments | 0 (0.0%) | 0 (0.0%) |
| 10 or more Apartments | 0 (0.0%) | 0 (0.0%) |
| Mobile Home / Other | 8 (61.5%) | 5 (38.5%) |
| Total | 38 (88.4%) | 5 (11.6%) |
Housing Structures by Number of Rooms in Graball
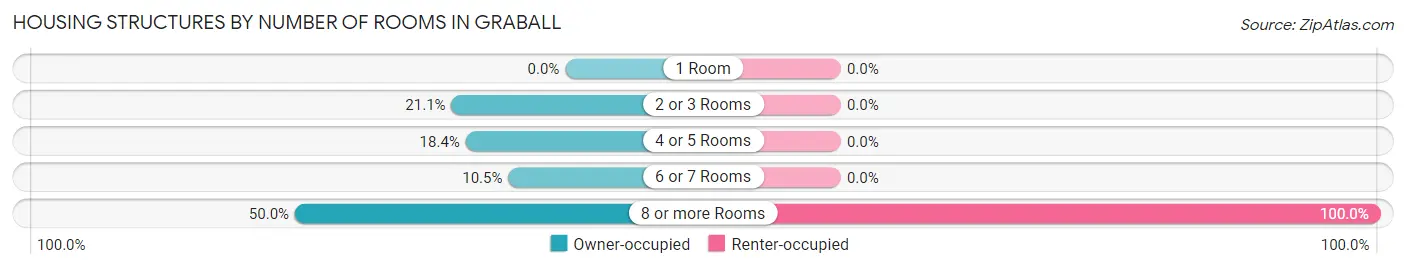
| Number of Rooms | Owner-occupied | Renter-occupied |
| 1 Room | 0 (0.0%) | 0 (0.0%) |
| 2 or 3 Rooms | 8 (21.0%) | 0 (0.0%) |
| 4 or 5 Rooms | 7 (18.4%) | 0 (0.0%) |
| 6 or 7 Rooms | 4 (10.5%) | 0 (0.0%) |
| 8 or more Rooms | 19 (50.0%) | 5 (100.0%) |
| Total | 38 (100.0%) | 5 (100.0%) |
Housing Structure by Heating Type in Graball
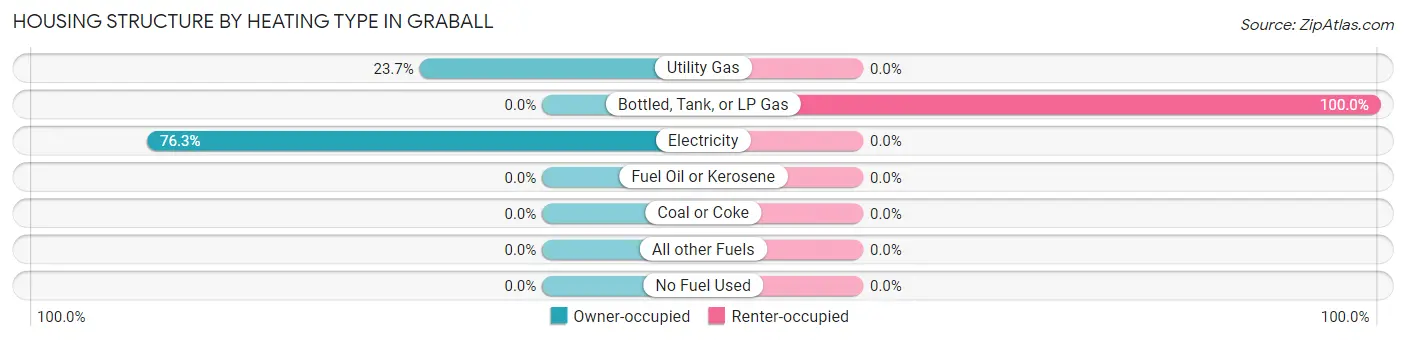
| Heating Type | Owner-occupied | Renter-occupied |
| Utility Gas | 9 (23.7%) | 0 (0.0%) |
| Bottled, Tank, or LP Gas | 0 (0.0%) | 5 (100.0%) |
| Electricity | 29 (76.3%) | 0 (0.0%) |
| Fuel Oil or Kerosene | 0 (0.0%) | 0 (0.0%) |
| Coal or Coke | 0 (0.0%) | 0 (0.0%) |
| All other Fuels | 0 (0.0%) | 0 (0.0%) |
| No Fuel Used | 0 (0.0%) | 0 (0.0%) |
| Total | 38 (100.0%) | 5 (100.0%) |
Household Vehicle Usage in Graball
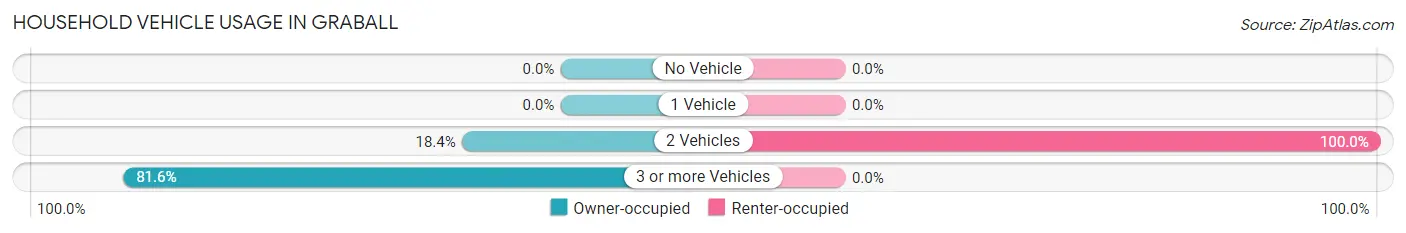
| Vehicles per Household | Owner-occupied | Renter-occupied |
| No Vehicle | 0 (0.0%) | 0 (0.0%) |
| 1 Vehicle | 0 (0.0%) | 0 (0.0%) |
| 2 Vehicles | 7 (18.4%) | 5 (100.0%) |
| 3 or more Vehicles | 31 (81.6%) | 0 (0.0%) |
| Total | 38 (100.0%) | 5 (100.0%) |
Real Estate & Mortgages in Graball
Real Estate and Mortgage Overview in Graball
| Characteristic | Without Mortgage | With Mortgage |
| Housing Units | 32 | 6 |
| Median Property Value | $228,600 | $0 |
| Median Household Income | $103,750 | $0 |
| Monthly Housing Costs | $511 | $0 |
| Real Estate Taxes | $945 | $0 |
Property Value by Mortgage Status in Graball
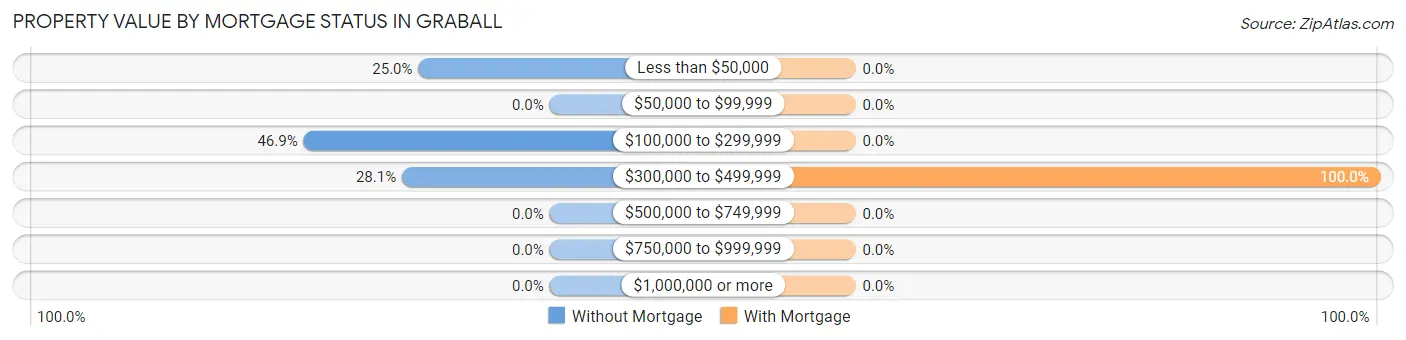
| Property Value | Without Mortgage | With Mortgage |
| Less than $50,000 | 8 (25.0%) | 0 (0.0%) |
| $50,000 to $99,999 | 0 (0.0%) | 0 (0.0%) |
| $100,000 to $299,999 | 15 (46.9%) | 0 (0.0%) |
| $300,000 to $499,999 | 9 (28.1%) | 6 (100.0%) |
| $500,000 to $749,999 | 0 (0.0%) | 0 (0.0%) |
| $750,000 to $999,999 | 0 (0.0%) | 0 (0.0%) |
| $1,000,000 or more | 0 (0.0%) | 0 (0.0%) |
| Total | 32 (100.0%) | 6 (100.0%) |
Household Income by Mortgage Status in Graball
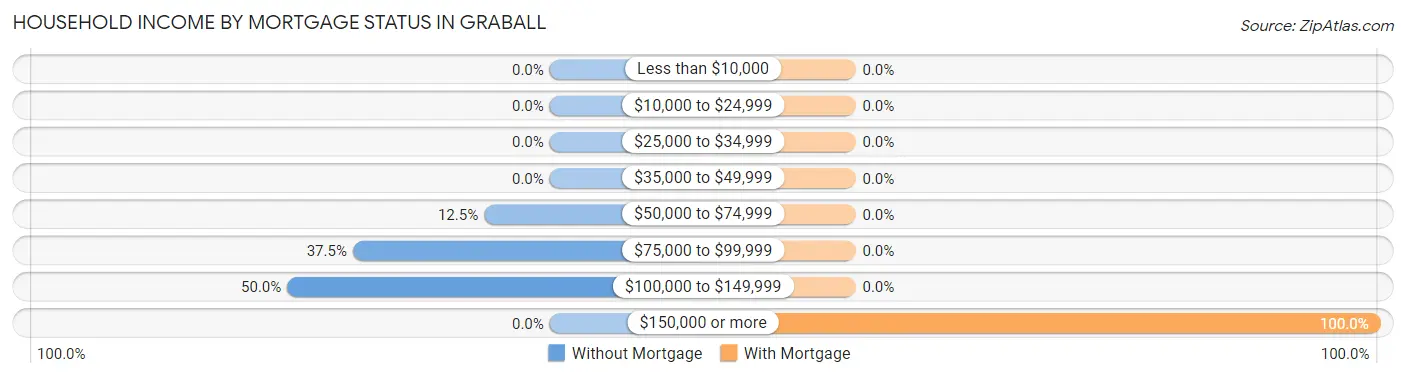
| Household Income | Without Mortgage | With Mortgage |
| Less than $10,000 | 0 (0.0%) | 0 (0.0%) |
| $10,000 to $24,999 | 0 (0.0%) | 0 (0.0%) |
| $25,000 to $34,999 | 0 (0.0%) | 0 (0.0%) |
| $35,000 to $49,999 | 0 (0.0%) | 0 (0.0%) |
| $50,000 to $74,999 | 4 (12.5%) | 0 (0.0%) |
| $75,000 to $99,999 | 12 (37.5%) | 0 (0.0%) |
| $100,000 to $149,999 | 16 (50.0%) | 0 (0.0%) |
| $150,000 or more | 0 (0.0%) | 6 (100.0%) |
| Total | 32 (100.0%) | 6 (100.0%) |
Property Value to Household Income Ratio in Graball
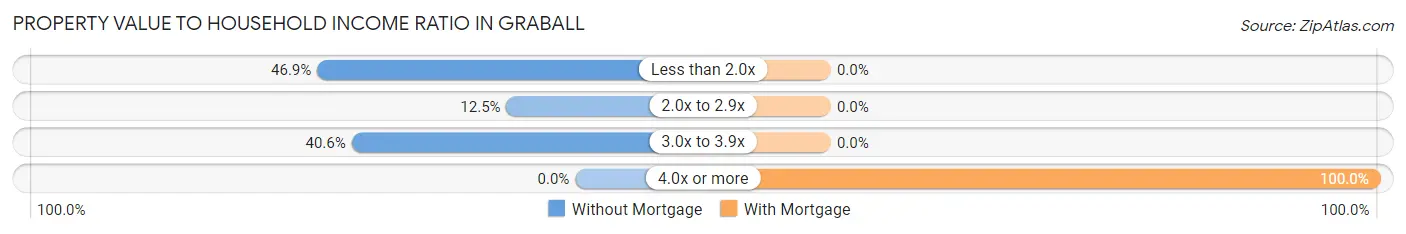
| Value-to-Income Ratio | Without Mortgage | With Mortgage |
| Less than 2.0x | 15 (46.9%) | 0 (0.0%) |
| 2.0x to 2.9x | 4 (12.5%) | 0 (0.0%) |
| 3.0x to 3.9x | 13 (40.6%) | 0 (0.0%) |
| 4.0x or more | 0 (0.0%) | 6 (100.0%) |
| Total | 32 (100.0%) | 6 (100.0%) |
Real Estate Taxes by Mortgage Status in Graball
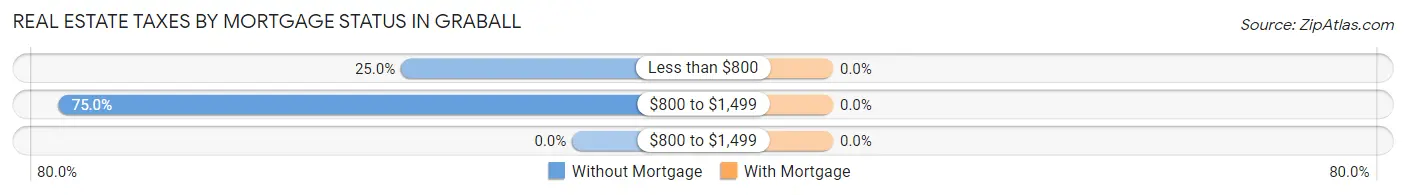
| Property Taxes | Without Mortgage | With Mortgage |
| Less than $800 | 8 (25.0%) | 0 (0.0%) |
| $800 to $1,499 | 24 (75.0%) | 0 (0.0%) |
| $800 to $1,499 | 0 (0.0%) | 0 (0.0%) |
| Total | 32 (100.0%) | 6 (100.0%) |
Health & Disability in Graball
Health Insurance Coverage by Age in Graball
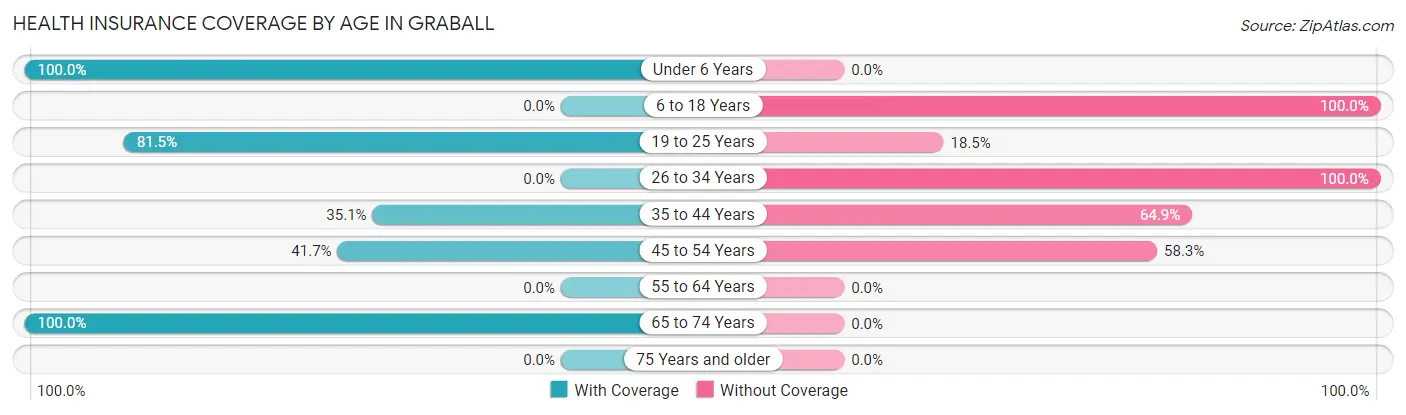
| Age Bracket | With Coverage | Without Coverage |
| Under 6 Years | 9 (100.0%) | 0 (0.0%) |
| 6 to 18 Years | 0 (0.0%) | 7 (100.0%) |
| 19 to 25 Years | 22 (81.5%) | 5 (18.5%) |
| 26 to 34 Years | 0 (0.0%) | 12 (100.0%) |
| 35 to 44 Years | 13 (35.1%) | 24 (64.9%) |
| 45 to 54 Years | 5 (41.7%) | 7 (58.3%) |
| 55 to 64 Years | 0 (0.0%) | 0 (0.0%) |
| 65 to 74 Years | 38 (100.0%) | 0 (0.0%) |
| 75 Years and older | 0 (0.0%) | 0 (0.0%) |
| Total | 87 (61.3%) | 55 (38.7%) |
Health Insurance Coverage by Citizenship Status in Graball
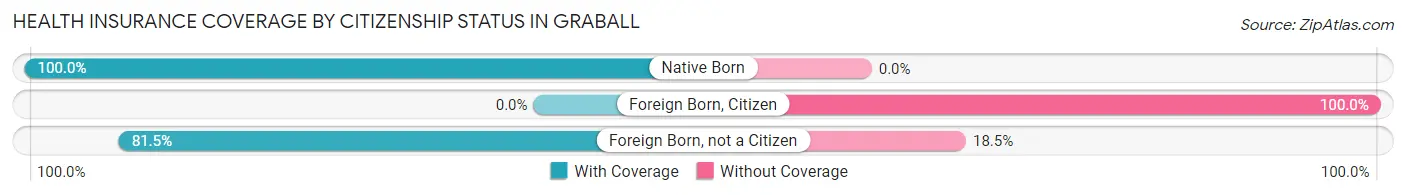
| Citizenship Status | With Coverage | Without Coverage |
| Native Born | 9 (100.0%) | 0 (0.0%) |
| Foreign Born, Citizen | 0 (0.0%) | 7 (100.0%) |
| Foreign Born, not a Citizen | 22 (81.5%) | 5 (18.5%) |
Health Insurance Coverage by Household Income in Graball
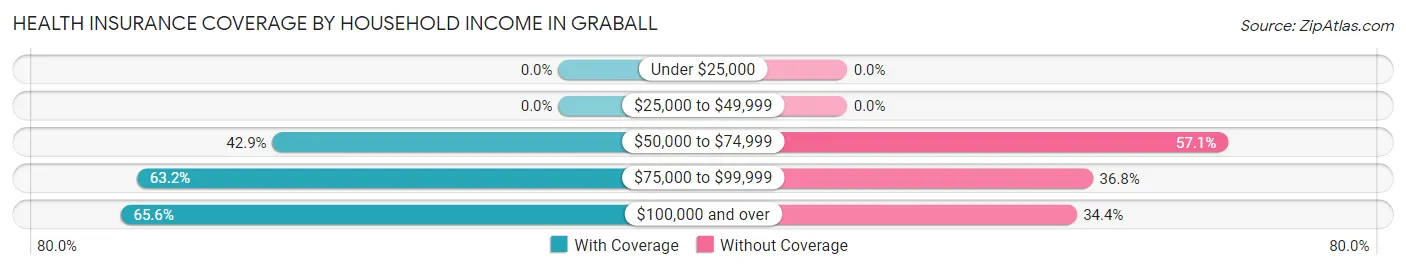
| Household Income | With Coverage | Without Coverage |
| Under $25,000 | 0 (0.0%) | 0 (0.0%) |
| $25,000 to $49,999 | 0 (0.0%) | 0 (0.0%) |
| $50,000 to $74,999 | 9 (42.9%) | 12 (57.1%) |
| $75,000 to $99,999 | 36 (63.2%) | 21 (36.8%) |
| $100,000 and over | 42 (65.6%) | 22 (34.4%) |
Public vs Private Health Insurance Coverage by Age in Graball
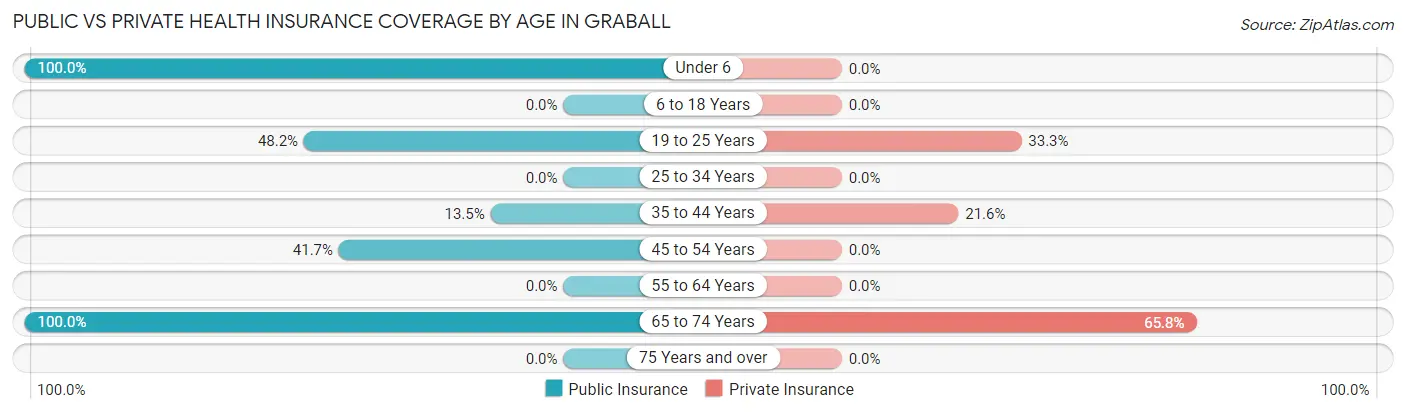
| Age Bracket | Public Insurance | Private Insurance |
| Under 6 | 9 (100.0%) | 0 (0.0%) |
| 6 to 18 Years | 0 (0.0%) | 0 (0.0%) |
| 19 to 25 Years | 13 (48.1%) | 9 (33.3%) |
| 25 to 34 Years | 0 (0.0%) | 0 (0.0%) |
| 35 to 44 Years | 5 (13.5%) | 8 (21.6%) |
| 45 to 54 Years | 5 (41.7%) | 0 (0.0%) |
| 55 to 64 Years | 0 (0.0%) | 0 (0.0%) |
| 65 to 74 Years | 38 (100.0%) | 25 (65.8%) |
| 75 Years and over | 0 (0.0%) | 0 (0.0%) |
| Total | 70 (49.3%) | 42 (29.6%) |
Disability Status by Sex by Age in Graball
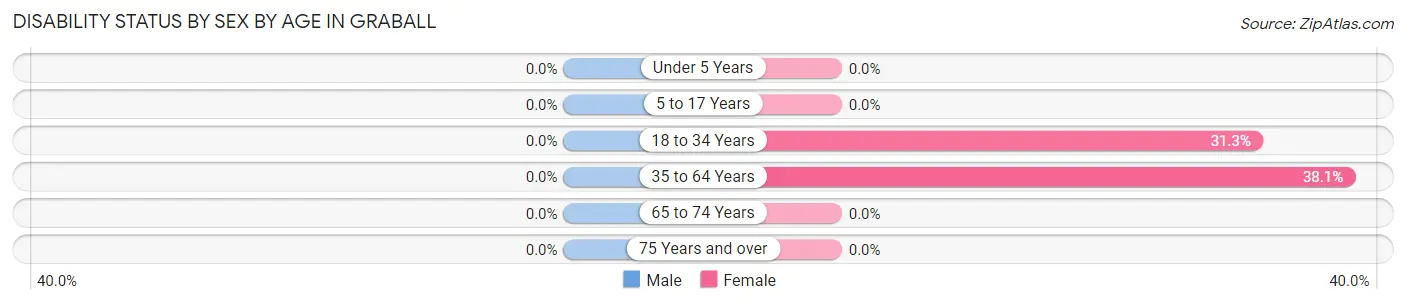
| Age Bracket | Male | Female |
| Under 5 Years | 0 (0.0%) | 0 (0.0%) |
| 5 to 17 Years | 0 (0.0%) | 0 (0.0%) |
| 18 to 34 Years | 0 (0.0%) | 5 (31.2%) |
| 35 to 64 Years | 0 (0.0%) | 8 (38.1%) |
| 65 to 74 Years | 0 (0.0%) | 0 (0.0%) |
| 75 Years and over | 0 (0.0%) | 0 (0.0%) |
Disability Class by Sex by Age in Graball
Disability Class: Hearing Difficulty
| Age Bracket | Male | Female |
| Under 5 Years | 0 (0.0%) | 0 (0.0%) |
| 5 to 17 Years | 0 (0.0%) | 0 (0.0%) |
| 18 to 34 Years | 0 (0.0%) | 0 (0.0%) |
| 35 to 64 Years | 0 (0.0%) | 0 (0.0%) |
| 65 to 74 Years | 0 (0.0%) | 0 (0.0%) |
| 75 Years and over | 0 (0.0%) | 0 (0.0%) |
Disability Class: Vision Difficulty
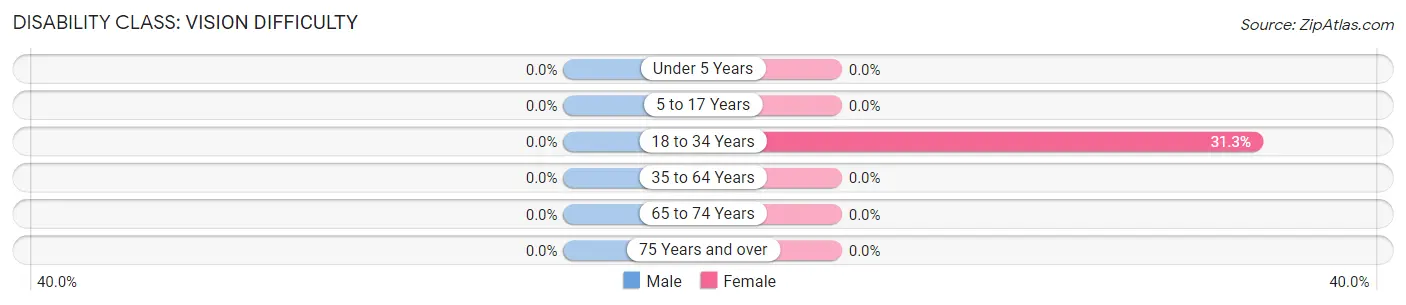
| Age Bracket | Male | Female |
| Under 5 Years | 0 (0.0%) | 0 (0.0%) |
| 5 to 17 Years | 0 (0.0%) | 0 (0.0%) |
| 18 to 34 Years | 0 (0.0%) | 5 (31.2%) |
| 35 to 64 Years | 0 (0.0%) | 0 (0.0%) |
| 65 to 74 Years | 0 (0.0%) | 0 (0.0%) |
| 75 Years and over | 0 (0.0%) | 0 (0.0%) |
Disability Class: Cognitive Difficulty

| Age Bracket | Male | Female |
| 5 to 17 Years | 0 (0.0%) | 0 (0.0%) |
| 18 to 34 Years | 0 (0.0%) | 0 (0.0%) |
| 35 to 64 Years | 0 (0.0%) | 0 (0.0%) |
| 65 to 74 Years | 0 (0.0%) | 0 (0.0%) |
| 75 Years and over | 0 (0.0%) | 0 (0.0%) |
Disability Class: Ambulatory Difficulty
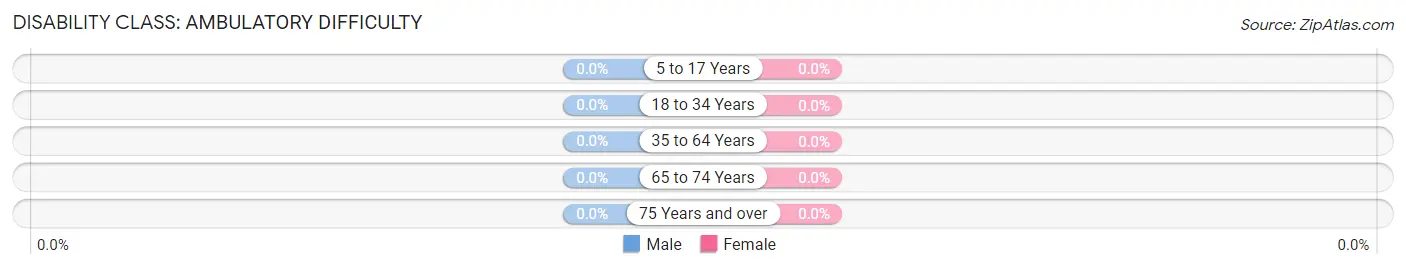
| Age Bracket | Male | Female |
| 5 to 17 Years | 0 (0.0%) | 0 (0.0%) |
| 18 to 34 Years | 0 (0.0%) | 0 (0.0%) |
| 35 to 64 Years | 0 (0.0%) | 0 (0.0%) |
| 65 to 74 Years | 0 (0.0%) | 0 (0.0%) |
| 75 Years and over | 0 (0.0%) | 0 (0.0%) |
Disability Class: Self-Care Difficulty
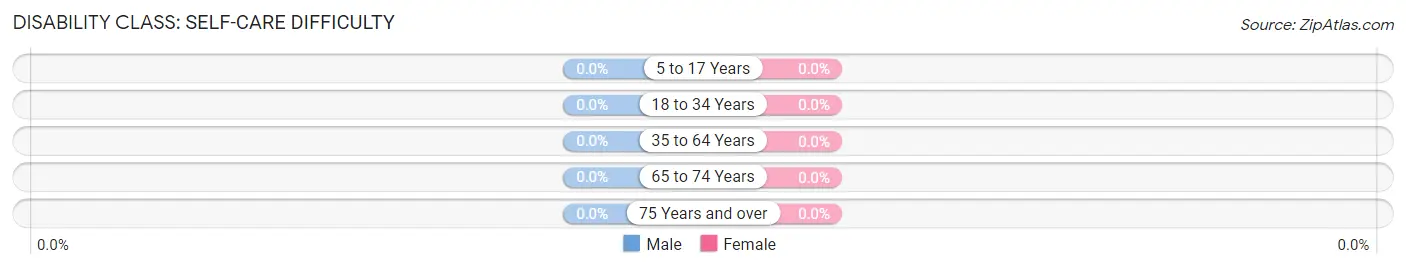
| Age Bracket | Male | Female |
| 5 to 17 Years | 0 (0.0%) | 0 (0.0%) |
| 18 to 34 Years | 0 (0.0%) | 0 (0.0%) |
| 35 to 64 Years | 0 (0.0%) | 0 (0.0%) |
| 65 to 74 Years | 0 (0.0%) | 0 (0.0%) |
| 75 Years and over | 0 (0.0%) | 0 (0.0%) |
Technology Access in Graball
Computing Device Access in Graball
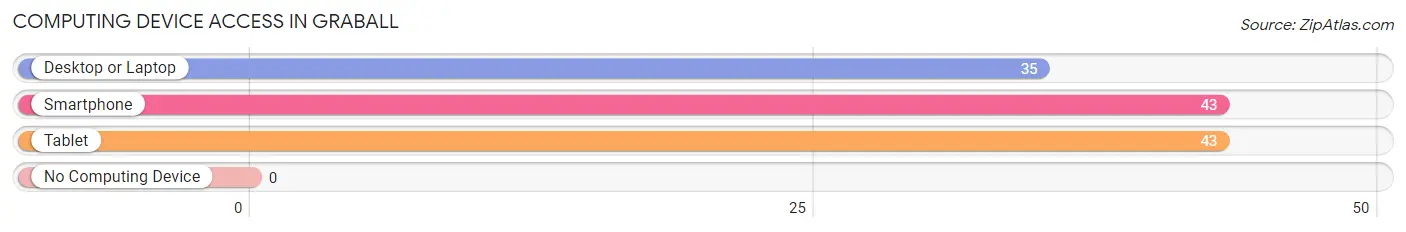
| Device Type | # Households | % Households |
| Desktop or Laptop | 35 | 81.4% |
| Smartphone | 43 | 100.0% |
| Tablet | 43 | 100.0% |
| No Computing Device | 0 | 0.0% |
| Total | 43 | 100.0% |
Internet Access in Graball
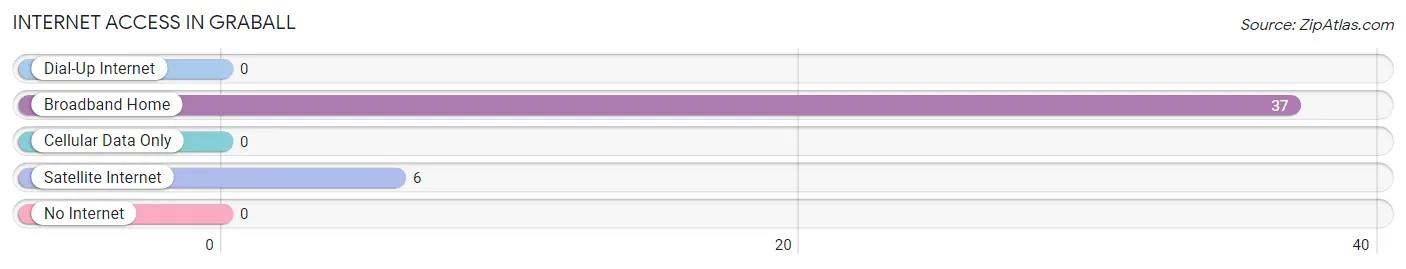
| Internet Type | # Households | % Households |
| Dial-Up Internet | 0 | 0.0% |
| Broadband Home | 37 | 86.1% |
| Cellular Data Only | 0 | 0.0% |
| Satellite Internet | 6 | 14.0% |
| No Internet | 0 | 0.0% |
| Total | 43 | 100.0% |
Graball Summary
TN History
Tennessee is a state located in the southeastern United States. It was admitted to the Union as the 16th state on June 1, 1796. Tennessee is known as the “Volunteer State” due to the large number of volunteers who fought in the War of 1812. Tennessee was the last state to secede from the Union and join the Confederacy during the Civil War.
The first inhabitants of Tennessee were Native Americans, including the Cherokee, Chickasaw, and Shawnee. The first Europeans to explore the area were Spanish explorers in the 16th century. The first permanent European settlement in Tennessee was established in 1756 by James Robertson and John Donelson.
Tennessee was part of the Southwest Territory until it was admitted to the Union in 1796. During the early 19th century, Tennessee was a slave state and was the site of several battles during the Civil War. After the war, Tennessee was the first state to be readmitted to the Union.
Tennessee has a rich history of music, including country, blues, and rock and roll. The state is also home to the Great Smoky Mountains National Park, the most visited national park in the United States.
Geography
Tennessee is located in the southeastern United States, bordered by Kentucky and Virginia to the north, North Carolina to the east, Georgia, Alabama, and Mississippi to the south, and Arkansas and Missouri to the west. The state has three distinct geographic regions: the Blue Ridge Mountains in the east, the Appalachian Mountains in the middle, and the Gulf Coastal Plain in the west.
The highest point in Tennessee is Clingmans Dome, which is located in the Great Smoky Mountains National Park and has an elevation of 6,643 feet (2,025 m). The lowest point in the state is the Mississippi River, which has an elevation of 178 feet (54 m).
Tennessee has a humid subtropical climate, with hot, humid summers and mild winters. The average annual temperature is 57°F (14°C). The state receives an average of 50 inches (127 cm) of precipitation per year.
Economy
Tennessee has a diverse economy, with a mix of agriculture, manufacturing, and services. The state’s largest industries are automotive manufacturing, tourism, and agriculture.
Agriculture is an important part of the state’s economy, with crops such as cotton, soybeans, corn, and tobacco being grown. Livestock, including cattle, hogs, and poultry, are also important to the state’s agricultural industry.
Manufacturing is another important part of the state’s economy, with products such as automobiles, chemicals, and textiles being produced. Tennessee is also home to several large corporations, including FedEx, AutoZone, and International Paper.
Tourism is also an important part of the state’s economy, with visitors coming to see the Great Smoky Mountains National Park, the Tennessee Aquarium, and other attractions.
Demographics
As of 2019, the population of Tennessee was estimated to be 6.8 million. The state has a population density of 154 people per square mile (59 people per square kilometer).
The largest city in Tennessee is Memphis, with a population of 651,073. Other major cities include Nashville (615,782), Knoxville (187,347), and Chattanooga (179,139).
The racial makeup of Tennessee is 73.3% White, 17.2% Black or African American, 1.7% Asian, 0.3% Native American, and 0.1% Pacific Islander. The state also has a large Hispanic or Latino population, making up 6.7% of the population.
The median household income in Tennessee is $48,547, and the median home value is $164,800. The state’s unemployment rate is 3.7%.
Common Questions
What is Per Capita Income in Graball?
Per Capita income in Graball is $34,244.
What is the Median Family Income in Graball?
Median Family Income in Graball is $117,639.
What is the Median Household income in Graball?
Median Household Income in Graball is $117,639.
What is Income or Wage Gap in Graball?
Income or Wage Gap in Graball is 2.8%.
Women in Graball earn 97.2 cents for every dollar earned by a man.
What is Inequality or Gini Index in Graball?
Inequality or Gini Index in Graball is 0.16.
What is the Total Population of Graball?
Total Population of Graball is 142.
What is the Total Male Population of Graball?
Total Male Population of Graball is 69.
What is the Total Female Population of Graball?
Total Female Population of Graball is 73.
What is the Ratio of Males per 100 Females in Graball?
There are 94.52 Males per 100 Females in Graball.
What is the Ratio of Females per 100 Males in Graball?
There are 105.80 Females per 100 Males in Graball.
What is the Median Population Age in Graball?
Median Population Age in Graball is 44.1 Years.
What is the Average Family Size in Graball
Average Family Size in Graball is 3.3 People.
What is the Average Household Size in Graball
Average Household Size in Graball is 3.3 People.
How Large is the Labor Force in Graball?
There are 85 People in the Labor Forcein in Graball.
What is the Percentage of People in the Labor Force in Graball?
67.5% of People are in the Labor Force in Graball.
What is the Unemployment Rate in Graball?
Unemployment Rate in Graball is 16.5%.