McKenzie, TN Map & Demographics
McKenzie Map
McKenzie Overview
$23,433
PER CAPITA INCOME
$75,776
AVG FAMILY INCOME
$38,628
AVG HOUSEHOLD INCOME
9.5%
WAGE / INCOME GAP [ % ]
90.5¢/ $1
WAGE / INCOME GAP [ $ ]
0.47
INEQUALITY / GINI INDEX
5,608
TOTAL POPULATION
2,765
MALE POPULATION
2,843
FEMALE POPULATION
97.26
MALES / 100 FEMALES
102.82
FEMALES / 100 MALES
36.9
MEDIAN AGE
3.1
AVG FAMILY SIZE
2.4
AVG HOUSEHOLD SIZE
2,462
LABOR FORCE [ PEOPLE ]
53.2%
PERCENT IN LABOR FORCE
5.0%
UNEMPLOYMENT RATE
Income in McKenzie
Income Overview in McKenzie
Per Capita Income in McKenzie is $23,433, while median incomes of families and households are $75,776 and $38,628 respectively.
| Characteristic | Number | Measure |
| Per Capita Income | 5,608 | $23,433 |
| Median Family Income | 1,194 | $75,776 |
| Mean Family Income | 1,194 | $82,296 |
| Median Household Income | 2,063 | $38,628 |
| Mean Household Income | 2,063 | $59,673 |
| Income Deficit | 1,194 | $0 |
| Wage / Income Gap (%) | 5,608 | 9.50% |
| Wage / Income Gap ($) | 5,608 | 90.50¢ per $1 |
| Gini / Inequality Index | 5,608 | 0.47 |
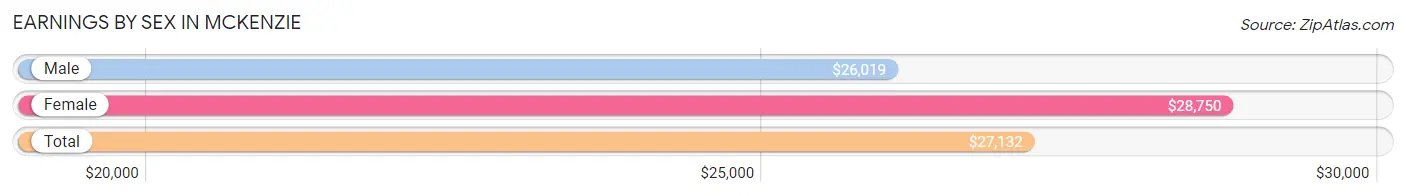
Earnings by Sex in McKenzie
Average Earnings in McKenzie are $27,132, $26,019 for men and $28,750 for women, a difference of 9.5%.
| Sex | Number | Average Earnings |
| Male | 1,360 (53.2%) | $26,019 |
| Female | 1,194 (46.8%) | $28,750 |
| Total | 2,554 (100.0%) | $27,132 |
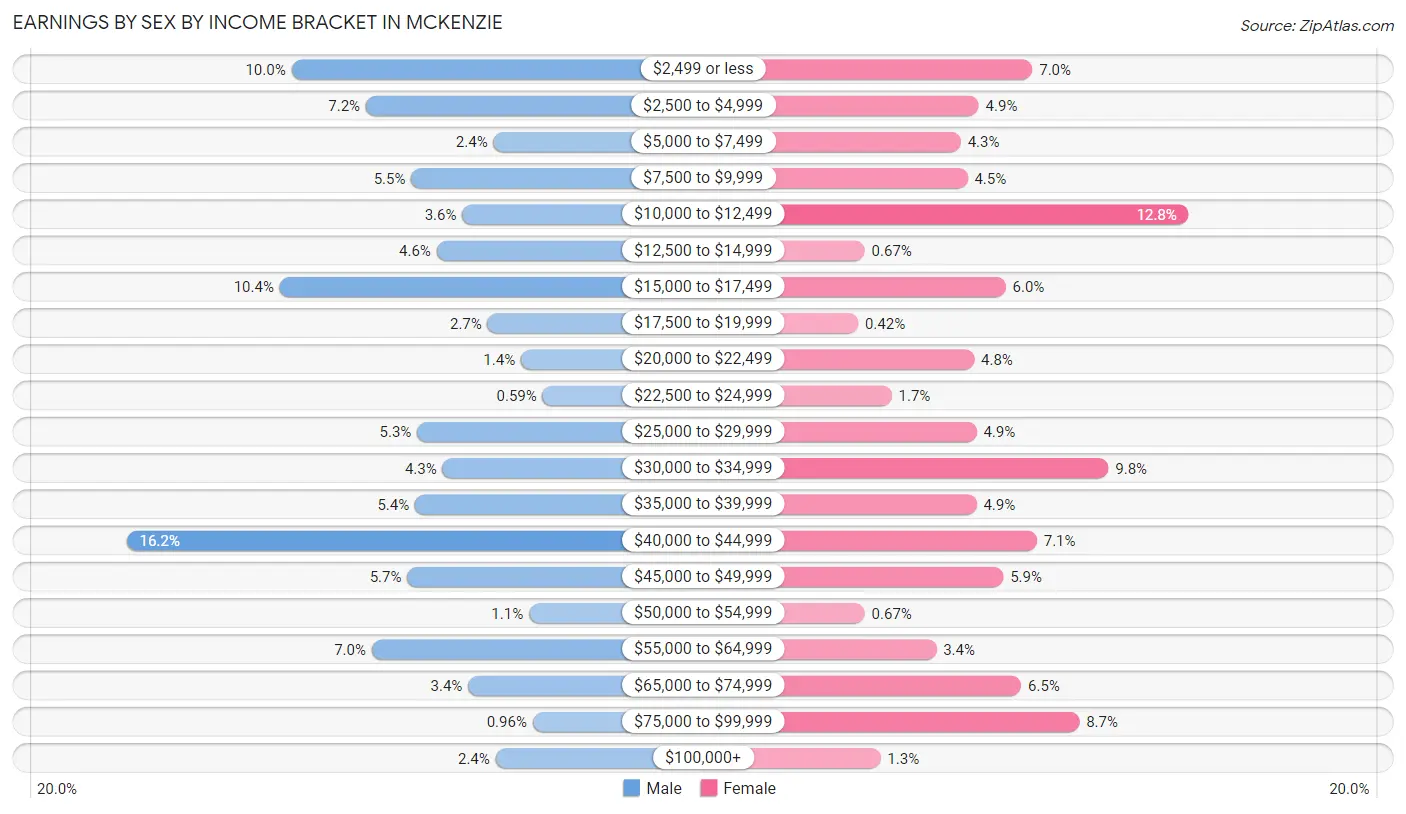
Earnings by Sex by Income Bracket in McKenzie
The most common earnings brackets in McKenzie are $40,000 to $44,999 for men (220 | 16.2%) and $10,000 to $12,499 for women (153 | 12.8%).
| Income | Male | Female |
| $2,499 or less | 136 (10.0%) | 83 (7.0%) |
| $2,500 to $4,999 | 98 (7.2%) | 59 (4.9%) |
| $5,000 to $7,499 | 33 (2.4%) | 51 (4.3%) |
| $7,500 to $9,999 | 75 (5.5%) | 54 (4.5%) |
| $10,000 to $12,499 | 49 (3.6%) | 153 (12.8%) |
| $12,500 to $14,999 | 62 (4.6%) | 8 (0.7%) |
| $15,000 to $17,499 | 142 (10.4%) | 71 (5.9%) |
| $17,500 to $19,999 | 36 (2.6%) | 5 (0.4%) |
| $20,000 to $22,499 | 19 (1.4%) | 57 (4.8%) |
| $22,500 to $24,999 | 8 (0.6%) | 20 (1.7%) |
| $25,000 to $29,999 | 72 (5.3%) | 58 (4.9%) |
| $30,000 to $34,999 | 59 (4.3%) | 117 (9.8%) |
| $35,000 to $39,999 | 73 (5.4%) | 58 (4.9%) |
| $40,000 to $44,999 | 220 (16.2%) | 85 (7.1%) |
| $45,000 to $49,999 | 77 (5.7%) | 70 (5.9%) |
| $50,000 to $54,999 | 15 (1.1%) | 8 (0.7%) |
| $55,000 to $64,999 | 95 (7.0%) | 40 (3.4%) |
| $65,000 to $74,999 | 46 (3.4%) | 78 (6.5%) |
| $75,000 to $99,999 | 13 (1.0%) | 104 (8.7%) |
| $100,000+ | 32 (2.4%) | 15 (1.3%) |
| Total | 1,360 (100.0%) | 1,194 (100.0%) |
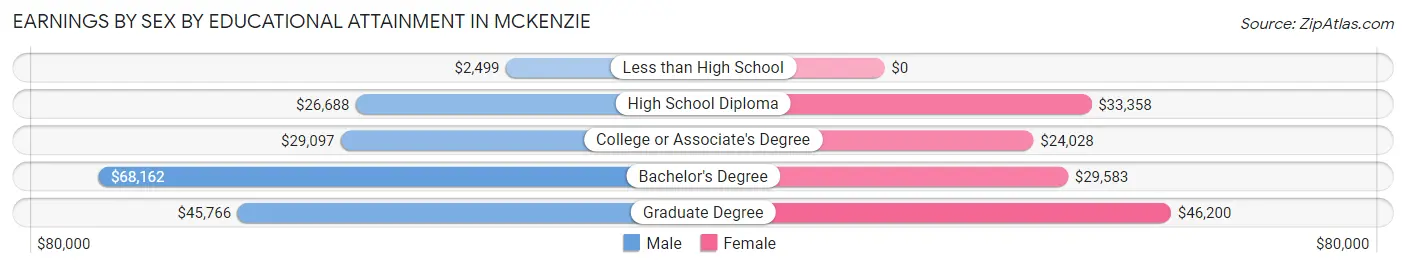
Earnings by Sex by Educational Attainment in McKenzie
Average earnings in McKenzie are $39,692 for men and $32,860 for women, a difference of 17.2%. Men with an educational attainment of bachelor's degree enjoy the highest average annual earnings of $68,162, while those with less than high school education earn the least with $2,499. Women with an educational attainment of graduate degree earn the most with the average annual earnings of $46,200, while those with college or associate's degree education have the smallest earnings of $24,028.
| Educational Attainment | Male Income | Female Income |
| Less than High School | $2,499 | $0 |
| High School Diploma | $26,688 | $33,358 |
| College or Associate's Degree | $29,097 | $24,028 |
| Bachelor's Degree | $68,162 | $29,583 |
| Graduate Degree | $45,766 | $46,200 |
| Total | $39,692 | $32,860 |
Family Income in McKenzie
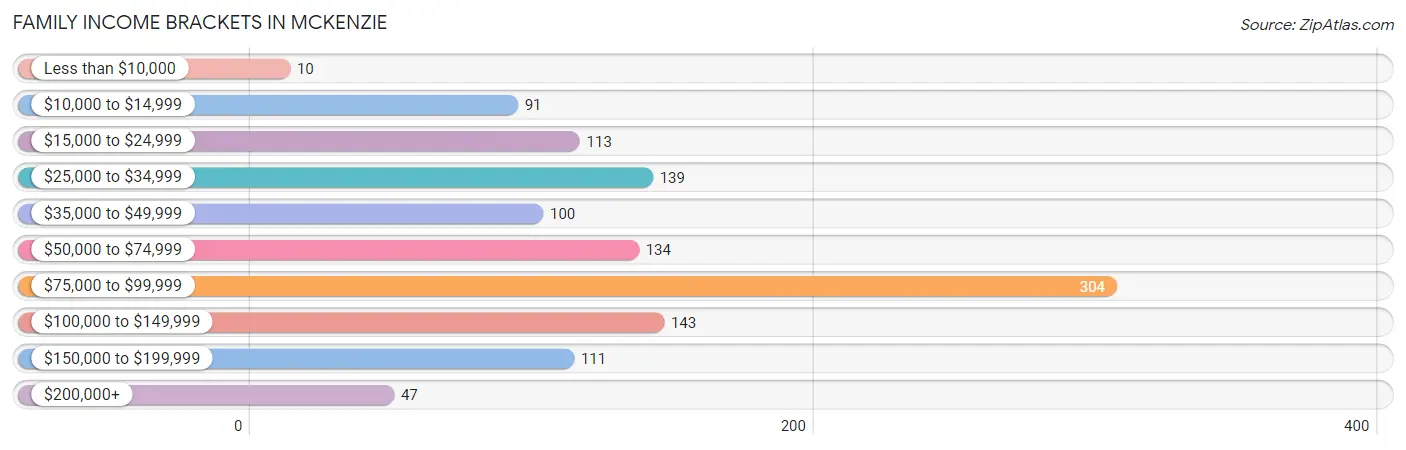
Family Income Brackets in McKenzie
According to the McKenzie family income data, there are 304 families falling into the $75,000 to $99,999 income range, which is the most common income bracket and makes up 25.5% of all families. Conversely, the less than $10,000 income bracket is the least frequent group with only 10 families (0.8%) belonging to this category.
| Income Bracket | # Families | % Families |
| Less than $10,000 | 10 | 0.8% |
| $10,000 to $14,999 | 91 | 7.6% |
| $15,000 to $24,999 | 113 | 9.5% |
| $25,000 to $34,999 | 139 | 11.6% |
| $35,000 to $49,999 | 100 | 8.4% |
| $50,000 to $74,999 | 134 | 11.2% |
| $75,000 to $99,999 | 304 | 25.5% |
| $100,000 to $149,999 | 143 | 12.0% |
| $150,000 to $199,999 | 111 | 9.3% |
| $200,000+ | 47 | 3.9% |
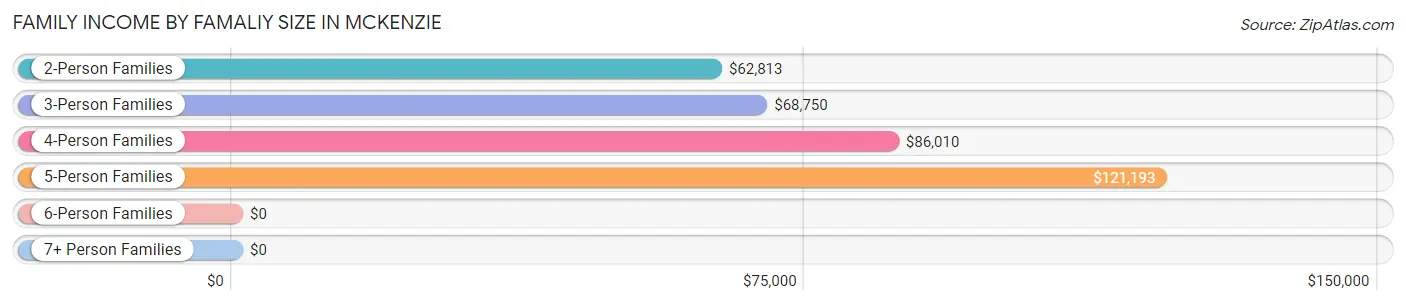
Family Income by Famaliy Size in McKenzie
5-person families (39 | 3.3%) account for the highest median family income in McKenzie with $121,193 per family, while 2-person families (586 | 49.1%) have the highest median income of $31,406 per family member.
| Income Bracket | # Families | Median Income |
| 2-Person Families | 586 (49.1%) | $62,813 |
| 3-Person Families | 201 (16.8%) | $68,750 |
| 4-Person Families | 343 (28.7%) | $86,010 |
| 5-Person Families | 39 (3.3%) | $121,193 |
| 6-Person Families | 25 (2.1%) | $0 |
| 7+ Person Families | 0 (0.0%) | $0 |
| Total | 1,194 (100.0%) | $75,776 |
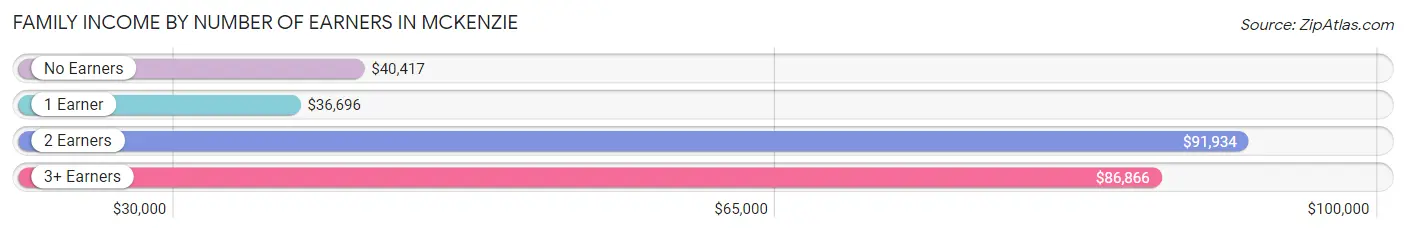
Family Income by Number of Earners in McKenzie
The median family income in McKenzie is $75,776, with families comprising 2 earners (307) having the highest median family income of $91,934, while families with 1 earner (491) have the lowest median family income of $36,696, accounting for 25.7% and 41.1% of families, respectively.
| Number of Earners | # Families | Median Income |
| No Earners | 225 (18.8%) | $40,417 |
| 1 Earner | 491 (41.1%) | $36,696 |
| 2 Earners | 307 (25.7%) | $91,934 |
| 3+ Earners | 171 (14.3%) | $86,866 |
| Total | 1,194 (100.0%) | $75,776 |
Household Income in McKenzie
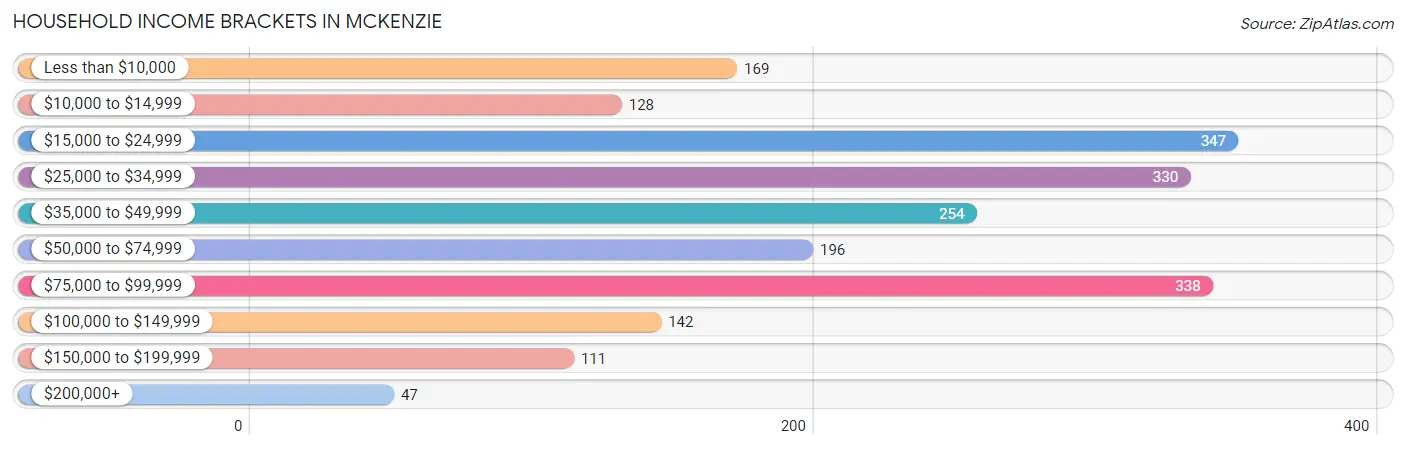
Household Income Brackets in McKenzie
With 347 households falling in the category, the $15,000 to $24,999 income range is the most frequent in McKenzie, accounting for 16.8% of all households. In contrast, only 47 households (2.3%) fall into the $200,000+ income bracket, making it the least populous group.
| Income Bracket | # Households | % Households |
| Less than $10,000 | 169 | 8.2% |
| $10,000 to $14,999 | 128 | 6.2% |
| $15,000 to $24,999 | 347 | 16.8% |
| $25,000 to $34,999 | 330 | 16.0% |
| $35,000 to $49,999 | 254 | 12.3% |
| $50,000 to $74,999 | 196 | 9.5% |
| $75,000 to $99,999 | 338 | 16.4% |
| $100,000 to $149,999 | 142 | 6.9% |
| $150,000 to $199,999 | 111 | 5.4% |
| $200,000+ | 47 | 2.3% |
Household Income by Householder Age in McKenzie
The median household income in McKenzie is $38,628, with the highest median household income of $64,167 found in the 45 to 64 years age bracket for the primary householder. A total of 668 households (32.4%) fall into this category. Meanwhile, the 15 to 24 years age bracket for the primary householder has the lowest median household income of $0, with 138 households (6.7%) in this group.
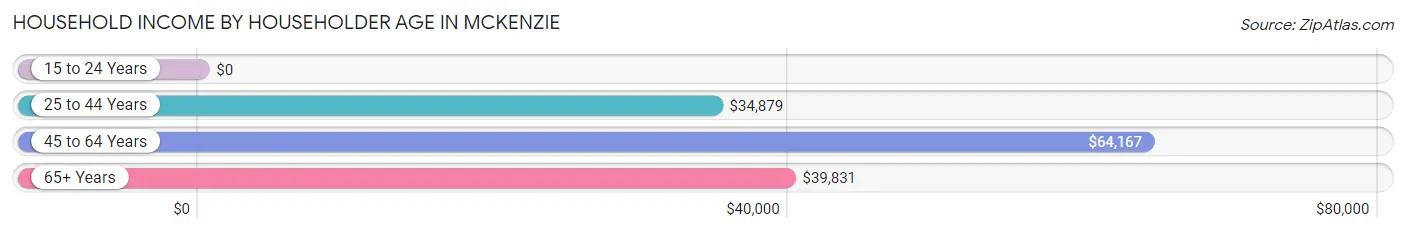
| Income Bracket | # Households | Median Income |
| 15 to 24 Years | 138 (6.7%) | $0 |
| 25 to 44 Years | 610 (29.6%) | $34,879 |
| 45 to 64 Years | 668 (32.4%) | $64,167 |
| 65+ Years | 647 (31.4%) | $39,831 |
| Total | 2,063 (100.0%) | $38,628 |
Poverty in McKenzie
Income Below Poverty by Sex and Age in McKenzie
With 15.9% poverty level for males and 18.7% for females among the residents of McKenzie, 12 to 14 year old males and 18 to 24 year old females are the most vulnerable to poverty, with 44 males (40.7%) and 171 females (78.4%) in their respective age groups living below the poverty level.
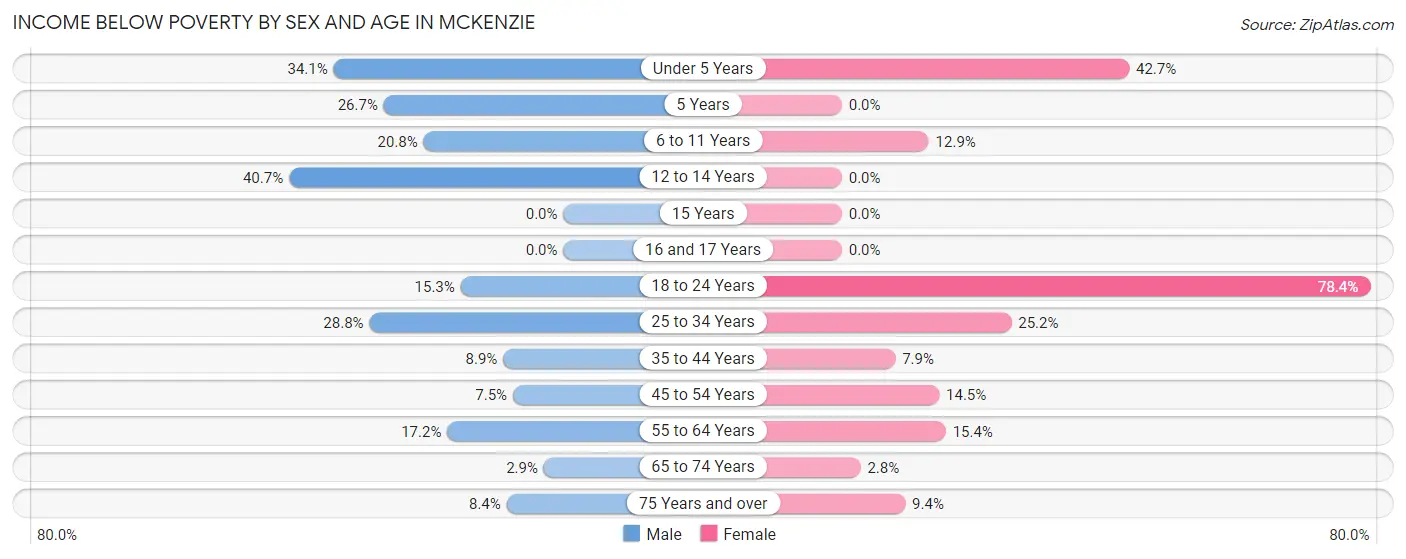
| Age Bracket | Male | Female |
| Under 5 Years | 72 (34.1%) | 29 (42.6%) |
| 5 Years | 8 (26.7%) | 0 (0.0%) |
| 6 to 11 Years | 33 (20.7%) | 16 (12.9%) |
| 12 to 14 Years | 44 (40.7%) | 0 (0.0%) |
| 15 Years | 0 (0.0%) | 0 (0.0%) |
| 16 and 17 Years | 0 (0.0%) | 0 (0.0%) |
| 18 to 24 Years | 47 (15.3%) | 171 (78.4%) |
| 25 to 34 Years | 89 (28.8%) | 72 (25.2%) |
| 35 to 44 Years | 20 (8.9%) | 18 (7.9%) |
| 45 to 54 Years | 23 (7.5%) | 50 (14.4%) |
| 55 to 64 Years | 50 (17.2%) | 56 (15.4%) |
| 65 to 74 Years | 7 (2.9%) | 8 (2.8%) |
| 75 Years and over | 17 (8.4%) | 24 (9.4%) |
| Total | 410 (15.9%) | 444 (18.7%) |
Income Above Poverty by Sex and Age in McKenzie
According to the poverty statistics in McKenzie, males aged 15 years and females aged 5 years are the age groups that are most secure financially, with 100.0% of males and 100.0% of females in these age groups living above the poverty line.
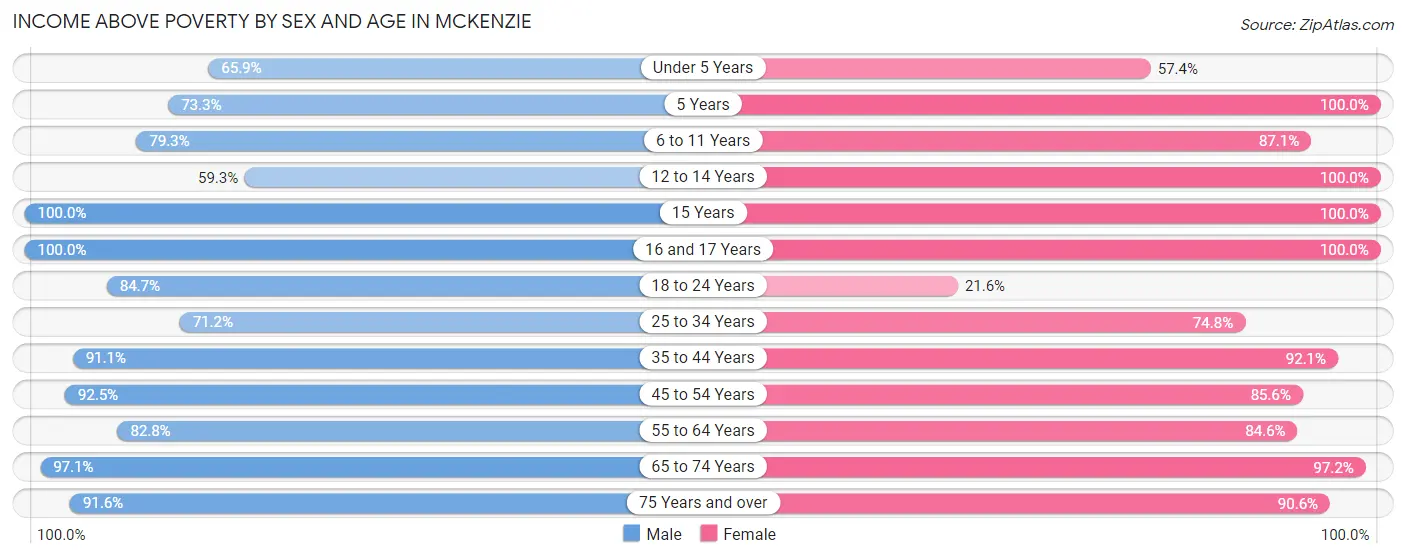
| Age Bracket | Male | Female |
| Under 5 Years | 139 (65.9%) | 39 (57.4%) |
| 5 Years | 22 (73.3%) | 36 (100.0%) |
| 6 to 11 Years | 126 (79.2%) | 108 (87.1%) |
| 12 to 14 Years | 64 (59.3%) | 88 (100.0%) |
| 15 Years | 115 (100.0%) | 41 (100.0%) |
| 16 and 17 Years | 80 (100.0%) | 39 (100.0%) |
| 18 to 24 Years | 261 (84.7%) | 47 (21.6%) |
| 25 to 34 Years | 220 (71.2%) | 214 (74.8%) |
| 35 to 44 Years | 204 (91.1%) | 209 (92.1%) |
| 45 to 54 Years | 284 (92.5%) | 296 (85.6%) |
| 55 to 64 Years | 240 (82.8%) | 307 (84.6%) |
| 65 to 74 Years | 234 (97.1%) | 281 (97.2%) |
| 75 Years and over | 185 (91.6%) | 231 (90.6%) |
| Total | 2,174 (84.1%) | 1,936 (81.3%) |
Income Below Poverty Among Married-Couple Families in McKenzie
The poverty statistics for married-couple families in McKenzie show that 4.4% or 36 of the total 826 families live below the poverty line. Families with no children have the highest poverty rate of 7.5%, comprising of 36 families. On the other hand, families with 1 or 2 children have the lowest poverty rate of 0.0%, which includes 0 families.
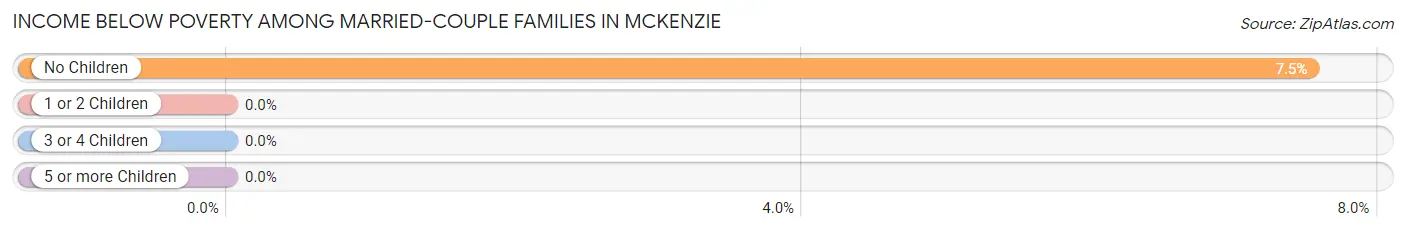
| Children | Above Poverty | Below Poverty |
| No Children | 442 (92.5%) | 36 (7.5%) |
| 1 or 2 Children | 332 (100.0%) | 0 (0.0%) |
| 3 or 4 Children | 16 (100.0%) | 0 (0.0%) |
| 5 or more Children | 0 (0.0%) | 0 (0.0%) |
| Total | 790 (95.6%) | 36 (4.4%) |
Income Below Poverty Among Single-Parent Households in McKenzie
According to the poverty data in McKenzie, 24.4% or 21 single-father households and 27.7% or 78 single-mother households are living below the poverty line. Among single-father households, those with 1 or 2 children have the highest poverty rate, with 10 households (50.0%) experiencing poverty. Likewise, among single-mother households, those with 3 or 4 children have the highest poverty rate, with 52 households (69.3%) falling below the poverty line.
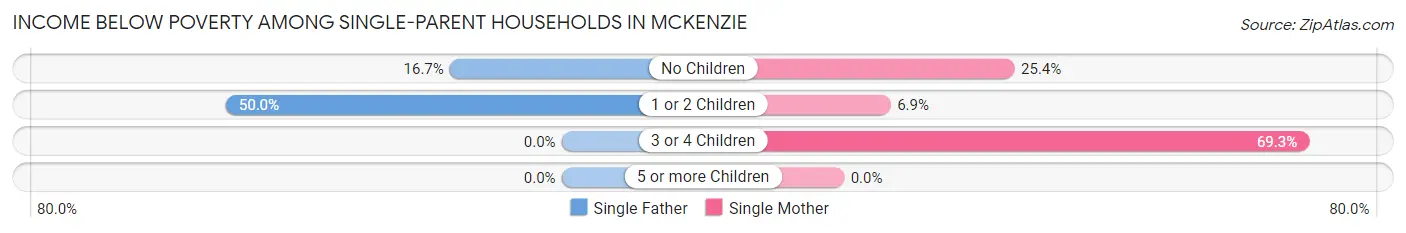
| Children | Single Father | Single Mother |
| No Children | 11 (16.7%) | 16 (25.4%) |
| 1 or 2 Children | 10 (50.0%) | 10 (6.9%) |
| 3 or 4 Children | 0 (0.0%) | 52 (69.3%) |
| 5 or more Children | 0 (0.0%) | 0 (0.0%) |
| Total | 21 (24.4%) | 78 (27.7%) |
Income Below Poverty Among Married-Couple vs Single-Parent Households in McKenzie
The poverty data for McKenzie shows that 36 of the married-couple family households (4.4%) and 99 of the single-parent households (26.9%) are living below the poverty level. Within the married-couple family households, those with no children have the highest poverty rate, with 36 households (7.5%) falling below the poverty line. Among the single-parent households, those with 3 or 4 children have the highest poverty rate, with 52 household (69.3%) living below poverty.
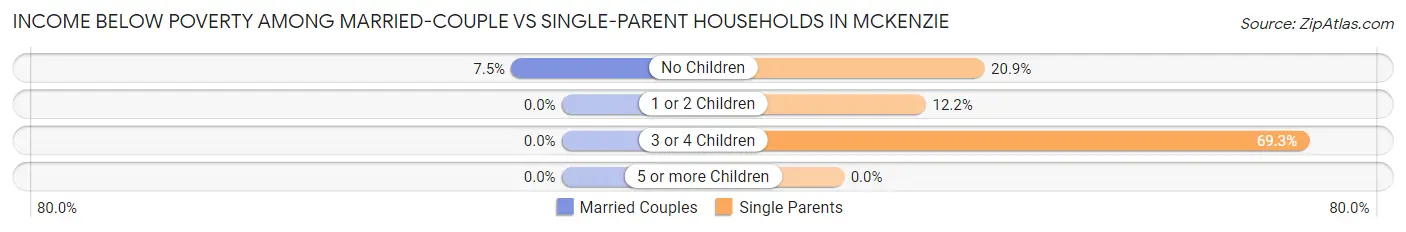
| Children | Married-Couple Families | Single-Parent Households |
| No Children | 36 (7.5%) | 27 (20.9%) |
| 1 or 2 Children | 0 (0.0%) | 20 (12.2%) |
| 3 or 4 Children | 0 (0.0%) | 52 (69.3%) |
| 5 or more Children | 0 (0.0%) | 0 (0.0%) |
| Total | 36 (4.4%) | 99 (26.9%) |
Race in McKenzie
The most populous races in McKenzie are White / Caucasian (4,399 | 78.4%), Black / African American (954 | 17.0%), and Hispanic or Latino (226 | 4.0%).
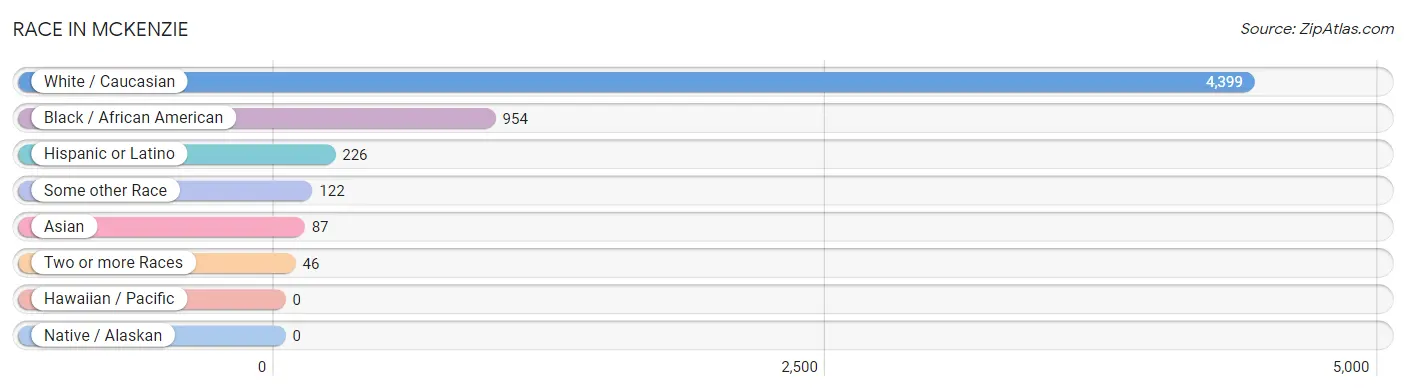
| Race | # Population | % Population |
| Asian | 87 | 1.5% |
| Black / African American | 954 | 17.0% |
| Hawaiian / Pacific | 0 | 0.0% |
| Hispanic or Latino | 226 | 4.0% |
| Native / Alaskan | 0 | 0.0% |
| White / Caucasian | 4,399 | 78.4% |
| Two or more Races | 46 | 0.8% |
| Some other Race | 122 | 2.2% |
| Total | 5,608 | 100.0% |
Ancestry in McKenzie
The most populous ancestries reported in McKenzie are American (1,770 | 31.6%), English (874 | 15.6%), German (506 | 9.0%), Irish (289 | 5.1%), and Mexican (191 | 3.4%), together accounting for 64.7% of all McKenzie residents.
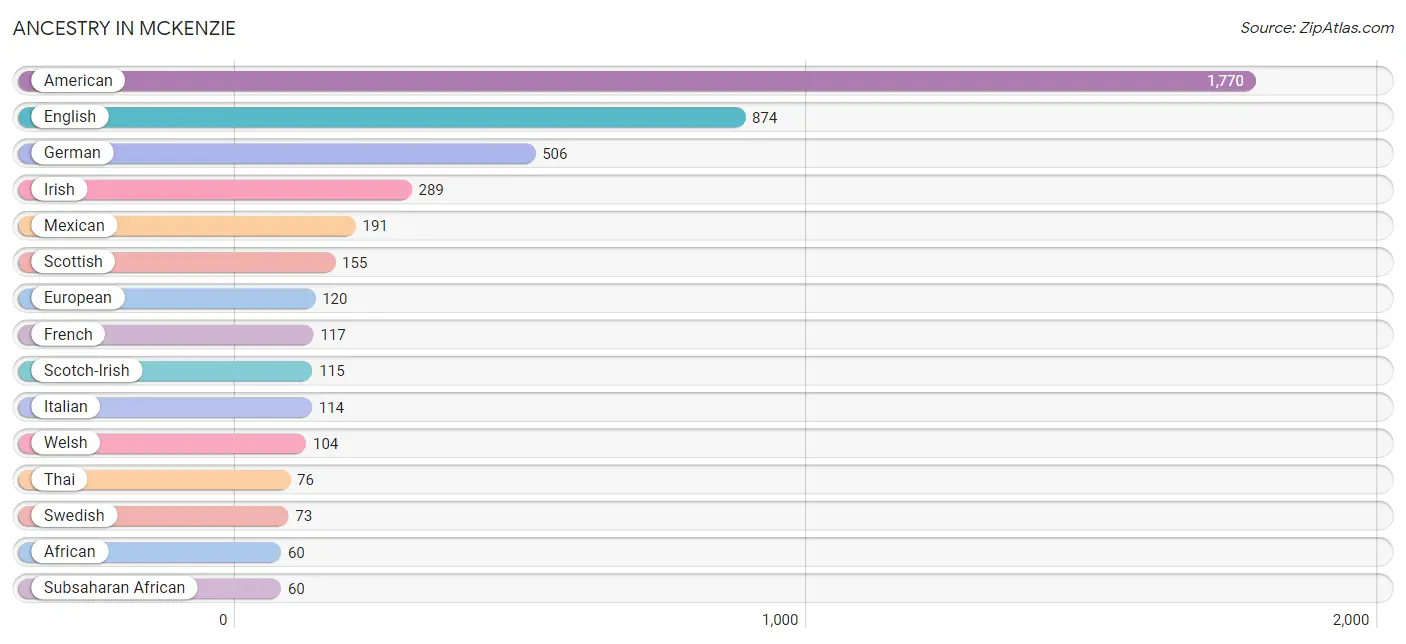
| Ancestry | # Population | % Population |
| African | 60 | 1.1% |
| American | 1,770 | 31.6% |
| Brazilian | 2 | 0.0% |
| Central American | 8 | 0.1% |
| Cherokee | 1 | 0.0% |
| Dutch | 33 | 0.6% |
| English | 874 | 15.6% |
| European | 120 | 2.1% |
| French | 117 | 2.1% |
| German | 506 | 9.0% |
| Greek | 9 | 0.2% |
| Irish | 289 | 5.1% |
| Italian | 114 | 2.0% |
| Korean | 11 | 0.2% |
| Mexican | 191 | 3.4% |
| Nicaraguan | 8 | 0.1% |
| Norwegian | 6 | 0.1% |
| Polish | 20 | 0.4% |
| Puerto Rican | 8 | 0.1% |
| Scandinavian | 11 | 0.2% |
| Scotch-Irish | 115 | 2.1% |
| Scottish | 155 | 2.8% |
| Subsaharan African | 60 | 1.1% |
| Swedish | 73 | 1.3% |
| Thai | 76 | 1.4% |
| Welsh | 104 | 1.8% |
| Yugoslavian | 18 | 0.3% | View All 27 Rows |
Immigrants in McKenzie
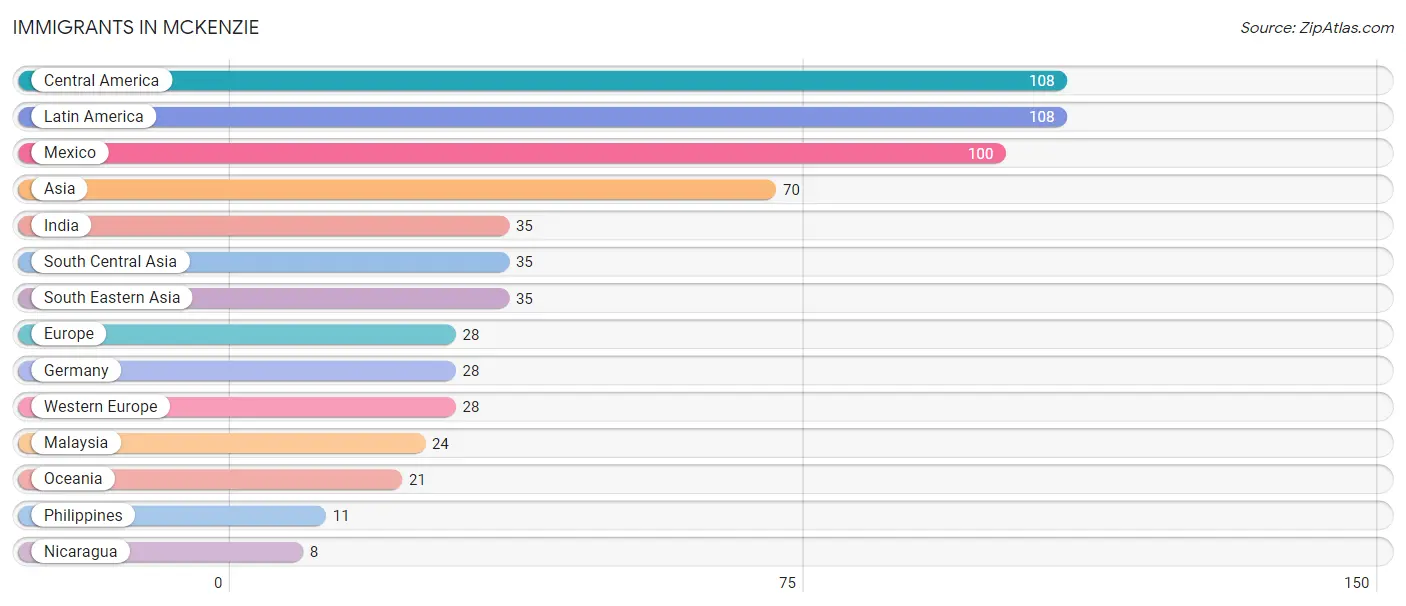
The most numerous immigrant groups reported in McKenzie came from Central America (108 | 1.9%), Latin America (108 | 1.9%), Mexico (100 | 1.8%), Asia (70 | 1.3%), and India (35 | 0.6%), together accounting for 7.5% of all McKenzie residents.
| Immigration Origin | # Population | % Population |
| Asia | 70 | 1.3% |
| Central America | 108 | 1.9% |
| Europe | 28 | 0.5% |
| Germany | 28 | 0.5% |
| India | 35 | 0.6% |
| Latin America | 108 | 1.9% |
| Malaysia | 24 | 0.4% |
| Mexico | 100 | 1.8% |
| Nicaragua | 8 | 0.1% |
| Oceania | 21 | 0.4% |
| Philippines | 11 | 0.2% |
| South Central Asia | 35 | 0.6% |
| South Eastern Asia | 35 | 0.6% |
| Western Europe | 28 | 0.5% | View All 14 Rows |
Sex and Age in McKenzie
Sex and Age in McKenzie
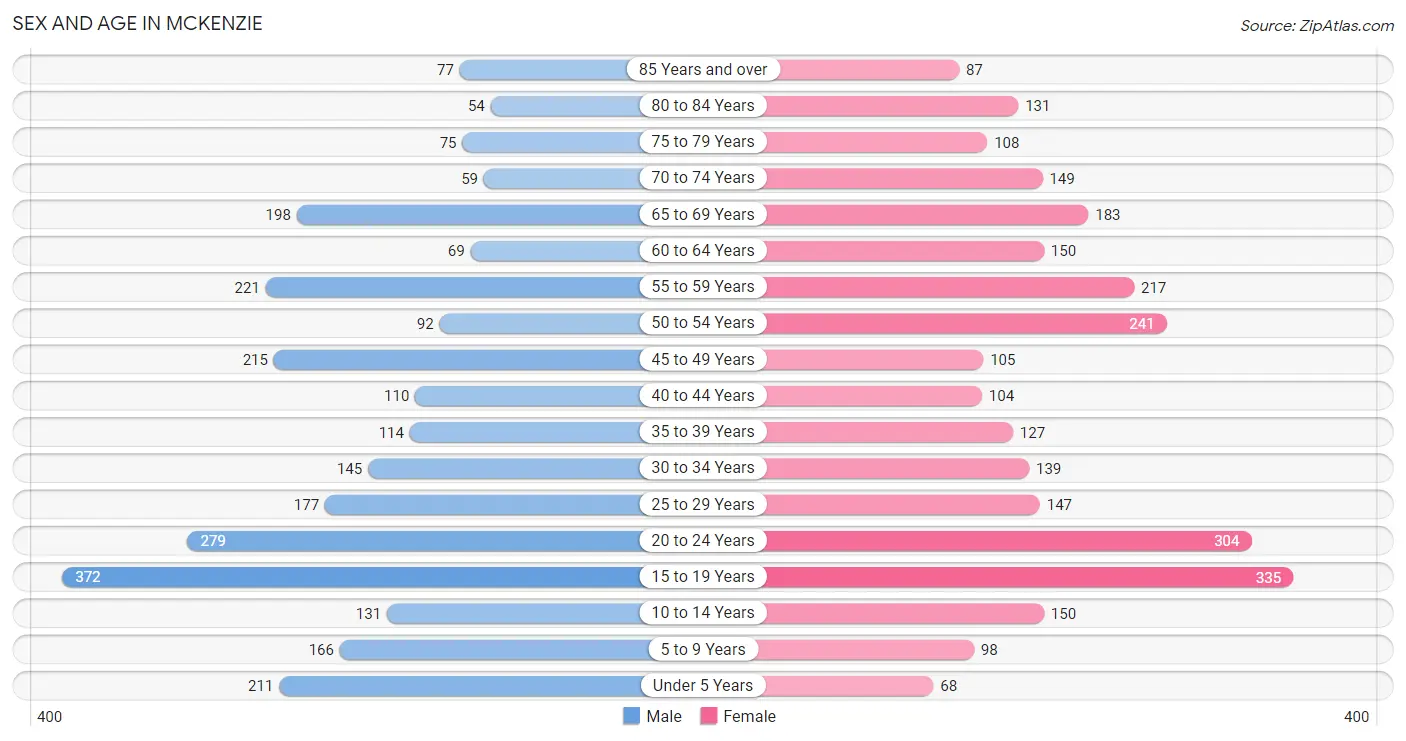
The most populous age groups in McKenzie are 15 to 19 Years (372 | 13.5%) for men and 15 to 19 Years (335 | 11.8%) for women.
| Age Bracket | Male | Female |
| Under 5 Years | 211 (7.6%) | 68 (2.4%) |
| 5 to 9 Years | 166 (6.0%) | 98 (3.5%) |
| 10 to 14 Years | 131 (4.7%) | 150 (5.3%) |
| 15 to 19 Years | 372 (13.5%) | 335 (11.8%) |
| 20 to 24 Years | 279 (10.1%) | 304 (10.7%) |
| 25 to 29 Years | 177 (6.4%) | 147 (5.2%) |
| 30 to 34 Years | 145 (5.2%) | 139 (4.9%) |
| 35 to 39 Years | 114 (4.1%) | 127 (4.5%) |
| 40 to 44 Years | 110 (4.0%) | 104 (3.7%) |
| 45 to 49 Years | 215 (7.8%) | 105 (3.7%) |
| 50 to 54 Years | 92 (3.3%) | 241 (8.5%) |
| 55 to 59 Years | 221 (8.0%) | 217 (7.6%) |
| 60 to 64 Years | 69 (2.5%) | 150 (5.3%) |
| 65 to 69 Years | 198 (7.2%) | 183 (6.4%) |
| 70 to 74 Years | 59 (2.1%) | 149 (5.2%) |
| 75 to 79 Years | 75 (2.7%) | 108 (3.8%) |
| 80 to 84 Years | 54 (1.9%) | 131 (4.6%) |
| 85 Years and over | 77 (2.8%) | 87 (3.1%) |
| Total | 2,765 (100.0%) | 2,843 (100.0%) |
Families and Households in McKenzie
Median Family Size in McKenzie
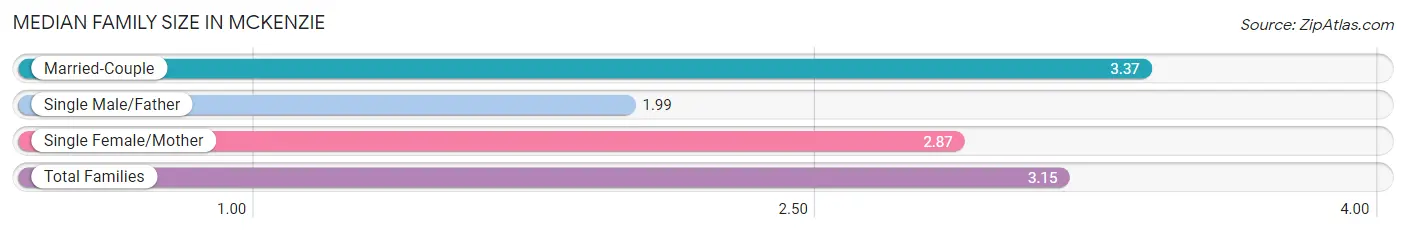
The median family size in McKenzie is 3.15 persons per family, with married-couple families (826 | 69.2%) accounting for the largest median family size of 3.37 persons per family. On the other hand, single male/father families (86 | 7.2%) represent the smallest median family size with 1.99 persons per family.
| Family Type | # Families | Family Size |
| Married-Couple | 826 (69.2%) | 3.37 |
| Single Male/Father | 86 (7.2%) | 1.99 |
| Single Female/Mother | 282 (23.6%) | 2.87 |
| Total Families | 1,194 (100.0%) | 3.15 |
Median Household Size in McKenzie
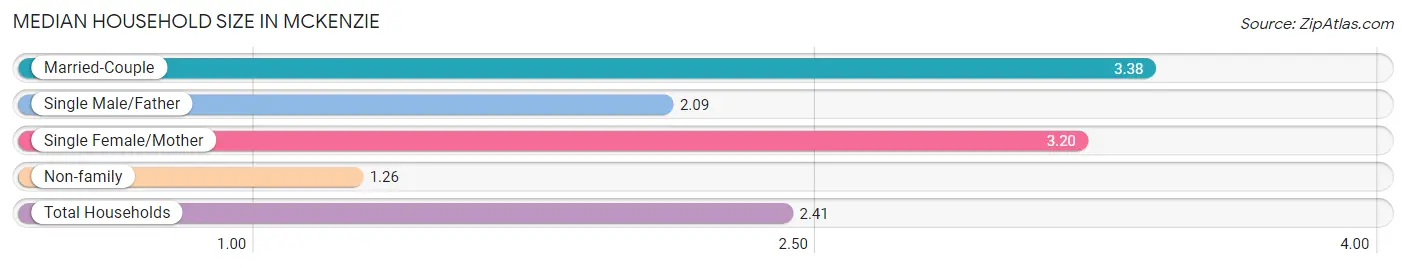
The median household size in McKenzie is 2.41 persons per household, with married-couple households (826 | 40.0%) accounting for the largest median household size of 3.38 persons per household. non-family households (869 | 42.1%) represent the smallest median household size with 1.26 persons per household.
| Household Type | # Households | Household Size |
| Married-Couple | 826 (40.0%) | 3.38 |
| Single Male/Father | 86 (4.2%) | 2.09 |
| Single Female/Mother | 282 (13.7%) | 3.20 |
| Non-family | 869 (42.1%) | 1.26 |
| Total Households | 2,063 (100.0%) | 2.41 |
Household Size by Marriage Status in McKenzie
Out of a total of 2,063 households in McKenzie, 1,194 (57.9%) are family households, while 869 (42.1%) are nonfamily households. The most numerous type of family households are 2-person households, comprising 536, and the most common type of nonfamily households are 1-person households, comprising 741.
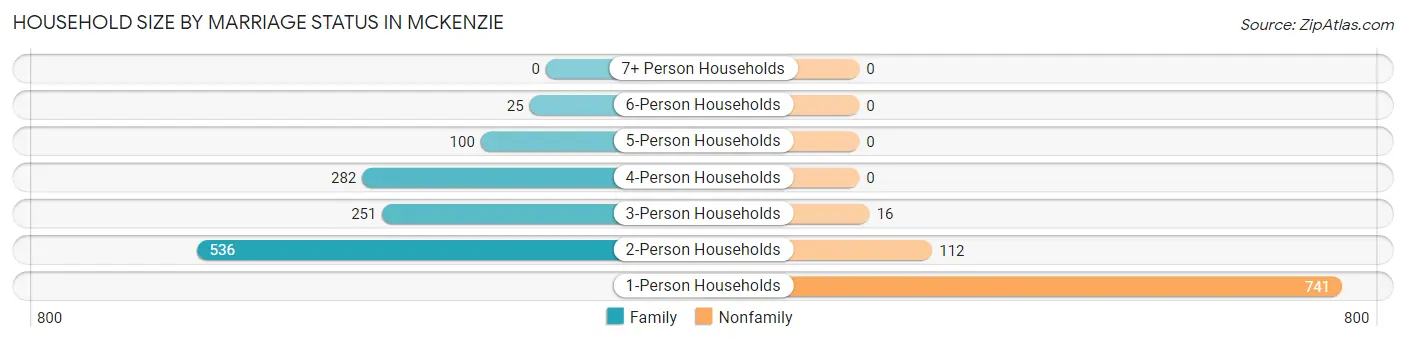
| Household Size | Family Households | Nonfamily Households |
| 1-Person Households | - | 741 (35.9%) |
| 2-Person Households | 536 (26.0%) | 112 (5.4%) |
| 3-Person Households | 251 (12.2%) | 16 (0.8%) |
| 4-Person Households | 282 (13.7%) | 0 (0.0%) |
| 5-Person Households | 100 (4.9%) | 0 (0.0%) |
| 6-Person Households | 25 (1.2%) | 0 (0.0%) |
| 7+ Person Households | 0 (0.0%) | 0 (0.0%) |
| Total | 1,194 (57.9%) | 869 (42.1%) |
Female Fertility in McKenzie
Fertility by Age in McKenzie
Average fertility rate in McKenzie is 61.0 births per 1,000 women. Women in the age bracket of 20 to 34 years have the highest fertility rate with 110.0 births per 1,000 women. Women in the age bracket of 20 to 34 years acount for 81.2% of all women with births.
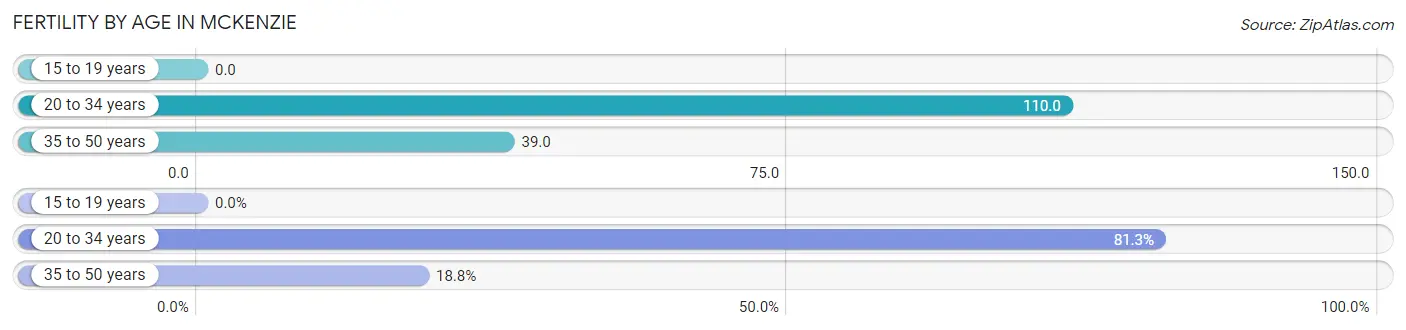
| Age Bracket | Women with Births | Births / 1,000 Women |
| 15 to 19 years | 0 (0.0%) | 0.0 |
| 20 to 34 years | 65 (81.2%) | 110.0 |
| 35 to 50 years | 15 (18.8%) | 39.0 |
| Total | 80 (100.0%) | 61.0 |
Fertility by Age by Marriage Status in McKenzie
26.3% of women with births (80) in McKenzie are married. The highest percentage of unmarried women with births falls into 35 to 50 years age bracket with 100.0% of them unmarried at the time of birth, while the lowest percentage of unmarried women with births belong to 20 to 34 years age bracket with 67.7% of them unmarried.
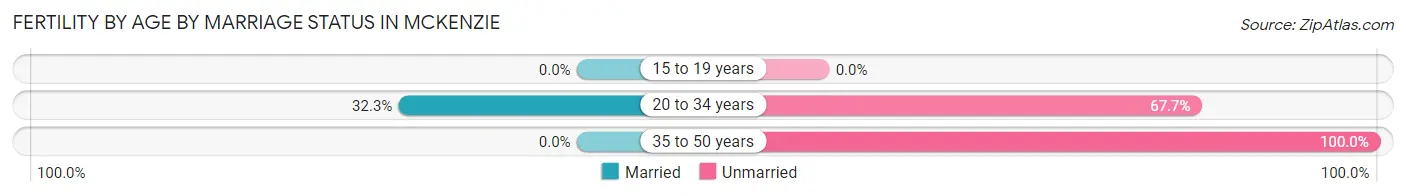
| Age Bracket | Married | Unmarried |
| 15 to 19 years | 0 (0.0%) | 0 (0.0%) |
| 20 to 34 years | 21 (32.3%) | 44 (67.7%) |
| 35 to 50 years | 0 (0.0%) | 15 (100.0%) |
| Total | 21 (26.3%) | 59 (73.8%) |
Fertility by Education in McKenzie
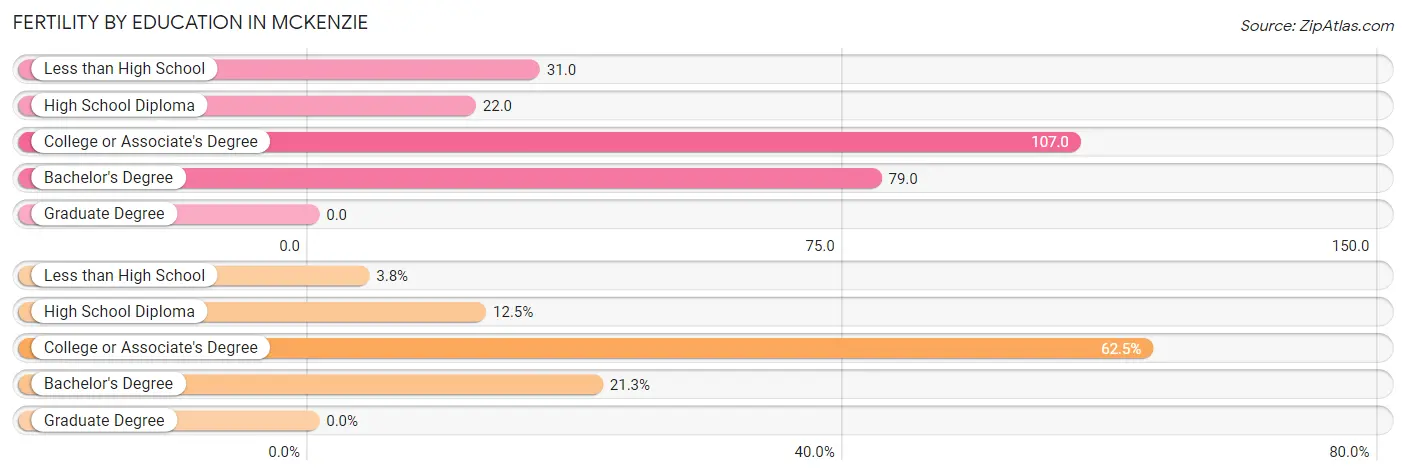
| Educational Attainment | Women with Births | Births / 1,000 Women |
| Less than High School | 3 (3.7%) | 31.0 |
| High School Diploma | 10 (12.5%) | 22.0 |
| College or Associate's Degree | 50 (62.5%) | 107.0 |
| Bachelor's Degree | 17 (21.2%) | 79.0 |
| Graduate Degree | 0 (0.0%) | 0.0 |
| Total | 80 (100.0%) | 61.0 |
Fertility by Education by Marriage Status in McKenzie
73.8% of women with births in McKenzie are unmarried. Women with the educational attainment of less than high school are most likely to be married with 100.0% of them married at childbirth, while women with the educational attainment of high school diploma are least likely to be married with 100.0% of them unmarried at childbirth.
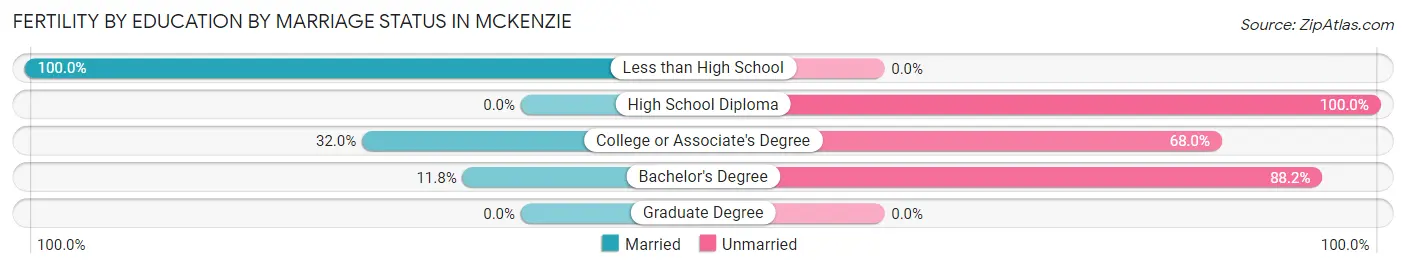
| Educational Attainment | Married | Unmarried |
| Less than High School | 3 (100.0%) | 0 (0.0%) |
| High School Diploma | 0 (0.0%) | 10 (100.0%) |
| College or Associate's Degree | 16 (32.0%) | 34 (68.0%) |
| Bachelor's Degree | 2 (11.8%) | 15 (88.2%) |
| Graduate Degree | 0 (0.0%) | 0 (0.0%) |
| Total | 21 (26.3%) | 59 (73.8%) |
Employment Characteristics in McKenzie
Employment by Class of Employer in McKenzie
Among the 2,186 employed individuals in McKenzie, private company employees (1,414 | 64.7%), state government employees (258 | 11.8%), and local government employees (200 | 9.1%) make up the most common classes of employment.
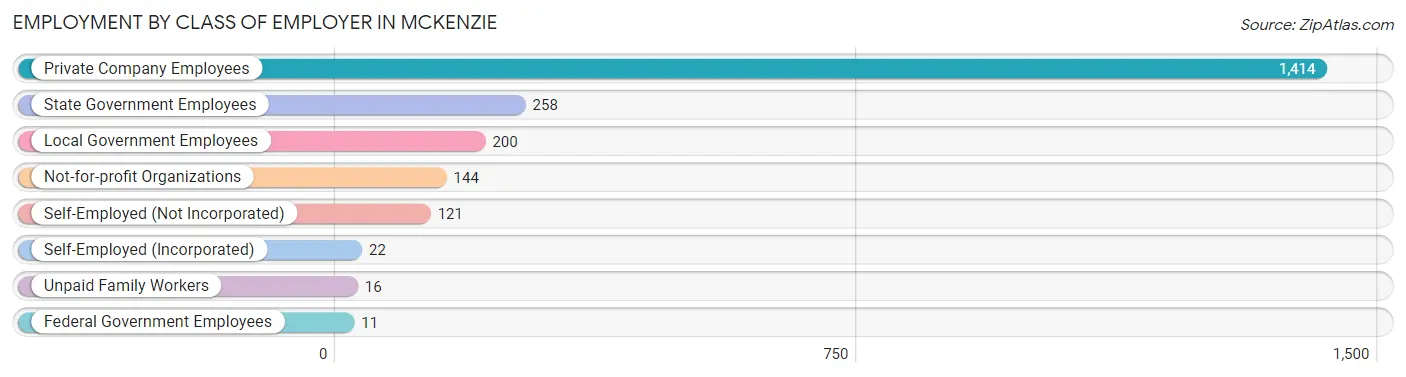
| Employer Class | # Employees | % Employees |
| Private Company Employees | 1,414 | 64.7% |
| Self-Employed (Incorporated) | 22 | 1.0% |
| Self-Employed (Not Incorporated) | 121 | 5.5% |
| Not-for-profit Organizations | 144 | 6.6% |
| Local Government Employees | 200 | 9.1% |
| State Government Employees | 258 | 11.8% |
| Federal Government Employees | 11 | 0.5% |
| Unpaid Family Workers | 16 | 0.7% |
| Total | 2,186 | 100.0% |
Employment Status by Age in McKenzie
According to the labor force statistics for McKenzie, out of the total population over 16 years of age (4,628), 53.2% or 2,462 individuals are in the labor force, with 5.0% or 123 of them unemployed. The age group with the highest labor force participation rate is 45 to 54 years, with 91.0% or 594 individuals in the labor force. Within the labor force, the 20 to 24 years age range has the highest percentage of unemployed individuals, with 17.9% or 40 of them being unemployed.
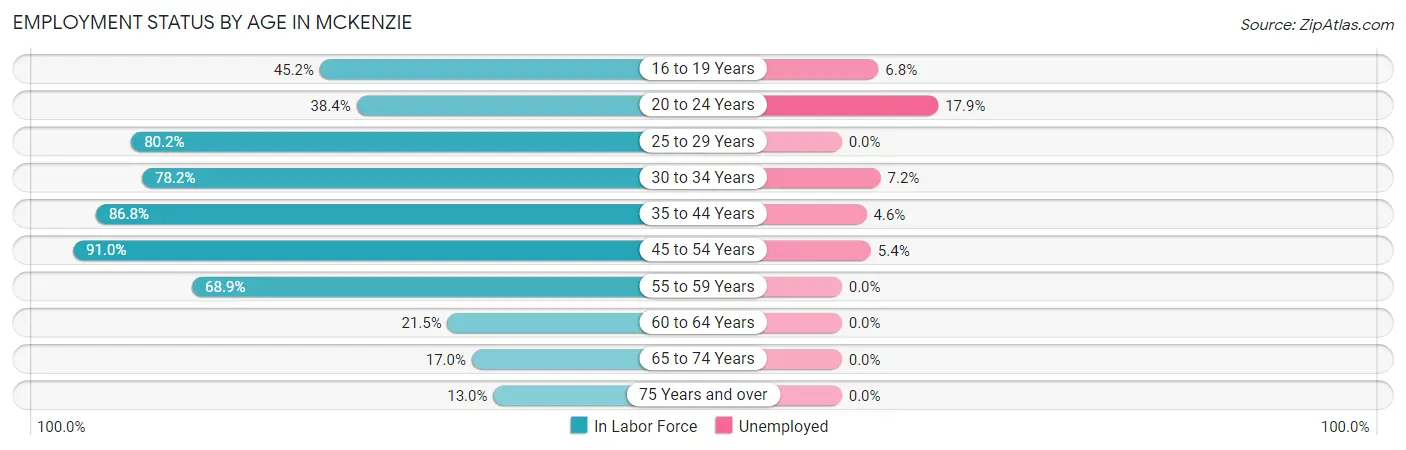
| Age Bracket | In Labor Force | Unemployed |
| 16 to 19 Years | 249 (45.2%) | 17 (6.8%) |
| 20 to 24 Years | 224 (38.4%) | 40 (17.9%) |
| 25 to 29 Years | 260 (80.2%) | 0 (0.0%) |
| 30 to 34 Years | 222 (78.2%) | 16 (7.2%) |
| 35 to 44 Years | 395 (86.8%) | 18 (4.6%) |
| 45 to 54 Years | 594 (91.0%) | 32 (5.4%) |
| 55 to 59 Years | 302 (68.9%) | 0 (0.0%) |
| 60 to 64 Years | 47 (21.5%) | 0 (0.0%) |
| 65 to 74 Years | 100 (17.0%) | 0 (0.0%) |
| 75 Years and over | 69 (13.0%) | 0 (0.0%) |
| Total | 2,462 (53.2%) | 123 (5.0%) |
Employment Status by Educational Attainment in McKenzie
According to labor force statistics for McKenzie, 76.7% of individuals (1,820) out of the total population between 25 and 64 years of age (2,373) are in the labor force, with 3.6% or 66 of them being unemployed. The group with the highest labor force participation rate are those with the educational attainment of bachelor's degree or higher, with 94.4% or 695 individuals in the labor force. Within the labor force, individuals with high school diploma education have the highest percentage of unemployment, with 8.7% or 66 of them being unemployed.
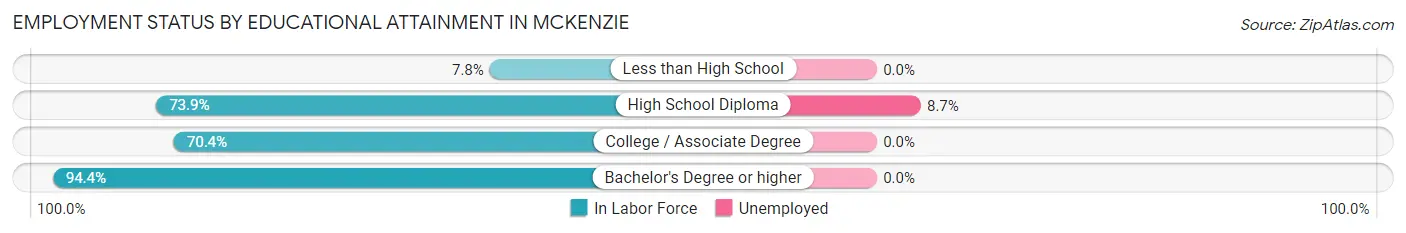
| Educational Attainment | In Labor Force | Unemployed |
| Less than High School | 8 (7.8%) | 0 (0.0%) |
| High School Diploma | 763 (73.9%) | 90 (8.7%) |
| College / Associate Degree | 354 (70.4%) | 0 (0.0%) |
| Bachelor's Degree or higher | 695 (94.4%) | 0 (0.0%) |
| Total | 1,820 (76.7%) | 85 (3.6%) |
Employment Occupations by Sex in McKenzie
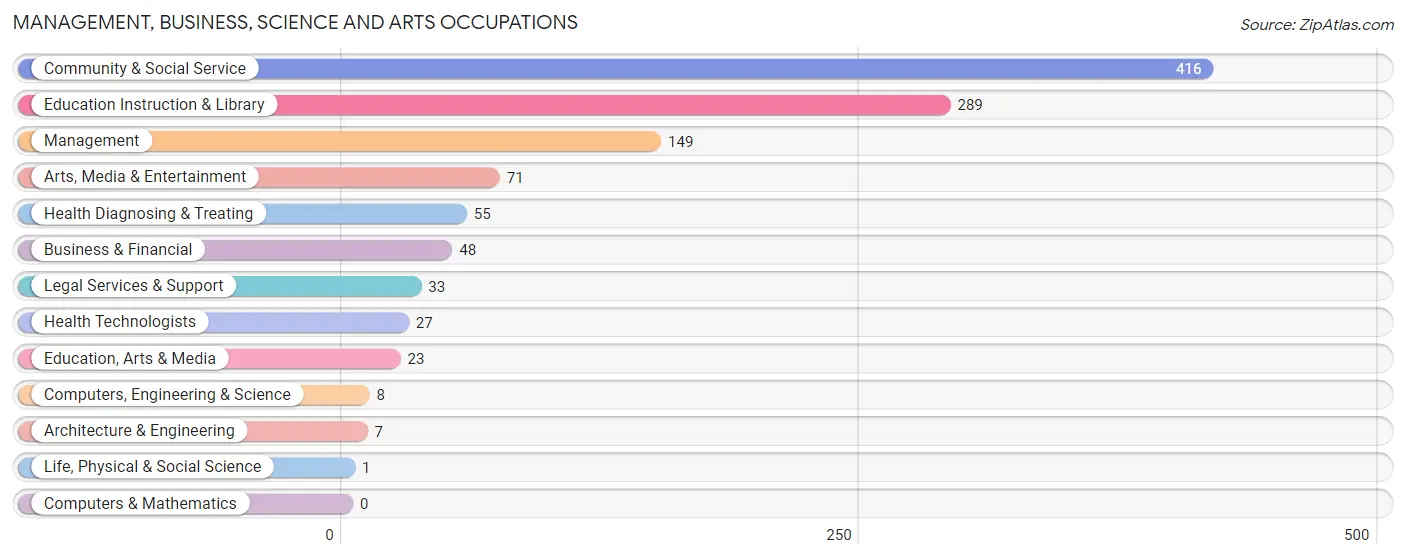
Management, Business, Science and Arts Occupations
The most common Management, Business, Science and Arts occupations in McKenzie are Community & Social Service (416 | 17.8%), Education Instruction & Library (289 | 12.4%), Management (149 | 6.4%), Arts, Media & Entertainment (71 | 3.0%), and Health Diagnosing & Treating (55 | 2.4%).
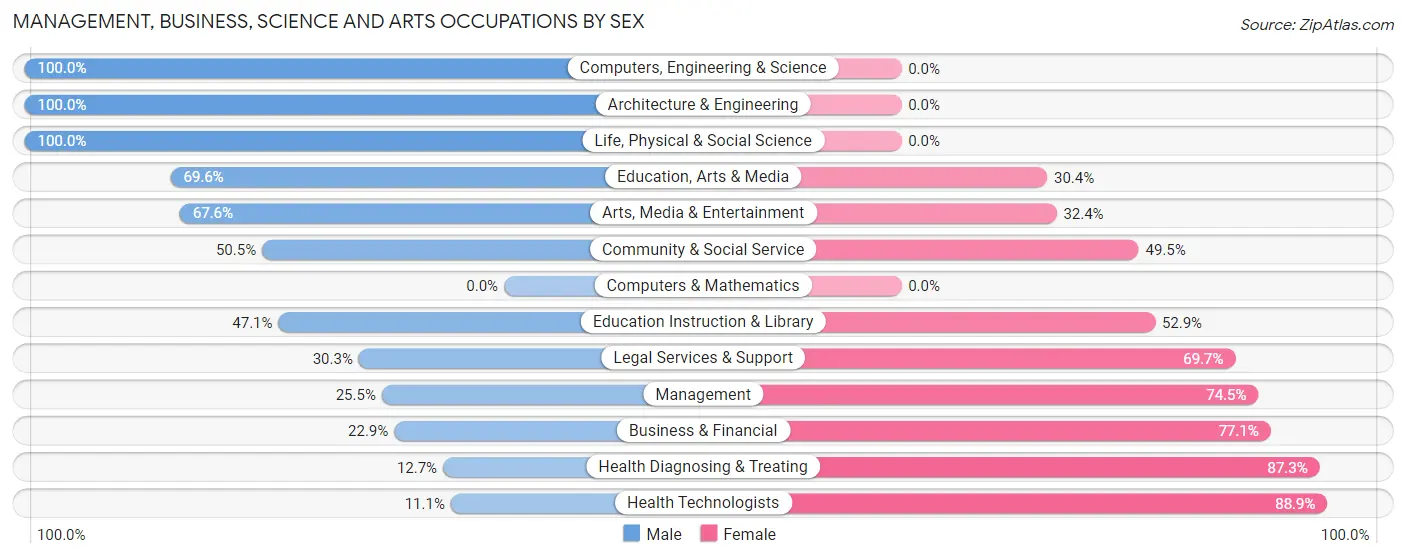
Management, Business, Science and Arts Occupations by Sex
Within the Management, Business, Science and Arts occupations in McKenzie, the most male-oriented occupations are Computers, Engineering & Science (100.0%), Architecture & Engineering (100.0%), and Life, Physical & Social Science (100.0%), while the most female-oriented occupations are Health Technologists (88.9%), Health Diagnosing & Treating (87.3%), and Business & Financial (77.1%).
| Occupation | Male | Female |
| Management | 38 (25.5%) | 111 (74.5%) |
| Business & Financial | 11 (22.9%) | 37 (77.1%) |
| Computers, Engineering & Science | 8 (100.0%) | 0 (0.0%) |
| Computers & Mathematics | 0 (0.0%) | 0 (0.0%) |
| Architecture & Engineering | 7 (100.0%) | 0 (0.0%) |
| Life, Physical & Social Science | 1 (100.0%) | 0 (0.0%) |
| Community & Social Service | 210 (50.5%) | 206 (49.5%) |
| Education, Arts & Media | 16 (69.6%) | 7 (30.4%) |
| Legal Services & Support | 10 (30.3%) | 23 (69.7%) |
| Education Instruction & Library | 136 (47.1%) | 153 (52.9%) |
| Arts, Media & Entertainment | 48 (67.6%) | 23 (32.4%) |
| Health Diagnosing & Treating | 7 (12.7%) | 48 (87.3%) |
| Health Technologists | 3 (11.1%) | 24 (88.9%) |
| Total (Category) | 274 (40.5%) | 402 (59.5%) |
| Total (Overall) | 1,237 (52.9%) | 1,102 (47.1%) |
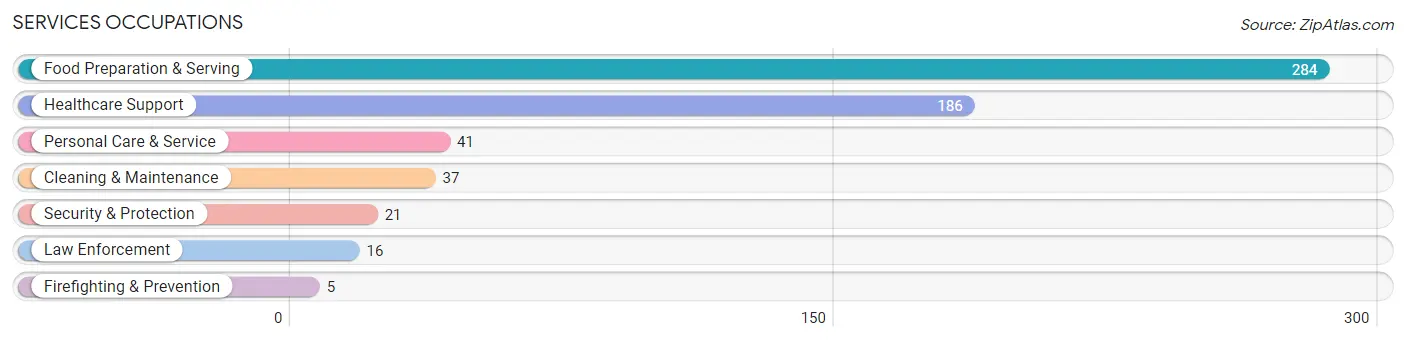
Services Occupations
The most common Services occupations in McKenzie are Food Preparation & Serving (284 | 12.1%), Healthcare Support (186 | 8.0%), Personal Care & Service (41 | 1.8%), Cleaning & Maintenance (37 | 1.6%), and Security & Protection (21 | 0.9%).
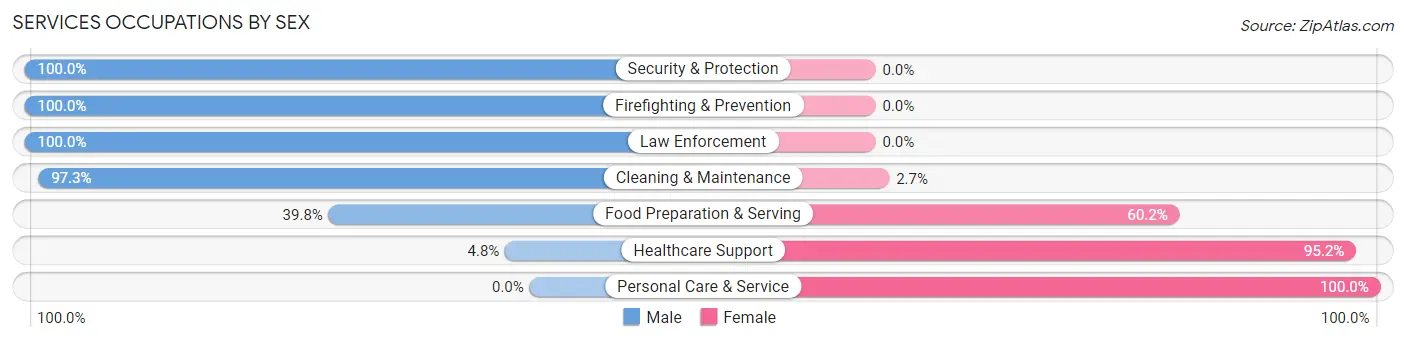
Services Occupations by Sex
Within the Services occupations in McKenzie, the most male-oriented occupations are Security & Protection (100.0%), Firefighting & Prevention (100.0%), and Law Enforcement (100.0%), while the most female-oriented occupations are Personal Care & Service (100.0%), Healthcare Support (95.2%), and Food Preparation & Serving (60.2%).
| Occupation | Male | Female |
| Healthcare Support | 9 (4.8%) | 177 (95.2%) |
| Security & Protection | 21 (100.0%) | 0 (0.0%) |
| Firefighting & Prevention | 5 (100.0%) | 0 (0.0%) |
| Law Enforcement | 16 (100.0%) | 0 (0.0%) |
| Food Preparation & Serving | 113 (39.8%) | 171 (60.2%) |
| Cleaning & Maintenance | 36 (97.3%) | 1 (2.7%) |
| Personal Care & Service | 0 (0.0%) | 41 (100.0%) |
| Total (Category) | 179 (31.5%) | 390 (68.5%) |
| Total (Overall) | 1,237 (52.9%) | 1,102 (47.1%) |
Sales and Office Occupations
The most common Sales and Office occupations in McKenzie are Sales & Related (239 | 10.2%), and Office & Administration (158 | 6.8%).

Sales and Office Occupations by Sex

| Occupation | Male | Female |
| Sales & Related | 156 (65.3%) | 83 (34.7%) |
| Office & Administration | 2 (1.3%) | 156 (98.7%) |
| Total (Category) | 158 (39.8%) | 239 (60.2%) |
| Total (Overall) | 1,237 (52.9%) | 1,102 (47.1%) |
Natural Resources, Construction and Maintenance Occupations
The most common Natural Resources, Construction and Maintenance occupations in McKenzie are Construction & Extraction (163 | 7.0%), Installation, Maintenance & Repair (26 | 1.1%), and Farming, Fishing & Forestry (18 | 0.8%).
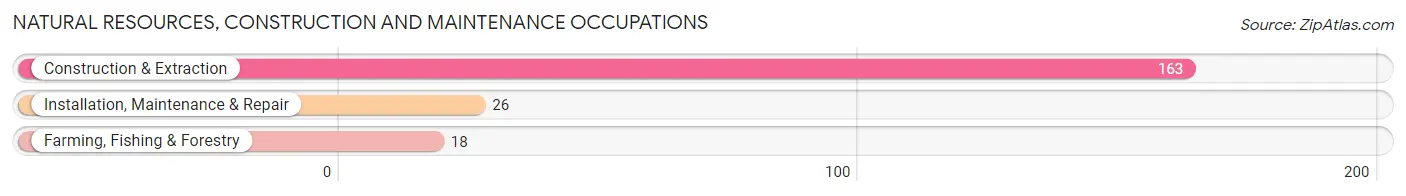
Natural Resources, Construction and Maintenance Occupations by Sex
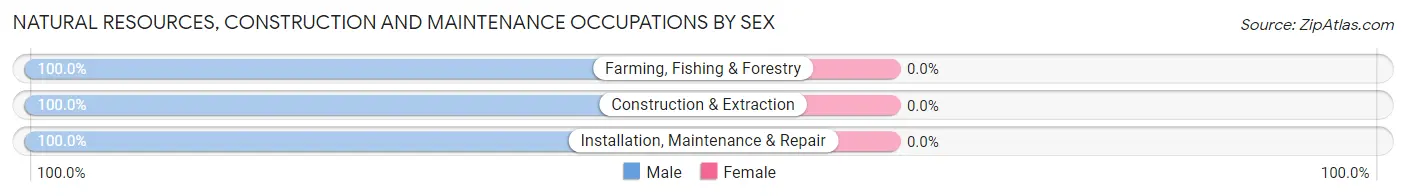
| Occupation | Male | Female |
| Farming, Fishing & Forestry | 18 (100.0%) | 0 (0.0%) |
| Construction & Extraction | 163 (100.0%) | 0 (0.0%) |
| Installation, Maintenance & Repair | 26 (100.0%) | 0 (0.0%) |
| Total (Category) | 207 (100.0%) | 0 (0.0%) |
| Total (Overall) | 1,237 (52.9%) | 1,102 (47.1%) |
Production, Transportation and Moving Occupations
The most common Production, Transportation and Moving occupations in McKenzie are Production (256 | 10.9%), Material Moving (141 | 6.0%), and Transportation (93 | 4.0%).
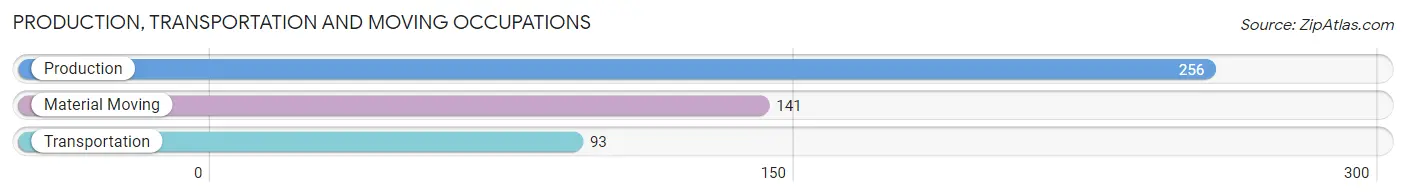
Production, Transportation and Moving Occupations by Sex
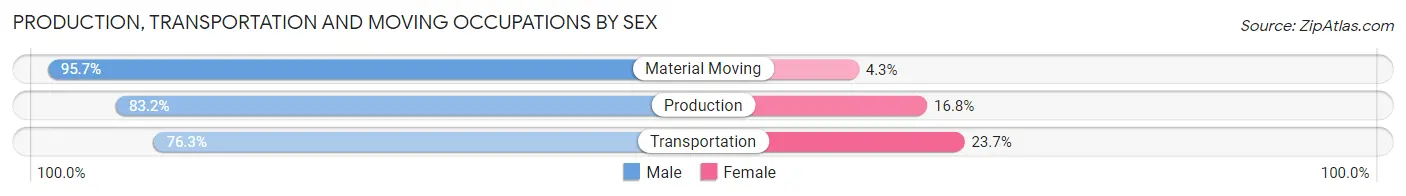
| Occupation | Male | Female |
| Production | 213 (83.2%) | 43 (16.8%) |
| Transportation | 71 (76.3%) | 22 (23.7%) |
| Material Moving | 135 (95.7%) | 6 (4.3%) |
| Total (Category) | 419 (85.5%) | 71 (14.5%) |
| Total (Overall) | 1,237 (52.9%) | 1,102 (47.1%) |
Employment Industries by Sex in McKenzie
Employment Industries in McKenzie
The major employment industries in McKenzie include Educational Services (379 | 16.2%), Manufacturing (362 | 15.5%), Retail Trade (330 | 14.1%), Health Care & Social Assistance (283 | 12.1%), and Accommodation & Food Services (230 | 9.8%).

Employment Industries by Sex in McKenzie
The McKenzie industries that see more men than women are Wholesale Trade (100.0%), Real Estate, Rental & Leasing (100.0%), and Construction (87.2%), whereas the industries that tend to have a higher number of women are Health Care & Social Assistance (97.5%), Arts, Entertainment & Recreation (80.8%), and Professional & Scientific (79.2%).
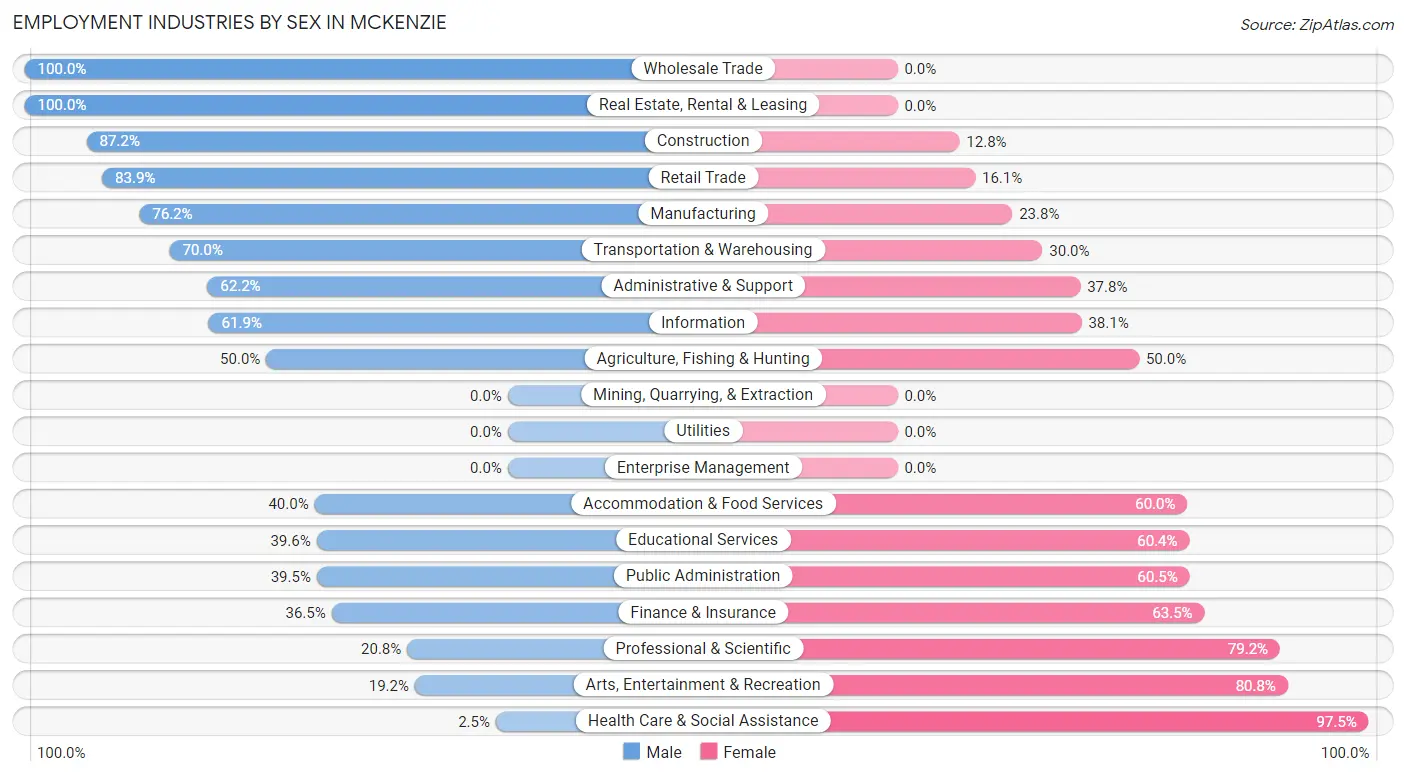
| Industry | Male | Female |
| Agriculture, Fishing & Hunting | 8 (50.0%) | 8 (50.0%) |
| Mining, Quarrying, & Extraction | 0 (0.0%) | 0 (0.0%) |
| Construction | 163 (87.2%) | 24 (12.8%) |
| Manufacturing | 276 (76.2%) | 86 (23.8%) |
| Wholesale Trade | 16 (100.0%) | 0 (0.0%) |
| Retail Trade | 277 (83.9%) | 53 (16.1%) |
| Transportation & Warehousing | 35 (70.0%) | 15 (30.0%) |
| Utilities | 0 (0.0%) | 0 (0.0%) |
| Information | 39 (61.9%) | 24 (38.1%) |
| Finance & Insurance | 35 (36.5%) | 61 (63.5%) |
| Real Estate, Rental & Leasing | 36 (100.0%) | 0 (0.0%) |
| Professional & Scientific | 10 (20.8%) | 38 (79.2%) |
| Enterprise Management | 0 (0.0%) | 0 (0.0%) |
| Administrative & Support | 46 (62.2%) | 28 (37.8%) |
| Educational Services | 150 (39.6%) | 229 (60.4%) |
| Health Care & Social Assistance | 7 (2.5%) | 276 (97.5%) |
| Arts, Entertainment & Recreation | 5 (19.2%) | 21 (80.8%) |
| Accommodation & Food Services | 92 (40.0%) | 138 (60.0%) |
| Public Administration | 34 (39.5%) | 52 (60.5%) |
| Total | 1,237 (52.9%) | 1,102 (47.1%) |
Education in McKenzie
School Enrollment in McKenzie
The most common levels of schooling among the 1,795 students in McKenzie are college / undergraduate (776 | 43.2%), high school (371 | 20.7%), and middle school (265 | 14.8%).
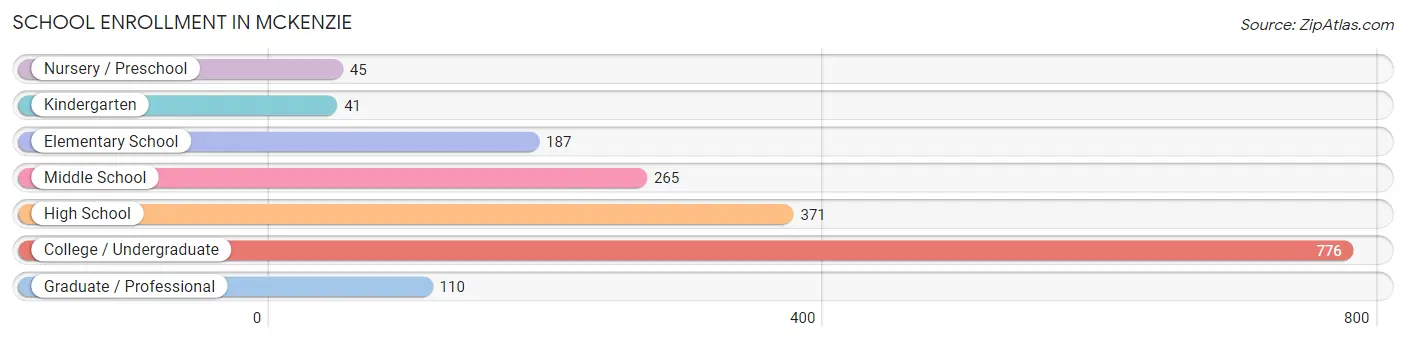
| School Level | # Students | % Students |
| Nursery / Preschool | 45 | 2.5% |
| Kindergarten | 41 | 2.3% |
| Elementary School | 187 | 10.4% |
| Middle School | 265 | 14.8% |
| High School | 371 | 20.7% |
| College / Undergraduate | 776 | 43.2% |
| Graduate / Professional | 110 | 6.1% |
| Total | 1,795 | 100.0% |
School Enrollment by Age by Funding Source in McKenzie
Out of a total of 1,795 students who are enrolled in schools in McKenzie, 743 (41.4%) attend a private institution, while the remaining 1,052 (58.6%) are enrolled in public schools. The age group of 20 to 24 year olds has the highest likelihood of being enrolled in private schools, with 430 (94.3% in the age bracket) enrolled. Conversely, the age group of 3 to 4 year olds has the lowest likelihood of being enrolled in a private school, with 20 (100.0% in the age bracket) attending a public institution.
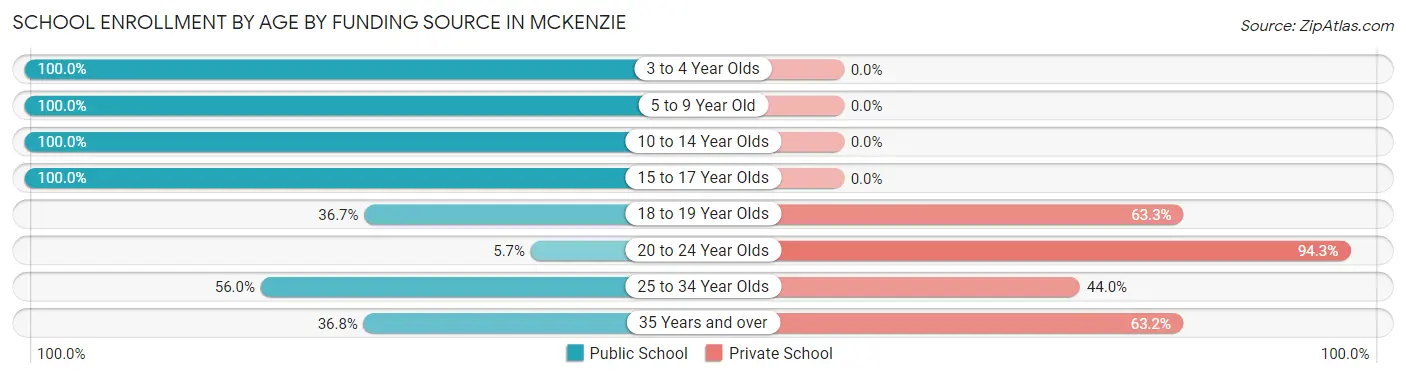
| Age Bracket | Public School | Private School |
| 3 to 4 Year Olds | 20 (100.0%) | 0 (0.0%) |
| 5 to 9 Year Old | 253 (100.0%) | 0 (0.0%) |
| 10 to 14 Year Olds | 281 (100.0%) | 0 (0.0%) |
| 15 to 17 Year Olds | 275 (100.0%) | 0 (0.0%) |
| 18 to 19 Year Olds | 148 (36.7%) | 255 (63.3%) |
| 20 to 24 Year Olds | 26 (5.7%) | 430 (94.3%) |
| 25 to 34 Year Olds | 28 (56.0%) | 22 (44.0%) |
| 35 Years and over | 21 (36.8%) | 36 (63.2%) |
| Total | 1,052 (58.6%) | 743 (41.4%) |
Educational Attainment by Field of Study in McKenzie
Education (338 | 31.8%), business (231 | 21.7%), liberal arts & history (128 | 12.0%), science & technology (101 | 9.5%), and arts & humanities (73 | 6.9%) are the most common fields of study among 1,063 individuals in McKenzie who have obtained a bachelor's degree or higher.
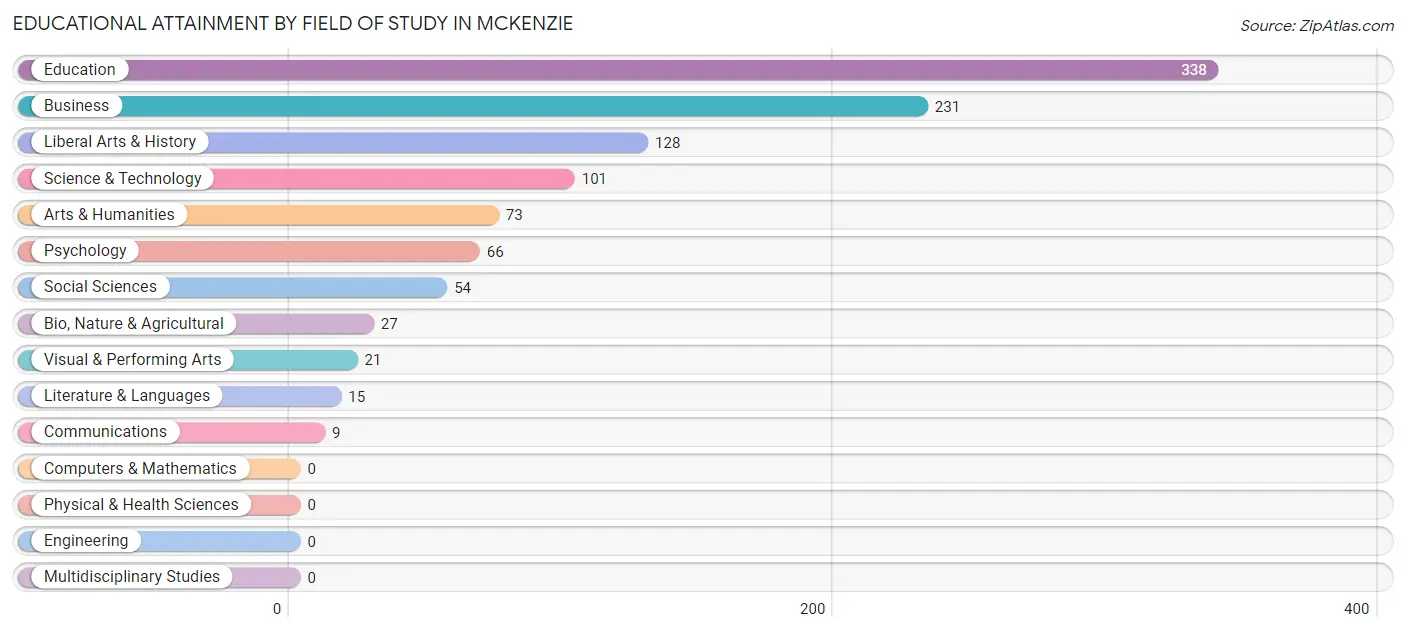
| Field of Study | # Graduates | % Graduates |
| Computers & Mathematics | 0 | 0.0% |
| Bio, Nature & Agricultural | 27 | 2.5% |
| Physical & Health Sciences | 0 | 0.0% |
| Psychology | 66 | 6.2% |
| Social Sciences | 54 | 5.1% |
| Engineering | 0 | 0.0% |
| Multidisciplinary Studies | 0 | 0.0% |
| Science & Technology | 101 | 9.5% |
| Business | 231 | 21.7% |
| Education | 338 | 31.8% |
| Literature & Languages | 15 | 1.4% |
| Liberal Arts & History | 128 | 12.0% |
| Visual & Performing Arts | 21 | 2.0% |
| Communications | 9 | 0.9% |
| Arts & Humanities | 73 | 6.9% |
| Total | 1,063 | 100.0% |
Transportation & Commute in McKenzie
Vehicle Availability by Sex in McKenzie
The most prevalent vehicle ownership categories in McKenzie are males with 3 vehicles (311, accounting for 29.1%) and females with 3 vehicles (241, making up 28.5%).
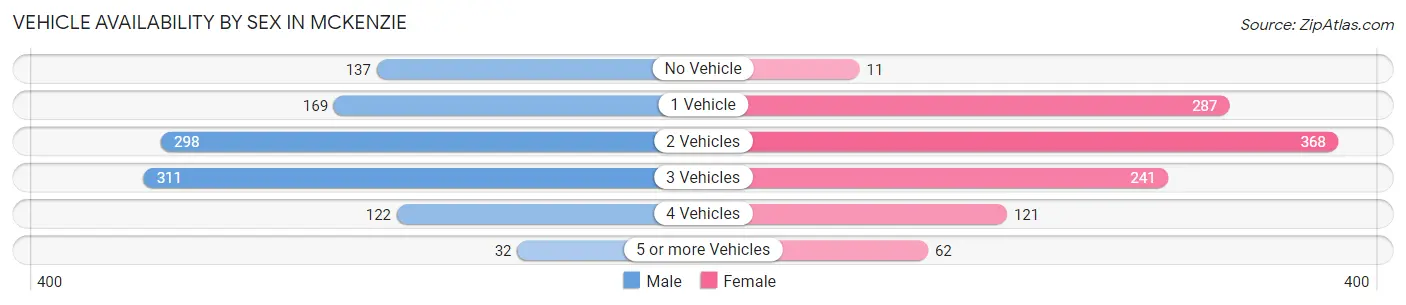
| Vehicles Available | Male | Female |
| No Vehicle | 137 (12.8%) | 11 (1.0%) |
| 1 Vehicle | 169 (15.8%) | 287 (26.3%) |
| 2 Vehicles | 298 (27.9%) | 368 (33.8%) |
| 3 Vehicles | 311 (29.1%) | 241 (22.1%) |
| 4 Vehicles | 122 (11.4%) | 121 (11.1%) |
| 5 or more Vehicles | 32 (3.0%) | 62 (5.7%) |
| Total | 1,069 (100.0%) | 1,090 (100.0%) |
Commute Time in McKenzie
The most frequently occuring commute durations in McKenzie are 5 to 9 minutes (484 commuters, 24.0%), 20 to 24 minutes (393 commuters, 19.5%), and 10 to 14 minutes (265 commuters, 13.1%).
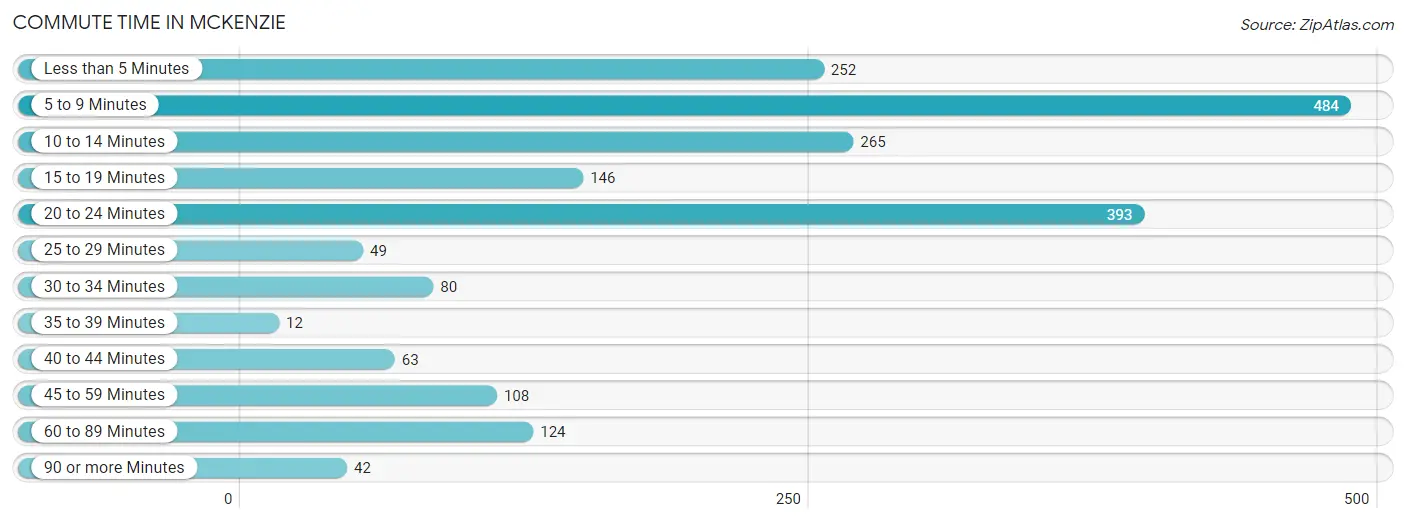
| Commute Time | # Commuters | % Commuters |
| Less than 5 Minutes | 252 | 12.5% |
| 5 to 9 Minutes | 484 | 24.0% |
| 10 to 14 Minutes | 265 | 13.1% |
| 15 to 19 Minutes | 146 | 7.2% |
| 20 to 24 Minutes | 393 | 19.5% |
| 25 to 29 Minutes | 49 | 2.4% |
| 30 to 34 Minutes | 80 | 4.0% |
| 35 to 39 Minutes | 12 | 0.6% |
| 40 to 44 Minutes | 63 | 3.1% |
| 45 to 59 Minutes | 108 | 5.3% |
| 60 to 89 Minutes | 124 | 6.1% |
| 90 or more Minutes | 42 | 2.1% |
Commute Time by Sex in McKenzie
The most common commute times in McKenzie are 5 to 9 minutes (231 commuters, 21.8%) for males and 5 to 9 minutes (253 commuters, 26.3%) for females.
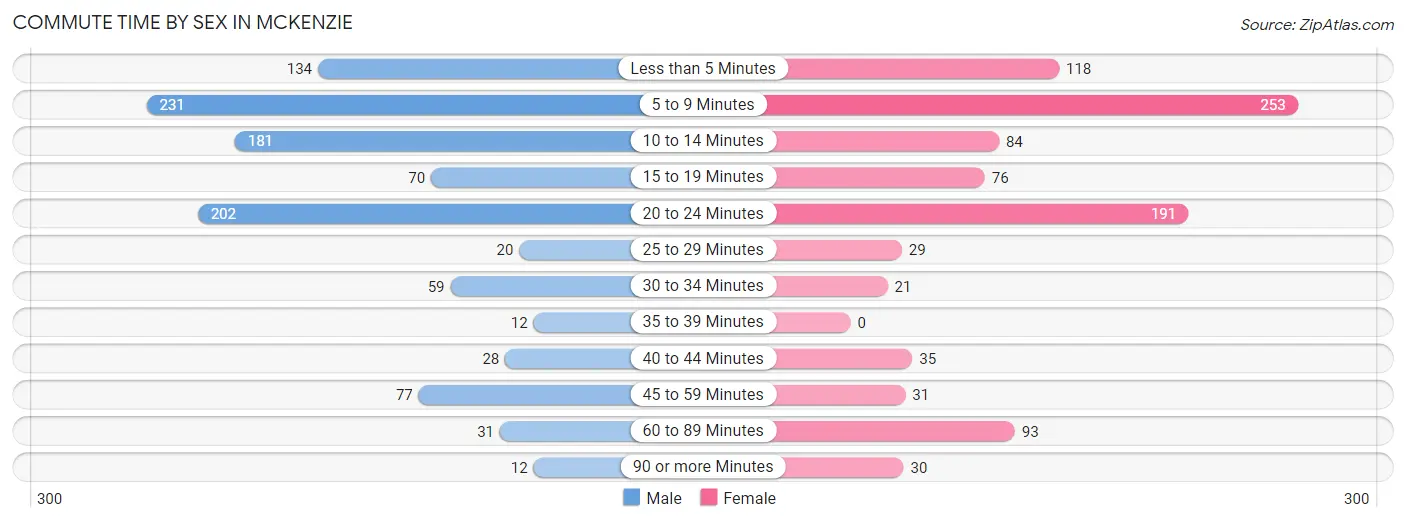
| Commute Time | Male | Female |
| Less than 5 Minutes | 134 (12.7%) | 118 (12.3%) |
| 5 to 9 Minutes | 231 (21.8%) | 253 (26.3%) |
| 10 to 14 Minutes | 181 (17.1%) | 84 (8.7%) |
| 15 to 19 Minutes | 70 (6.6%) | 76 (7.9%) |
| 20 to 24 Minutes | 202 (19.1%) | 191 (19.9%) |
| 25 to 29 Minutes | 20 (1.9%) | 29 (3.0%) |
| 30 to 34 Minutes | 59 (5.6%) | 21 (2.2%) |
| 35 to 39 Minutes | 12 (1.1%) | 0 (0.0%) |
| 40 to 44 Minutes | 28 (2.6%) | 35 (3.6%) |
| 45 to 59 Minutes | 77 (7.3%) | 31 (3.2%) |
| 60 to 89 Minutes | 31 (2.9%) | 93 (9.7%) |
| 90 or more Minutes | 12 (1.1%) | 30 (3.1%) |
Time of Departure to Work by Sex in McKenzie
The most frequent times of departure to work in McKenzie are 12:00 PM to 3:59 PM (181, 17.1%) for males and 7:30 AM to 7:59 AM (232, 24.1%) for females.
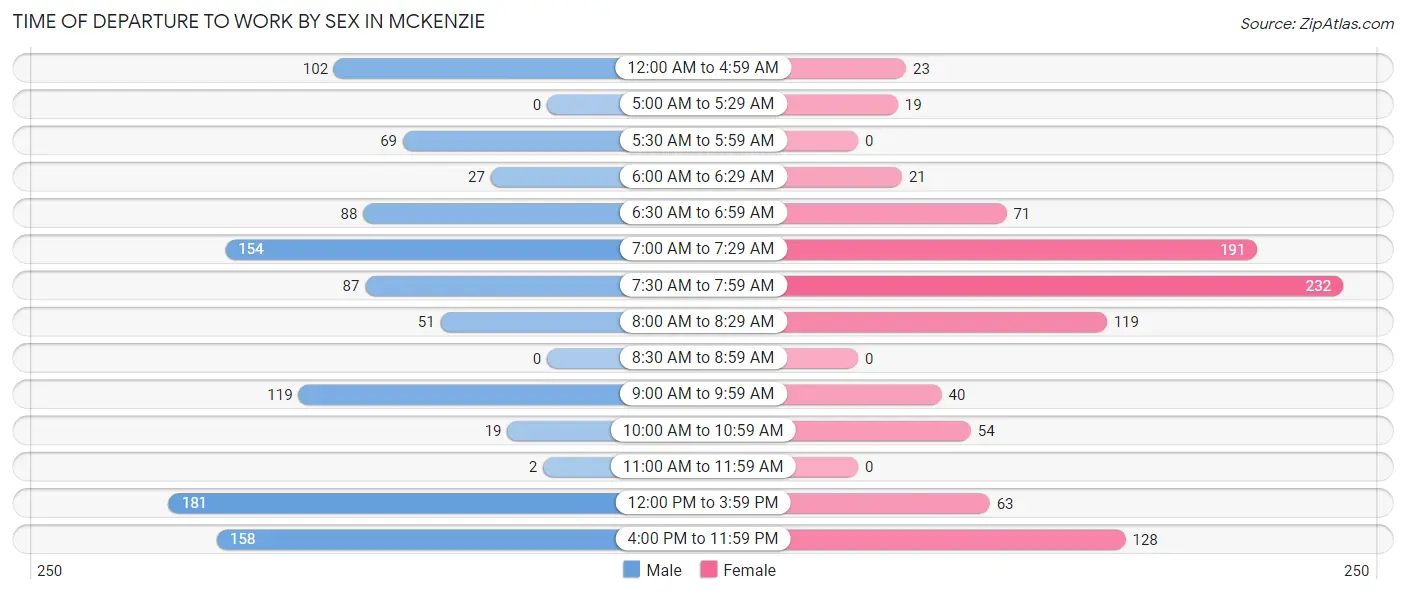
| Time of Departure | Male | Female |
| 12:00 AM to 4:59 AM | 102 (9.7%) | 23 (2.4%) |
| 5:00 AM to 5:29 AM | 0 (0.0%) | 19 (2.0%) |
| 5:30 AM to 5:59 AM | 69 (6.5%) | 0 (0.0%) |
| 6:00 AM to 6:29 AM | 27 (2.5%) | 21 (2.2%) |
| 6:30 AM to 6:59 AM | 88 (8.3%) | 71 (7.4%) |
| 7:00 AM to 7:29 AM | 154 (14.6%) | 191 (19.9%) |
| 7:30 AM to 7:59 AM | 87 (8.2%) | 232 (24.1%) |
| 8:00 AM to 8:29 AM | 51 (4.8%) | 119 (12.4%) |
| 8:30 AM to 8:59 AM | 0 (0.0%) | 0 (0.0%) |
| 9:00 AM to 9:59 AM | 119 (11.3%) | 40 (4.2%) |
| 10:00 AM to 10:59 AM | 19 (1.8%) | 54 (5.6%) |
| 11:00 AM to 11:59 AM | 2 (0.2%) | 0 (0.0%) |
| 12:00 PM to 3:59 PM | 181 (17.1%) | 63 (6.6%) |
| 4:00 PM to 11:59 PM | 158 (14.9%) | 128 (13.3%) |
| Total | 1,057 (100.0%) | 961 (100.0%) |
Housing Occupancy in McKenzie
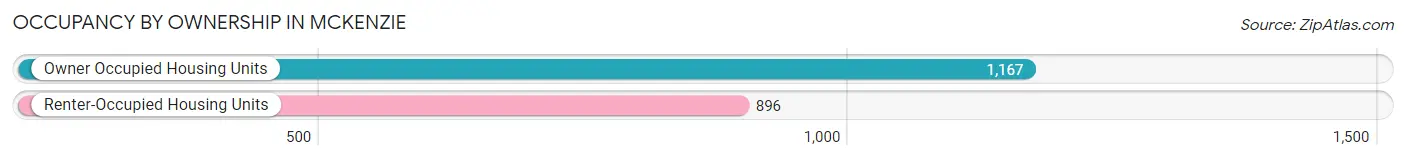
Occupancy by Ownership in McKenzie
Of the total 2,063 dwellings in McKenzie, owner-occupied units account for 1,167 (56.6%), while renter-occupied units make up 896 (43.4%).
| Occupancy | # Housing Units | % Housing Units |
| Owner Occupied Housing Units | 1,167 | 56.6% |
| Renter-Occupied Housing Units | 896 | 43.4% |
| Total Occupied Housing Units | 2,063 | 100.0% |
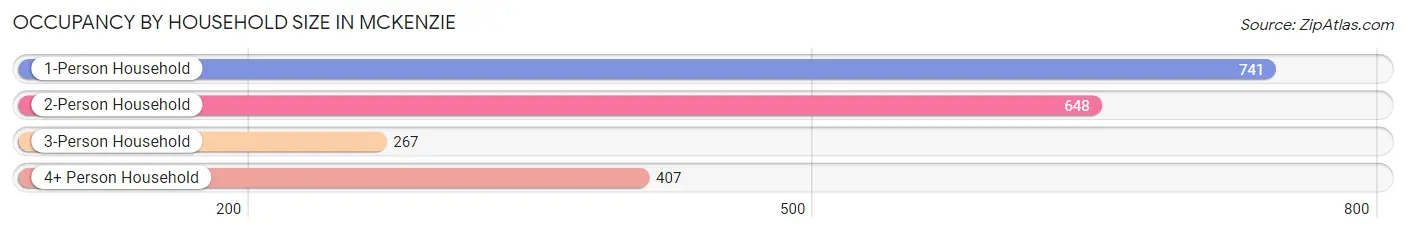
Occupancy by Household Size in McKenzie
| Household Size | # Housing Units | % Housing Units |
| 1-Person Household | 741 | 35.9% |
| 2-Person Household | 648 | 31.4% |
| 3-Person Household | 267 | 12.9% |
| 4+ Person Household | 407 | 19.7% |
| Total Housing Units | 2,063 | 100.0% |
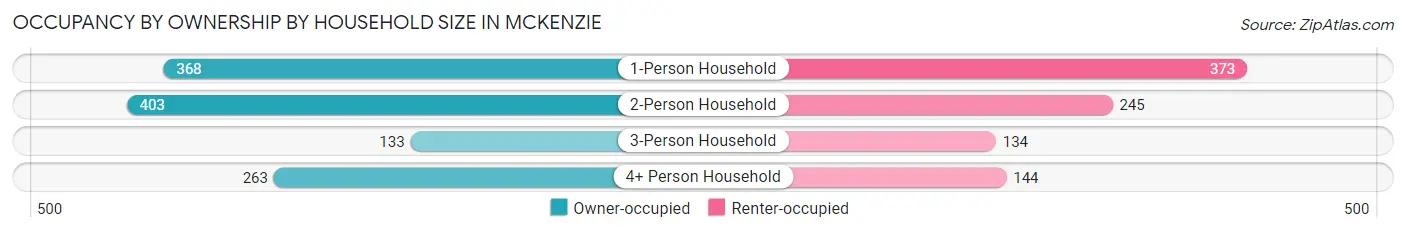
Occupancy by Ownership by Household Size in McKenzie
| Household Size | Owner-occupied | Renter-occupied |
| 1-Person Household | 368 (49.7%) | 373 (50.3%) |
| 2-Person Household | 403 (62.2%) | 245 (37.8%) |
| 3-Person Household | 133 (49.8%) | 134 (50.2%) |
| 4+ Person Household | 263 (64.6%) | 144 (35.4%) |
| Total Housing Units | 1,167 (56.6%) | 896 (43.4%) |
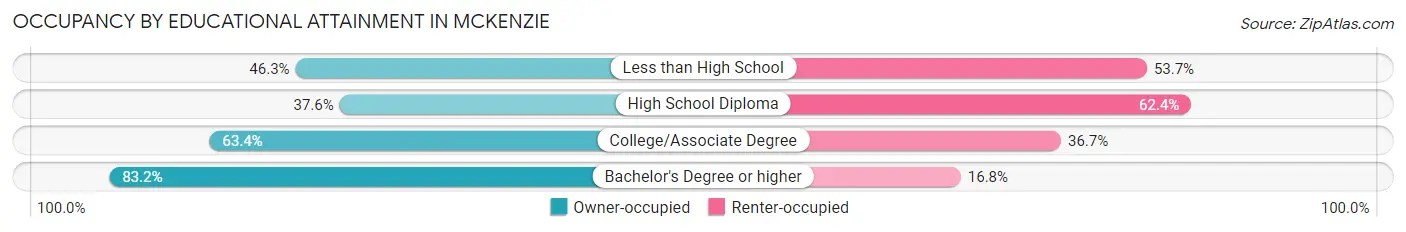
Occupancy by Educational Attainment in McKenzie
| Household Size | Owner-occupied | Renter-occupied |
| Less than High School | 69 (46.3%) | 80 (53.7%) |
| High School Diploma | 320 (37.6%) | 532 (62.4%) |
| College/Associate Degree | 337 (63.3%) | 195 (36.6%) |
| Bachelor's Degree or higher | 441 (83.2%) | 89 (16.8%) |
Occupancy by Age of Householder in McKenzie
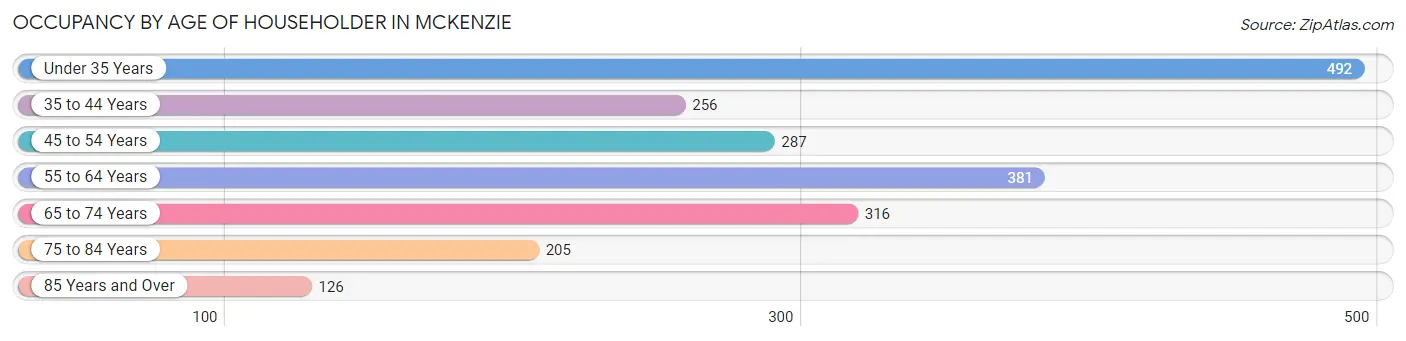
| Age Bracket | # Households | % Households |
| Under 35 Years | 492 | 23.8% |
| 35 to 44 Years | 256 | 12.4% |
| 45 to 54 Years | 287 | 13.9% |
| 55 to 64 Years | 381 | 18.5% |
| 65 to 74 Years | 316 | 15.3% |
| 75 to 84 Years | 205 | 9.9% |
| 85 Years and Over | 126 | 6.1% |
| Total | 2,063 | 100.0% |
Housing Finances in McKenzie
Median Income by Occupancy in McKenzie
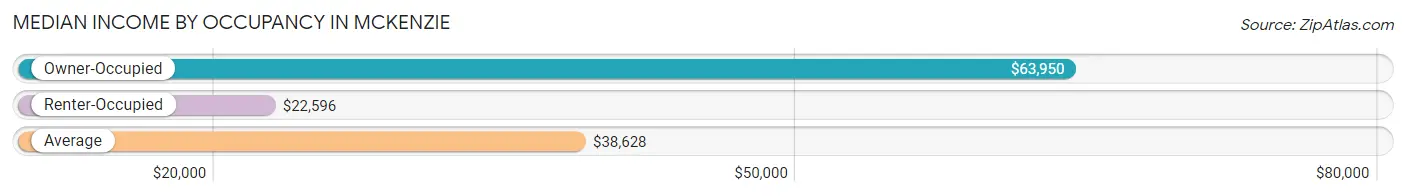
| Occupancy Type | # Households | Median Income |
| Owner-Occupied | 1,167 (56.6%) | $63,950 |
| Renter-Occupied | 896 (43.4%) | $22,596 |
| Average | 2,063 (100.0%) | $38,628 |
Occupancy by Householder Income Bracket in McKenzie
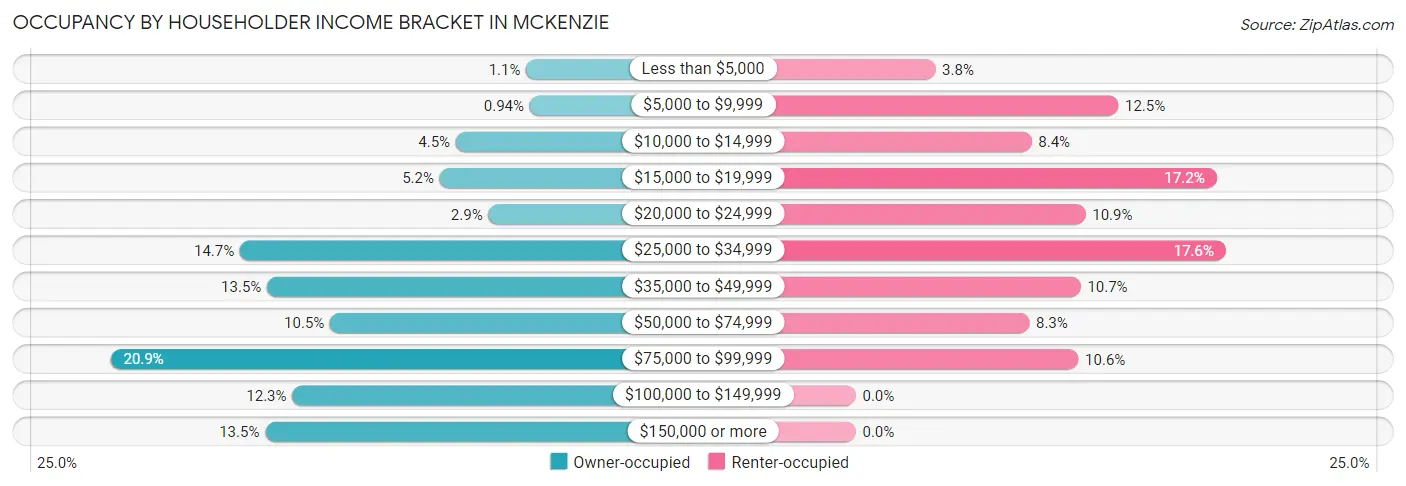
| Income Bracket | Owner-occupied | Renter-occupied |
| Less than $5,000 | 13 (1.1%) | 34 (3.8%) |
| $5,000 to $9,999 | 11 (0.9%) | 112 (12.5%) |
| $10,000 to $14,999 | 52 (4.5%) | 75 (8.4%) |
| $15,000 to $19,999 | 61 (5.2%) | 154 (17.2%) |
| $20,000 to $24,999 | 34 (2.9%) | 98 (10.9%) |
| $25,000 to $34,999 | 172 (14.7%) | 158 (17.6%) |
| $35,000 to $49,999 | 157 (13.5%) | 96 (10.7%) |
| $50,000 to $74,999 | 122 (10.4%) | 74 (8.3%) |
| $75,000 to $99,999 | 244 (20.9%) | 95 (10.6%) |
| $100,000 to $149,999 | 143 (12.2%) | 0 (0.0%) |
| $150,000 or more | 158 (13.5%) | 0 (0.0%) |
| Total | 1,167 (100.0%) | 896 (100.0%) |
Monthly Housing Cost Tiers in McKenzie
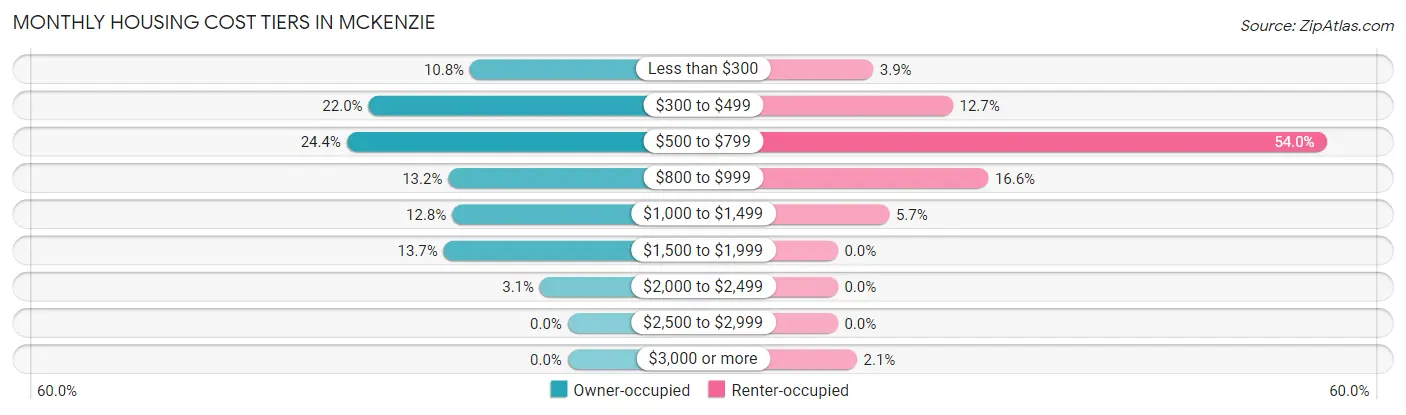
| Monthly Cost | Owner-occupied | Renter-occupied |
| Less than $300 | 126 (10.8%) | 35 (3.9%) |
| $300 to $499 | 257 (22.0%) | 114 (12.7%) |
| $500 to $799 | 285 (24.4%) | 484 (54.0%) |
| $800 to $999 | 154 (13.2%) | 149 (16.6%) |
| $1,000 to $1,499 | 149 (12.8%) | 51 (5.7%) |
| $1,500 to $1,999 | 160 (13.7%) | 0 (0.0%) |
| $2,000 to $2,499 | 36 (3.1%) | 0 (0.0%) |
| $2,500 to $2,999 | 0 (0.0%) | 0 (0.0%) |
| $3,000 or more | 0 (0.0%) | 19 (2.1%) |
| Total | 1,167 (100.0%) | 896 (100.0%) |
Physical Housing Characteristics in McKenzie
Housing Structures in McKenzie
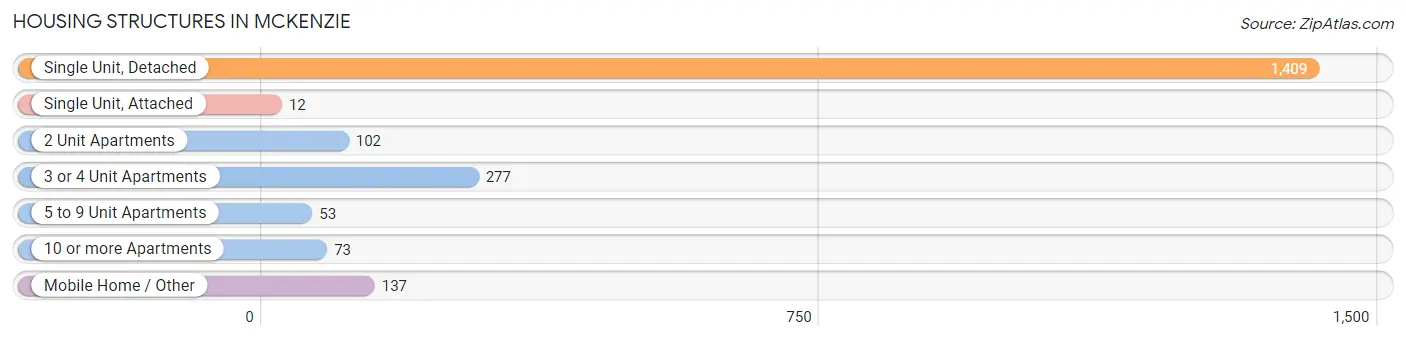
| Structure Type | # Housing Units | % Housing Units |
| Single Unit, Detached | 1,409 | 68.3% |
| Single Unit, Attached | 12 | 0.6% |
| 2 Unit Apartments | 102 | 4.9% |
| 3 or 4 Unit Apartments | 277 | 13.4% |
| 5 to 9 Unit Apartments | 53 | 2.6% |
| 10 or more Apartments | 73 | 3.5% |
| Mobile Home / Other | 137 | 6.6% |
| Total | 2,063 | 100.0% |
Housing Structures by Occupancy in McKenzie
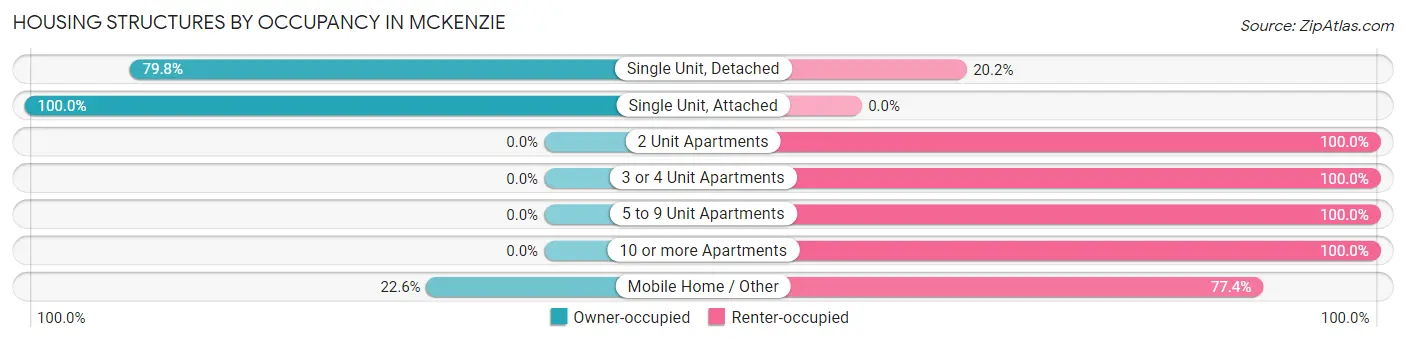
| Structure Type | Owner-occupied | Renter-occupied |
| Single Unit, Detached | 1,124 (79.8%) | 285 (20.2%) |
| Single Unit, Attached | 12 (100.0%) | 0 (0.0%) |
| 2 Unit Apartments | 0 (0.0%) | 102 (100.0%) |
| 3 or 4 Unit Apartments | 0 (0.0%) | 277 (100.0%) |
| 5 to 9 Unit Apartments | 0 (0.0%) | 53 (100.0%) |
| 10 or more Apartments | 0 (0.0%) | 73 (100.0%) |
| Mobile Home / Other | 31 (22.6%) | 106 (77.4%) |
| Total | 1,167 (56.6%) | 896 (43.4%) |
Housing Structures by Number of Rooms in McKenzie
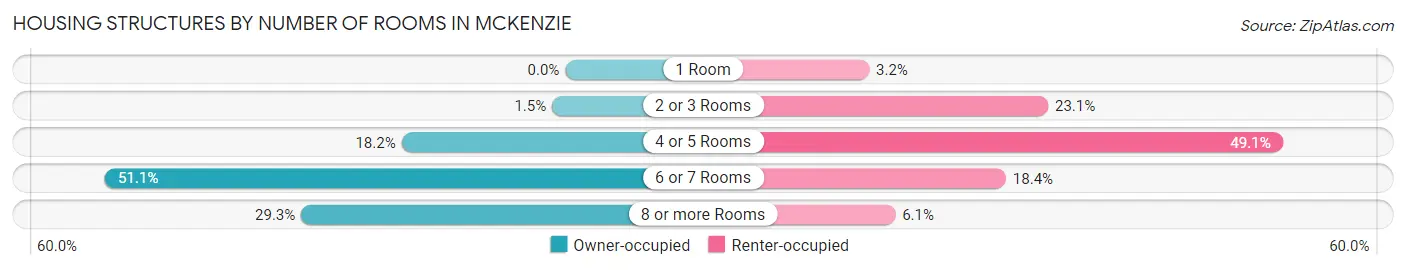
| Number of Rooms | Owner-occupied | Renter-occupied |
| 1 Room | 0 (0.0%) | 29 (3.2%) |
| 2 or 3 Rooms | 17 (1.5%) | 207 (23.1%) |
| 4 or 5 Rooms | 212 (18.2%) | 440 (49.1%) |
| 6 or 7 Rooms | 596 (51.1%) | 165 (18.4%) |
| 8 or more Rooms | 342 (29.3%) | 55 (6.1%) |
| Total | 1,167 (100.0%) | 896 (100.0%) |
Housing Structure by Heating Type in McKenzie
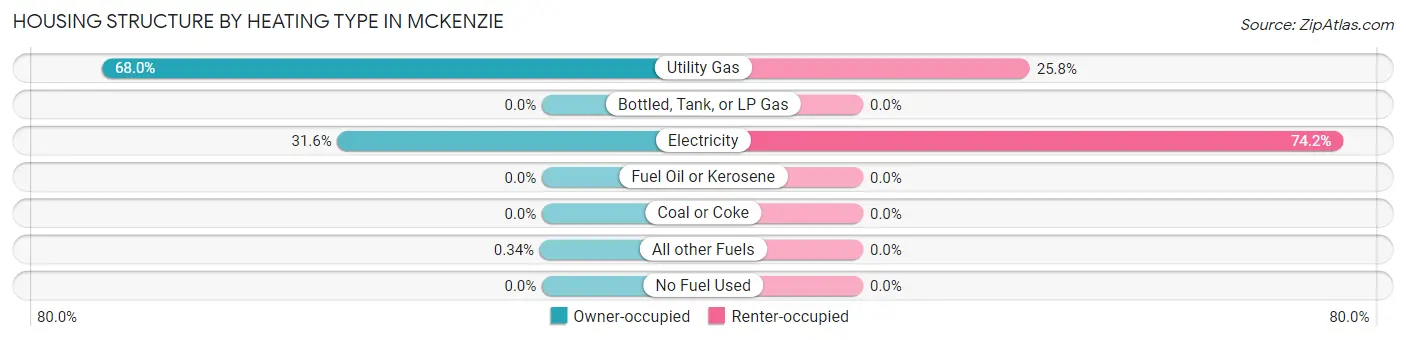
| Heating Type | Owner-occupied | Renter-occupied |
| Utility Gas | 794 (68.0%) | 231 (25.8%) |
| Bottled, Tank, or LP Gas | 0 (0.0%) | 0 (0.0%) |
| Electricity | 369 (31.6%) | 665 (74.2%) |
| Fuel Oil or Kerosene | 0 (0.0%) | 0 (0.0%) |
| Coal or Coke | 0 (0.0%) | 0 (0.0%) |
| All other Fuels | 4 (0.3%) | 0 (0.0%) |
| No Fuel Used | 0 (0.0%) | 0 (0.0%) |
| Total | 1,167 (100.0%) | 896 (100.0%) |
Household Vehicle Usage in McKenzie
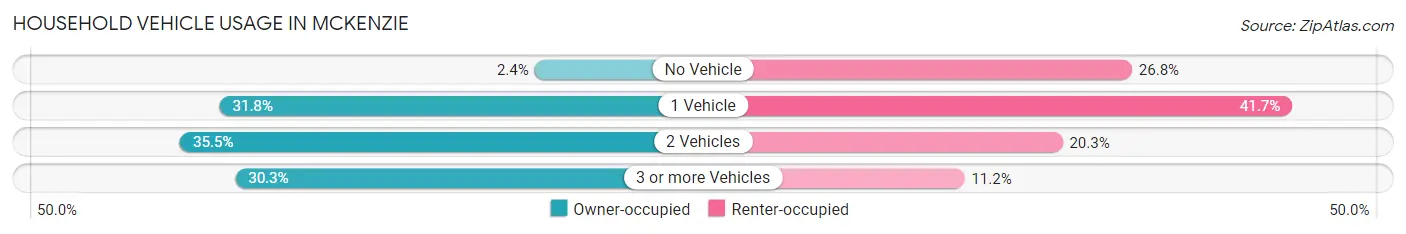
| Vehicles per Household | Owner-occupied | Renter-occupied |
| No Vehicle | 28 (2.4%) | 240 (26.8%) |
| 1 Vehicle | 371 (31.8%) | 374 (41.7%) |
| 2 Vehicles | 414 (35.5%) | 182 (20.3%) |
| 3 or more Vehicles | 354 (30.3%) | 100 (11.2%) |
| Total | 1,167 (100.0%) | 896 (100.0%) |
Real Estate & Mortgages in McKenzie
Real Estate and Mortgage Overview in McKenzie
| Characteristic | Without Mortgage | With Mortgage |
| Housing Units | 547 | 620 |
| Median Property Value | $132,300 | $135,600 |
| Median Household Income | $48,988 | $99 |
| Monthly Housing Costs | $437 | $0 |
| Real Estate Taxes | $889 | $12 |
Property Value by Mortgage Status in McKenzie
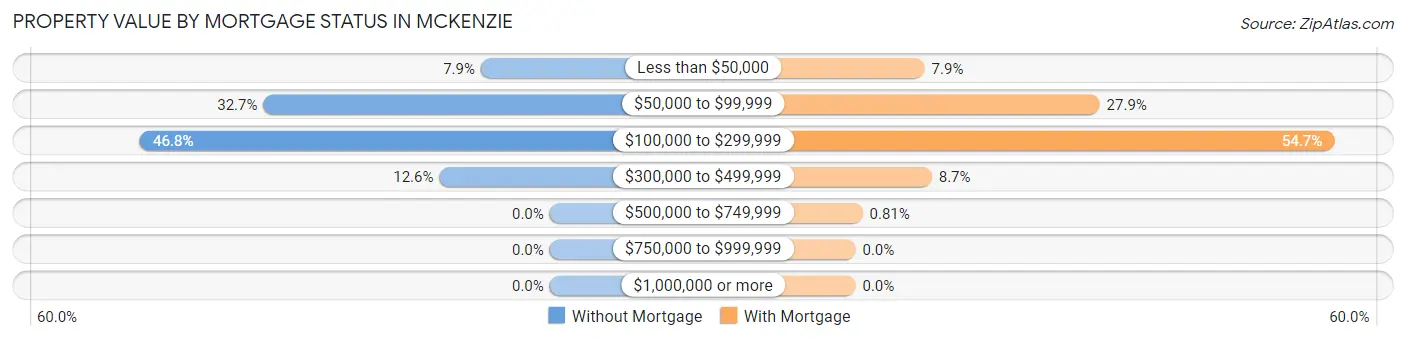
| Property Value | Without Mortgage | With Mortgage |
| Less than $50,000 | 43 (7.9%) | 49 (7.9%) |
| $50,000 to $99,999 | 179 (32.7%) | 173 (27.9%) |
| $100,000 to $299,999 | 256 (46.8%) | 339 (54.7%) |
| $300,000 to $499,999 | 69 (12.6%) | 54 (8.7%) |
| $500,000 to $749,999 | 0 (0.0%) | 5 (0.8%) |
| $750,000 to $999,999 | 0 (0.0%) | 0 (0.0%) |
| $1,000,000 or more | 0 (0.0%) | 0 (0.0%) |
| Total | 547 (100.0%) | 620 (100.0%) |
Household Income by Mortgage Status in McKenzie
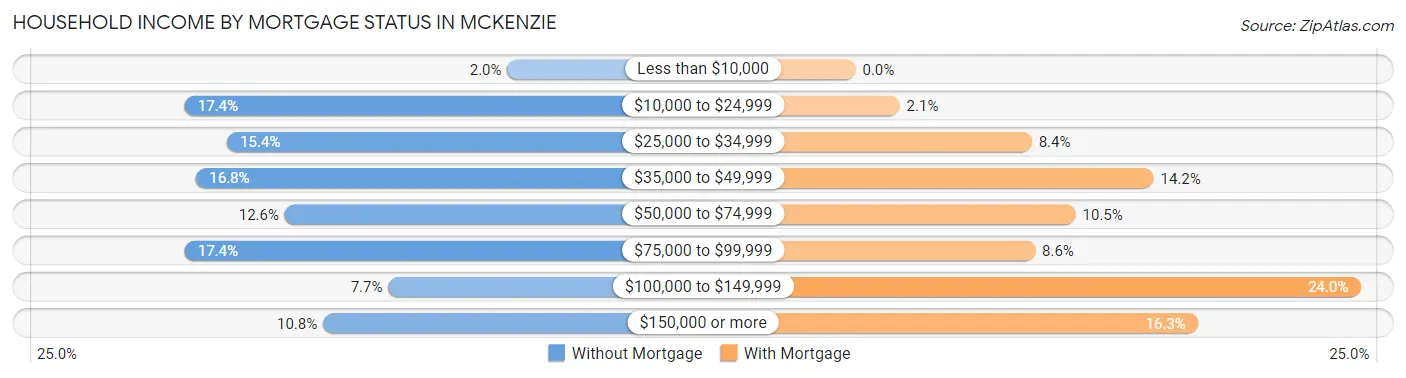
| Household Income | Without Mortgage | With Mortgage |
| Less than $10,000 | 11 (2.0%) | 0 (0.0%) |
| $10,000 to $24,999 | 95 (17.4%) | 13 (2.1%) |
| $25,000 to $34,999 | 84 (15.4%) | 52 (8.4%) |
| $35,000 to $49,999 | 92 (16.8%) | 88 (14.2%) |
| $50,000 to $74,999 | 69 (12.6%) | 65 (10.5%) |
| $75,000 to $99,999 | 95 (17.4%) | 53 (8.6%) |
| $100,000 to $149,999 | 42 (7.7%) | 149 (24.0%) |
| $150,000 or more | 59 (10.8%) | 101 (16.3%) |
| Total | 547 (100.0%) | 620 (100.0%) |
Property Value to Household Income Ratio in McKenzie
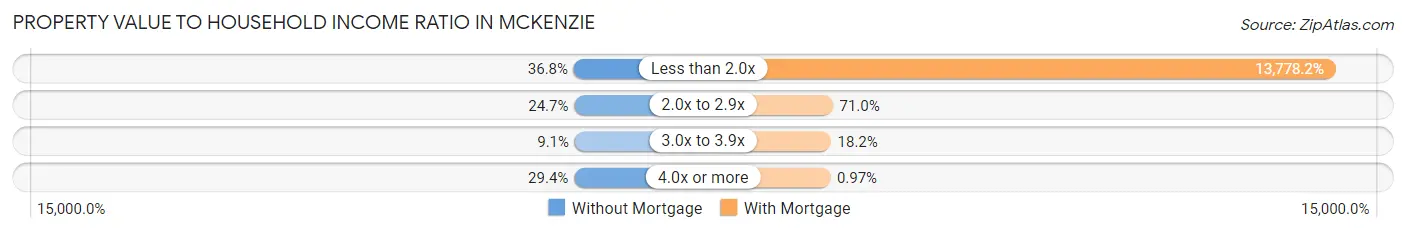
| Value-to-Income Ratio | Without Mortgage | With Mortgage |
| Less than 2.0x | 201 (36.7%) | 85,425 (13,778.2%) |
| 2.0x to 2.9x | 135 (24.7%) | 440 (71.0%) |
| 3.0x to 3.9x | 50 (9.1%) | 113 (18.2%) |
| 4.0x or more | 161 (29.4%) | 6 (1.0%) |
| Total | 547 (100.0%) | 620 (100.0%) |
Real Estate Taxes by Mortgage Status in McKenzie
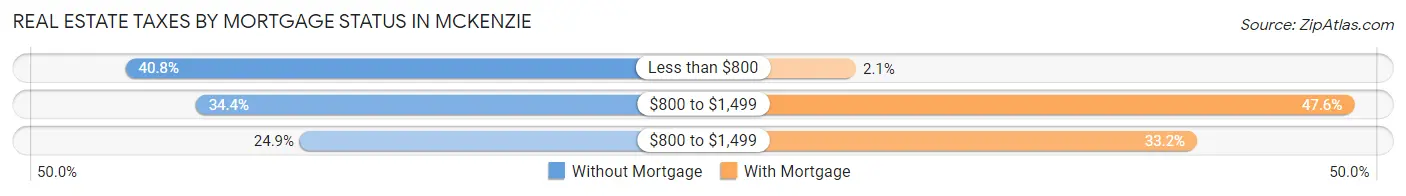
| Property Taxes | Without Mortgage | With Mortgage |
| Less than $800 | 223 (40.8%) | 13 (2.1%) |
| $800 to $1,499 | 188 (34.4%) | 295 (47.6%) |
| $800 to $1,499 | 136 (24.9%) | 206 (33.2%) |
| Total | 547 (100.0%) | 620 (100.0%) |
Health & Disability in McKenzie
Health Insurance Coverage by Age in McKenzie
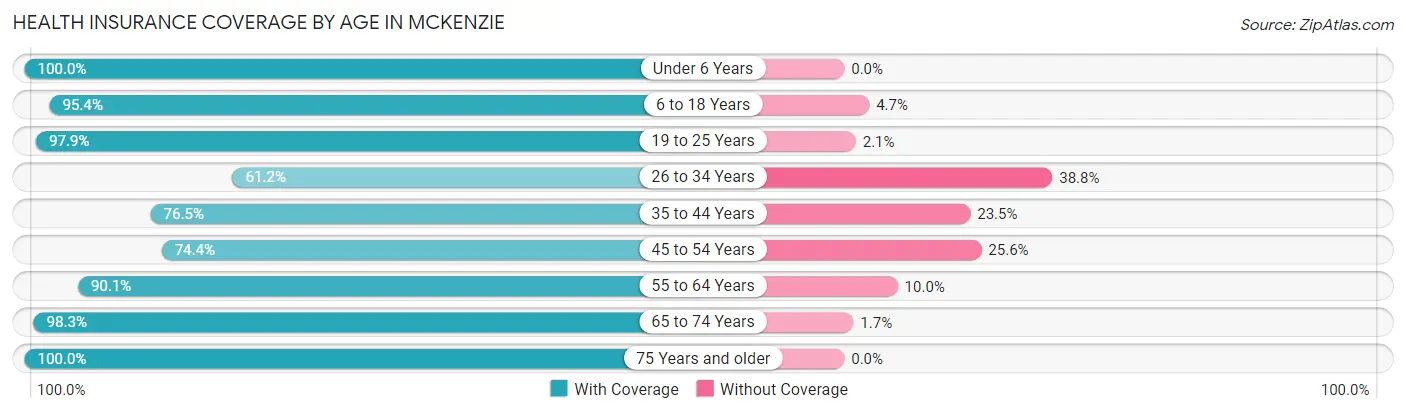
| Age Bracket | With Coverage | Without Coverage |
| Under 6 Years | 345 (100.0%) | 0 (0.0%) |
| 6 to 18 Years | 903 (95.4%) | 44 (4.6%) |
| 19 to 25 Years | 867 (97.9%) | 19 (2.1%) |
| 26 to 34 Years | 333 (61.2%) | 211 (38.8%) |
| 35 to 44 Years | 345 (76.5%) | 106 (23.5%) |
| 45 to 54 Years | 486 (74.4%) | 167 (25.6%) |
| 55 to 64 Years | 588 (90.0%) | 65 (10.0%) |
| 65 to 74 Years | 521 (98.3%) | 9 (1.7%) |
| 75 Years and older | 457 (100.0%) | 0 (0.0%) |
| Total | 4,845 (88.6%) | 621 (11.4%) |
Health Insurance Coverage by Citizenship Status in McKenzie
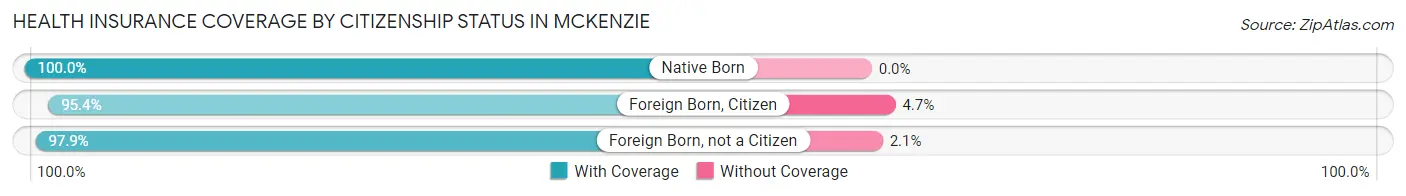
| Citizenship Status | With Coverage | Without Coverage |
| Native Born | 345 (100.0%) | 0 (0.0%) |
| Foreign Born, Citizen | 903 (95.4%) | 44 (4.6%) |
| Foreign Born, not a Citizen | 867 (97.9%) | 19 (2.1%) |
Health Insurance Coverage by Household Income in McKenzie
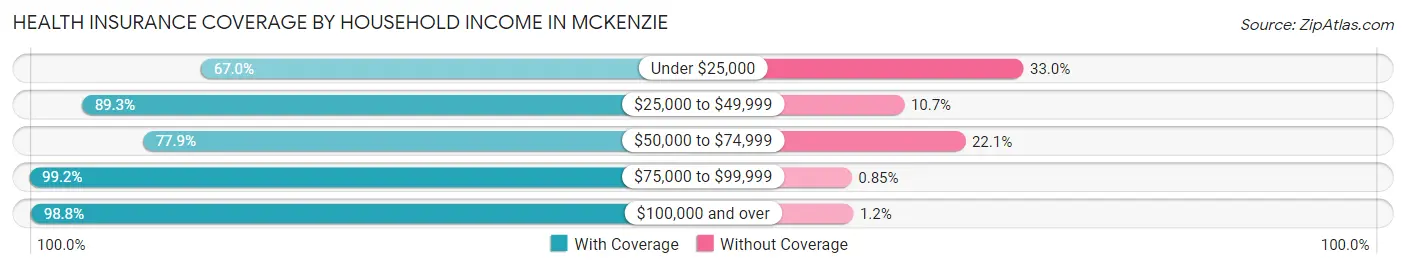
| Household Income | With Coverage | Without Coverage |
| Under $25,000 | 633 (67.0%) | 312 (33.0%) |
| $25,000 to $49,999 | 1,142 (89.3%) | 137 (10.7%) |
| $50,000 to $74,999 | 524 (77.9%) | 149 (22.1%) |
| $75,000 to $99,999 | 938 (99.2%) | 8 (0.9%) |
| $100,000 and over | 1,108 (98.8%) | 13 (1.2%) |
Public vs Private Health Insurance Coverage by Age in McKenzie
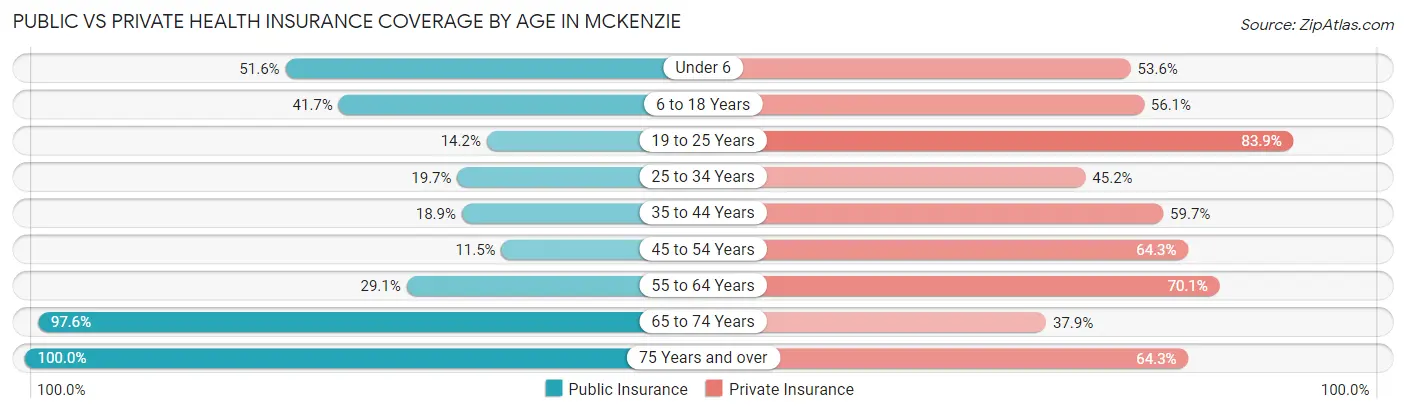
| Age Bracket | Public Insurance | Private Insurance |
| Under 6 | 178 (51.6%) | 185 (53.6%) |
| 6 to 18 Years | 395 (41.7%) | 531 (56.1%) |
| 19 to 25 Years | 126 (14.2%) | 743 (83.9%) |
| 25 to 34 Years | 107 (19.7%) | 246 (45.2%) |
| 35 to 44 Years | 85 (18.9%) | 269 (59.7%) |
| 45 to 54 Years | 75 (11.5%) | 420 (64.3%) |
| 55 to 64 Years | 190 (29.1%) | 458 (70.1%) |
| 65 to 74 Years | 517 (97.6%) | 201 (37.9%) |
| 75 Years and over | 457 (100.0%) | 294 (64.3%) |
| Total | 2,130 (39.0%) | 3,347 (61.2%) |
Disability Status by Sex by Age in McKenzie
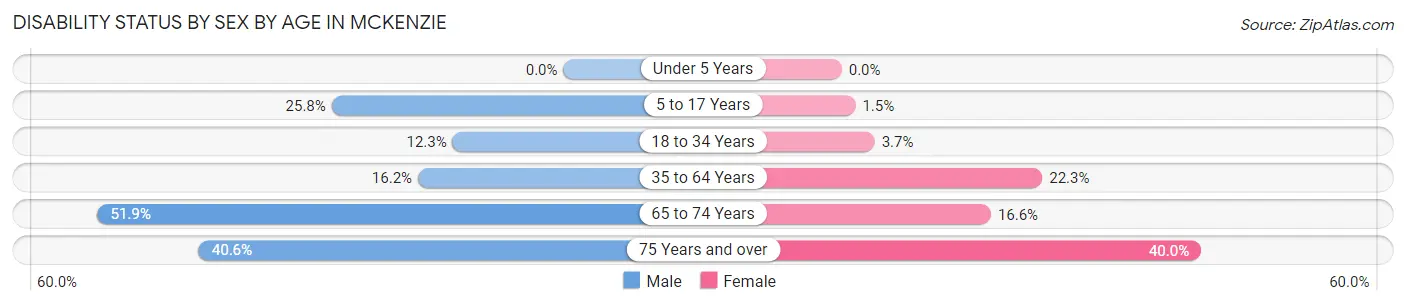
| Age Bracket | Male | Female |
| Under 5 Years | 0 (0.0%) | 0 (0.0%) |
| 5 to 17 Years | 127 (25.8%) | 5 (1.5%) |
| 18 to 34 Years | 96 (12.3%) | 31 (3.7%) |
| 35 to 64 Years | 133 (16.2%) | 209 (22.3%) |
| 65 to 74 Years | 125 (51.9%) | 48 (16.6%) |
| 75 Years and over | 82 (40.6%) | 102 (40.0%) |
Disability Class by Sex by Age in McKenzie
Disability Class: Hearing Difficulty
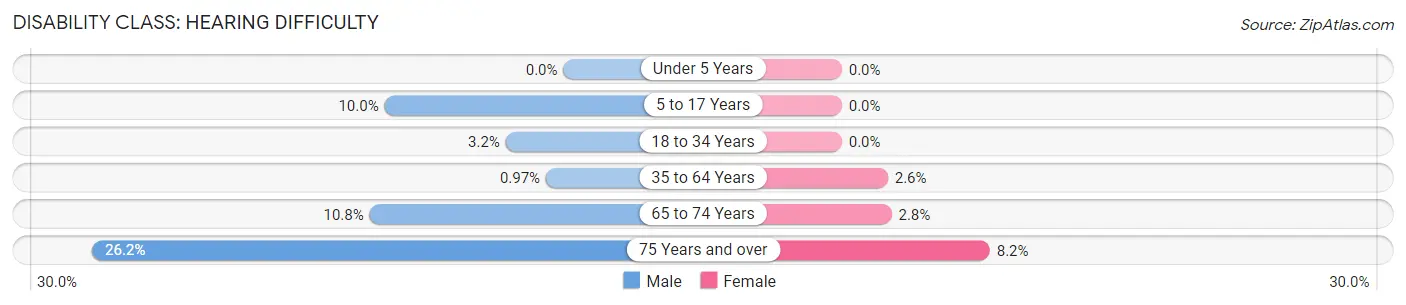
| Age Bracket | Male | Female |
| Under 5 Years | 0 (0.0%) | 0 (0.0%) |
| 5 to 17 Years | 49 (10.0%) | 0 (0.0%) |
| 18 to 34 Years | 25 (3.2%) | 0 (0.0%) |
| 35 to 64 Years | 8 (1.0%) | 24 (2.6%) |
| 65 to 74 Years | 26 (10.8%) | 8 (2.8%) |
| 75 Years and over | 53 (26.2%) | 21 (8.2%) |
Disability Class: Vision Difficulty
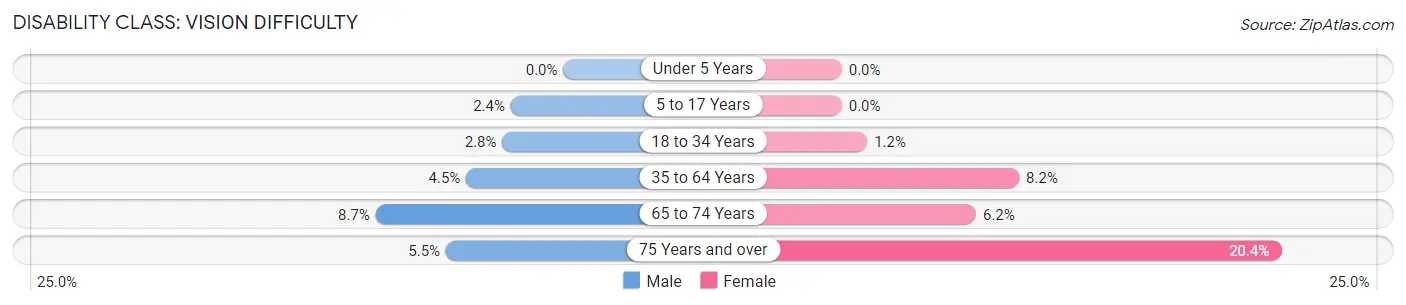
| Age Bracket | Male | Female |
| Under 5 Years | 0 (0.0%) | 0 (0.0%) |
| 5 to 17 Years | 12 (2.4%) | 0 (0.0%) |
| 18 to 34 Years | 22 (2.8%) | 10 (1.2%) |
| 35 to 64 Years | 37 (4.5%) | 77 (8.2%) |
| 65 to 74 Years | 21 (8.7%) | 18 (6.2%) |
| 75 Years and over | 11 (5.4%) | 52 (20.4%) |
Disability Class: Cognitive Difficulty
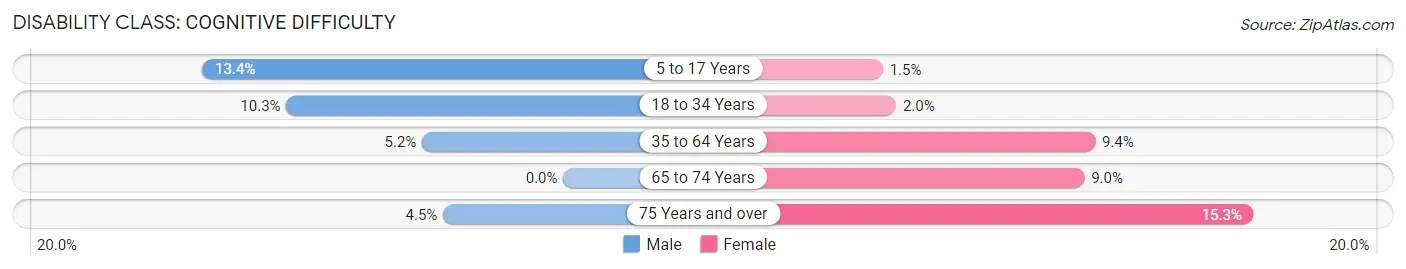
| Age Bracket | Male | Female |
| 5 to 17 Years | 66 (13.4%) | 5 (1.5%) |
| 18 to 34 Years | 80 (10.3%) | 17 (2.0%) |
| 35 to 64 Years | 43 (5.2%) | 88 (9.4%) |
| 65 to 74 Years | 0 (0.0%) | 26 (9.0%) |
| 75 Years and over | 9 (4.5%) | 39 (15.3%) |
Disability Class: Ambulatory Difficulty
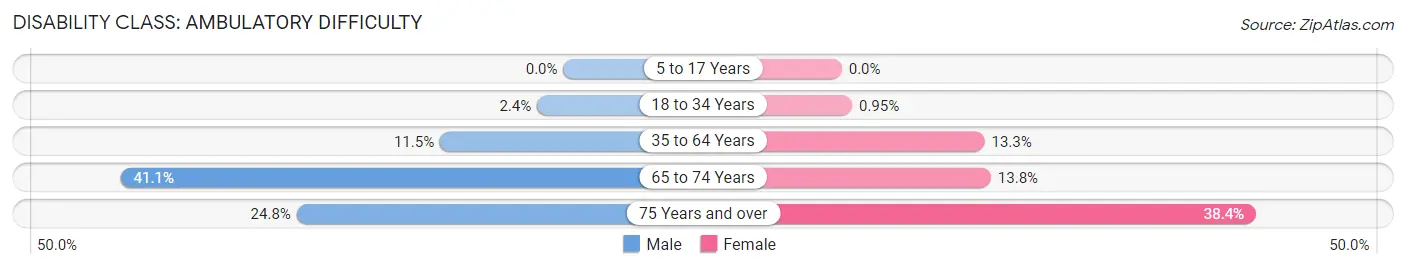
| Age Bracket | Male | Female |
| 5 to 17 Years | 0 (0.0%) | 0 (0.0%) |
| 18 to 34 Years | 19 (2.4%) | 8 (0.9%) |
| 35 to 64 Years | 94 (11.5%) | 124 (13.3%) |
| 65 to 74 Years | 99 (41.1%) | 40 (13.8%) |
| 75 Years and over | 50 (24.7%) | 98 (38.4%) |
Disability Class: Self-Care Difficulty
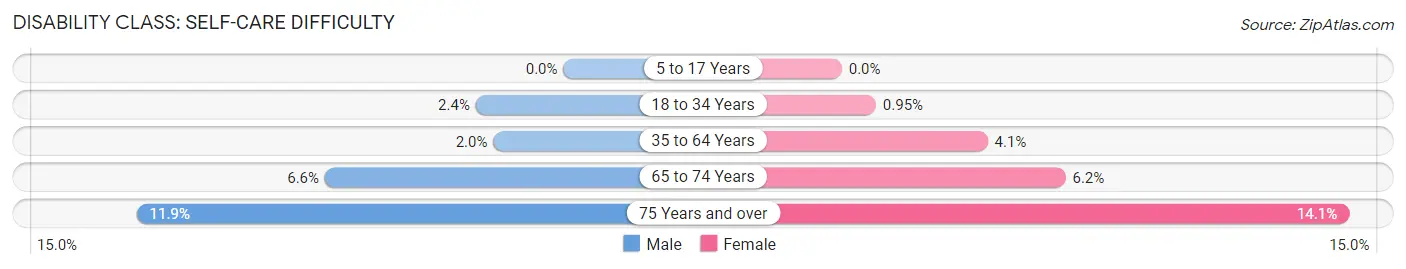
| Age Bracket | Male | Female |
| 5 to 17 Years | 0 (0.0%) | 0 (0.0%) |
| 18 to 34 Years | 19 (2.4%) | 8 (0.9%) |
| 35 to 64 Years | 16 (1.9%) | 38 (4.1%) |
| 65 to 74 Years | 16 (6.6%) | 18 (6.2%) |
| 75 Years and over | 24 (11.9%) | 36 (14.1%) |
Technology Access in McKenzie
Computing Device Access in McKenzie
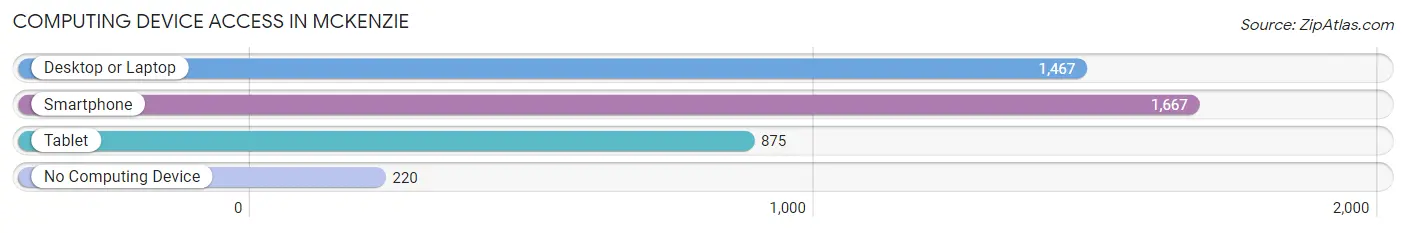
| Device Type | # Households | % Households |
| Desktop or Laptop | 1,467 | 71.1% |
| Smartphone | 1,667 | 80.8% |
| Tablet | 875 | 42.4% |
| No Computing Device | 220 | 10.7% |
| Total | 2,063 | 100.0% |
Internet Access in McKenzie
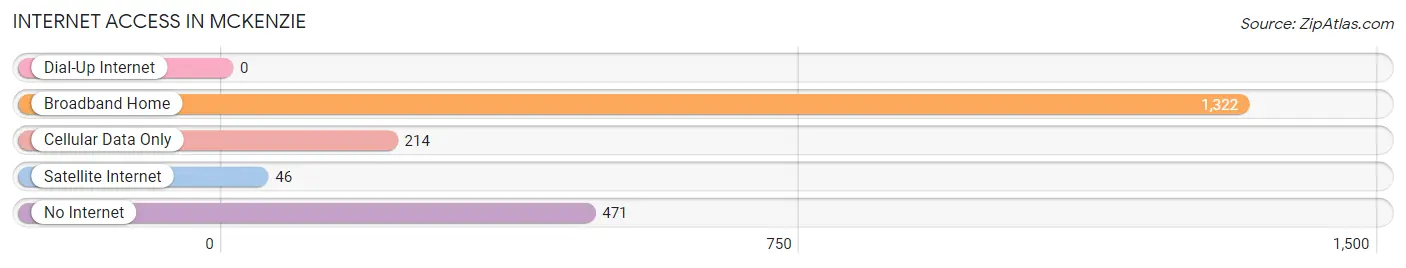
| Internet Type | # Households | % Households |
| Dial-Up Internet | 0 | 0.0% |
| Broadband Home | 1,322 | 64.1% |
| Cellular Data Only | 214 | 10.4% |
| Satellite Internet | 46 | 2.2% |
| No Internet | 471 | 22.8% |
| Total | 2,063 | 100.0% |
McKenzie Summary
Mckenzie is a small town located in the northwest corner of Tennessee, in the United States. It is the county seat of Carroll County and is situated along the banks of the Tennessee River. The town has a population of 5,717 as of the 2010 census.
History
Mckenzie was founded in 1823 by William Mckenzie, a Revolutionary War veteran. The town was named after him and was originally known as Mckenzie’s Crossroads. The town was incorporated in 1836 and was the first county seat of Carroll County.
In the late 19th century, Mckenzie was a thriving agricultural center and was known for its cotton production. The town was also home to several manufacturing plants, including a cotton mill, a furniture factory, and a shoe factory.
Geography
Mckenzie is located in the northwest corner of Tennessee, in the United States. It is situated along the banks of the Tennessee River and is surrounded by rolling hills and farmland. The town is located about 80 miles northwest of Nashville and about 60 miles east of Memphis.
The climate in Mckenzie is humid subtropical, with hot summers and mild winters. The average annual temperature is around 64 degrees Fahrenheit. The town receives an average of 48 inches of precipitation per year.
Economy
Mckenzie’s economy is largely based on agriculture and manufacturing. The town is home to several large farms, which produce cotton, soybeans, corn, and other crops. The town is also home to several manufacturing plants, including a cotton mill, a furniture factory, and a shoe factory.
The town is also home to several small businesses, including restaurants, shops, and other services. The town is also home to several educational institutions, including Bethel University and the University of Tennessee at Martin.
Demographics
As of the 2010 census, Mckenzie had a population of 5,717. The racial makeup of the town was 87.3% White, 8.7% African American, 0.3% Native American, 0.3% Asian, 0.1% Pacific Islander, 1.2% from other races, and 2.3% from two or more races. Hispanic or Latino of any race were 3.2% of the population.
The median income for a household in Mckenzie was $31,944, and the median income for a family was $41,250. The per capita income for the town was $17,845. About 17.2% of families and 21.2% of the population were below the poverty line, including 28.3% of those under age 18 and 16.2% of those age 65 or over.
Common Questions
What is Per Capita Income in McKenzie?
Per Capita income in McKenzie is $23,433.
What is the Median Family Income in McKenzie?
Median Family Income in McKenzie is $75,776.
What is the Median Household income in McKenzie?
Median Household Income in McKenzie is $38,628.
What is Income or Wage Gap in McKenzie?
Income or Wage Gap in McKenzie is 9.5%.
Women in McKenzie earn 90.5 cents for every dollar earned by a man.
What is Inequality or Gini Index in McKenzie?
Inequality or Gini Index in McKenzie is 0.47.
What is the Total Population of McKenzie?
Total Population of McKenzie is 5,608.
What is the Total Male Population of McKenzie?
Total Male Population of McKenzie is 2,765.
What is the Total Female Population of McKenzie?
Total Female Population of McKenzie is 2,843.
What is the Ratio of Males per 100 Females in McKenzie?
There are 97.26 Males per 100 Females in McKenzie.
What is the Ratio of Females per 100 Males in McKenzie?
There are 102.82 Females per 100 Males in McKenzie.
What is the Median Population Age in McKenzie?
Median Population Age in McKenzie is 36.9 Years.
What is the Average Family Size in McKenzie
Average Family Size in McKenzie is 3.1 People.
What is the Average Household Size in McKenzie
Average Household Size in McKenzie is 2.4 People.
How Large is the Labor Force in McKenzie?
There are 2,462 People in the Labor Forcein in McKenzie.
What is the Percentage of People in the Labor Force in McKenzie?
53.2% of People are in the Labor Force in McKenzie.
What is the Unemployment Rate in McKenzie?
Unemployment Rate in McKenzie is 5.0%.