Mooresburg, TN Map & Demographics
Mooresburg Map
Mooresburg Overview
$22,715
PER CAPITA INCOME
$70,038
AVG FAMILY INCOME
$38,491
AVG HOUSEHOLD INCOME
15.3%
WAGE / INCOME GAP [ % ]
84.7¢/ $1
WAGE / INCOME GAP [ $ ]
0.51
INEQUALITY / GINI INDEX
903
TOTAL POPULATION
494
MALE POPULATION
409
FEMALE POPULATION
120.78
MALES / 100 FEMALES
82.79
FEMALES / 100 MALES
43.2
MEDIAN AGE
3.3
AVG FAMILY SIZE
2.3
AVG HOUSEHOLD SIZE
427
LABOR FORCE [ PEOPLE ]
63.5%
PERCENT IN LABOR FORCE
9.1%
UNEMPLOYMENT RATE
Mooresburg Zip Codes
Mooresburg Area Codes
Income in Mooresburg
Income Overview in Mooresburg
Per Capita Income in Mooresburg is $22,715, while median incomes of families and households are $70,038 and $38,491 respectively.
| Characteristic | Number | Measure |
| Per Capita Income | 903 | $22,715 |
| Median Family Income | 169 | $70,038 |
| Mean Family Income | 169 | $66,122 |
| Median Household Income | 398 | $38,491 |
| Mean Household Income | 398 | $49,713 |
| Income Deficit | 169 | $0 |
| Wage / Income Gap (%) | 903 | 15.27% |
| Wage / Income Gap ($) | 903 | 84.73¢ per $1 |
| Gini / Inequality Index | 903 | 0.51 |
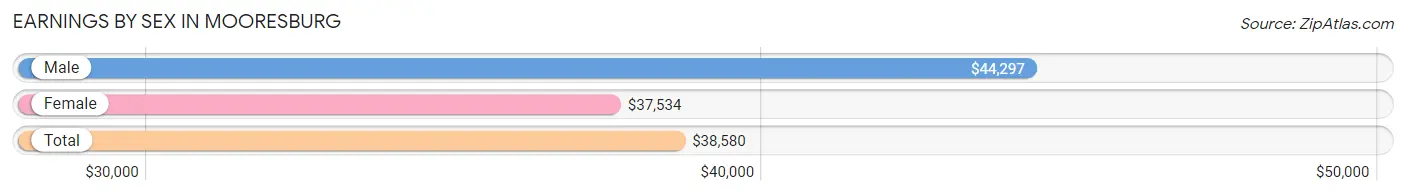
Earnings by Sex in Mooresburg
Average Earnings in Mooresburg are $38,580, $44,297 for men and $37,534 for women, a difference of 15.3%.
| Sex | Number | Average Earnings |
| Male | 233 (56.3%) | $44,297 |
| Female | 181 (43.7%) | $37,534 |
| Total | 414 (100.0%) | $38,580 |
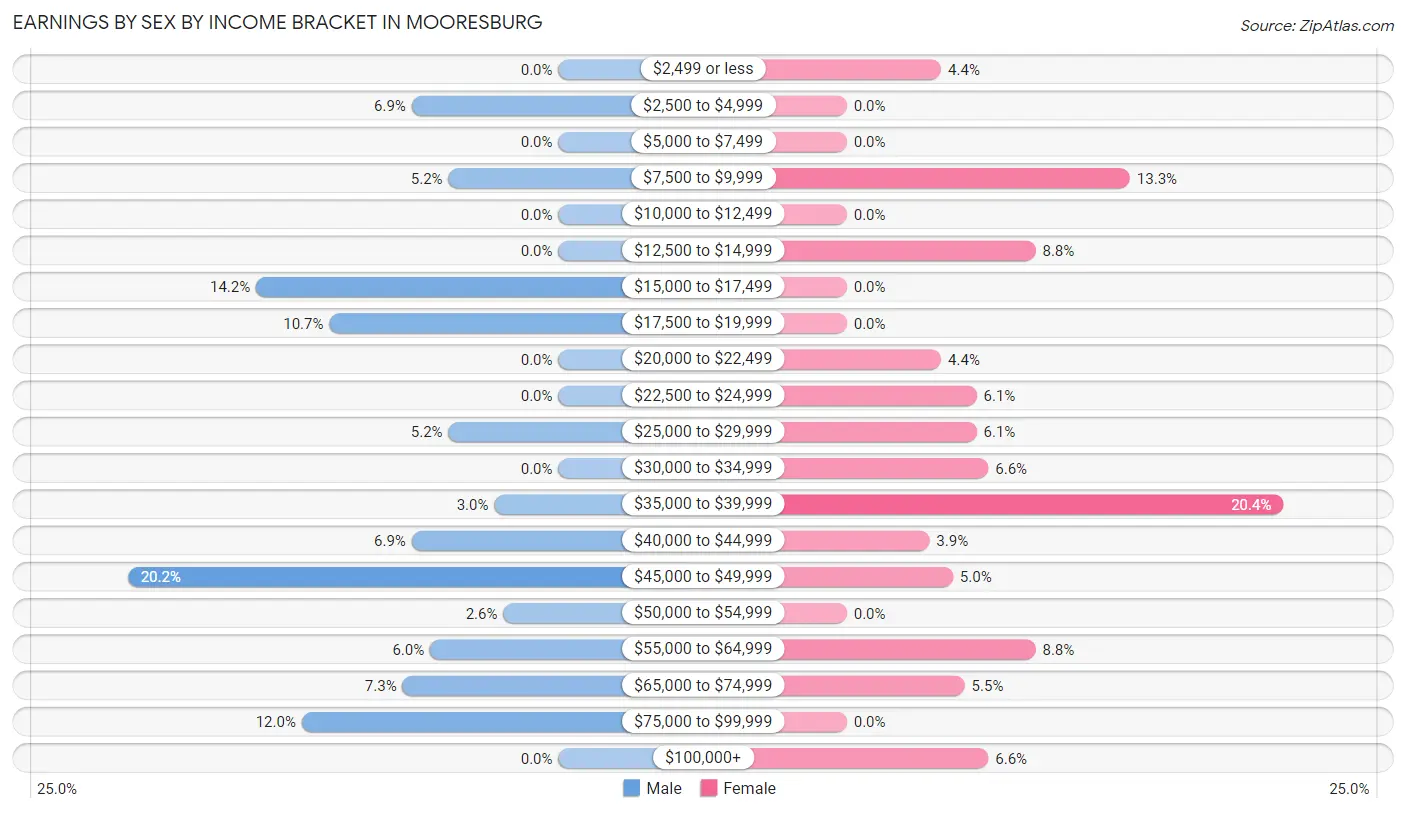
Earnings by Sex by Income Bracket in Mooresburg
The most common earnings brackets in Mooresburg are $45,000 to $49,999 for men (47 | 20.2%) and $35,000 to $39,999 for women (37 | 20.4%).
| Income | Male | Female |
| $2,499 or less | 0 (0.0%) | 8 (4.4%) |
| $2,500 to $4,999 | 16 (6.9%) | 0 (0.0%) |
| $5,000 to $7,499 | 0 (0.0%) | 0 (0.0%) |
| $7,500 to $9,999 | 12 (5.1%) | 24 (13.3%) |
| $10,000 to $12,499 | 0 (0.0%) | 0 (0.0%) |
| $12,500 to $14,999 | 0 (0.0%) | 16 (8.8%) |
| $15,000 to $17,499 | 33 (14.2%) | 0 (0.0%) |
| $17,500 to $19,999 | 25 (10.7%) | 0 (0.0%) |
| $20,000 to $22,499 | 0 (0.0%) | 8 (4.4%) |
| $22,500 to $24,999 | 0 (0.0%) | 11 (6.1%) |
| $25,000 to $29,999 | 12 (5.1%) | 11 (6.1%) |
| $30,000 to $34,999 | 0 (0.0%) | 12 (6.6%) |
| $35,000 to $39,999 | 7 (3.0%) | 37 (20.4%) |
| $40,000 to $44,999 | 16 (6.9%) | 7 (3.9%) |
| $45,000 to $49,999 | 47 (20.2%) | 9 (5.0%) |
| $50,000 to $54,999 | 6 (2.6%) | 0 (0.0%) |
| $55,000 to $64,999 | 14 (6.0%) | 16 (8.8%) |
| $65,000 to $74,999 | 17 (7.3%) | 10 (5.5%) |
| $75,000 to $99,999 | 28 (12.0%) | 0 (0.0%) |
| $100,000+ | 0 (0.0%) | 12 (6.6%) |
| Total | 233 (100.0%) | 181 (100.0%) |
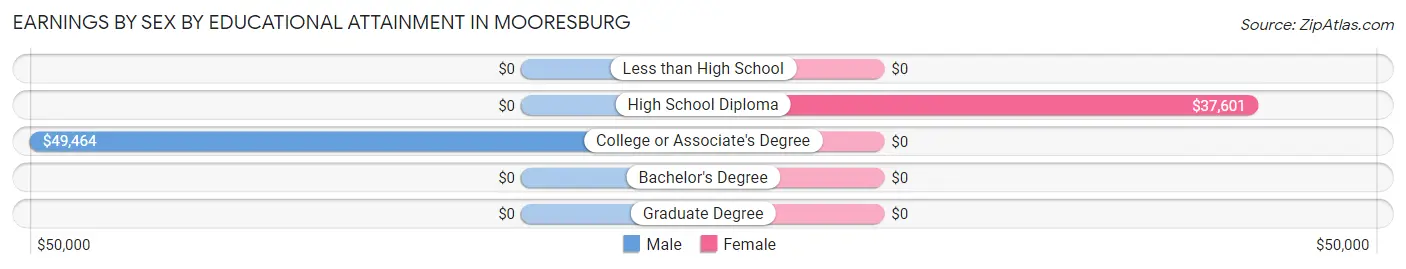
Earnings by Sex by Educational Attainment in Mooresburg
Average earnings in Mooresburg are $45,625 for men and $38,345 for women, a difference of 16.0%. Men with an educational attainment of college or associate's degree enjoy the highest average annual earnings of $49,464, while those with college or associate's degree education earn the least with $49,464. Women with an educational attainment of high school diploma earn the most with the average annual earnings of $37,601, while those with high school diploma education have the smallest earnings of $37,601.
| Educational Attainment | Male Income | Female Income |
| Less than High School | - | - |
| High School Diploma | - | - |
| College or Associate's Degree | $49,464 | $0 |
| Bachelor's Degree | - | - |
| Graduate Degree | - | - |
| Total | $45,625 | $38,345 |
Family Income in Mooresburg
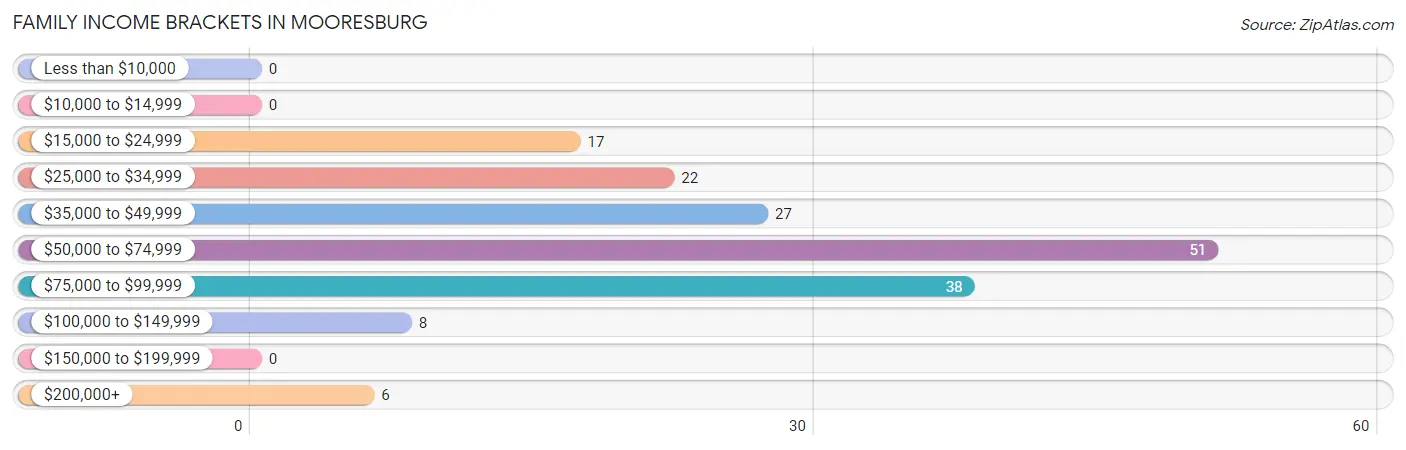
Family Income Brackets in Mooresburg
According to the Mooresburg family income data, there are 51 families falling into the $50,000 to $74,999 income range, which is the most common income bracket and makes up 30.2% of all families.
| Income Bracket | # Families | % Families |
| Less than $10,000 | 0 | 0.0% |
| $10,000 to $14,999 | 0 | 0.0% |
| $15,000 to $24,999 | 17 | 10.1% |
| $25,000 to $34,999 | 22 | 13.0% |
| $35,000 to $49,999 | 27 | 16.0% |
| $50,000 to $74,999 | 51 | 30.2% |
| $75,000 to $99,999 | 38 | 22.5% |
| $100,000 to $149,999 | 8 | 4.7% |
| $150,000 to $199,999 | 0 | 0.0% |
| $200,000+ | 6 | 3.6% |
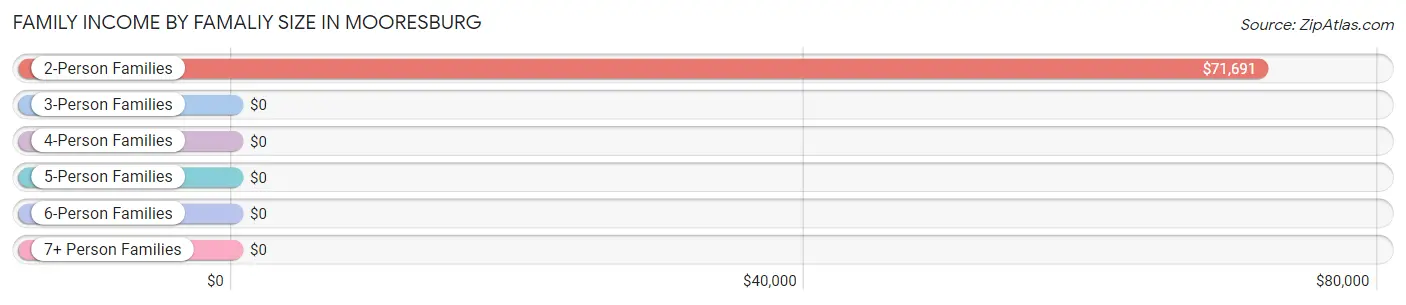
Family Income by Famaliy Size in Mooresburg
2-person families (87 | 51.5%) account for the highest median family income in Mooresburg with $71,691 per family, while 2-person families (87 | 51.5%) have the highest median income of $35,846 per family member.
| Income Bracket | # Families | Median Income |
| 2-Person Families | 87 (51.5%) | $71,691 |
| 3-Person Families | 23 (13.6%) | $0 |
| 4-Person Families | 32 (18.9%) | $0 |
| 5-Person Families | 27 (16.0%) | $0 |
| 6-Person Families | 0 (0.0%) | $0 |
| 7+ Person Families | 0 (0.0%) | $0 |
| Total | 169 (100.0%) | $70,038 |
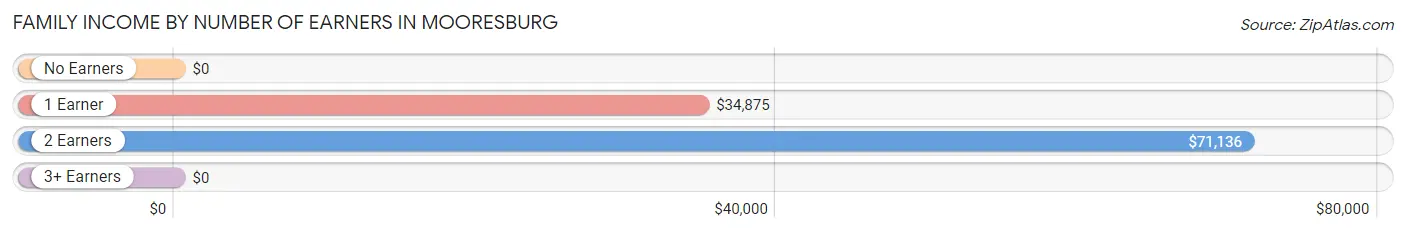
Family Income by Number of Earners in Mooresburg
| Number of Earners | # Families | Median Income |
| No Earners | 0 (0.0%) | $0 |
| 1 Earner | 77 (45.6%) | $34,875 |
| 2 Earners | 86 (50.9%) | $71,136 |
| 3+ Earners | 6 (3.5%) | $0 |
| Total | 169 (100.0%) | $70,038 |
Household Income in Mooresburg
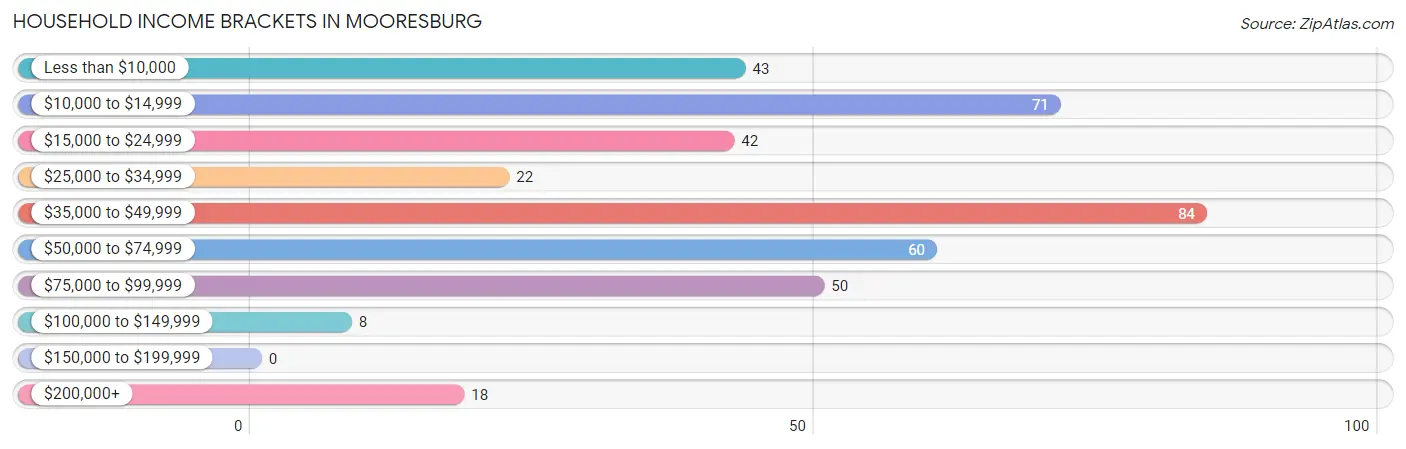
Household Income Brackets in Mooresburg
With 84 households falling in the category, the $35,000 to $49,999 income range is the most frequent in Mooresburg, accounting for 21.1% of all households.
| Income Bracket | # Households | % Households |
| Less than $10,000 | 43 | 10.8% |
| $10,000 to $14,999 | 71 | 17.8% |
| $15,000 to $24,999 | 42 | 10.6% |
| $25,000 to $34,999 | 22 | 5.5% |
| $35,000 to $49,999 | 84 | 21.1% |
| $50,000 to $74,999 | 60 | 15.1% |
| $75,000 to $99,999 | 50 | 12.6% |
| $100,000 to $149,999 | 8 | 2.0% |
| $150,000 to $199,999 | 0 | 0.0% |
| $200,000+ | 18 | 4.5% |
Household Income by Householder Age in Mooresburg
The median household income in Mooresburg is $38,491, with the highest median household income of $38,615 found in the 25 to 44 years age bracket for the primary householder. A total of 131 households (32.9%) fall into this category. Meanwhile, the 15 to 24 years age bracket for the primary householder has the lowest median household income of $0, with 7 households (1.8%) in this group.
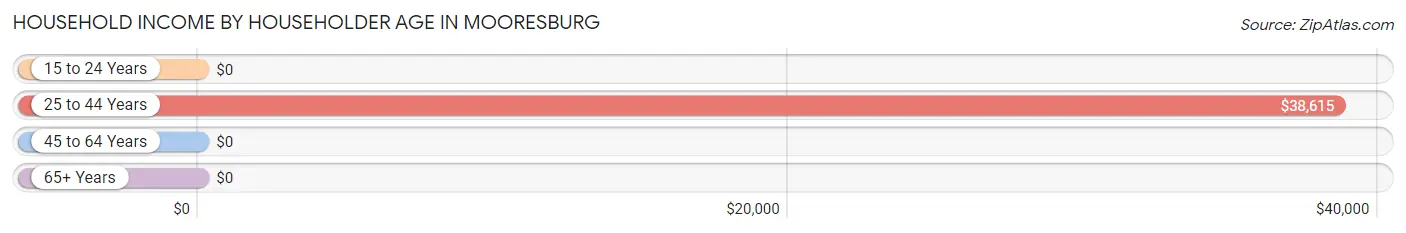
| Income Bracket | # Households | Median Income |
| 15 to 24 Years | 7 (1.8%) | $0 |
| 25 to 44 Years | 131 (32.9%) | $38,615 |
| 45 to 64 Years | 167 (42.0%) | $0 |
| 65+ Years | 93 (23.4%) | $0 |
| Total | 398 (100.0%) | $38,491 |
Poverty in Mooresburg
Income Below Poverty by Sex and Age in Mooresburg
With 29.3% poverty level for males and 19.1% for females among the residents of Mooresburg, 6 to 11 year old males and 12 to 14 year old females are the most vulnerable to poverty, with 25 males (69.4%) and 17 females (68.0%) in their respective age groups living below the poverty level.
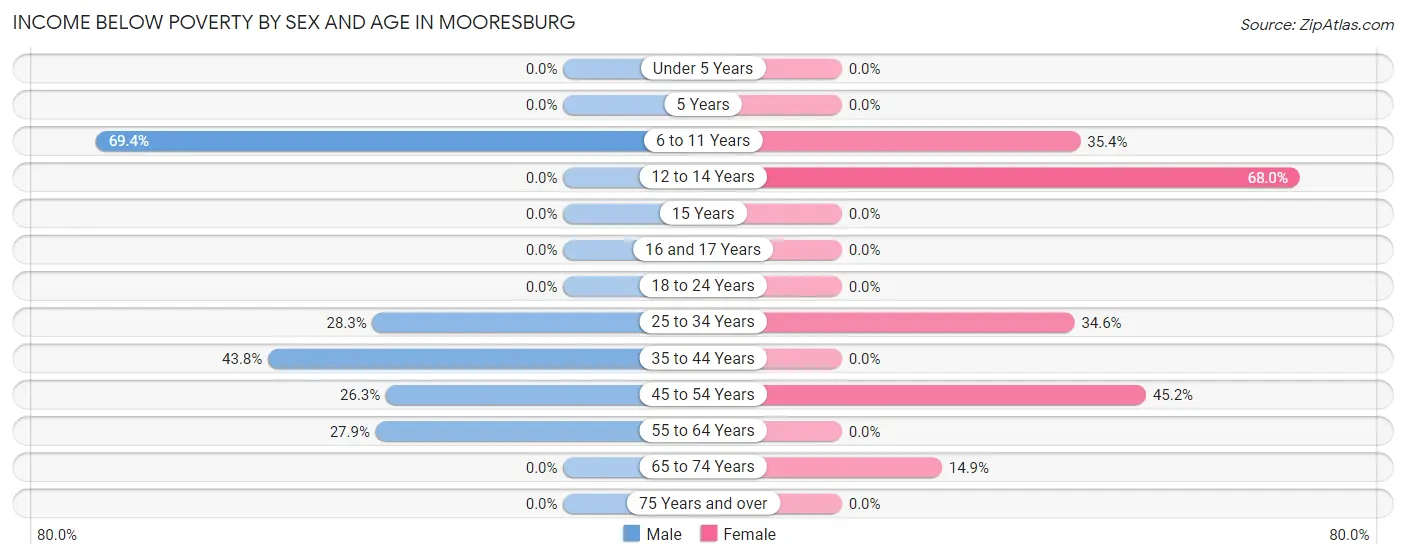
| Age Bracket | Male | Female |
| Under 5 Years | 0 (0.0%) | 0 (0.0%) |
| 5 Years | 0 (0.0%) | 0 (0.0%) |
| 6 to 11 Years | 25 (69.4%) | 17 (35.4%) |
| 12 to 14 Years | 0 (0.0%) | 17 (68.0%) |
| 15 Years | 0 (0.0%) | 0 (0.0%) |
| 16 and 17 Years | 0 (0.0%) | 0 (0.0%) |
| 18 to 24 Years | 0 (0.0%) | 0 (0.0%) |
| 25 to 34 Years | 17 (28.3%) | 19 (34.5%) |
| 35 to 44 Years | 32 (43.8%) | 0 (0.0%) |
| 45 to 54 Years | 10 (26.3%) | 14 (45.2%) |
| 55 to 64 Years | 39 (27.9%) | 0 (0.0%) |
| 65 to 74 Years | 0 (0.0%) | 11 (14.9%) |
| 75 Years and over | 0 (0.0%) | 0 (0.0%) |
| Total | 123 (29.3%) | 78 (19.1%) |
Income Above Poverty by Sex and Age in Mooresburg
According to the poverty statistics in Mooresburg, males aged 5 years and females aged under 5 years are the age groups that are most secure financially, with 100.0% of males and 100.0% of females in these age groups living above the poverty line.
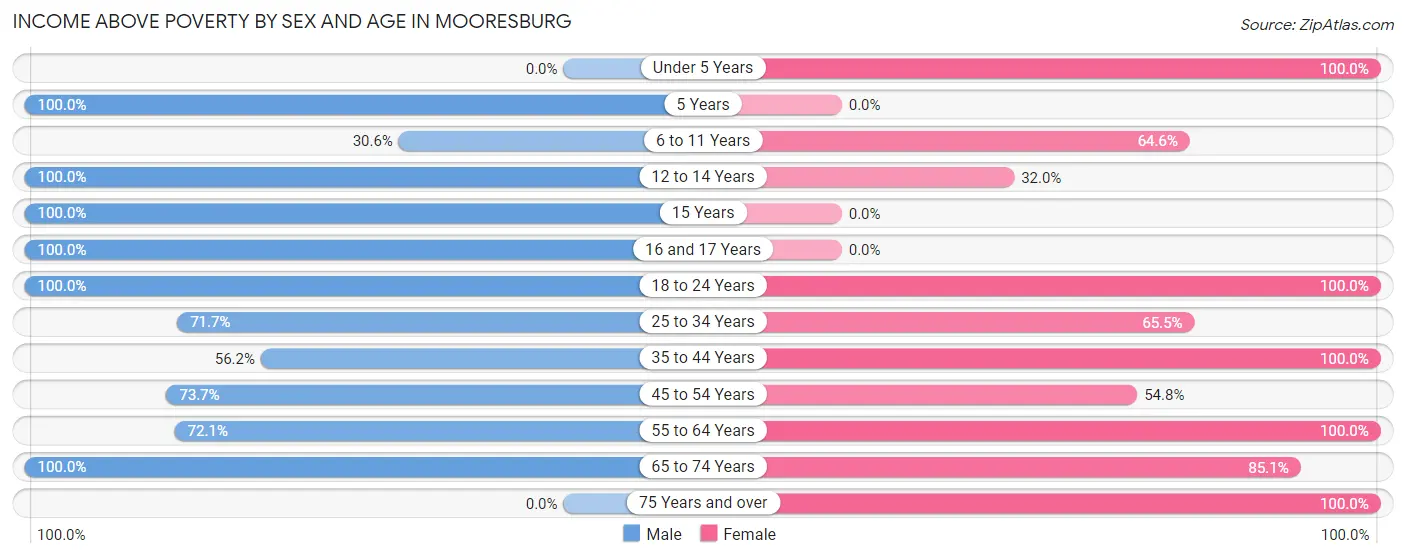
| Age Bracket | Male | Female |
| Under 5 Years | 0 (0.0%) | 10 (100.0%) |
| 5 Years | 16 (100.0%) | 0 (0.0%) |
| 6 to 11 Years | 11 (30.6%) | 31 (64.6%) |
| 12 to 14 Years | 10 (100.0%) | 8 (32.0%) |
| 15 Years | 12 (100.0%) | 0 (0.0%) |
| 16 and 17 Years | 12 (100.0%) | 0 (0.0%) |
| 18 to 24 Years | 13 (100.0%) | 31 (100.0%) |
| 25 to 34 Years | 43 (71.7%) | 36 (65.4%) |
| 35 to 44 Years | 41 (56.2%) | 58 (100.0%) |
| 45 to 54 Years | 28 (73.7%) | 17 (54.8%) |
| 55 to 64 Years | 101 (72.1%) | 43 (100.0%) |
| 65 to 74 Years | 10 (100.0%) | 63 (85.1%) |
| 75 Years and over | 0 (0.0%) | 34 (100.0%) |
| Total | 297 (70.7%) | 331 (80.9%) |
Income Below Poverty Among Married-Couple Families in Mooresburg
The poverty statistics for married-couple families in Mooresburg show that 18.1% or 17 of the total 94 families live below the poverty line. Families with 3 or 4 children have the highest poverty rate of 63.0%, comprising of 17 families. On the other hand, families with no children have the lowest poverty rate of 0.0%, which includes 0 families.
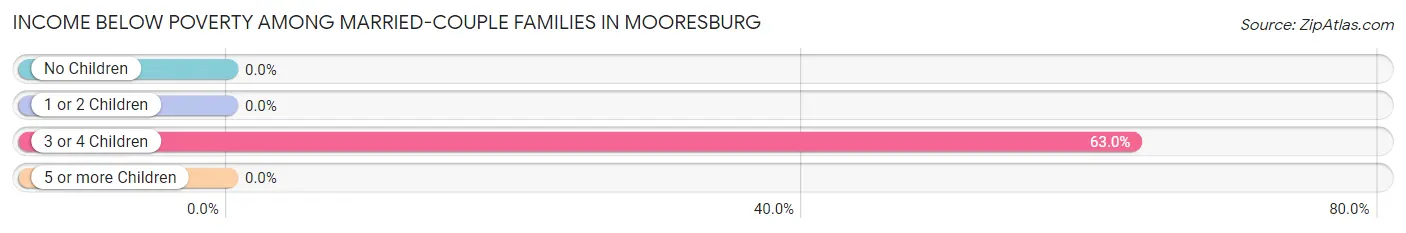
| Children | Above Poverty | Below Poverty |
| No Children | 51 (100.0%) | 0 (0.0%) |
| 1 or 2 Children | 16 (100.0%) | 0 (0.0%) |
| 3 or 4 Children | 10 (37.0%) | 17 (63.0%) |
| 5 or more Children | 0 (0.0%) | 0 (0.0%) |
| Total | 77 (81.9%) | 17 (18.1%) |
Income Below Poverty Among Single-Parent Households in Mooresburg
| Children | Single Father | Single Mother |
| No Children | 0 (0.0%) | 0 (0.0%) |
| 1 or 2 Children | 0 (0.0%) | 0 (0.0%) |
| 3 or 4 Children | 0 (0.0%) | 0 (0.0%) |
| 5 or more Children | 0 (0.0%) | 0 (0.0%) |
| Total | 0 (0.0%) | 0 (0.0%) |
Income Below Poverty Among Married-Couple vs Single-Parent Households in Mooresburg
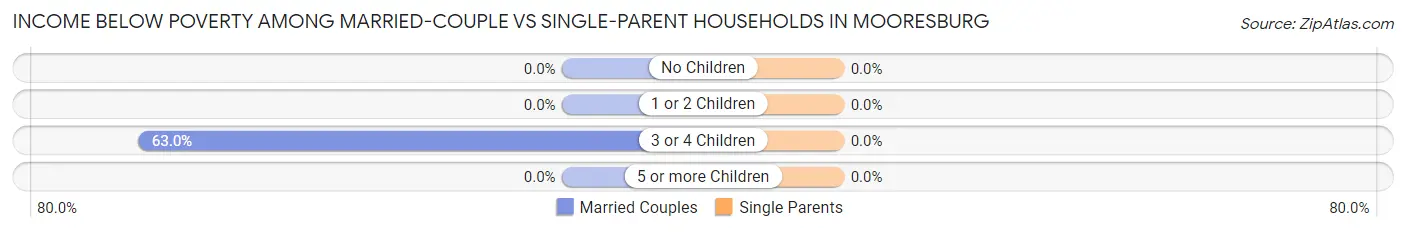
| Children | Married-Couple Families | Single-Parent Households |
| No Children | 0 (0.0%) | 0 (0.0%) |
| 1 or 2 Children | 0 (0.0%) | 0 (0.0%) |
| 3 or 4 Children | 17 (63.0%) | 0 (0.0%) |
| 5 or more Children | 0 (0.0%) | 0 (0.0%) |
| Total | 17 (18.1%) | 0 (0.0%) |
Race in Mooresburg
The most populous races in Mooresburg are , and White / Caucasian (903 | 100.0%).
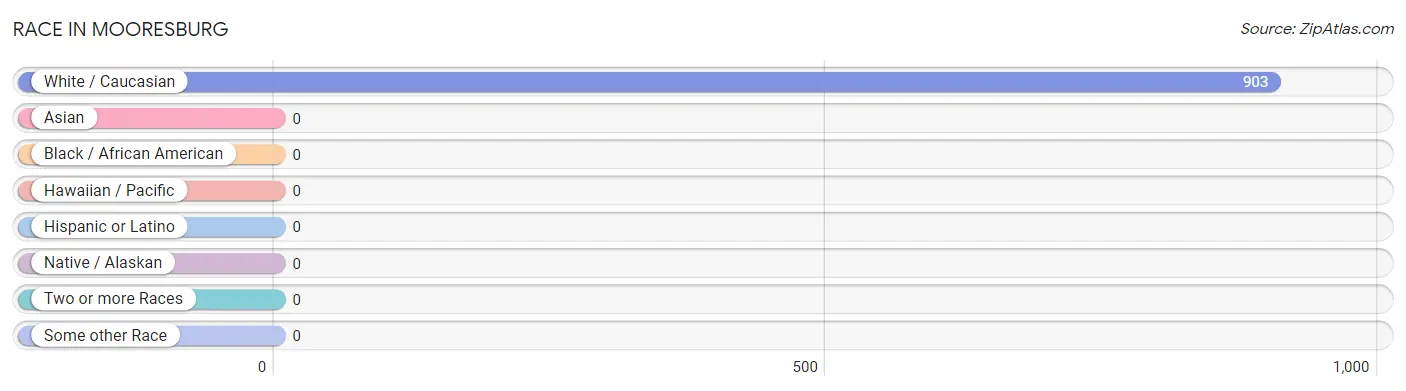
| Race | # Population | % Population |
| Asian | 0 | 0.0% |
| Black / African American | 0 | 0.0% |
| Hawaiian / Pacific | 0 | 0.0% |
| Hispanic or Latino | 0 | 0.0% |
| Native / Alaskan | 0 | 0.0% |
| White / Caucasian | 903 | 100.0% |
| Two or more Races | 0 | 0.0% |
| Some other Race | 0 | 0.0% |
| Total | 903 | 100.0% |
Ancestry in Mooresburg
The most populous ancestries reported in Mooresburg are Scotch-Irish (212 | 23.5%), Irish (84 | 9.3%), American (70 | 7.7%), German (60 | 6.6%), and English (48 | 5.3%), together accounting for 52.5% of all Mooresburg residents.
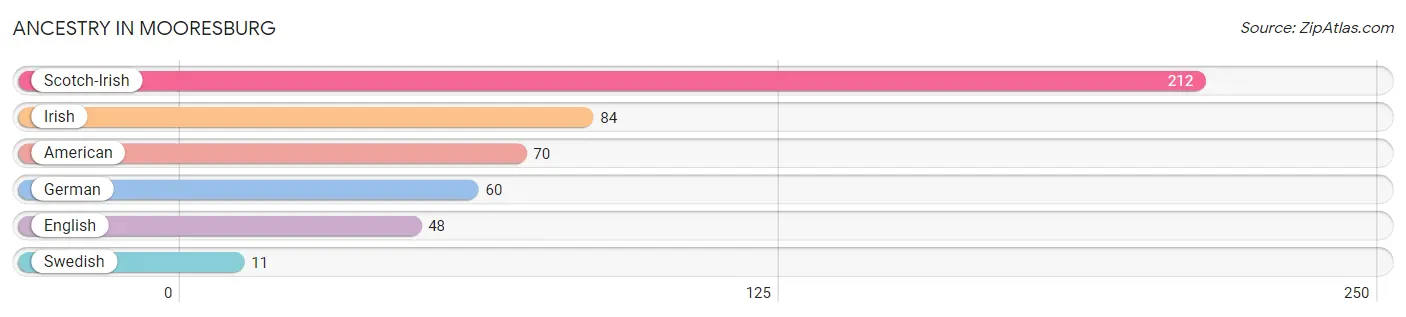
| Ancestry | # Population | % Population |
| American | 70 | 7.7% |
| English | 48 | 5.3% |
| German | 60 | 6.6% |
| Irish | 84 | 9.3% |
| Scotch-Irish | 212 | 23.5% |
| Swedish | 11 | 1.2% | View All 6 Rows |
Immigrants in Mooresburg
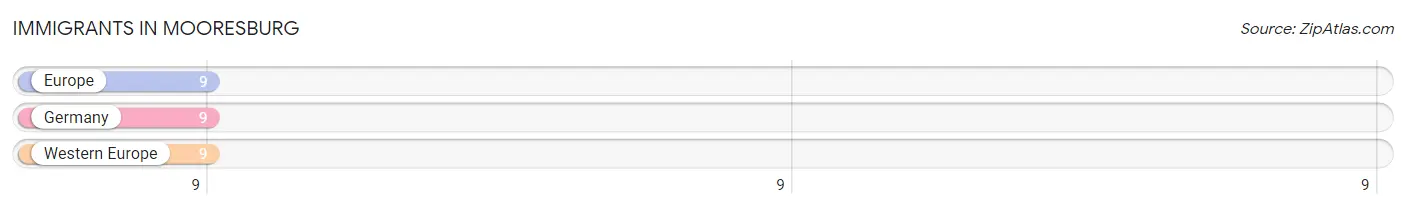
The most numerous immigrant groups reported in Mooresburg came from Europe (9 | 1.0%), Germany (9 | 1.0%), and Western Europe (9 | 1.0%), together accounting for 3.0% of all Mooresburg residents.
| Immigration Origin | # Population | % Population |
| Europe | 9 | 1.0% |
| Germany | 9 | 1.0% |
| Western Europe | 9 | 1.0% | View All 3 Rows |
Sex and Age in Mooresburg
Sex and Age in Mooresburg
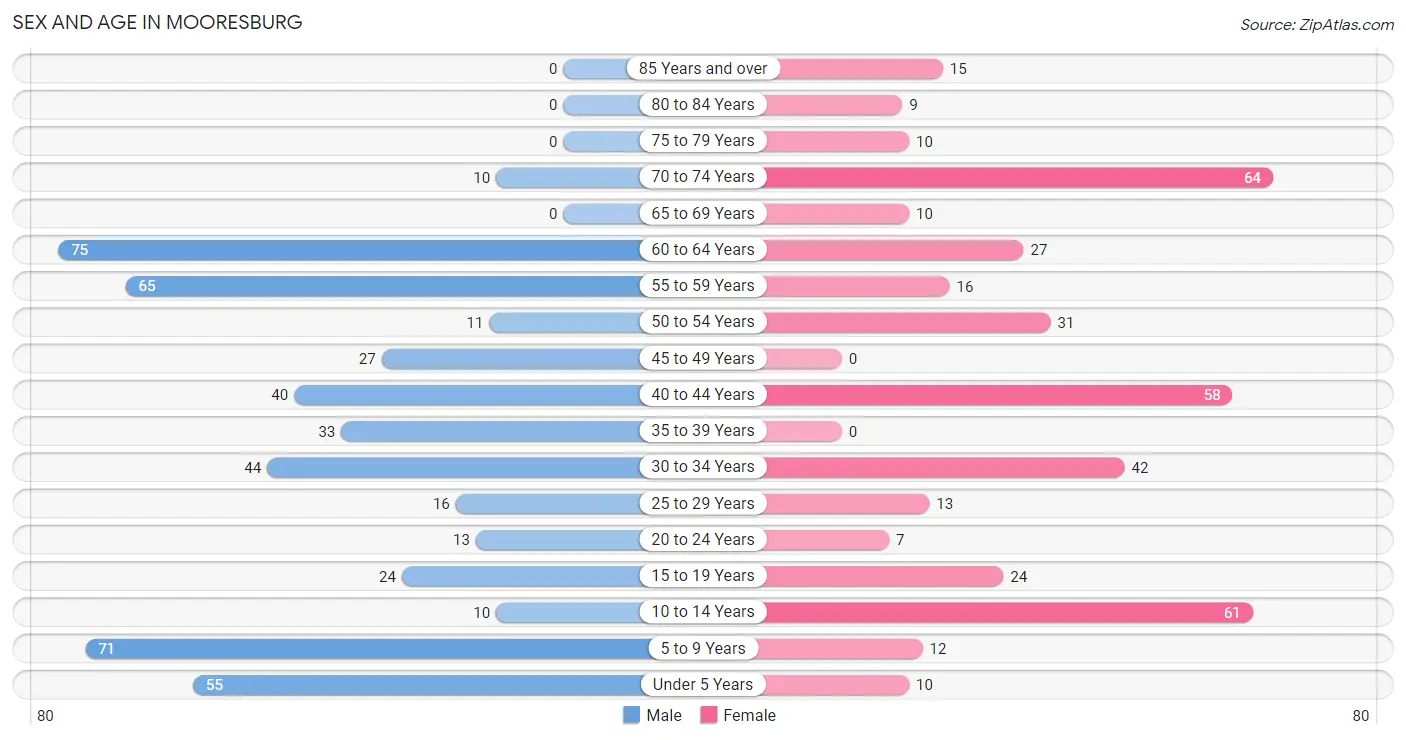
The most populous age groups in Mooresburg are 60 to 64 Years (75 | 15.2%) for men and 70 to 74 Years (64 | 15.7%) for women.
| Age Bracket | Male | Female |
| Under 5 Years | 55 (11.1%) | 10 (2.4%) |
| 5 to 9 Years | 71 (14.4%) | 12 (2.9%) |
| 10 to 14 Years | 10 (2.0%) | 61 (14.9%) |
| 15 to 19 Years | 24 (4.9%) | 24 (5.9%) |
| 20 to 24 Years | 13 (2.6%) | 7 (1.7%) |
| 25 to 29 Years | 16 (3.2%) | 13 (3.2%) |
| 30 to 34 Years | 44 (8.9%) | 42 (10.3%) |
| 35 to 39 Years | 33 (6.7%) | 0 (0.0%) |
| 40 to 44 Years | 40 (8.1%) | 58 (14.2%) |
| 45 to 49 Years | 27 (5.5%) | 0 (0.0%) |
| 50 to 54 Years | 11 (2.2%) | 31 (7.6%) |
| 55 to 59 Years | 65 (13.2%) | 16 (3.9%) |
| 60 to 64 Years | 75 (15.2%) | 27 (6.6%) |
| 65 to 69 Years | 0 (0.0%) | 10 (2.4%) |
| 70 to 74 Years | 10 (2.0%) | 64 (15.7%) |
| 75 to 79 Years | 0 (0.0%) | 10 (2.4%) |
| 80 to 84 Years | 0 (0.0%) | 9 (2.2%) |
| 85 Years and over | 0 (0.0%) | 15 (3.7%) |
| Total | 494 (100.0%) | 409 (100.0%) |
Families and Households in Mooresburg
Median Family Size in Mooresburg
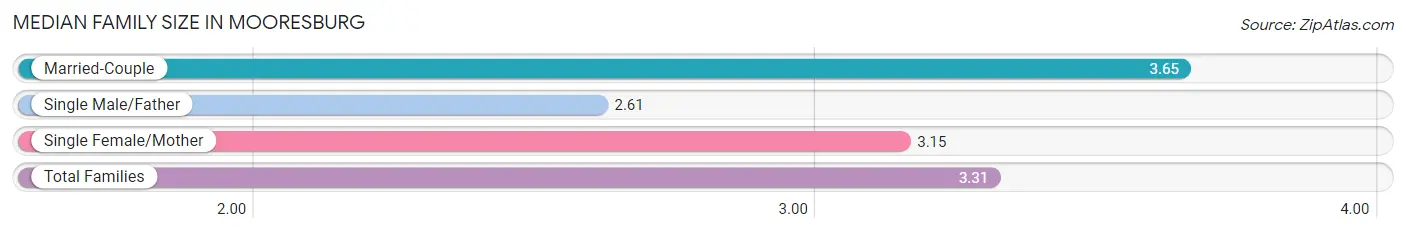
The median family size in Mooresburg is 3.31 persons per family, with married-couple families (94 | 55.6%) accounting for the largest median family size of 3.65 persons per family. On the other hand, single male/father families (36 | 21.3%) represent the smallest median family size with 2.61 persons per family.
| Family Type | # Families | Family Size |
| Married-Couple | 94 (55.6%) | 3.65 |
| Single Male/Father | 36 (21.3%) | 2.61 |
| Single Female/Mother | 39 (23.1%) | 3.15 |
| Total Families | 169 (100.0%) | 3.31 |
Median Household Size in Mooresburg
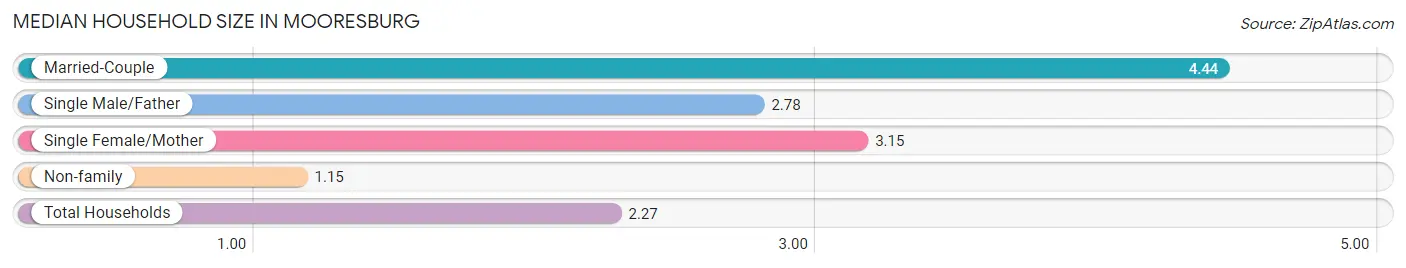
The median household size in Mooresburg is 2.27 persons per household, with married-couple households (94 | 23.6%) accounting for the largest median household size of 4.44 persons per household. non-family households (229 | 57.5%) represent the smallest median household size with 1.15 persons per household.
| Household Type | # Households | Household Size |
| Married-Couple | 94 (23.6%) | 4.44 |
| Single Male/Father | 36 (9.0%) | 2.78 |
| Single Female/Mother | 39 (9.8%) | 3.15 |
| Non-family | 229 (57.5%) | 1.15 |
| Total Households | 398 (100.0%) | 2.27 |
Household Size by Marriage Status in Mooresburg
Out of a total of 398 households in Mooresburg, 169 (42.5%) are family households, while 229 (57.5%) are nonfamily households. The most numerous type of family households are 2-person households, comprising 87, and the most common type of nonfamily households are 1-person households, comprising 197.
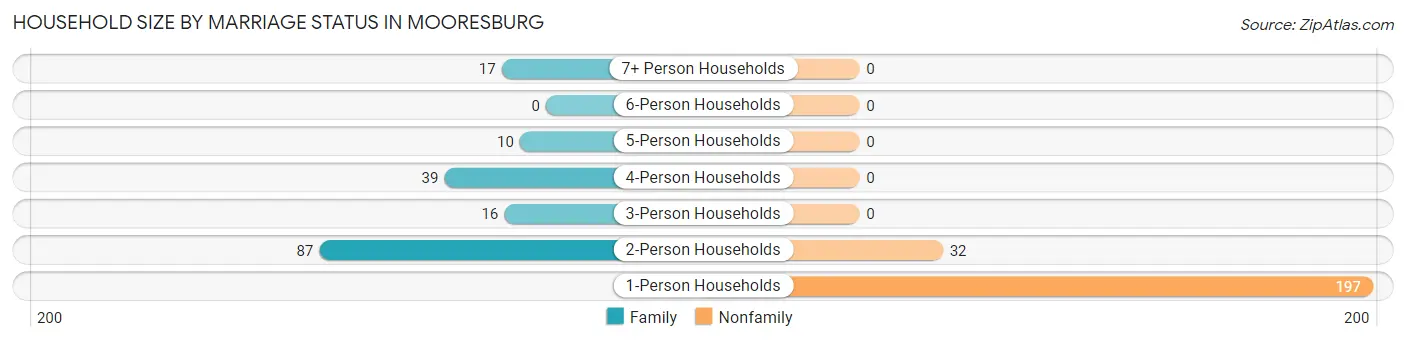
| Household Size | Family Households | Nonfamily Households |
| 1-Person Households | - | 197 (49.5%) |
| 2-Person Households | 87 (21.9%) | 32 (8.0%) |
| 3-Person Households | 16 (4.0%) | 0 (0.0%) |
| 4-Person Households | 39 (9.8%) | 0 (0.0%) |
| 5-Person Households | 10 (2.5%) | 0 (0.0%) |
| 6-Person Households | 0 (0.0%) | 0 (0.0%) |
| 7+ Person Households | 17 (4.3%) | 0 (0.0%) |
| Total | 169 (42.5%) | 229 (57.5%) |
Female Fertility in Mooresburg
Fertility by Age in Mooresburg
| Age Bracket | Women with Births | Births / 1,000 Women |
| 15 to 19 years | 0 (0.0%) | 0.0 |
| 20 to 34 years | 0 (0.0%) | 0.0 |
| 35 to 50 years | 0 (0.0%) | 0.0 |
| Total | 0 (0.0%) | 0.0 |
Fertility by Age by Marriage Status in Mooresburg
| Age Bracket | Married | Unmarried |
| 15 to 19 years | 0 (0.0%) | 0 (0.0%) |
| 20 to 34 years | 0 (0.0%) | 0 (0.0%) |
| 35 to 50 years | 0 (0.0%) | 0 (0.0%) |
| Total | 0 (0.0%) | 0 (0.0%) |
Fertility by Education in Mooresburg
| Educational Attainment | Women with Births | Births / 1,000 Women |
| Less than High School | 0 (0.0%) | 0.0 |
| High School Diploma | 0 (0.0%) | 0.0 |
| College or Associate's Degree | 0 (0.0%) | 0.0 |
| Bachelor's Degree | 0 (0.0%) | 0.0 |
| Graduate Degree | 0 (0.0%) | 0.0 |
| Total | 0 (0.0%) | 0.0 |
Fertility by Education by Marriage Status in Mooresburg
| Educational Attainment | Married | Unmarried |
| Less than High School | 0 (0.0%) | 0 (0.0%) |
| High School Diploma | 0 (0.0%) | 0 (0.0%) |
| College or Associate's Degree | 0 (0.0%) | 0 (0.0%) |
| Bachelor's Degree | 0 (0.0%) | 0 (0.0%) |
| Graduate Degree | 0 (0.0%) | 0 (0.0%) |
| Total | 0 (0.0%) | 0 (0.0%) |
Employment Characteristics in Mooresburg
Employment by Class of Employer in Mooresburg
Among the 388 employed individuals in Mooresburg, private company employees (213 | 54.9%), self-employed (not incorporated) (53 | 13.7%), and not-for-profit organizations (40 | 10.3%) make up the most common classes of employment.
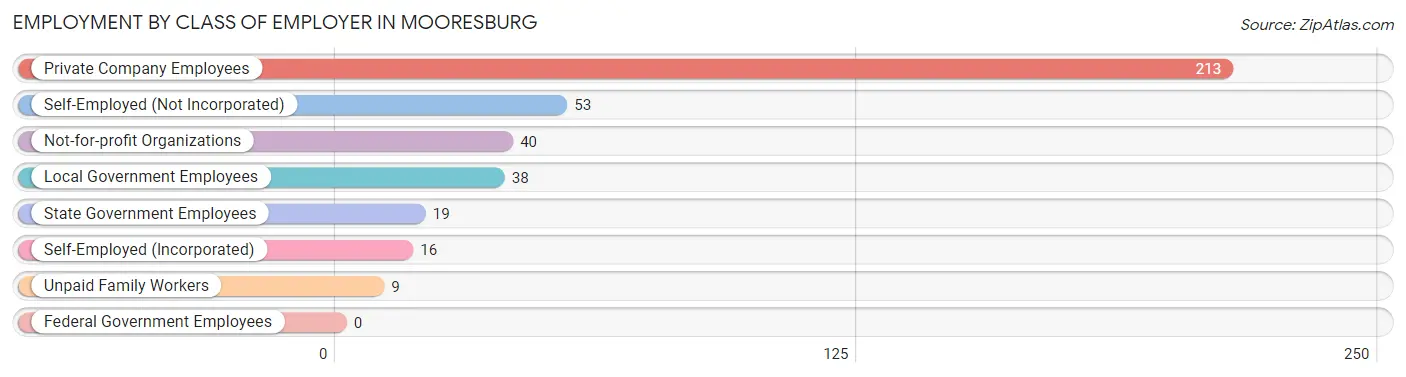
| Employer Class | # Employees | % Employees |
| Private Company Employees | 213 | 54.9% |
| Self-Employed (Incorporated) | 16 | 4.1% |
| Self-Employed (Not Incorporated) | 53 | 13.7% |
| Not-for-profit Organizations | 40 | 10.3% |
| Local Government Employees | 38 | 9.8% |
| State Government Employees | 19 | 4.9% |
| Federal Government Employees | 0 | 0.0% |
| Unpaid Family Workers | 9 | 2.3% |
| Total | 388 | 100.0% |
Employment Status by Age in Mooresburg
According to the labor force statistics for Mooresburg, out of the total population over 16 years of age (672), 63.5% or 427 individuals are in the labor force, with 9.1% or 39 of them unemployed. The age group with the highest labor force participation rate is 16 to 19 years, with 100.0% or 36 individuals in the labor force. Within the labor force, the 20 to 24 years age range has the highest percentage of unemployed individuals, with 65.0% or 13 of them being unemployed.
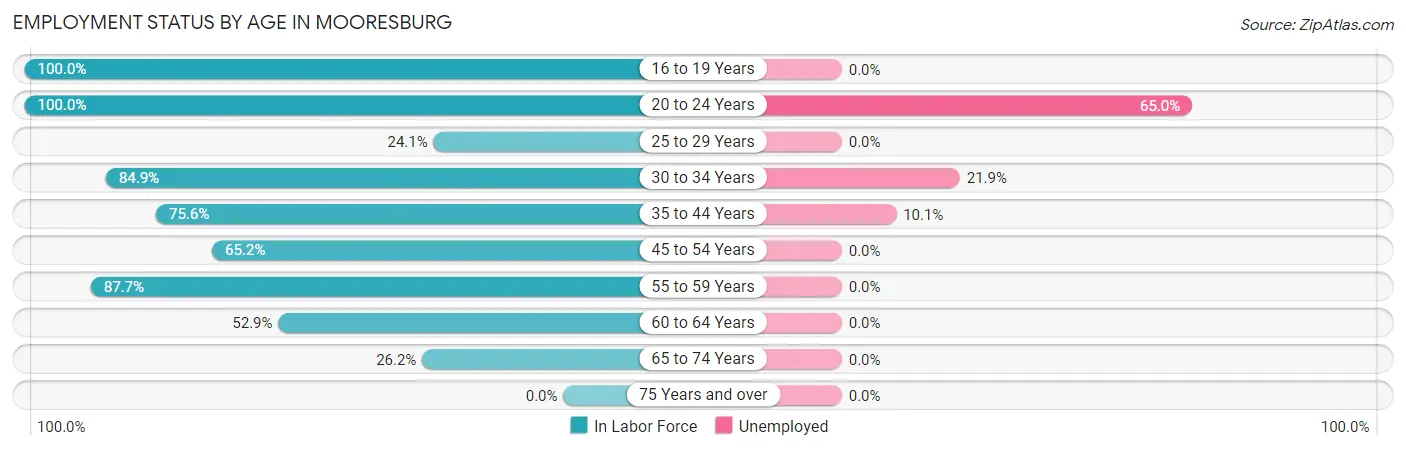
| Age Bracket | In Labor Force | Unemployed |
| 16 to 19 Years | 36 (100.0%) | 0 (0.0%) |
| 20 to 24 Years | 20 (100.0%) | 13 (65.0%) |
| 25 to 29 Years | 7 (24.1%) | 0 (0.0%) |
| 30 to 34 Years | 73 (84.9%) | 16 (21.9%) |
| 35 to 44 Years | 99 (75.6%) | 10 (10.1%) |
| 45 to 54 Years | 45 (65.2%) | 0 (0.0%) |
| 55 to 59 Years | 71 (87.7%) | 0 (0.0%) |
| 60 to 64 Years | 54 (52.9%) | 0 (0.0%) |
| 65 to 74 Years | 22 (26.2%) | 0 (0.0%) |
| 75 Years and over | 0 (0.0%) | 0 (0.0%) |
| Total | 427 (63.5%) | 39 (9.1%) |
Employment Status by Educational Attainment in Mooresburg
According to labor force statistics for Mooresburg, 70.1% of individuals (349) out of the total population between 25 and 64 years of age (498) are in the labor force, with 7.4% or 26 of them being unemployed. The group with the highest labor force participation rate are those with the educational attainment of bachelor's degree or higher, with 100.0% or 45 individuals in the labor force. Within the labor force, individuals with bachelor's degree or higher education have the highest percentage of unemployment, with 35.6% or 16 of them being unemployed.
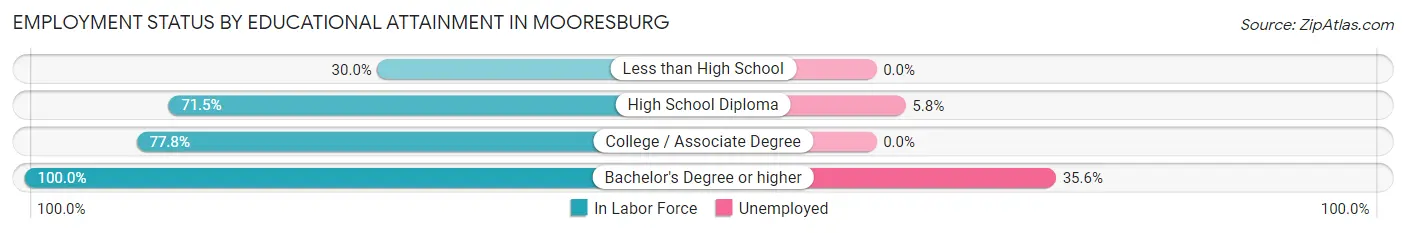
| Educational Attainment | In Labor Force | Unemployed |
| Less than High School | 21 (30.0%) | 0 (0.0%) |
| High School Diploma | 171 (71.5%) | 14 (5.8%) |
| College / Associate Degree | 112 (77.8%) | 0 (0.0%) |
| Bachelor's Degree or higher | 45 (100.0%) | 16 (35.6%) |
| Total | 349 (70.1%) | 37 (7.4%) |
Employment Occupations by Sex in Mooresburg
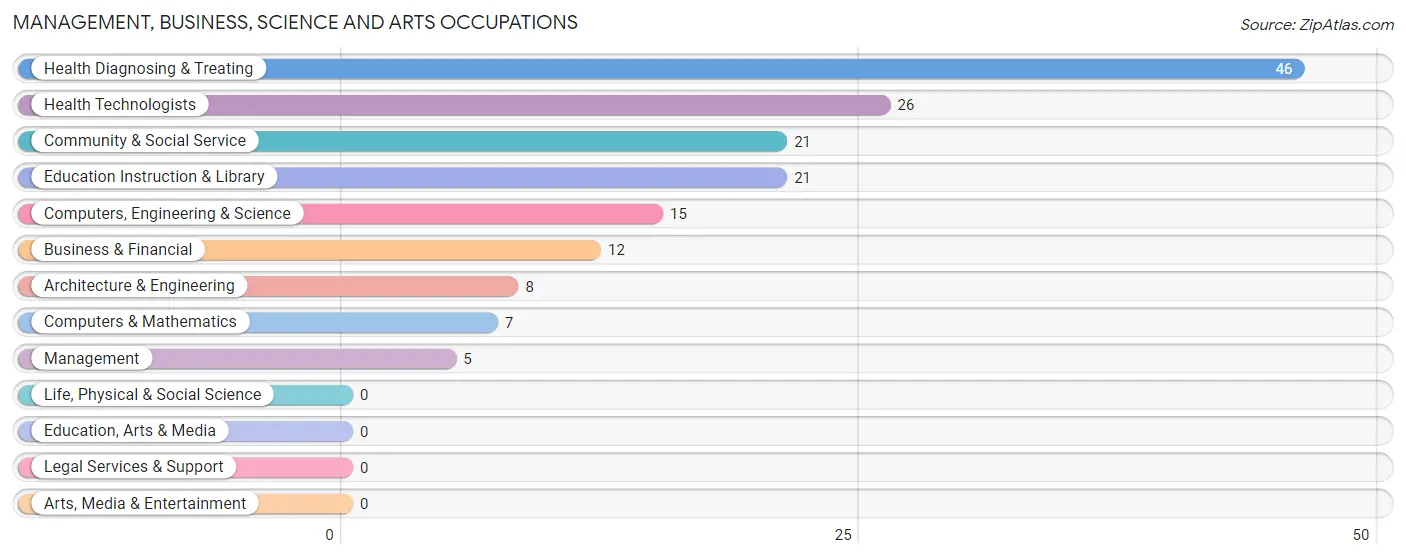
Management, Business, Science and Arts Occupations
The most common Management, Business, Science and Arts occupations in Mooresburg are Health Diagnosing & Treating (46 | 11.9%), Health Technologists (26 | 6.7%), Community & Social Service (21 | 5.4%), Education Instruction & Library (21 | 5.4%), and Computers, Engineering & Science (15 | 3.9%).
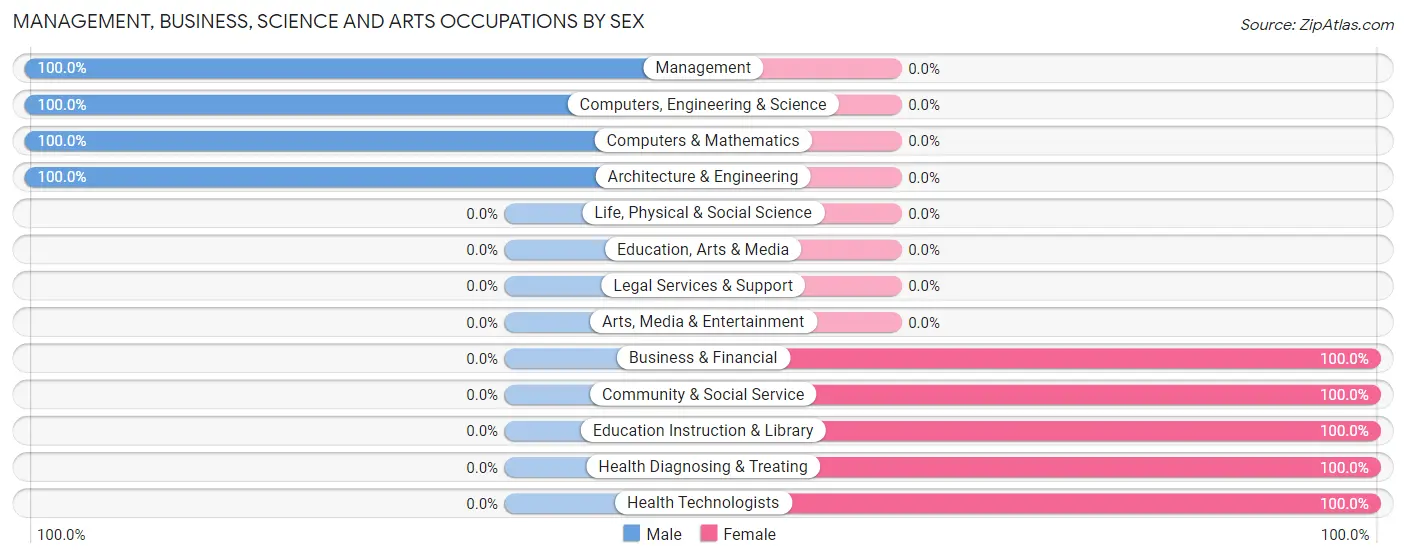
Management, Business, Science and Arts Occupations by Sex
Within the Management, Business, Science and Arts occupations in Mooresburg, the most male-oriented occupations are Management (100.0%), Computers, Engineering & Science (100.0%), and Computers & Mathematics (100.0%), while the most female-oriented occupations are Business & Financial (100.0%), Community & Social Service (100.0%), and Education Instruction & Library (100.0%).
| Occupation | Male | Female |
| Management | 5 (100.0%) | 0 (0.0%) |
| Business & Financial | 0 (0.0%) | 12 (100.0%) |
| Computers, Engineering & Science | 15 (100.0%) | 0 (0.0%) |
| Computers & Mathematics | 7 (100.0%) | 0 (0.0%) |
| Architecture & Engineering | 8 (100.0%) | 0 (0.0%) |
| Life, Physical & Social Science | 0 (0.0%) | 0 (0.0%) |
| Community & Social Service | 0 (0.0%) | 21 (100.0%) |
| Education, Arts & Media | 0 (0.0%) | 0 (0.0%) |
| Legal Services & Support | 0 (0.0%) | 0 (0.0%) |
| Education Instruction & Library | 0 (0.0%) | 21 (100.0%) |
| Arts, Media & Entertainment | 0 (0.0%) | 0 (0.0%) |
| Health Diagnosing & Treating | 0 (0.0%) | 46 (100.0%) |
| Health Technologists | 0 (0.0%) | 26 (100.0%) |
| Total (Category) | 20 (20.2%) | 79 (79.8%) |
| Total (Overall) | 207 (53.3%) | 181 (46.7%) |
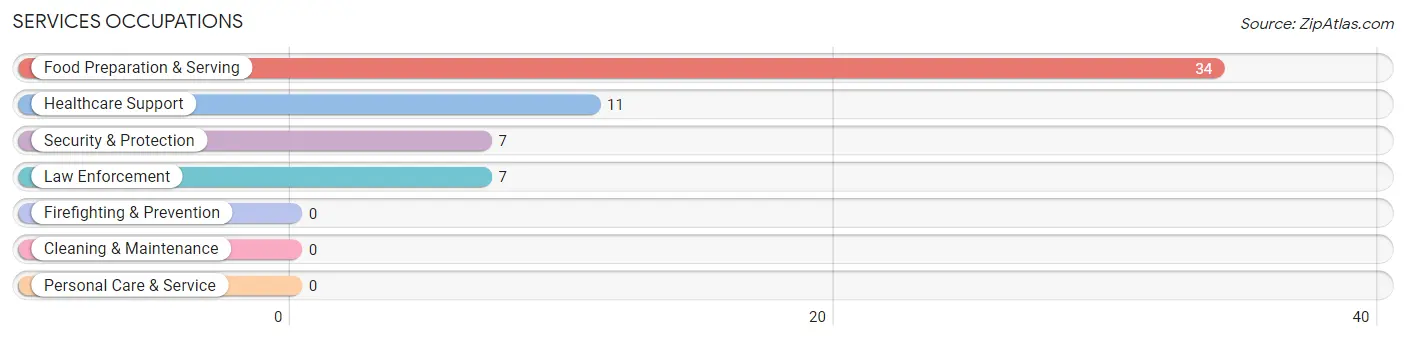
Services Occupations
The most common Services occupations in Mooresburg are Food Preparation & Serving (34 | 8.8%), Healthcare Support (11 | 2.8%), Security & Protection (7 | 1.8%), and Law Enforcement (7 | 1.8%).
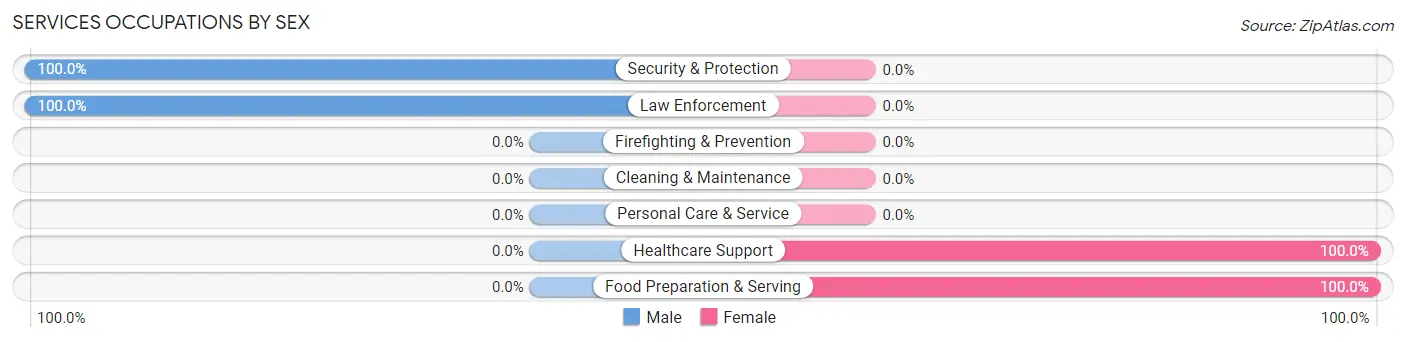
Services Occupations by Sex
Within the Services occupations in Mooresburg, the most male-oriented occupations are Security & Protection (100.0%), and Law Enforcement (100.0%), while the most female-oriented occupations are Healthcare Support (100.0%), and Food Preparation & Serving (100.0%).
| Occupation | Male | Female |
| Healthcare Support | 0 (0.0%) | 11 (100.0%) |
| Security & Protection | 7 (100.0%) | 0 (0.0%) |
| Firefighting & Prevention | 0 (0.0%) | 0 (0.0%) |
| Law Enforcement | 7 (100.0%) | 0 (0.0%) |
| Food Preparation & Serving | 0 (0.0%) | 34 (100.0%) |
| Cleaning & Maintenance | 0 (0.0%) | 0 (0.0%) |
| Personal Care & Service | 0 (0.0%) | 0 (0.0%) |
| Total (Category) | 7 (13.5%) | 45 (86.5%) |
| Total (Overall) | 207 (53.3%) | 181 (46.7%) |
Sales and Office Occupations
The most common Sales and Office occupations in Mooresburg are Sales & Related (22 | 5.7%), and Office & Administration (20 | 5.1%).
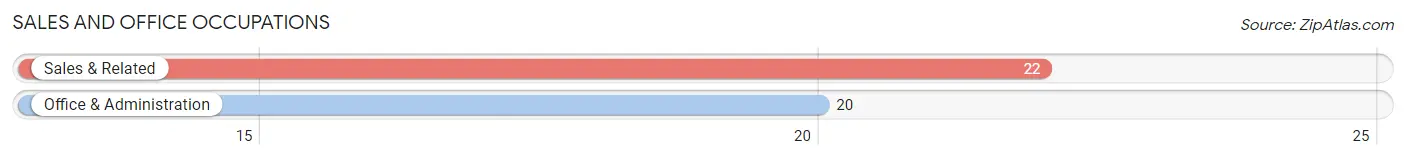
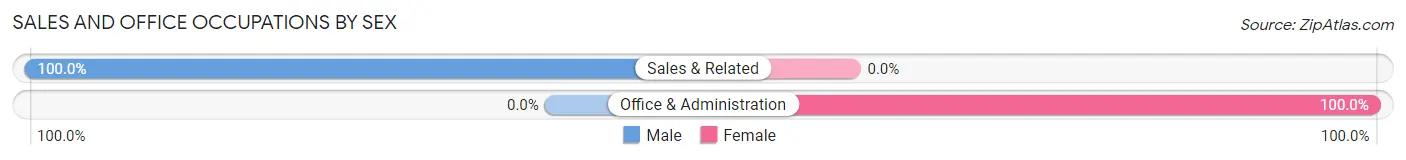
Sales and Office Occupations by Sex
| Occupation | Male | Female |
| Sales & Related | 22 (100.0%) | 0 (0.0%) |
| Office & Administration | 0 (0.0%) | 20 (100.0%) |
| Total (Category) | 22 (52.4%) | 20 (47.6%) |
| Total (Overall) | 207 (53.3%) | 181 (46.7%) |
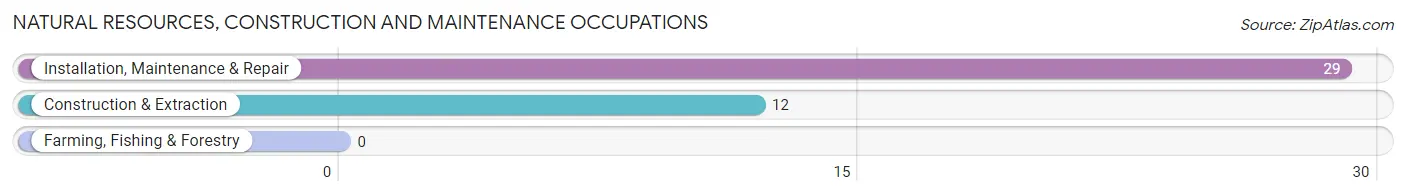
Natural Resources, Construction and Maintenance Occupations
The most common Natural Resources, Construction and Maintenance occupations in Mooresburg are Installation, Maintenance & Repair (29 | 7.5%), and Construction & Extraction (12 | 3.1%).
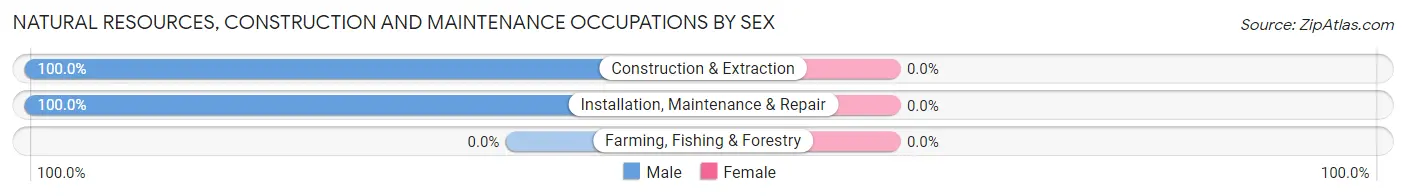
Natural Resources, Construction and Maintenance Occupations by Sex
| Occupation | Male | Female |
| Farming, Fishing & Forestry | 0 (0.0%) | 0 (0.0%) |
| Construction & Extraction | 12 (100.0%) | 0 (0.0%) |
| Installation, Maintenance & Repair | 29 (100.0%) | 0 (0.0%) |
| Total (Category) | 41 (100.0%) | 0 (0.0%) |
| Total (Overall) | 207 (53.3%) | 181 (46.7%) |
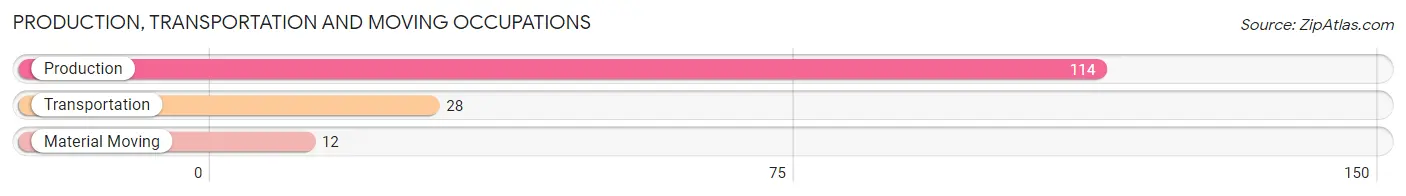
Production, Transportation and Moving Occupations
The most common Production, Transportation and Moving occupations in Mooresburg are Production (114 | 29.4%), Transportation (28 | 7.2%), and Material Moving (12 | 3.1%).
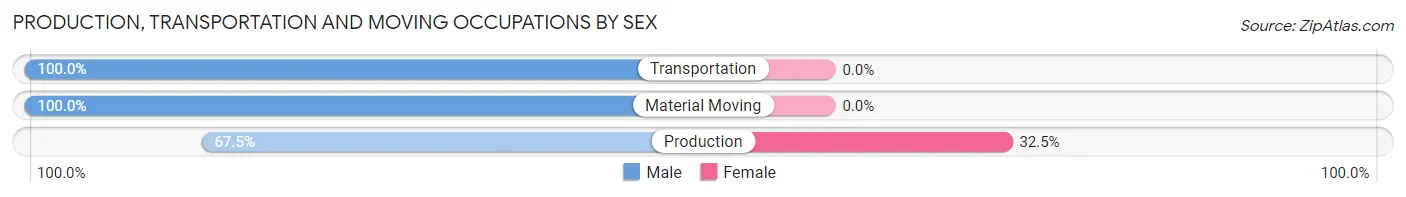
Production, Transportation and Moving Occupations by Sex
| Occupation | Male | Female |
| Production | 77 (67.5%) | 37 (32.5%) |
| Transportation | 28 (100.0%) | 0 (0.0%) |
| Material Moving | 12 (100.0%) | 0 (0.0%) |
| Total (Category) | 117 (76.0%) | 37 (24.0%) |
| Total (Overall) | 207 (53.3%) | 181 (46.7%) |
Employment Industries by Sex in Mooresburg
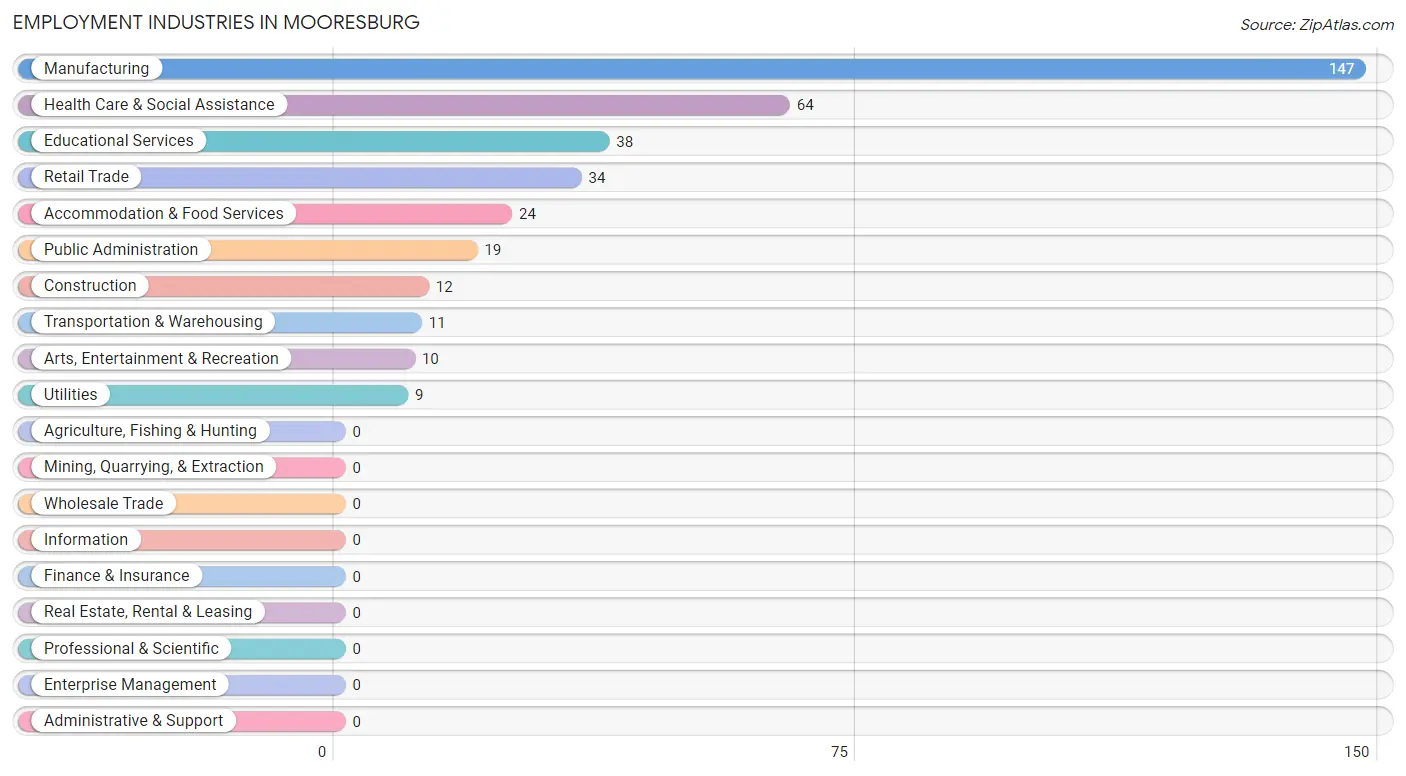
Employment Industries in Mooresburg
The major employment industries in Mooresburg include Manufacturing (147 | 37.9%), Health Care & Social Assistance (64 | 16.5%), Educational Services (38 | 9.8%), Retail Trade (34 | 8.8%), and Accommodation & Food Services (24 | 6.2%).
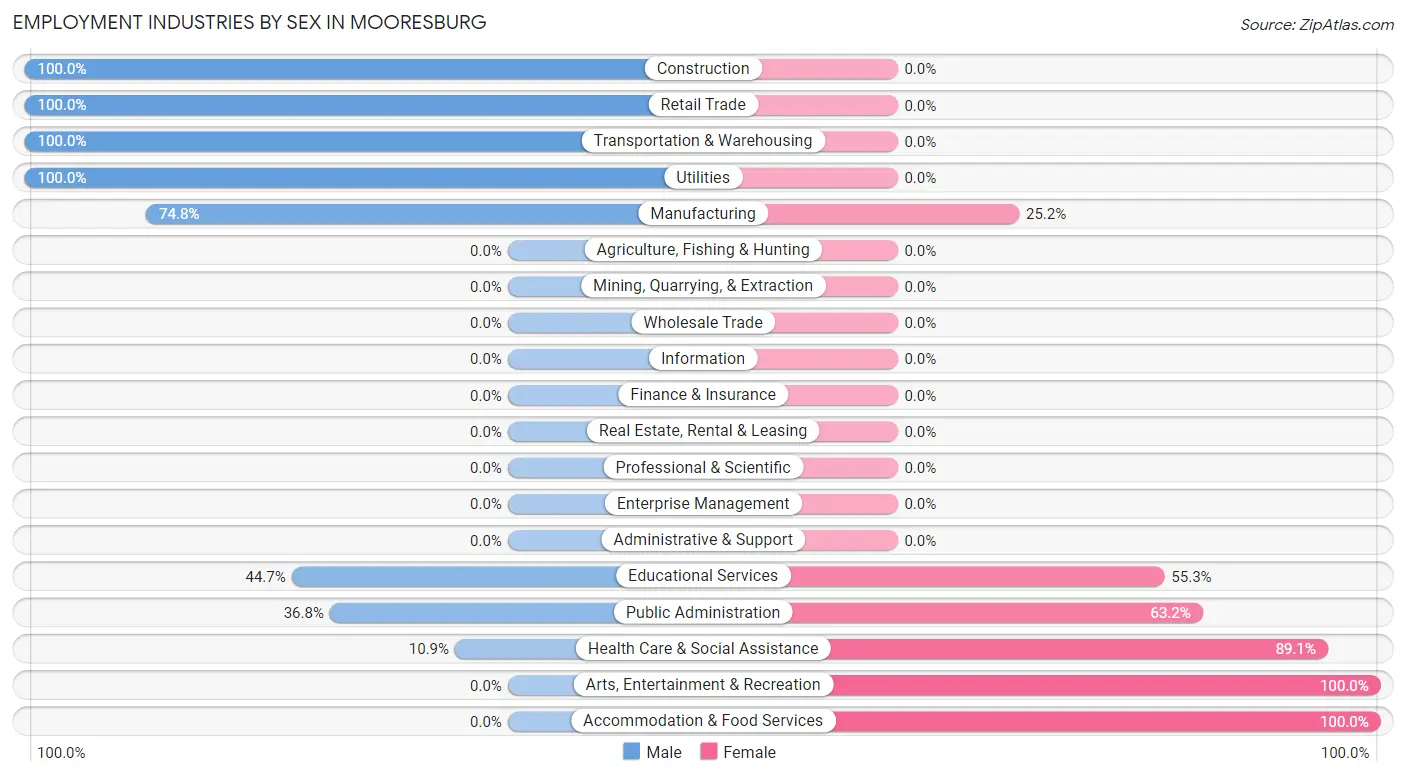
Employment Industries by Sex in Mooresburg
The Mooresburg industries that see more men than women are Construction (100.0%), Retail Trade (100.0%), and Transportation & Warehousing (100.0%), whereas the industries that tend to have a higher number of women are Arts, Entertainment & Recreation (100.0%), Accommodation & Food Services (100.0%), and Health Care & Social Assistance (89.1%).
| Industry | Male | Female |
| Agriculture, Fishing & Hunting | 0 (0.0%) | 0 (0.0%) |
| Mining, Quarrying, & Extraction | 0 (0.0%) | 0 (0.0%) |
| Construction | 12 (100.0%) | 0 (0.0%) |
| Manufacturing | 110 (74.8%) | 37 (25.2%) |
| Wholesale Trade | 0 (0.0%) | 0 (0.0%) |
| Retail Trade | 34 (100.0%) | 0 (0.0%) |
| Transportation & Warehousing | 11 (100.0%) | 0 (0.0%) |
| Utilities | 9 (100.0%) | 0 (0.0%) |
| Information | 0 (0.0%) | 0 (0.0%) |
| Finance & Insurance | 0 (0.0%) | 0 (0.0%) |
| Real Estate, Rental & Leasing | 0 (0.0%) | 0 (0.0%) |
| Professional & Scientific | 0 (0.0%) | 0 (0.0%) |
| Enterprise Management | 0 (0.0%) | 0 (0.0%) |
| Administrative & Support | 0 (0.0%) | 0 (0.0%) |
| Educational Services | 17 (44.7%) | 21 (55.3%) |
| Health Care & Social Assistance | 7 (10.9%) | 57 (89.1%) |
| Arts, Entertainment & Recreation | 0 (0.0%) | 10 (100.0%) |
| Accommodation & Food Services | 0 (0.0%) | 24 (100.0%) |
| Public Administration | 7 (36.8%) | 12 (63.2%) |
| Total | 207 (53.3%) | 181 (46.7%) |
Education in Mooresburg
School Enrollment in Mooresburg
The most common levels of schooling among the 215 students in Mooresburg are middle school (63 | 29.3%), elementary school (56 | 26.1%), and college / undergraduate (37 | 17.2%).
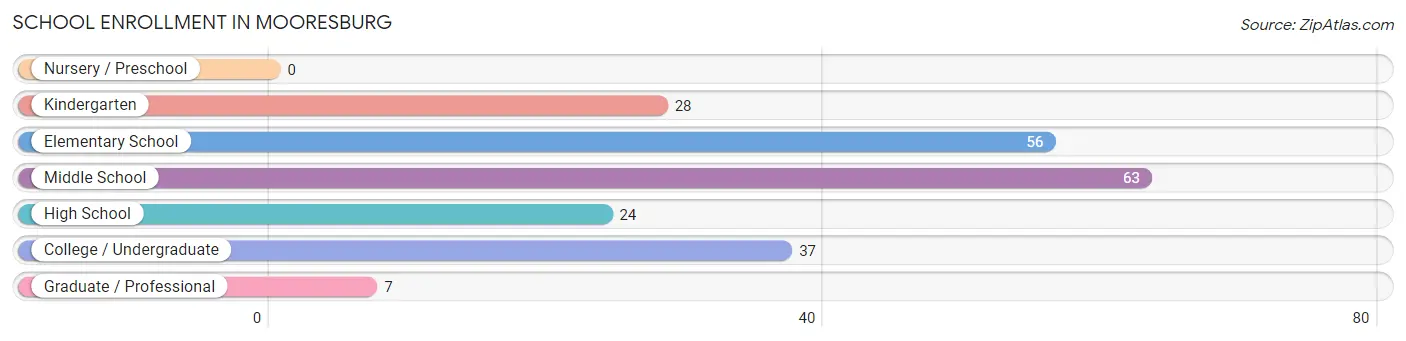
| School Level | # Students | % Students |
| Nursery / Preschool | 0 | 0.0% |
| Kindergarten | 28 | 13.0% |
| Elementary School | 56 | 26.1% |
| Middle School | 63 | 29.3% |
| High School | 24 | 11.2% |
| College / Undergraduate | 37 | 17.2% |
| Graduate / Professional | 7 | 3.3% |
| Total | 215 | 100.0% |
School Enrollment by Age by Funding Source in Mooresburg
Out of a total of 215 students who are enrolled in schools in Mooresburg, 7 (3.3%) attend a private institution, while the remaining 208 (96.7%) are enrolled in public schools. The age group of 25 to 34 year olds has the highest likelihood of being enrolled in private schools, with 7 (53.8% in the age bracket) enrolled. Conversely, the age group of 5 to 9 year old has the lowest likelihood of being enrolled in a private school, with 76 (100.0% in the age bracket) attending a public institution.
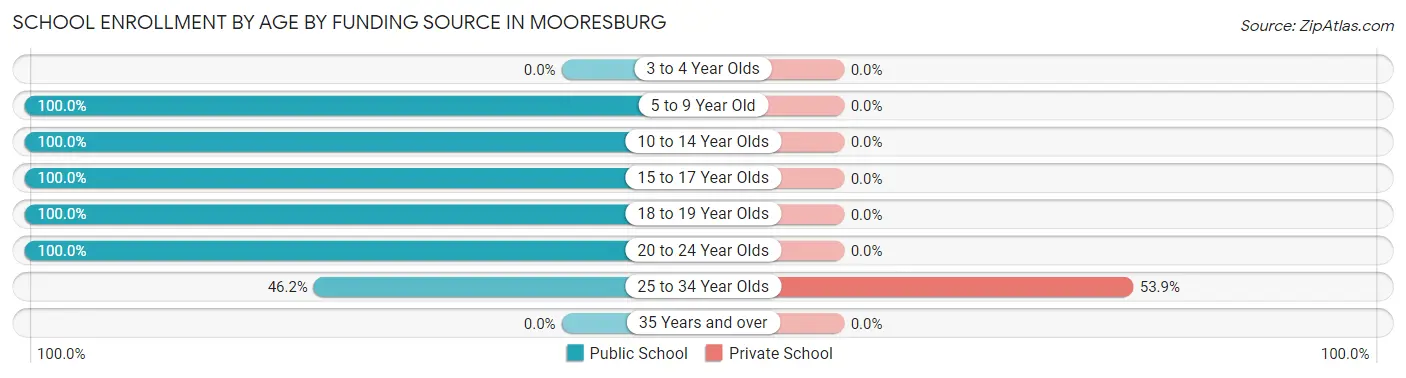
| Age Bracket | Public School | Private School |
| 3 to 4 Year Olds | 0 (0.0%) | 0 (0.0%) |
| 5 to 9 Year Old | 76 (100.0%) | 0 (0.0%) |
| 10 to 14 Year Olds | 71 (100.0%) | 0 (0.0%) |
| 15 to 17 Year Olds | 24 (100.0%) | 0 (0.0%) |
| 18 to 19 Year Olds | 24 (100.0%) | 0 (0.0%) |
| 20 to 24 Year Olds | 7 (100.0%) | 0 (0.0%) |
| 25 to 34 Year Olds | 6 (46.2%) | 7 (53.8%) |
| 35 Years and over | 0 (0.0%) | 0 (0.0%) |
| Total | 208 (96.7%) | 7 (3.3%) |
Educational Attainment by Field of Study in Mooresburg
Communications (16 | 28.1%), social sciences (12 | 21.0%), engineering (12 | 21.0%), science & technology (10 | 17.5%), and bio, nature & agricultural (7 | 12.3%) are the most common fields of study among 57 individuals in Mooresburg who have obtained a bachelor's degree or higher.
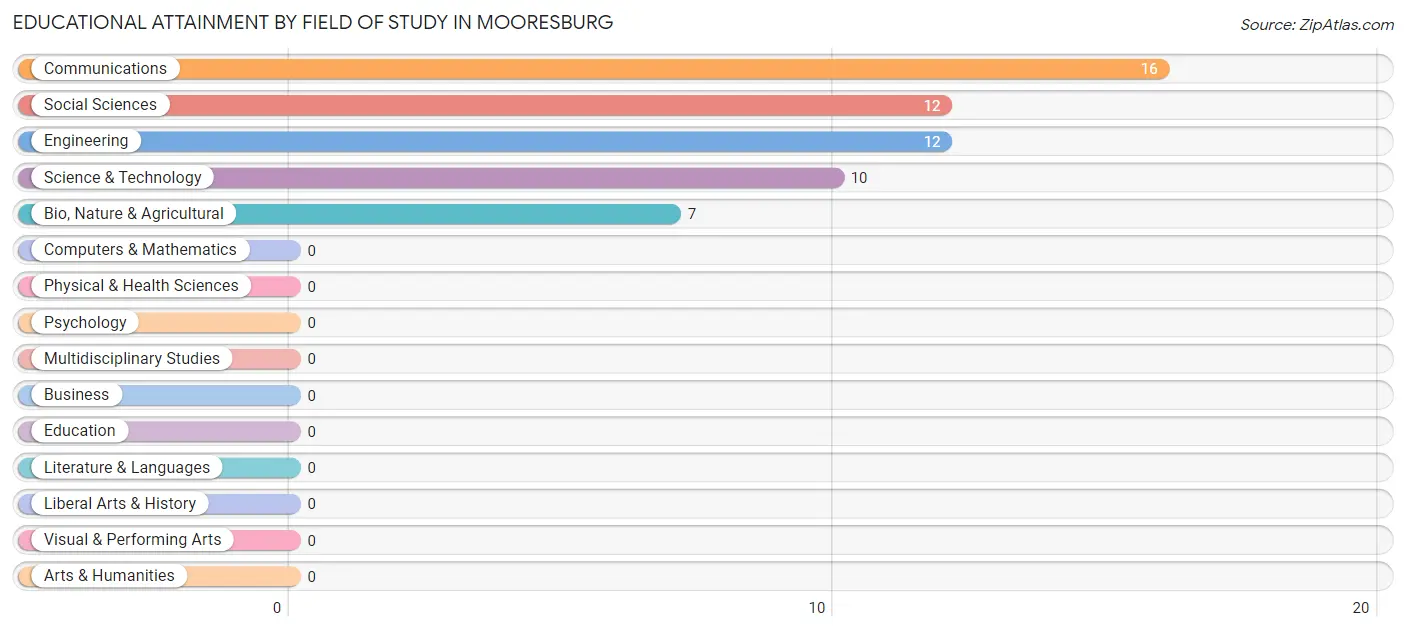
| Field of Study | # Graduates | % Graduates |
| Computers & Mathematics | 0 | 0.0% |
| Bio, Nature & Agricultural | 7 | 12.3% |
| Physical & Health Sciences | 0 | 0.0% |
| Psychology | 0 | 0.0% |
| Social Sciences | 12 | 21.0% |
| Engineering | 12 | 21.0% |
| Multidisciplinary Studies | 0 | 0.0% |
| Science & Technology | 10 | 17.5% |
| Business | 0 | 0.0% |
| Education | 0 | 0.0% |
| Literature & Languages | 0 | 0.0% |
| Liberal Arts & History | 0 | 0.0% |
| Visual & Performing Arts | 0 | 0.0% |
| Communications | 16 | 28.1% |
| Arts & Humanities | 0 | 0.0% |
| Total | 57 | 100.0% |
Transportation & Commute in Mooresburg
Vehicle Availability by Sex in Mooresburg
The most prevalent vehicle ownership categories in Mooresburg are males with 2 vehicles (102, accounting for 49.3%) and females with 2 vehicles (49, making up 56.4%).
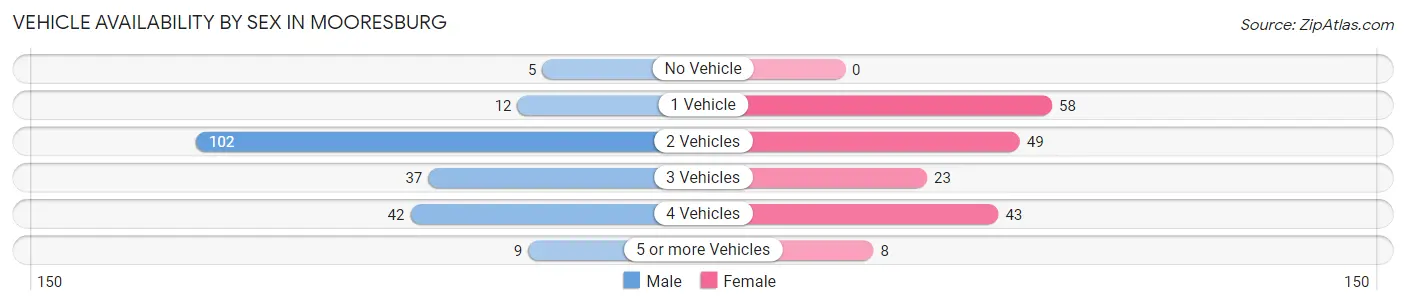
| Vehicles Available | Male | Female |
| No Vehicle | 5 (2.4%) | 0 (0.0%) |
| 1 Vehicle | 12 (5.8%) | 58 (32.0%) |
| 2 Vehicles | 102 (49.3%) | 49 (27.1%) |
| 3 Vehicles | 37 (17.9%) | 23 (12.7%) |
| 4 Vehicles | 42 (20.3%) | 43 (23.8%) |
| 5 or more Vehicles | 9 (4.3%) | 8 (4.4%) |
| Total | 207 (100.0%) | 181 (100.0%) |
Commute Time in Mooresburg
The most frequently occuring commute durations in Mooresburg are 30 to 34 minutes (107 commuters, 28.5%), 25 to 29 minutes (84 commuters, 22.3%), and 20 to 24 minutes (59 commuters, 15.7%).
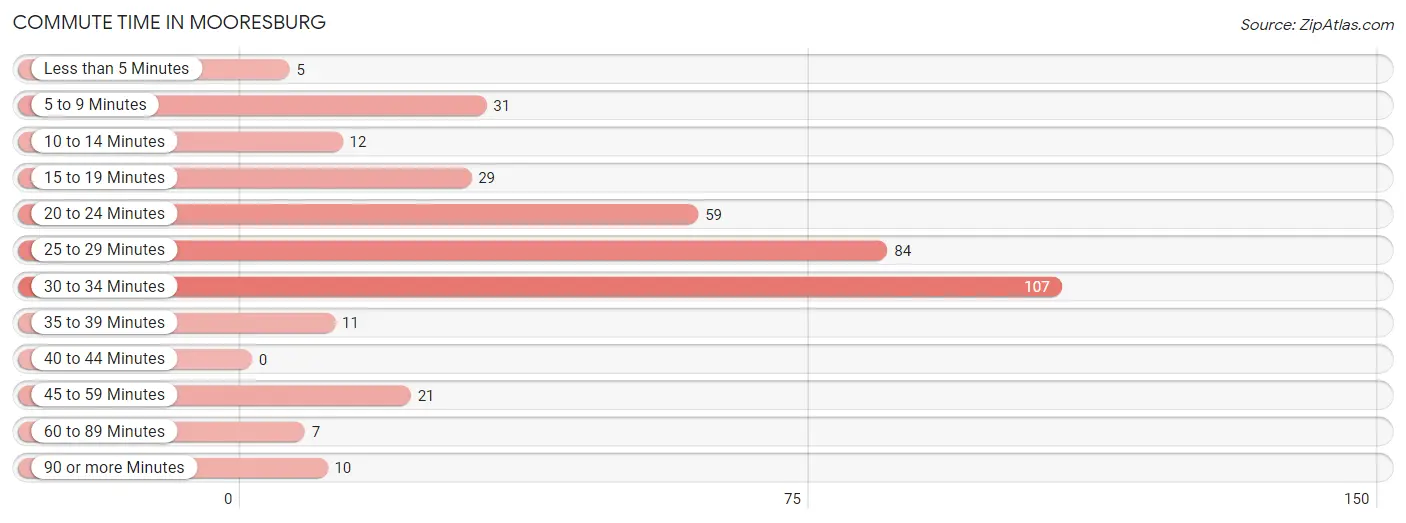
| Commute Time | # Commuters | % Commuters |
| Less than 5 Minutes | 5 | 1.3% |
| 5 to 9 Minutes | 31 | 8.2% |
| 10 to 14 Minutes | 12 | 3.2% |
| 15 to 19 Minutes | 29 | 7.7% |
| 20 to 24 Minutes | 59 | 15.7% |
| 25 to 29 Minutes | 84 | 22.3% |
| 30 to 34 Minutes | 107 | 28.5% |
| 35 to 39 Minutes | 11 | 2.9% |
| 40 to 44 Minutes | 0 | 0.0% |
| 45 to 59 Minutes | 21 | 5.6% |
| 60 to 89 Minutes | 7 | 1.9% |
| 90 or more Minutes | 10 | 2.7% |
Commute Time by Sex in Mooresburg
The most common commute times in Mooresburg are 25 to 29 minutes (53 commuters, 27.2%) for males and 30 to 34 minutes (80 commuters, 44.2%) for females.
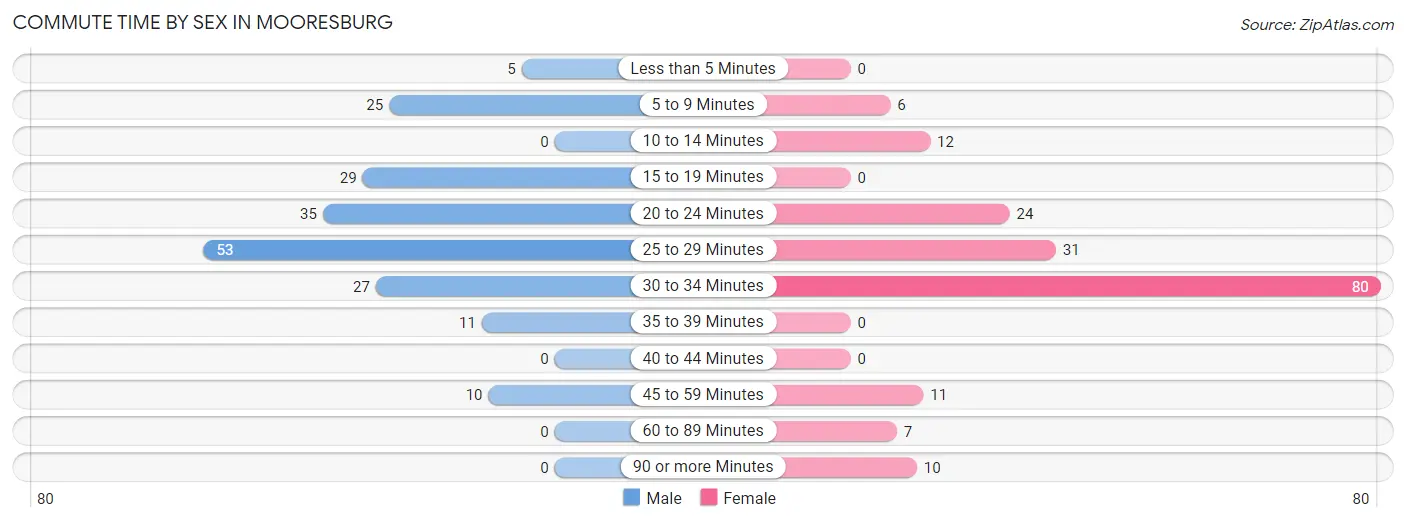
| Commute Time | Male | Female |
| Less than 5 Minutes | 5 (2.6%) | 0 (0.0%) |
| 5 to 9 Minutes | 25 (12.8%) | 6 (3.3%) |
| 10 to 14 Minutes | 0 (0.0%) | 12 (6.6%) |
| 15 to 19 Minutes | 29 (14.9%) | 0 (0.0%) |
| 20 to 24 Minutes | 35 (17.9%) | 24 (13.3%) |
| 25 to 29 Minutes | 53 (27.2%) | 31 (17.1%) |
| 30 to 34 Minutes | 27 (13.9%) | 80 (44.2%) |
| 35 to 39 Minutes | 11 (5.6%) | 0 (0.0%) |
| 40 to 44 Minutes | 0 (0.0%) | 0 (0.0%) |
| 45 to 59 Minutes | 10 (5.1%) | 11 (6.1%) |
| 60 to 89 Minutes | 0 (0.0%) | 7 (3.9%) |
| 90 or more Minutes | 0 (0.0%) | 10 (5.5%) |
Time of Departure to Work by Sex in Mooresburg
The most frequent times of departure to work in Mooresburg are 7:00 AM to 7:29 AM (48, 24.6%) for males and 4:00 PM to 11:59 PM (61, 33.7%) for females.
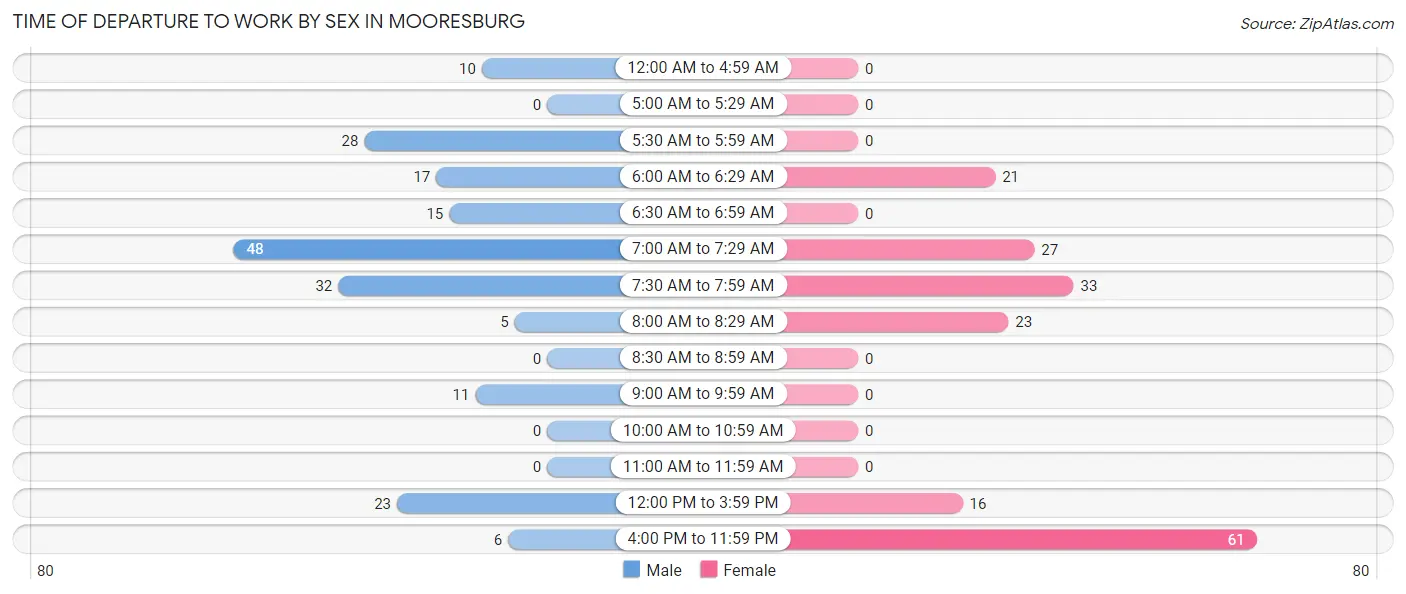
| Time of Departure | Male | Female |
| 12:00 AM to 4:59 AM | 10 (5.1%) | 0 (0.0%) |
| 5:00 AM to 5:29 AM | 0 (0.0%) | 0 (0.0%) |
| 5:30 AM to 5:59 AM | 28 (14.4%) | 0 (0.0%) |
| 6:00 AM to 6:29 AM | 17 (8.7%) | 21 (11.6%) |
| 6:30 AM to 6:59 AM | 15 (7.7%) | 0 (0.0%) |
| 7:00 AM to 7:29 AM | 48 (24.6%) | 27 (14.9%) |
| 7:30 AM to 7:59 AM | 32 (16.4%) | 33 (18.2%) |
| 8:00 AM to 8:29 AM | 5 (2.6%) | 23 (12.7%) |
| 8:30 AM to 8:59 AM | 0 (0.0%) | 0 (0.0%) |
| 9:00 AM to 9:59 AM | 11 (5.6%) | 0 (0.0%) |
| 10:00 AM to 10:59 AM | 0 (0.0%) | 0 (0.0%) |
| 11:00 AM to 11:59 AM | 0 (0.0%) | 0 (0.0%) |
| 12:00 PM to 3:59 PM | 23 (11.8%) | 16 (8.8%) |
| 4:00 PM to 11:59 PM | 6 (3.1%) | 61 (33.7%) |
| Total | 195 (100.0%) | 181 (100.0%) |
Housing Occupancy in Mooresburg
Occupancy by Ownership in Mooresburg
Of the total 398 dwellings in Mooresburg, owner-occupied units account for 322 (80.9%), while renter-occupied units make up 76 (19.1%).
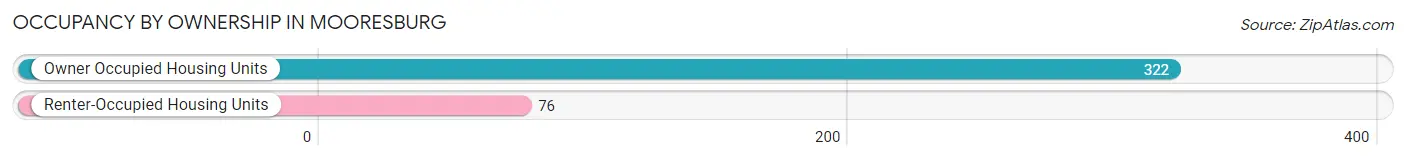
| Occupancy | # Housing Units | % Housing Units |
| Owner Occupied Housing Units | 322 | 80.9% |
| Renter-Occupied Housing Units | 76 | 19.1% |
| Total Occupied Housing Units | 398 | 100.0% |
Occupancy by Household Size in Mooresburg
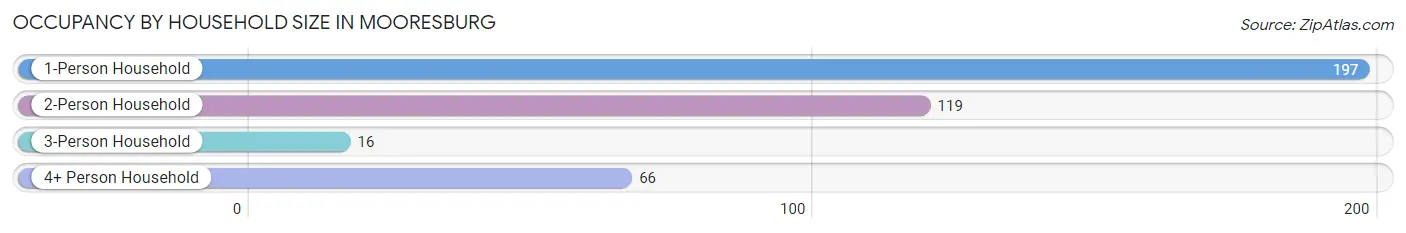
| Household Size | # Housing Units | % Housing Units |
| 1-Person Household | 197 | 49.5% |
| 2-Person Household | 119 | 29.9% |
| 3-Person Household | 16 | 4.0% |
| 4+ Person Household | 66 | 16.6% |
| Total Housing Units | 398 | 100.0% |
Occupancy by Ownership by Household Size in Mooresburg
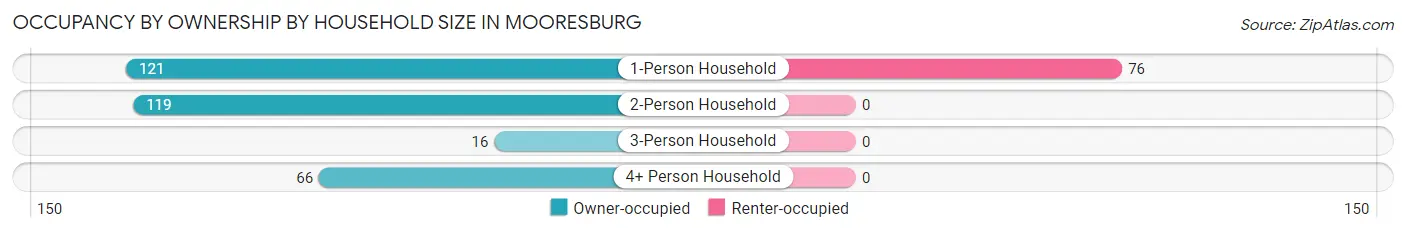
| Household Size | Owner-occupied | Renter-occupied |
| 1-Person Household | 121 (61.4%) | 76 (38.6%) |
| 2-Person Household | 119 (100.0%) | 0 (0.0%) |
| 3-Person Household | 16 (100.0%) | 0 (0.0%) |
| 4+ Person Household | 66 (100.0%) | 0 (0.0%) |
| Total Housing Units | 322 (80.9%) | 76 (19.1%) |
Occupancy by Educational Attainment in Mooresburg
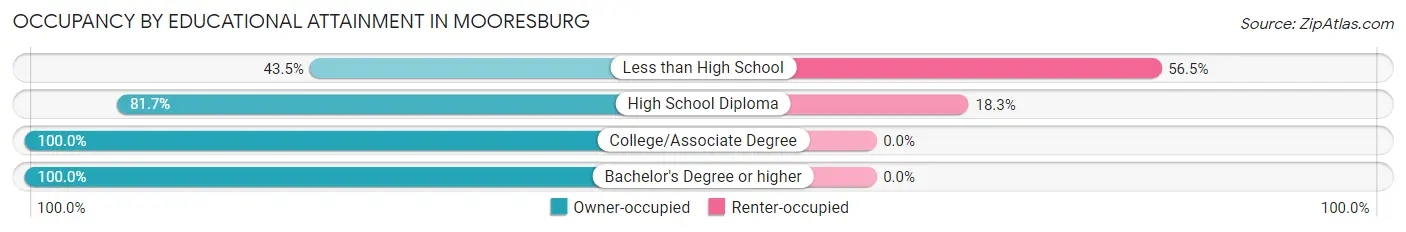
| Household Size | Owner-occupied | Renter-occupied |
| Less than High School | 30 (43.5%) | 39 (56.5%) |
| High School Diploma | 165 (81.7%) | 37 (18.3%) |
| College/Associate Degree | 86 (100.0%) | 0 (0.0%) |
| Bachelor's Degree or higher | 41 (100.0%) | 0 (0.0%) |
Occupancy by Age of Householder in Mooresburg
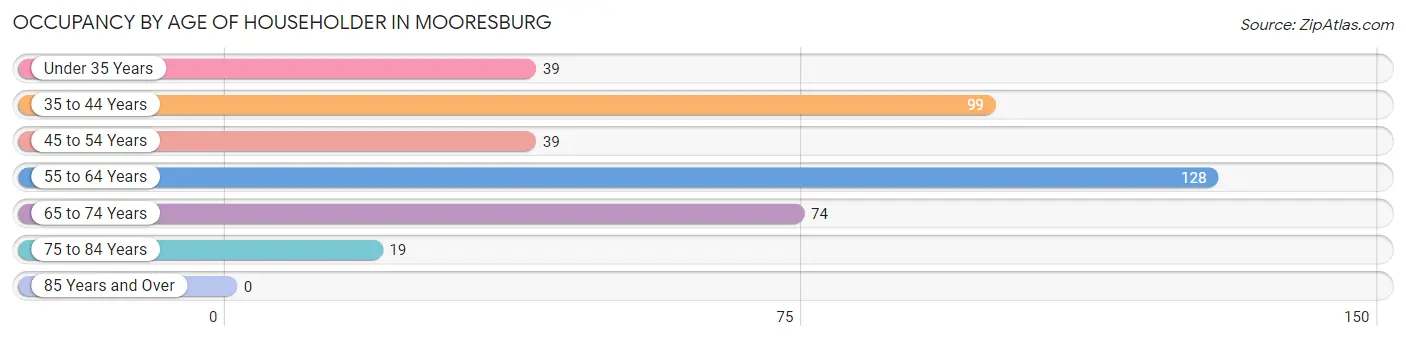
| Age Bracket | # Households | % Households |
| Under 35 Years | 39 | 9.8% |
| 35 to 44 Years | 99 | 24.9% |
| 45 to 54 Years | 39 | 9.8% |
| 55 to 64 Years | 128 | 32.2% |
| 65 to 74 Years | 74 | 18.6% |
| 75 to 84 Years | 19 | 4.8% |
| 85 Years and Over | 0 | 0.0% |
| Total | 398 | 100.0% |
Housing Finances in Mooresburg
Median Income by Occupancy in Mooresburg
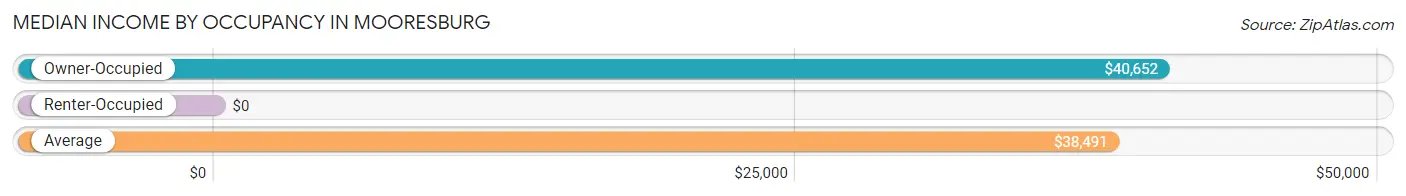
| Occupancy Type | # Households | Median Income |
| Owner-Occupied | 322 (80.9%) | $40,652 |
| Renter-Occupied | 76 (19.1%) | $0 |
| Average | 398 (100.0%) | $38,491 |
Occupancy by Householder Income Bracket in Mooresburg
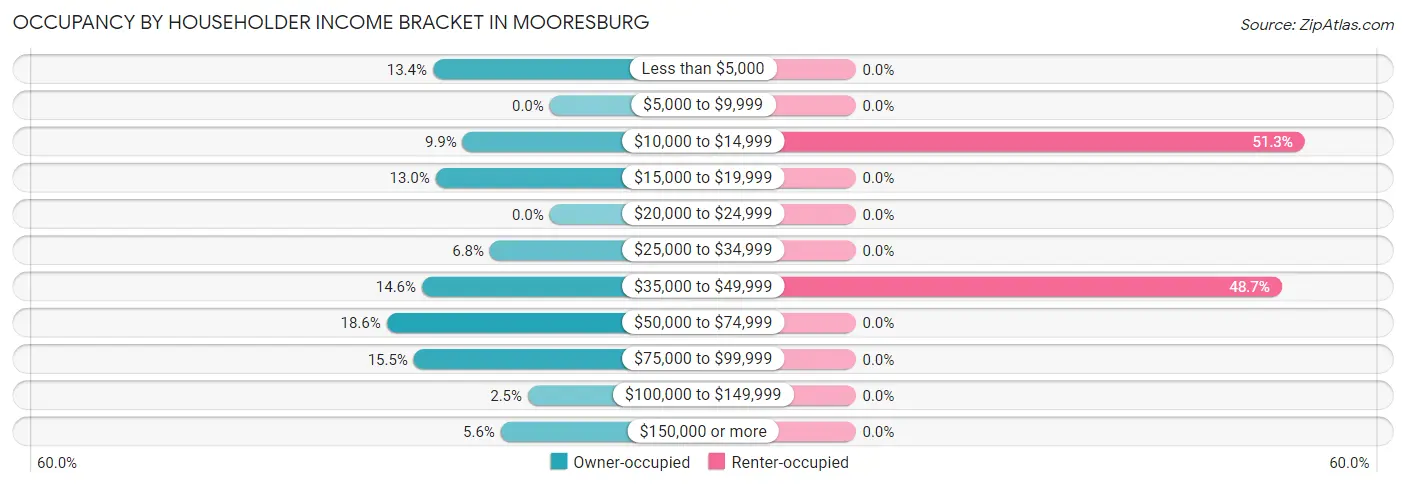
| Income Bracket | Owner-occupied | Renter-occupied |
| Less than $5,000 | 43 (13.4%) | 0 (0.0%) |
| $5,000 to $9,999 | 0 (0.0%) | 0 (0.0%) |
| $10,000 to $14,999 | 32 (9.9%) | 39 (51.3%) |
| $15,000 to $19,999 | 42 (13.0%) | 0 (0.0%) |
| $20,000 to $24,999 | 0 (0.0%) | 0 (0.0%) |
| $25,000 to $34,999 | 22 (6.8%) | 0 (0.0%) |
| $35,000 to $49,999 | 47 (14.6%) | 37 (48.7%) |
| $50,000 to $74,999 | 60 (18.6%) | 0 (0.0%) |
| $75,000 to $99,999 | 50 (15.5%) | 0 (0.0%) |
| $100,000 to $149,999 | 8 (2.5%) | 0 (0.0%) |
| $150,000 or more | 18 (5.6%) | 0 (0.0%) |
| Total | 322 (100.0%) | 76 (100.0%) |
Monthly Housing Cost Tiers in Mooresburg
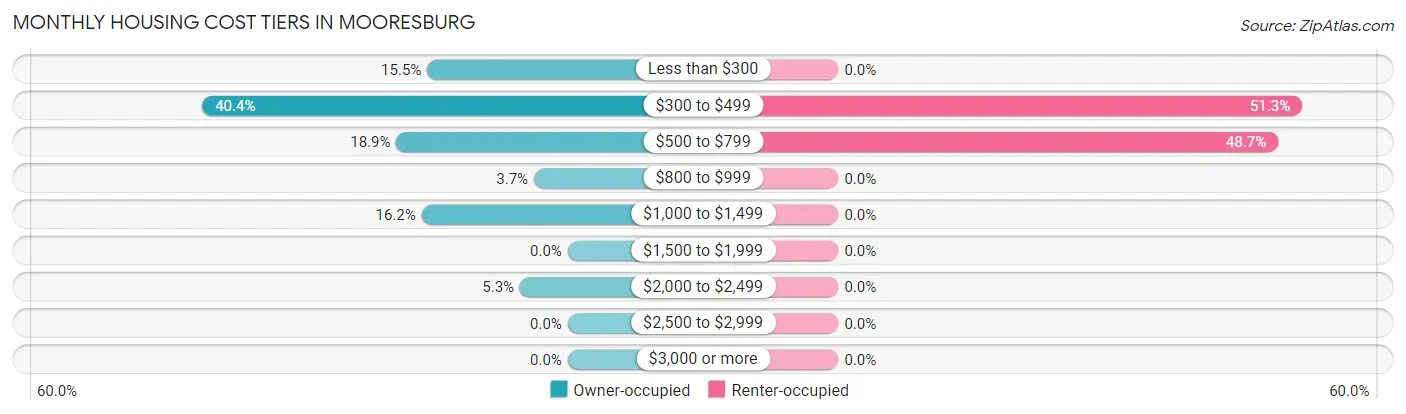
| Monthly Cost | Owner-occupied | Renter-occupied |
| Less than $300 | 50 (15.5%) | 0 (0.0%) |
| $300 to $499 | 130 (40.4%) | 39 (51.3%) |
| $500 to $799 | 61 (18.9%) | 37 (48.7%) |
| $800 to $999 | 12 (3.7%) | 0 (0.0%) |
| $1,000 to $1,499 | 52 (16.2%) | 0 (0.0%) |
| $1,500 to $1,999 | 0 (0.0%) | 0 (0.0%) |
| $2,000 to $2,499 | 17 (5.3%) | 0 (0.0%) |
| $2,500 to $2,999 | 0 (0.0%) | 0 (0.0%) |
| $3,000 or more | 0 (0.0%) | 0 (0.0%) |
| Total | 322 (100.0%) | 76 (100.0%) |
Physical Housing Characteristics in Mooresburg
Housing Structures in Mooresburg
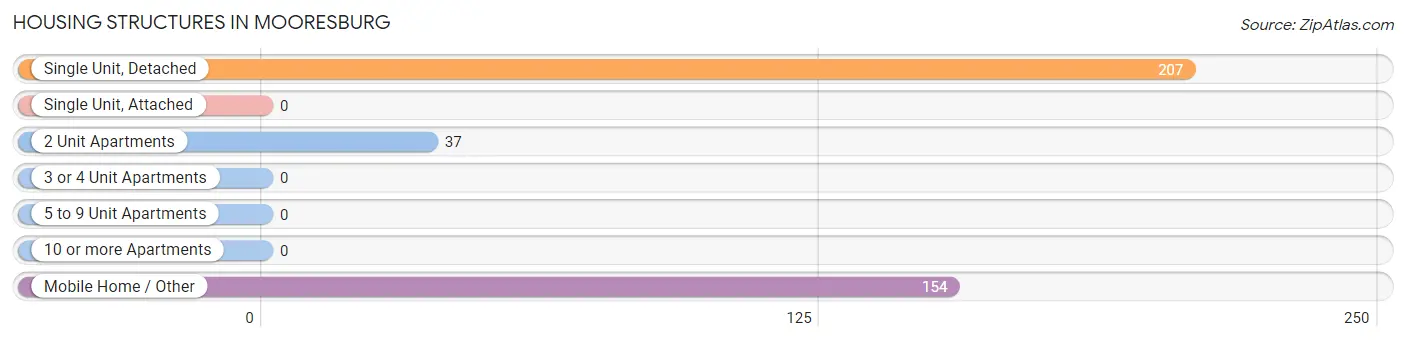
| Structure Type | # Housing Units | % Housing Units |
| Single Unit, Detached | 207 | 52.0% |
| Single Unit, Attached | 0 | 0.0% |
| 2 Unit Apartments | 37 | 9.3% |
| 3 or 4 Unit Apartments | 0 | 0.0% |
| 5 to 9 Unit Apartments | 0 | 0.0% |
| 10 or more Apartments | 0 | 0.0% |
| Mobile Home / Other | 154 | 38.7% |
| Total | 398 | 100.0% |
Housing Structures by Occupancy in Mooresburg
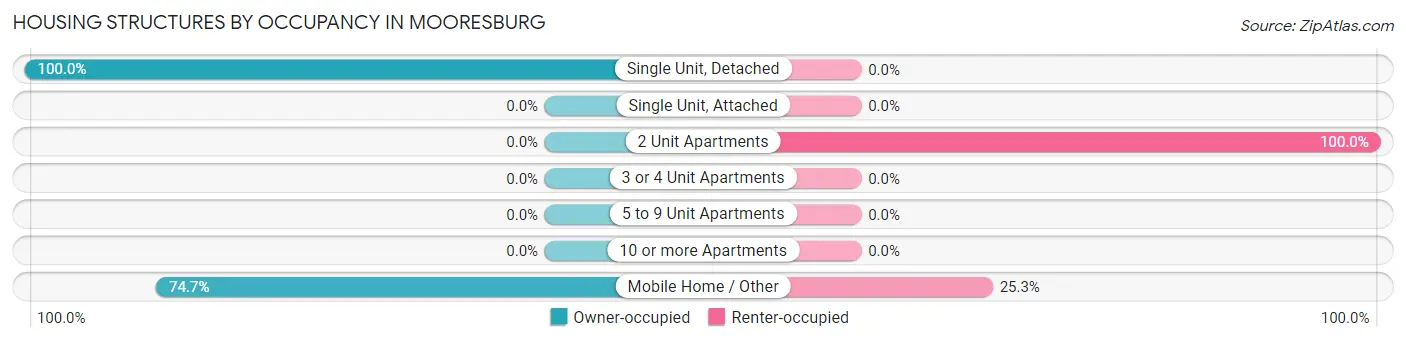
| Structure Type | Owner-occupied | Renter-occupied |
| Single Unit, Detached | 207 (100.0%) | 0 (0.0%) |
| Single Unit, Attached | 0 (0.0%) | 0 (0.0%) |
| 2 Unit Apartments | 0 (0.0%) | 37 (100.0%) |
| 3 or 4 Unit Apartments | 0 (0.0%) | 0 (0.0%) |
| 5 to 9 Unit Apartments | 0 (0.0%) | 0 (0.0%) |
| 10 or more Apartments | 0 (0.0%) | 0 (0.0%) |
| Mobile Home / Other | 115 (74.7%) | 39 (25.3%) |
| Total | 322 (80.9%) | 76 (19.1%) |
Housing Structures by Number of Rooms in Mooresburg
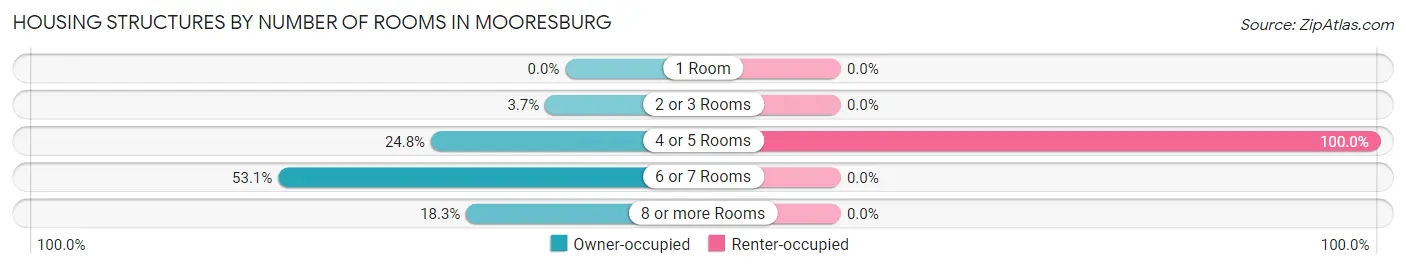
| Number of Rooms | Owner-occupied | Renter-occupied |
| 1 Room | 0 (0.0%) | 0 (0.0%) |
| 2 or 3 Rooms | 12 (3.7%) | 0 (0.0%) |
| 4 or 5 Rooms | 80 (24.8%) | 76 (100.0%) |
| 6 or 7 Rooms | 171 (53.1%) | 0 (0.0%) |
| 8 or more Rooms | 59 (18.3%) | 0 (0.0%) |
| Total | 322 (100.0%) | 76 (100.0%) |
Housing Structure by Heating Type in Mooresburg
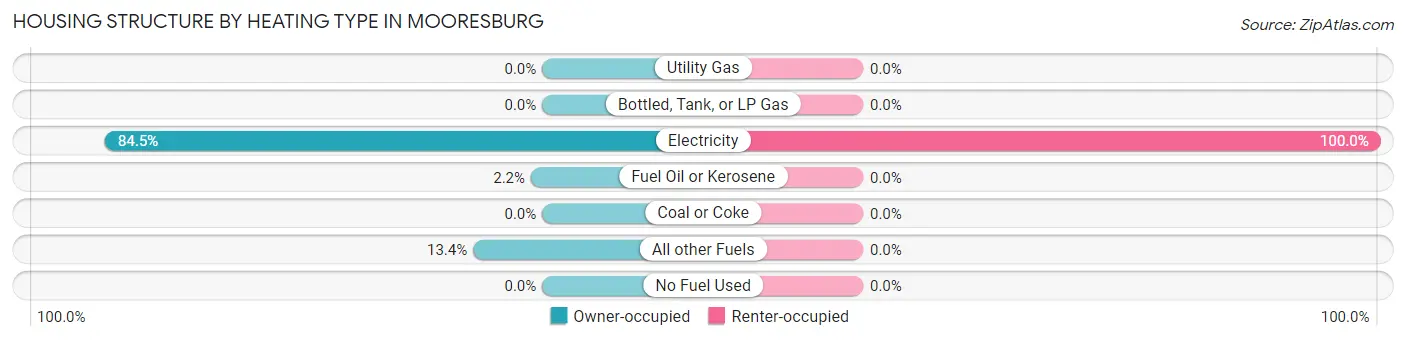
| Heating Type | Owner-occupied | Renter-occupied |
| Utility Gas | 0 (0.0%) | 0 (0.0%) |
| Bottled, Tank, or LP Gas | 0 (0.0%) | 0 (0.0%) |
| Electricity | 272 (84.5%) | 76 (100.0%) |
| Fuel Oil or Kerosene | 7 (2.2%) | 0 (0.0%) |
| Coal or Coke | 0 (0.0%) | 0 (0.0%) |
| All other Fuels | 43 (13.4%) | 0 (0.0%) |
| No Fuel Used | 0 (0.0%) | 0 (0.0%) |
| Total | 322 (100.0%) | 76 (100.0%) |
Household Vehicle Usage in Mooresburg
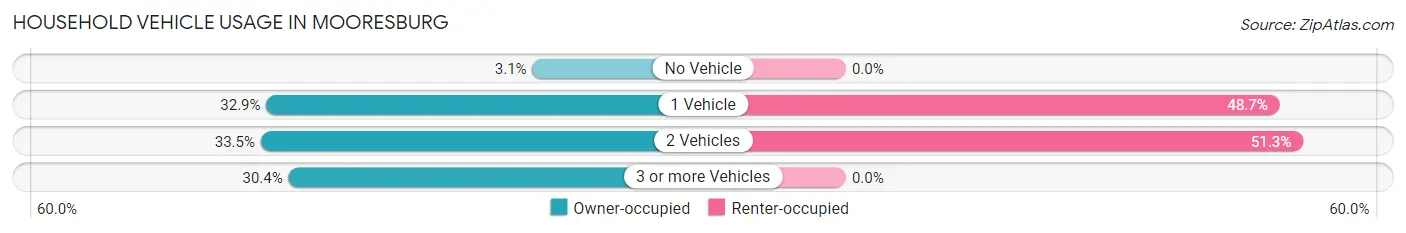
| Vehicles per Household | Owner-occupied | Renter-occupied |
| No Vehicle | 10 (3.1%) | 0 (0.0%) |
| 1 Vehicle | 106 (32.9%) | 37 (48.7%) |
| 2 Vehicles | 108 (33.5%) | 39 (51.3%) |
| 3 or more Vehicles | 98 (30.4%) | 0 (0.0%) |
| Total | 322 (100.0%) | 76 (100.0%) |
Real Estate & Mortgages in Mooresburg
Real Estate and Mortgage Overview in Mooresburg
| Characteristic | Without Mortgage | With Mortgage |
| Housing Units | 204 | 118 |
| Median Property Value | $140,200 | $121,400 |
| Median Household Income | $57,250 | $0 |
| Monthly Housing Costs | $373 | $0 |
| Real Estate Taxes | $547 | $7 |
Property Value by Mortgage Status in Mooresburg
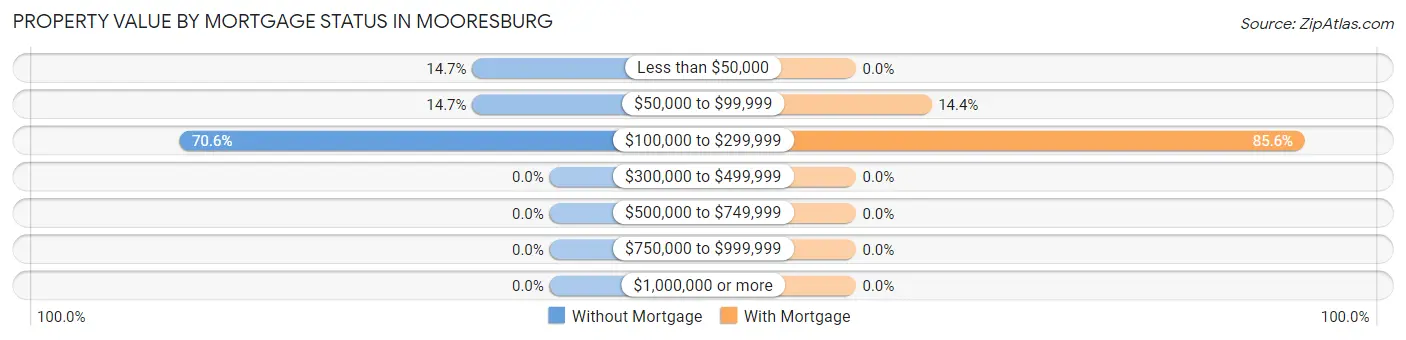
| Property Value | Without Mortgage | With Mortgage |
| Less than $50,000 | 30 (14.7%) | 0 (0.0%) |
| $50,000 to $99,999 | 30 (14.7%) | 17 (14.4%) |
| $100,000 to $299,999 | 144 (70.6%) | 101 (85.6%) |
| $300,000 to $499,999 | 0 (0.0%) | 0 (0.0%) |
| $500,000 to $749,999 | 0 (0.0%) | 0 (0.0%) |
| $750,000 to $999,999 | 0 (0.0%) | 0 (0.0%) |
| $1,000,000 or more | 0 (0.0%) | 0 (0.0%) |
| Total | 204 (100.0%) | 118 (100.0%) |
Household Income by Mortgage Status in Mooresburg
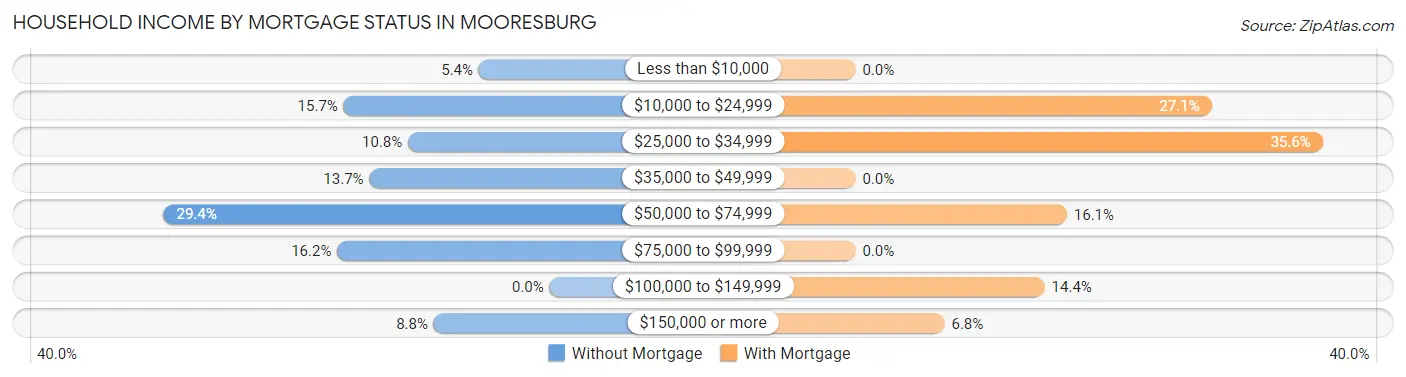
| Household Income | Without Mortgage | With Mortgage |
| Less than $10,000 | 11 (5.4%) | 0 (0.0%) |
| $10,000 to $24,999 | 32 (15.7%) | 32 (27.1%) |
| $25,000 to $34,999 | 22 (10.8%) | 42 (35.6%) |
| $35,000 to $49,999 | 28 (13.7%) | 0 (0.0%) |
| $50,000 to $74,999 | 60 (29.4%) | 19 (16.1%) |
| $75,000 to $99,999 | 33 (16.2%) | 0 (0.0%) |
| $100,000 to $149,999 | 0 (0.0%) | 17 (14.4%) |
| $150,000 or more | 18 (8.8%) | 8 (6.8%) |
| Total | 204 (100.0%) | 118 (100.0%) |
Property Value to Household Income Ratio in Mooresburg
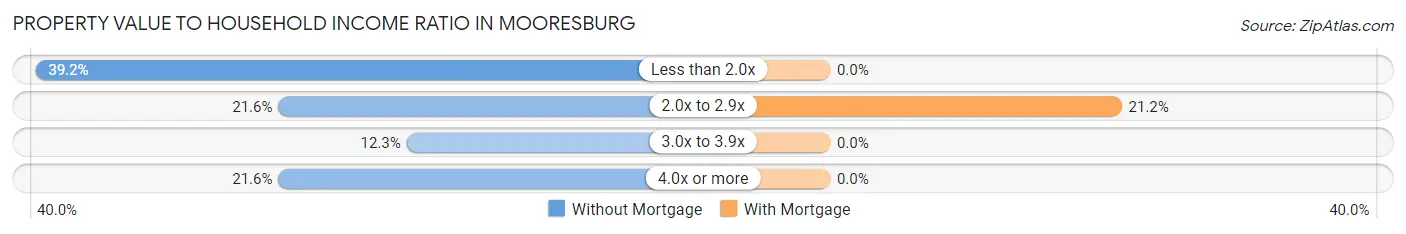
| Value-to-Income Ratio | Without Mortgage | With Mortgage |
| Less than 2.0x | 80 (39.2%) | 0 (0.0%) |
| 2.0x to 2.9x | 44 (21.6%) | 25 (21.2%) |
| 3.0x to 3.9x | 25 (12.2%) | 0 (0.0%) |
| 4.0x or more | 44 (21.6%) | 0 (0.0%) |
| Total | 204 (100.0%) | 118 (100.0%) |
Real Estate Taxes by Mortgage Status in Mooresburg
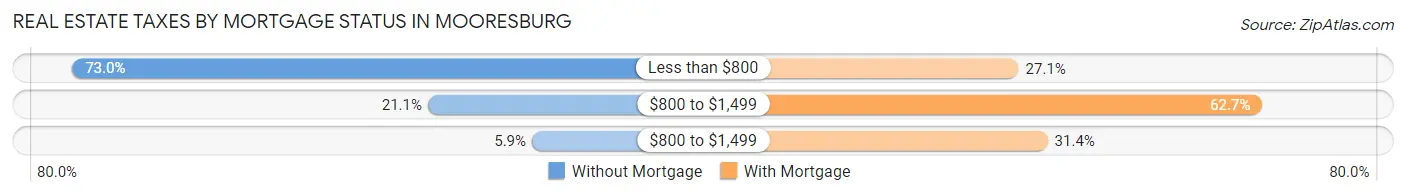
| Property Taxes | Without Mortgage | With Mortgage |
| Less than $800 | 149 (73.0%) | 32 (27.1%) |
| $800 to $1,499 | 43 (21.1%) | 74 (62.7%) |
| $800 to $1,499 | 12 (5.9%) | 37 (31.4%) |
| Total | 204 (100.0%) | 118 (100.0%) |
Health & Disability in Mooresburg
Health Insurance Coverage by Age in Mooresburg
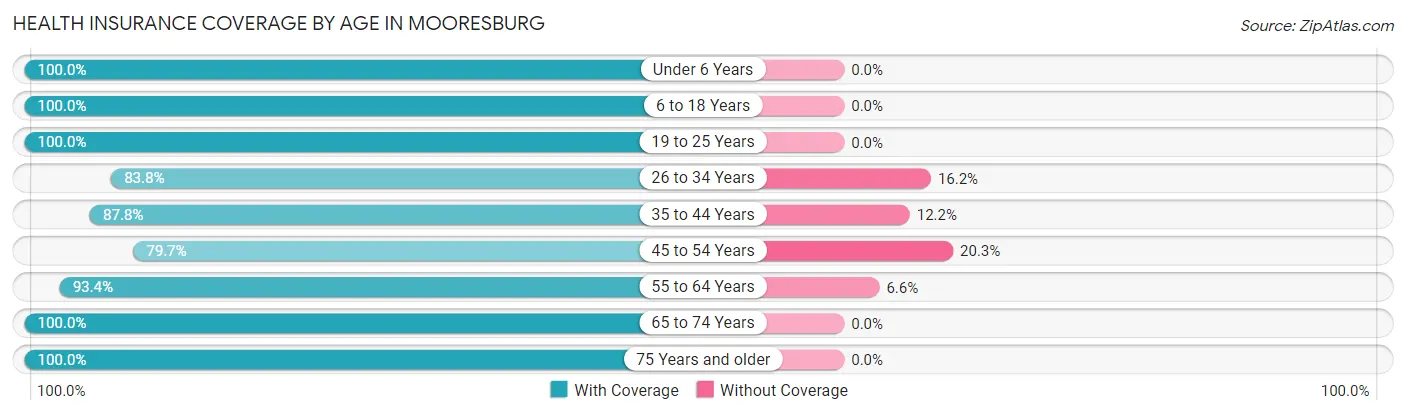
| Age Bracket | With Coverage | Without Coverage |
| Under 6 Years | 81 (100.0%) | 0 (0.0%) |
| 6 to 18 Years | 186 (100.0%) | 0 (0.0%) |
| 19 to 25 Years | 36 (100.0%) | 0 (0.0%) |
| 26 to 34 Years | 83 (83.8%) | 16 (16.2%) |
| 35 to 44 Years | 115 (87.8%) | 16 (12.2%) |
| 45 to 54 Years | 55 (79.7%) | 14 (20.3%) |
| 55 to 64 Years | 171 (93.4%) | 12 (6.6%) |
| 65 to 74 Years | 84 (100.0%) | 0 (0.0%) |
| 75 Years and older | 34 (100.0%) | 0 (0.0%) |
| Total | 845 (93.6%) | 58 (6.4%) |
Health Insurance Coverage by Citizenship Status in Mooresburg
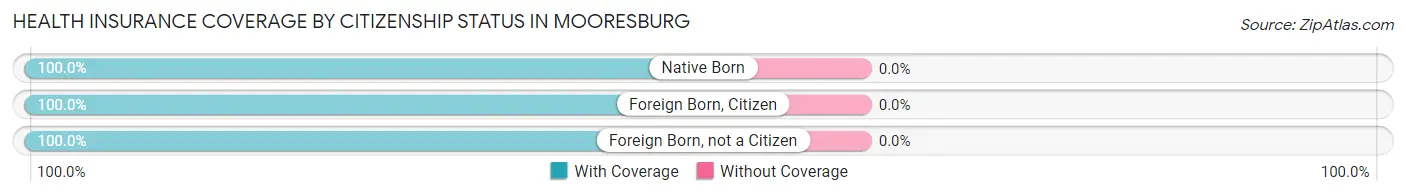
| Citizenship Status | With Coverage | Without Coverage |
| Native Born | 81 (100.0%) | 0 (0.0%) |
| Foreign Born, Citizen | 186 (100.0%) | 0 (0.0%) |
| Foreign Born, not a Citizen | 36 (100.0%) | 0 (0.0%) |
Health Insurance Coverage by Household Income in Mooresburg
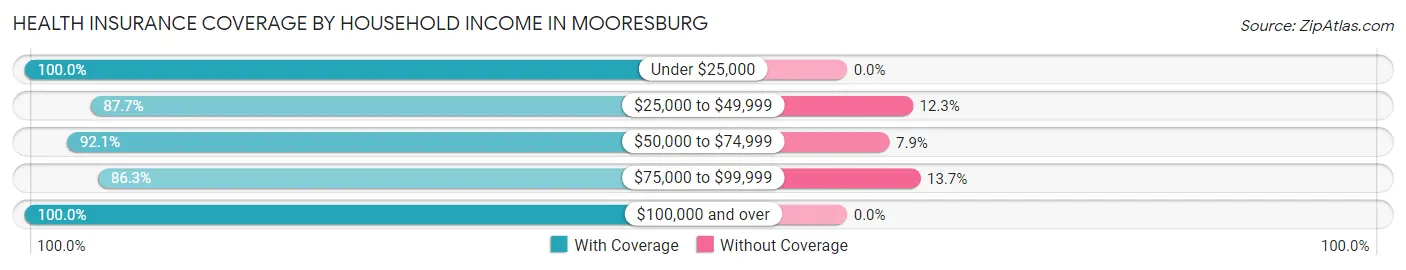
| Household Income | With Coverage | Without Coverage |
| Under $25,000 | 302 (100.0%) | 0 (0.0%) |
| $25,000 to $49,999 | 199 (87.7%) | 28 (12.3%) |
| $50,000 to $74,999 | 186 (92.1%) | 16 (7.9%) |
| $75,000 to $99,999 | 88 (86.3%) | 14 (13.7%) |
| $100,000 and over | 70 (100.0%) | 0 (0.0%) |
Public vs Private Health Insurance Coverage by Age in Mooresburg
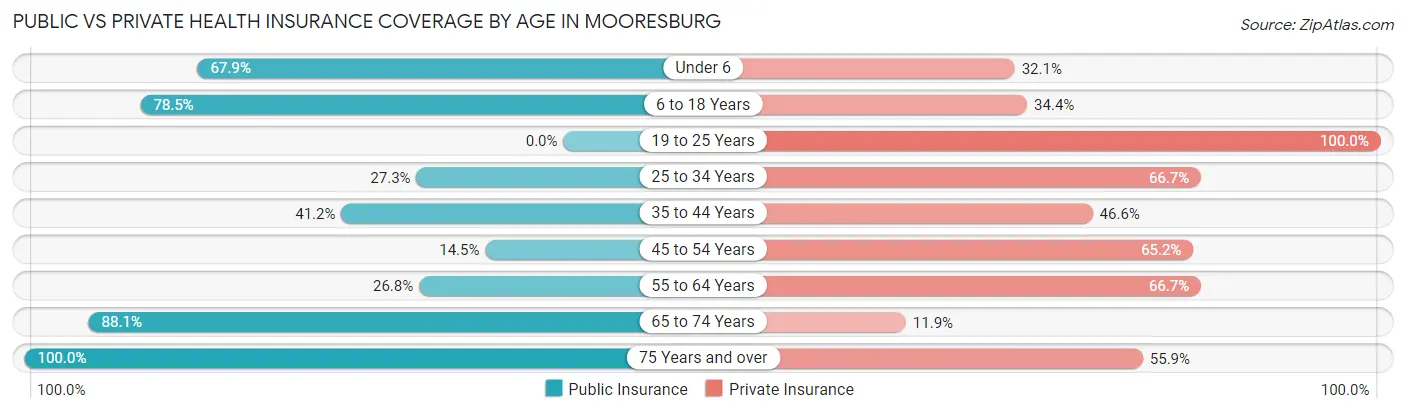
| Age Bracket | Public Insurance | Private Insurance |
| Under 6 | 55 (67.9%) | 26 (32.1%) |
| 6 to 18 Years | 146 (78.5%) | 64 (34.4%) |
| 19 to 25 Years | 0 (0.0%) | 36 (100.0%) |
| 25 to 34 Years | 27 (27.3%) | 66 (66.7%) |
| 35 to 44 Years | 54 (41.2%) | 61 (46.6%) |
| 45 to 54 Years | 10 (14.5%) | 45 (65.2%) |
| 55 to 64 Years | 49 (26.8%) | 122 (66.7%) |
| 65 to 74 Years | 74 (88.1%) | 10 (11.9%) |
| 75 Years and over | 34 (100.0%) | 19 (55.9%) |
| Total | 449 (49.7%) | 449 (49.7%) |
Disability Status by Sex by Age in Mooresburg
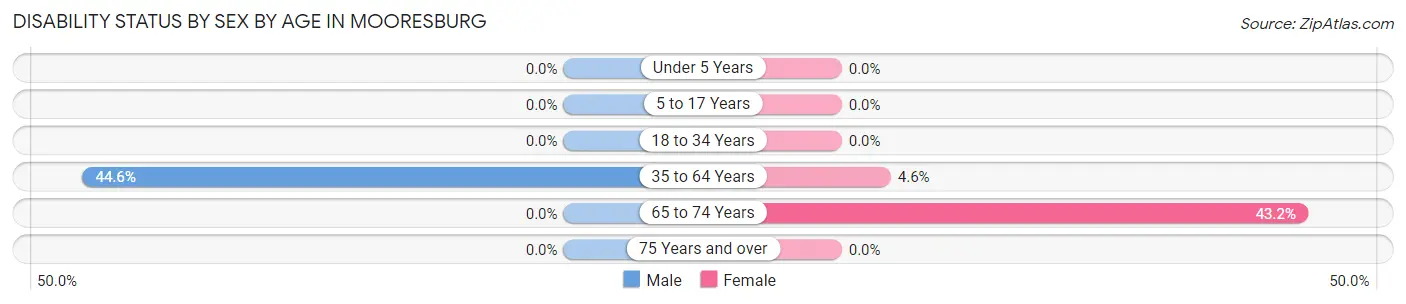
| Age Bracket | Male | Female |
| Under 5 Years | 0 (0.0%) | 0 (0.0%) |
| 5 to 17 Years | 0 (0.0%) | 0 (0.0%) |
| 18 to 34 Years | 0 (0.0%) | 0 (0.0%) |
| 35 to 64 Years | 112 (44.6%) | 6 (4.5%) |
| 65 to 74 Years | 0 (0.0%) | 32 (43.2%) |
| 75 Years and over | 0 (0.0%) | 0 (0.0%) |
Disability Class by Sex by Age in Mooresburg
Disability Class: Hearing Difficulty
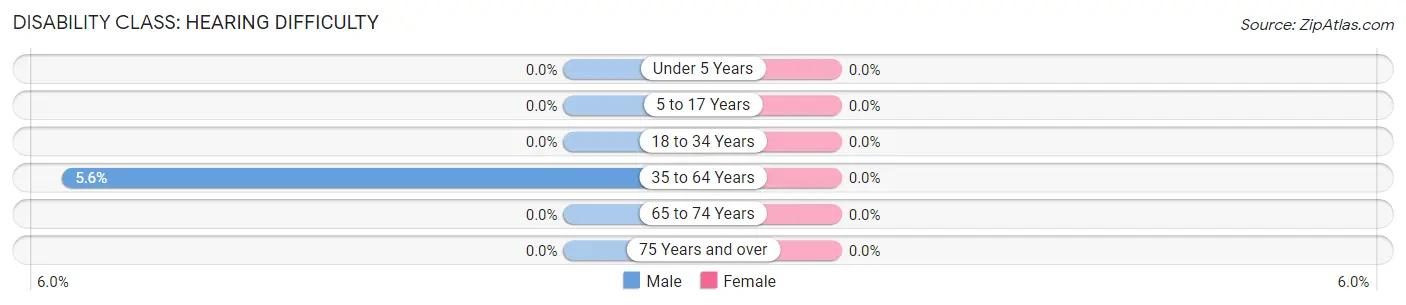
| Age Bracket | Male | Female |
| Under 5 Years | 0 (0.0%) | 0 (0.0%) |
| 5 to 17 Years | 0 (0.0%) | 0 (0.0%) |
| 18 to 34 Years | 0 (0.0%) | 0 (0.0%) |
| 35 to 64 Years | 14 (5.6%) | 0 (0.0%) |
| 65 to 74 Years | 0 (0.0%) | 0 (0.0%) |
| 75 Years and over | 0 (0.0%) | 0 (0.0%) |
Disability Class: Vision Difficulty
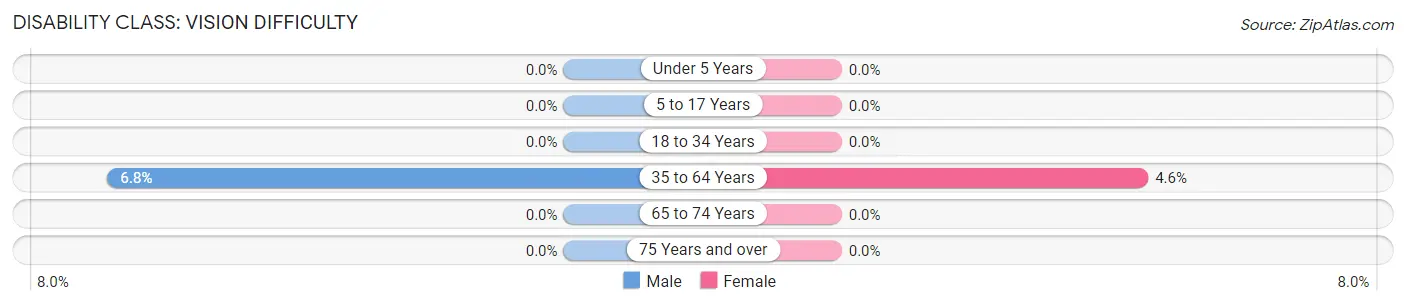
| Age Bracket | Male | Female |
| Under 5 Years | 0 (0.0%) | 0 (0.0%) |
| 5 to 17 Years | 0 (0.0%) | 0 (0.0%) |
| 18 to 34 Years | 0 (0.0%) | 0 (0.0%) |
| 35 to 64 Years | 17 (6.8%) | 6 (4.5%) |
| 65 to 74 Years | 0 (0.0%) | 0 (0.0%) |
| 75 Years and over | 0 (0.0%) | 0 (0.0%) |
Disability Class: Cognitive Difficulty
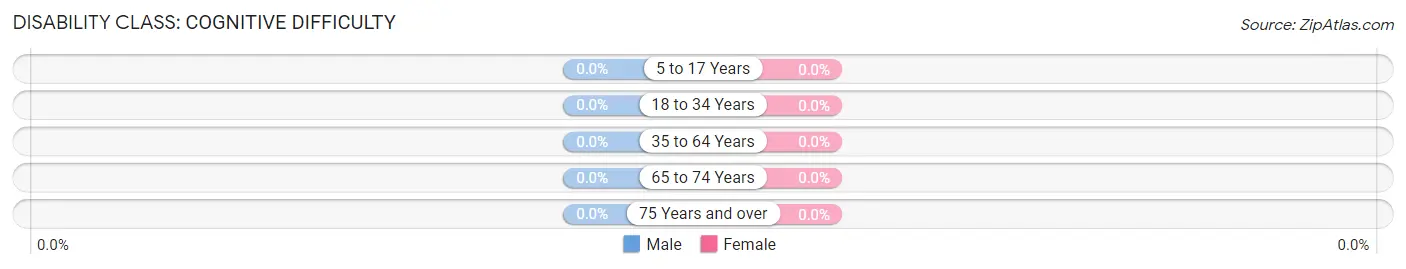
| Age Bracket | Male | Female |
| 5 to 17 Years | 0 (0.0%) | 0 (0.0%) |
| 18 to 34 Years | 0 (0.0%) | 0 (0.0%) |
| 35 to 64 Years | 0 (0.0%) | 0 (0.0%) |
| 65 to 74 Years | 0 (0.0%) | 0 (0.0%) |
| 75 Years and over | 0 (0.0%) | 0 (0.0%) |
Disability Class: Ambulatory Difficulty
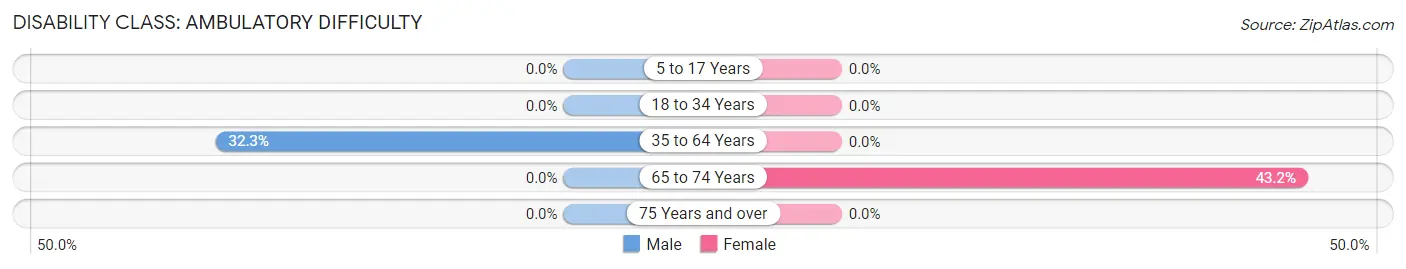
| Age Bracket | Male | Female |
| 5 to 17 Years | 0 (0.0%) | 0 (0.0%) |
| 18 to 34 Years | 0 (0.0%) | 0 (0.0%) |
| 35 to 64 Years | 81 (32.3%) | 0 (0.0%) |
| 65 to 74 Years | 0 (0.0%) | 32 (43.2%) |
| 75 Years and over | 0 (0.0%) | 0 (0.0%) |
Disability Class: Self-Care Difficulty
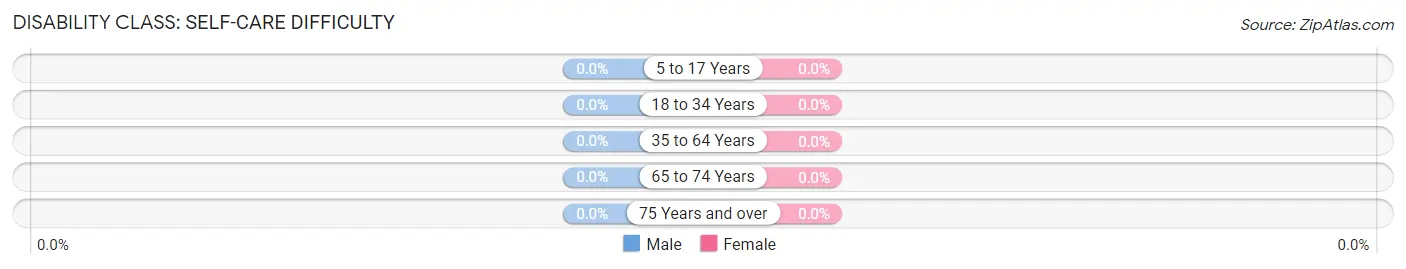
| Age Bracket | Male | Female |
| 5 to 17 Years | 0 (0.0%) | 0 (0.0%) |
| 18 to 34 Years | 0 (0.0%) | 0 (0.0%) |
| 35 to 64 Years | 0 (0.0%) | 0 (0.0%) |
| 65 to 74 Years | 0 (0.0%) | 0 (0.0%) |
| 75 Years and over | 0 (0.0%) | 0 (0.0%) |
Technology Access in Mooresburg
Computing Device Access in Mooresburg
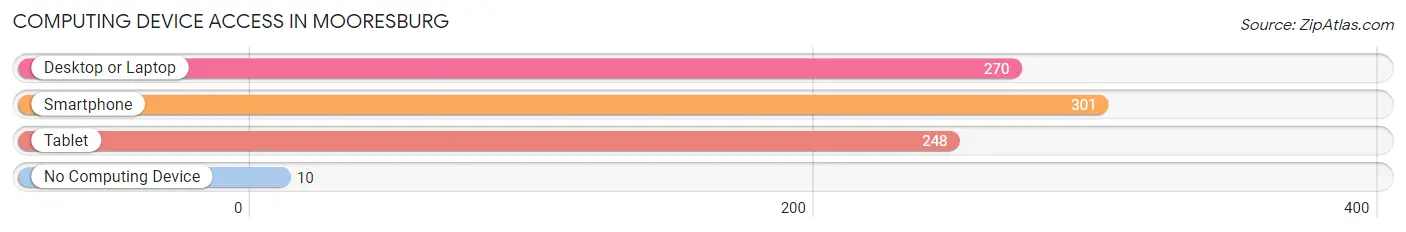
| Device Type | # Households | % Households |
| Desktop or Laptop | 270 | 67.8% |
| Smartphone | 301 | 75.6% |
| Tablet | 248 | 62.3% |
| No Computing Device | 10 | 2.5% |
| Total | 398 | 100.0% |
Internet Access in Mooresburg
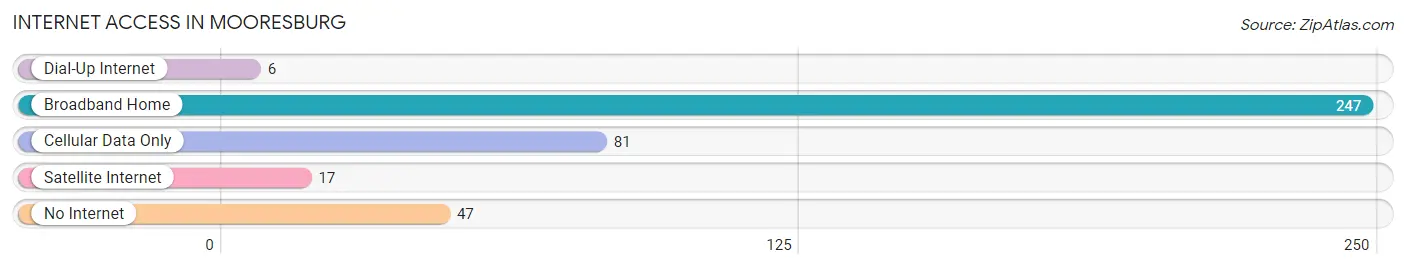
| Internet Type | # Households | % Households |
| Dial-Up Internet | 6 | 1.5% |
| Broadband Home | 247 | 62.1% |
| Cellular Data Only | 81 | 20.3% |
| Satellite Internet | 17 | 4.3% |
| No Internet | 47 | 11.8% |
| Total | 398 | 100.0% |
Mooresburg Summary
Mooresburg is a small town located in Hawkins County, Tennessee. It is situated in the foothills of the Appalachian Mountains, and is part of the Tri-Cities region of northeast Tennessee. The town has a population of approximately 1,000 people, and is known for its rural charm and friendly atmosphere.
History
Mooresburg was founded in 1820 by William Moore, a Revolutionary War veteran. He purchased the land from the Cherokee Indians and named the town after himself. The town was originally known as Moore’s Settlement, but the name was changed to Mooresburg in 1825.
The town grew slowly over the years, and by the late 19th century, it had become a thriving agricultural community. The town was home to several mills, including a grist mill, a saw mill, and a cotton mill. The town also had a post office, a general store, and a blacksmith shop.
In the early 20th century, Mooresburg began to experience a decline in population as people moved away to larger cities in search of better job opportunities. The town’s population dropped from 1,000 in 1910 to just 500 in 1950.
Geography
Mooresburg is located in the foothills of the Appalachian Mountains in northeast Tennessee. The town is situated in Hawkins County, and is part of the Tri-Cities region. The town is located approximately 25 miles northeast of Knoxville, and is bordered by the towns of Rogersville, Bulls Gap, and Surgoinsville.
The town is situated at an elevation of 1,000 feet above sea level, and is surrounded by rolling hills and lush forests. The town is located near the Holston River, which provides a source of recreation for the town’s residents.
Economy
Mooresburg’s economy is largely based on agriculture. The town is home to several farms, which produce a variety of crops, including corn, soybeans, and hay. The town also has several small businesses, including a grocery store, a hardware store, and a gas station.
The town is also home to several manufacturing companies, including a furniture factory and a plastics factory. The town is also home to a number of small businesses, including restaurants, antique stores, and gift shops.
Demographics
As of the 2010 census, Mooresburg had a population of 1,000 people. The town is predominantly white, with approximately 95% of the population identifying as Caucasian. The town also has a small African American population, with approximately 4% of the population identifying as African American.
The town has a median household income of $35,000, and the median age is 44 years old. The town has a low unemployment rate, with only 4% of the population unemployed.
Conclusion
Mooresburg is a small town located in Hawkins County, Tennessee. It is situated in the foothills of the Appalachian Mountains, and is part of the Tri-Cities region of northeast Tennessee. The town has a population of approximately 1,000 people, and is known for its rural charm and friendly atmosphere. The town’s economy is largely based on agriculture, and it is home to several small businesses. The town is predominantly white, with a small African American population. The town has a median household income of $35,000, and the median age is 44 years old.
Common Questions
What is Per Capita Income in Mooresburg?
Per Capita income in Mooresburg is $22,715.
What is the Median Family Income in Mooresburg?
Median Family Income in Mooresburg is $70,038.
What is the Median Household income in Mooresburg?
Median Household Income in Mooresburg is $38,491.
What is Income or Wage Gap in Mooresburg?
Income or Wage Gap in Mooresburg is 15.3%.
Women in Mooresburg earn 84.7 cents for every dollar earned by a man.
What is Inequality or Gini Index in Mooresburg?
Inequality or Gini Index in Mooresburg is 0.51.
What is the Total Population of Mooresburg?
Total Population of Mooresburg is 903.
What is the Total Male Population of Mooresburg?
Total Male Population of Mooresburg is 494.
What is the Total Female Population of Mooresburg?
Total Female Population of Mooresburg is 409.
What is the Ratio of Males per 100 Females in Mooresburg?
There are 120.78 Males per 100 Females in Mooresburg.
What is the Ratio of Females per 100 Males in Mooresburg?
There are 82.79 Females per 100 Males in Mooresburg.
What is the Median Population Age in Mooresburg?
Median Population Age in Mooresburg is 43.2 Years.
What is the Average Family Size in Mooresburg
Average Family Size in Mooresburg is 3.3 People.
What is the Average Household Size in Mooresburg
Average Household Size in Mooresburg is 2.3 People.
How Large is the Labor Force in Mooresburg?
There are 427 People in the Labor Forcein in Mooresburg.
What is the Percentage of People in the Labor Force in Mooresburg?
63.5% of People are in the Labor Force in Mooresburg.
What is the Unemployment Rate in Mooresburg?
Unemployment Rate in Mooresburg is 9.1%.