Zip Codes with the Highest Percentage of Population Employed in Food Preparation & Serving in Germantown, TN
RELATED REPORTS & OPTIONS
Food Preparation & Serving
Germantown
Compare Zip Codes
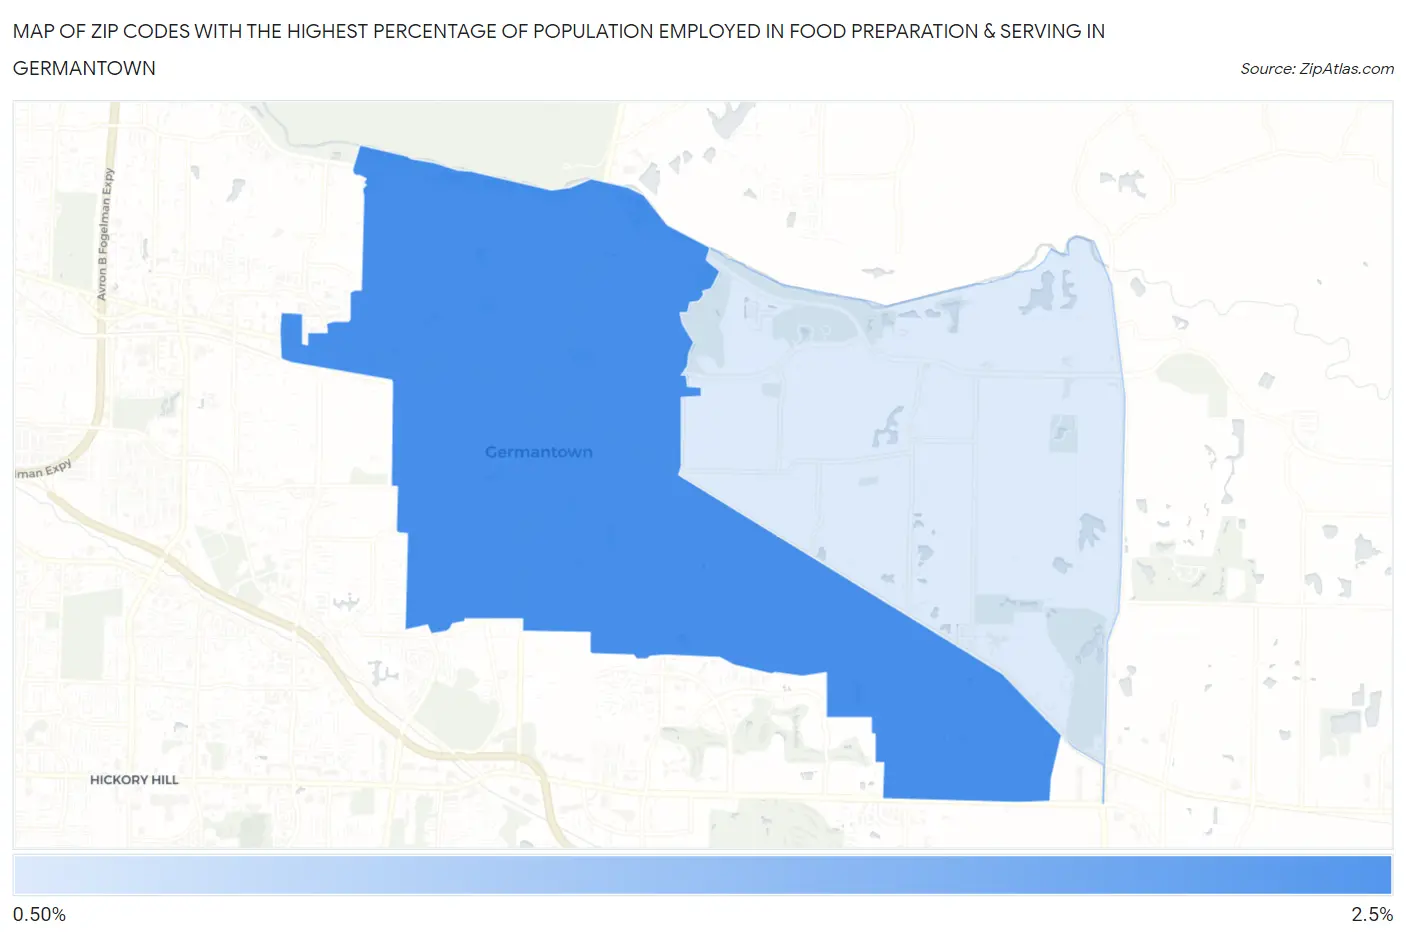
Map of Zip Codes with the Highest Percentage of Population Employed in Food Preparation & Serving in Germantown
1.3%
2.5%
Zip Codes with the Highest Percentage of Population Employed in Food Preparation & Serving in Germantown, TN
| Zip Code | % Employed | vs State | vs National | |
| 1. | 38138 | 2.5% | 5.4%(-2.94)#470 | 5.3%(-2.81)#23,232 |
| 2. | 38139 | 1.3% | 5.4%(-4.11)#528 | 5.3%(-3.97)#26,386 |
1
Common Questions
What are the Top Zip Codes with the Highest Percentage of Population Employed in Food Preparation & Serving in Germantown, TN?
Top Zip Codes with the Highest Percentage of Population Employed in Food Preparation & Serving in Germantown, TN are:
What zip code has the Highest Percentage of Population Employed in Food Preparation & Serving in Germantown, TN?
38138 has the Highest Percentage of Population Employed in Food Preparation & Serving in Germantown, TN with 2.5%.
What is the Percentage of Population Employed in Food Preparation & Serving in Germantown, TN?
Percentage of Population Employed in Food Preparation & Serving in Germantown is 2.1%.
What is the Percentage of Population Employed in Food Preparation & Serving in Tennessee?
Percentage of Population Employed in Food Preparation & Serving in Tennessee is 5.4%.
What is the Percentage of Population Employed in Food Preparation & Serving in the United States?
Percentage of Population Employed in Food Preparation & Serving in the United States is 5.3%.