Lone Oak, TN Map & Demographics
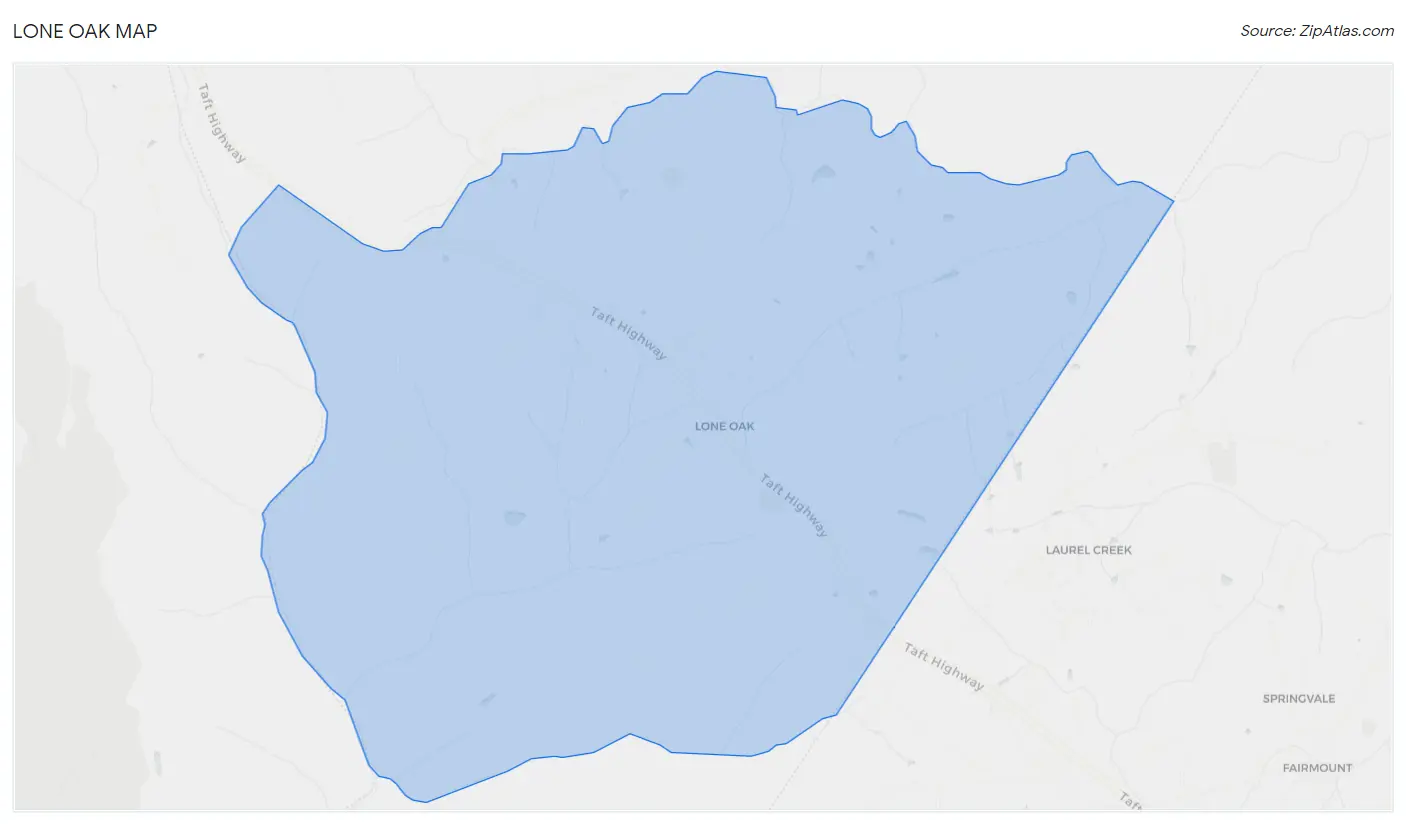
Lone Oak Map
Lone Oak Overview
$22,537
PER CAPITA INCOME
$75,000
AVG FAMILY INCOME
73.8%
WAGE / INCOME GAP [ % ]
26.2¢/ $1
WAGE / INCOME GAP [ $ ]
0.43
INEQUALITY / GINI INDEX
1,584
TOTAL POPULATION
631
MALE POPULATION
953
FEMALE POPULATION
66.21
MALES / 100 FEMALES
151.03
FEMALES / 100 MALES
51.1
MEDIAN AGE
3.5
AVG FAMILY SIZE
2.8
AVG HOUSEHOLD SIZE
625
LABOR FORCE [ PEOPLE ]
46.0%
PERCENT IN LABOR FORCE
Income in Lone Oak
Income Overview in Lone Oak
| Characteristic | Number | Measure |
| Per Capita Income | 1,584 | $22,537 |
| Median Family Income | 402 | $75,000 |
| Mean Family Income | 402 | $68,222 |
| Median Household Income | 559 | $0 |
| Mean Household Income | 559 | $58,336 |
| Income Deficit | 402 | $0 |
| Wage / Income Gap (%) | 1,584 | 73.82% |
| Wage / Income Gap ($) | 1,584 | 26.18¢ per $1 |
| Gini / Inequality Index | 1,584 | 0.43 |
Earnings by Sex in Lone Oak
Average Earnings in Lone Oak are $29,952, $44,375 for men and $11,616 for women, a difference of 73.8%.
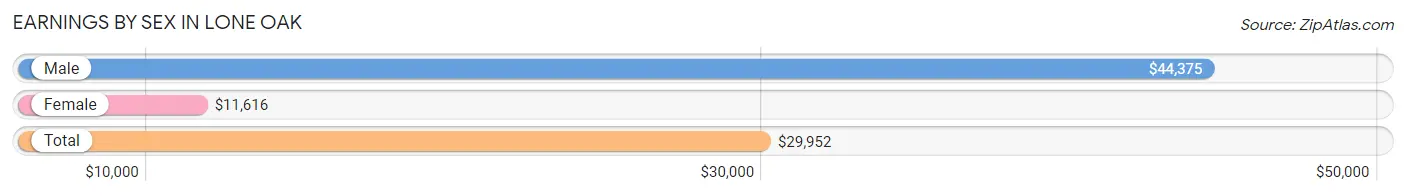
| Sex | Number | Average Earnings |
| Male | 368 (54.2%) | $44,375 |
| Female | 311 (45.8%) | $11,616 |
| Total | 679 (100.0%) | $29,952 |
Earnings by Sex by Income Bracket in Lone Oak
The most common earnings brackets in Lone Oak are $30,000 to $34,999 for men (71 | 19.3%) and $10,000 to $12,499 for women (106 | 34.1%).
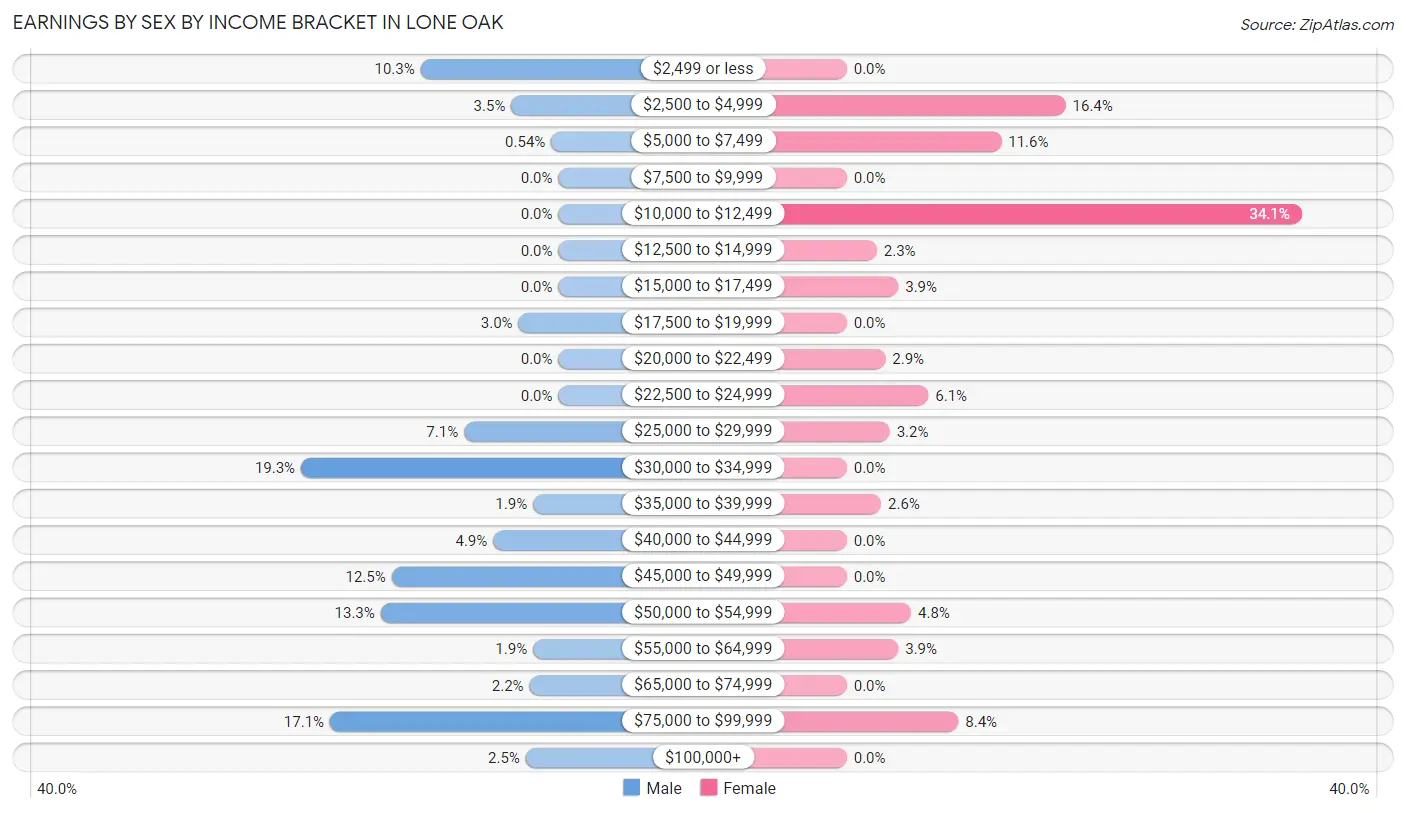
| Income | Male | Female |
| $2,499 or less | 38 (10.3%) | 0 (0.0%) |
| $2,500 to $4,999 | 13 (3.5%) | 51 (16.4%) |
| $5,000 to $7,499 | 2 (0.5%) | 36 (11.6%) |
| $7,500 to $9,999 | 0 (0.0%) | 0 (0.0%) |
| $10,000 to $12,499 | 0 (0.0%) | 106 (34.1%) |
| $12,500 to $14,999 | 0 (0.0%) | 7 (2.2%) |
| $15,000 to $17,499 | 0 (0.0%) | 12 (3.9%) |
| $17,500 to $19,999 | 11 (3.0%) | 0 (0.0%) |
| $20,000 to $22,499 | 0 (0.0%) | 9 (2.9%) |
| $22,500 to $24,999 | 0 (0.0%) | 19 (6.1%) |
| $25,000 to $29,999 | 26 (7.1%) | 10 (3.2%) |
| $30,000 to $34,999 | 71 (19.3%) | 0 (0.0%) |
| $35,000 to $39,999 | 7 (1.9%) | 8 (2.6%) |
| $40,000 to $44,999 | 18 (4.9%) | 0 (0.0%) |
| $45,000 to $49,999 | 46 (12.5%) | 0 (0.0%) |
| $50,000 to $54,999 | 49 (13.3%) | 15 (4.8%) |
| $55,000 to $64,999 | 7 (1.9%) | 12 (3.9%) |
| $65,000 to $74,999 | 8 (2.2%) | 0 (0.0%) |
| $75,000 to $99,999 | 63 (17.1%) | 26 (8.4%) |
| $100,000+ | 9 (2.5%) | 0 (0.0%) |
| Total | 368 (100.0%) | 311 (100.0%) |
Earnings by Sex by Educational Attainment in Lone Oak
Average earnings in Lone Oak are $48,974 for men and $12,134 for women, a difference of 75.2%. Men with an educational attainment of bachelor's degree enjoy the highest average annual earnings of $52,917, while those with bachelor's degree education earn the least with $52,917. Women with an educational attainment of graduate degree earn the most with the average annual earnings of $54,250, while those with high school diploma education have the smallest earnings of $10,933.
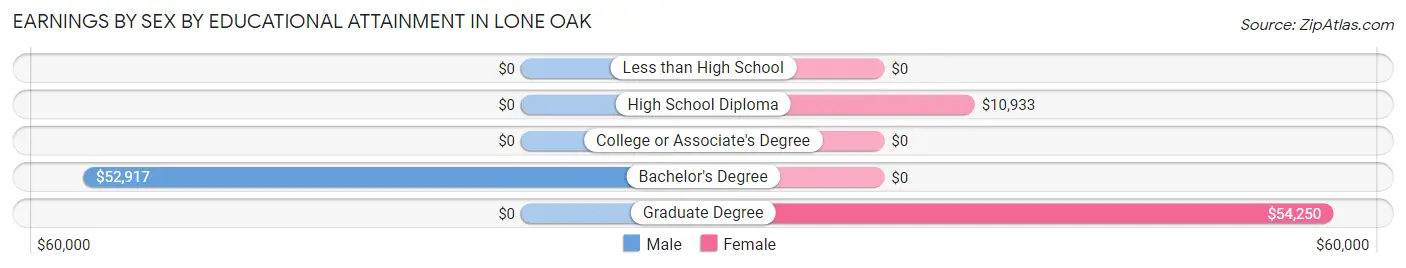
| Educational Attainment | Male Income | Female Income |
| Less than High School | - | - |
| High School Diploma | - | - |
| College or Associate's Degree | - | - |
| Bachelor's Degree | $52,917 | $0 |
| Graduate Degree | - | - |
| Total | $48,974 | $12,134 |
Family Income in Lone Oak
Family Income Brackets in Lone Oak
According to the Lone Oak family income data, there are 113 families falling into the $75,000 to $99,999 income range, which is the most common income bracket and makes up 28.1% of all families.
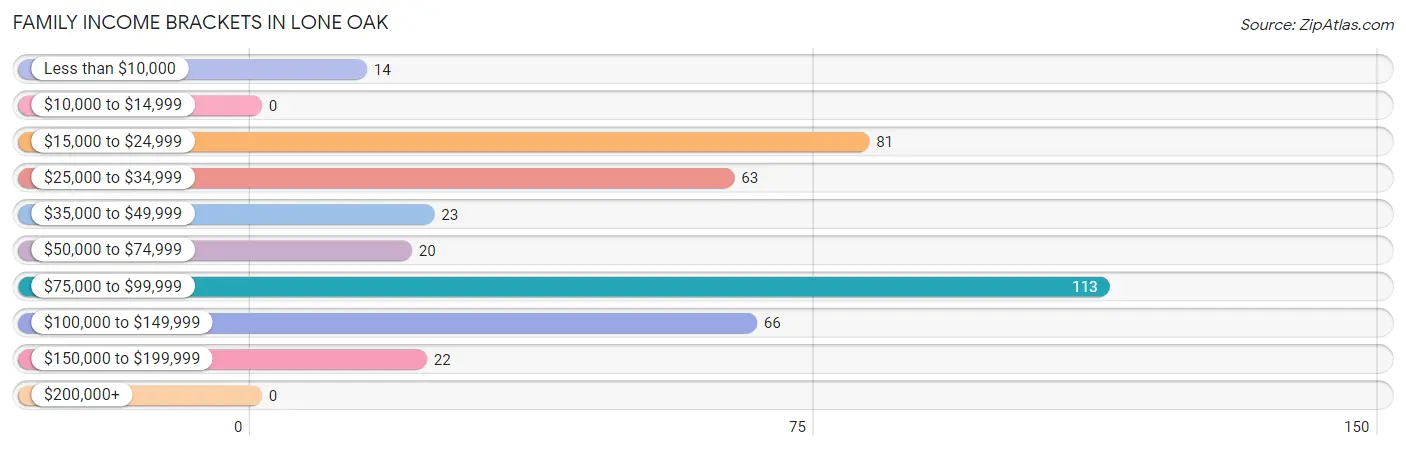
| Income Bracket | # Families | % Families |
| Less than $10,000 | 14 | 3.5% |
| $10,000 to $14,999 | 0 | 0.0% |
| $15,000 to $24,999 | 81 | 20.1% |
| $25,000 to $34,999 | 63 | 15.7% |
| $35,000 to $49,999 | 23 | 5.7% |
| $50,000 to $74,999 | 20 | 5.0% |
| $75,000 to $99,999 | 113 | 28.1% |
| $100,000 to $149,999 | 66 | 16.4% |
| $150,000 to $199,999 | 22 | 5.5% |
| $200,000+ | 0 | 0.0% |
Family Income by Famaliy Size in Lone Oak
4-person families (74 | 18.4%) account for the highest median family income in Lone Oak with $94,545 per family, while 2-person families (192 | 47.8%) have the highest median income of $38,414 per family member.
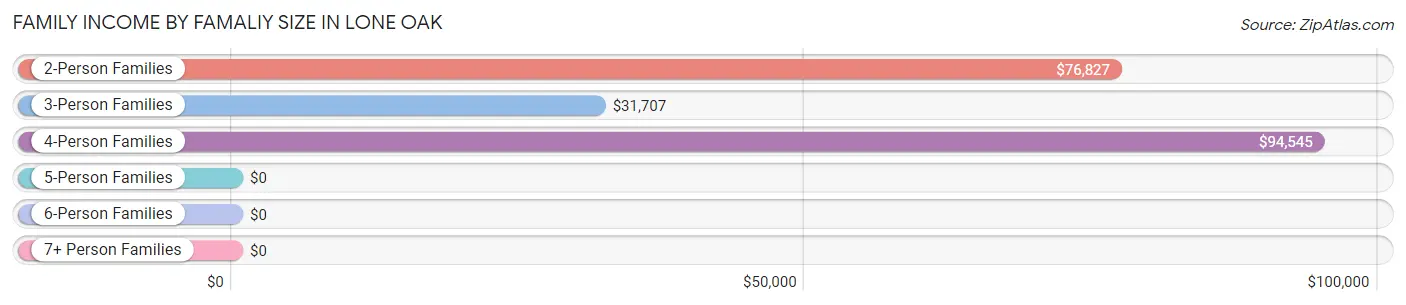
| Income Bracket | # Families | Median Income |
| 2-Person Families | 192 (47.8%) | $76,827 |
| 3-Person Families | 79 (19.7%) | $31,707 |
| 4-Person Families | 74 (18.4%) | $94,545 |
| 5-Person Families | 46 (11.4%) | $0 |
| 6-Person Families | 0 (0.0%) | $0 |
| 7+ Person Families | 11 (2.7%) | $0 |
| Total | 402 (100.0%) | $75,000 |
Family Income by Number of Earners in Lone Oak
The median family income in Lone Oak is $75,000, with families comprising 3+ earners (46) having the highest median family income of $96,855, while families with no earners (115) have the lowest median family income of $30,793, accounting for 11.4% and 28.6% of families, respectively.

| Number of Earners | # Families | Median Income |
| No Earners | 115 (28.6%) | $30,793 |
| 1 Earner | 125 (31.1%) | $94,129 |
| 2 Earners | 116 (28.9%) | $75,192 |
| 3+ Earners | 46 (11.4%) | $96,855 |
| Total | 402 (100.0%) | $75,000 |
Household Income in Lone Oak
Household Income Brackets in Lone Oak
With 124 households falling in the category, the $75,000 to $99,999 income range is the most frequent in Lone Oak, accounting for 22.2% of all households.
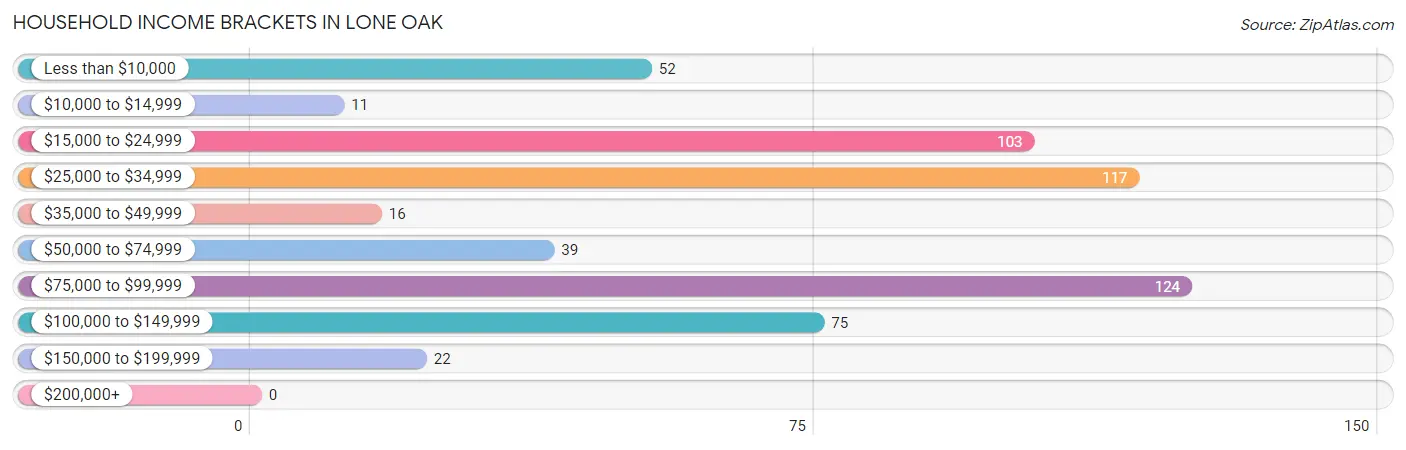
| Income Bracket | # Households | % Households |
| Less than $10,000 | 52 | 9.3% |
| $10,000 to $14,999 | 11 | 2.0% |
| $15,000 to $24,999 | 103 | 18.4% |
| $25,000 to $34,999 | 117 | 20.9% |
| $35,000 to $49,999 | 16 | 2.9% |
| $50,000 to $74,999 | 39 | 7.0% |
| $75,000 to $99,999 | 124 | 22.2% |
| $100,000 to $149,999 | 75 | 13.4% |
| $150,000 to $199,999 | 22 | 3.9% |
| $200,000+ | 0 | 0.0% |
Household Income by Householder Age in Lone Oak
The median household income in Lone Oak is $0, with the highest median household income of $89,205 found in the 45 to 64 years age bracket for the primary householder. A total of 273 households (48.8%) fall into this category.
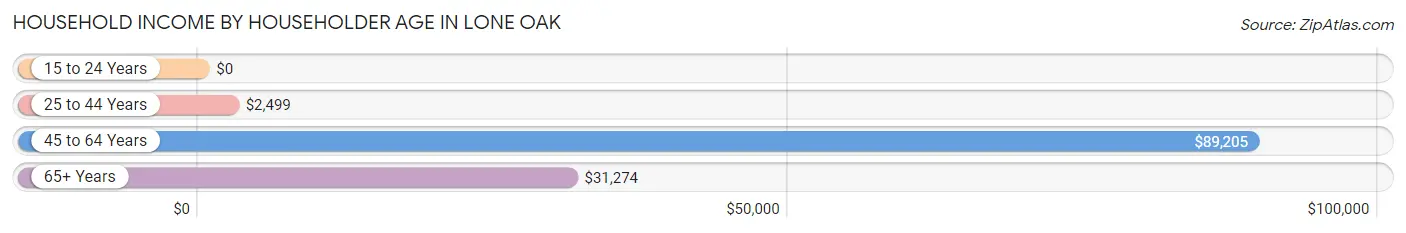
| Income Bracket | # Households | Median Income |
| 15 to 24 Years | 0 (0.0%) | $0 |
| 25 to 44 Years | 67 (12.0%) | $2,499 |
| 45 to 64 Years | 273 (48.8%) | $89,205 |
| 65+ Years | 219 (39.2%) | $31,274 |
| Total | 559 (100.0%) | $0 |
Poverty in Lone Oak
Income Below Poverty by Sex and Age in Lone Oak
With 30.3% poverty level for males and 22.5% for females among the residents of Lone Oak, 5 year old males and 5 year old females are the most vulnerable to poverty, with 8 males (100.0%) and 4 females (100.0%) in their respective age groups living below the poverty level.
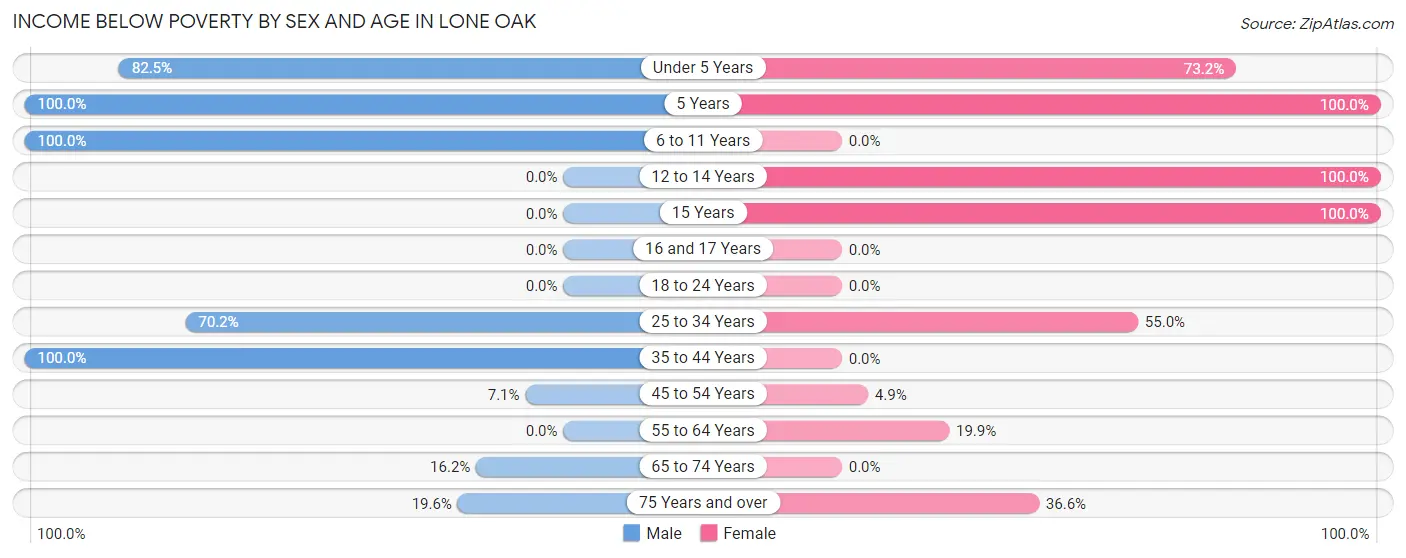
| Age Bracket | Male | Female |
| Under 5 Years | 33 (82.5%) | 30 (73.2%) |
| 5 Years | 8 (100.0%) | 4 (100.0%) |
| 6 to 11 Years | 23 (100.0%) | 0 (0.0%) |
| 12 to 14 Years | 0 (0.0%) | 8 (100.0%) |
| 15 Years | 0 (0.0%) | 23 (100.0%) |
| 16 and 17 Years | 0 (0.0%) | 0 (0.0%) |
| 18 to 24 Years | 0 (0.0%) | 0 (0.0%) |
| 25 to 34 Years | 47 (70.2%) | 72 (55.0%) |
| 35 to 44 Years | 48 (100.0%) | 0 (0.0%) |
| 45 to 54 Years | 11 (7.0%) | 8 (4.9%) |
| 55 to 64 Years | 0 (0.0%) | 39 (19.9%) |
| 65 to 74 Years | 11 (16.2%) | 0 (0.0%) |
| 75 Years and over | 10 (19.6%) | 30 (36.6%) |
| Total | 191 (30.3%) | 214 (22.5%) |
Income Above Poverty by Sex and Age in Lone Oak
According to the poverty statistics in Lone Oak, males aged 16 and 17 years and females aged 6 to 11 years are the age groups that are most secure financially, with 100.0% of males and 100.0% of females in these age groups living above the poverty line.
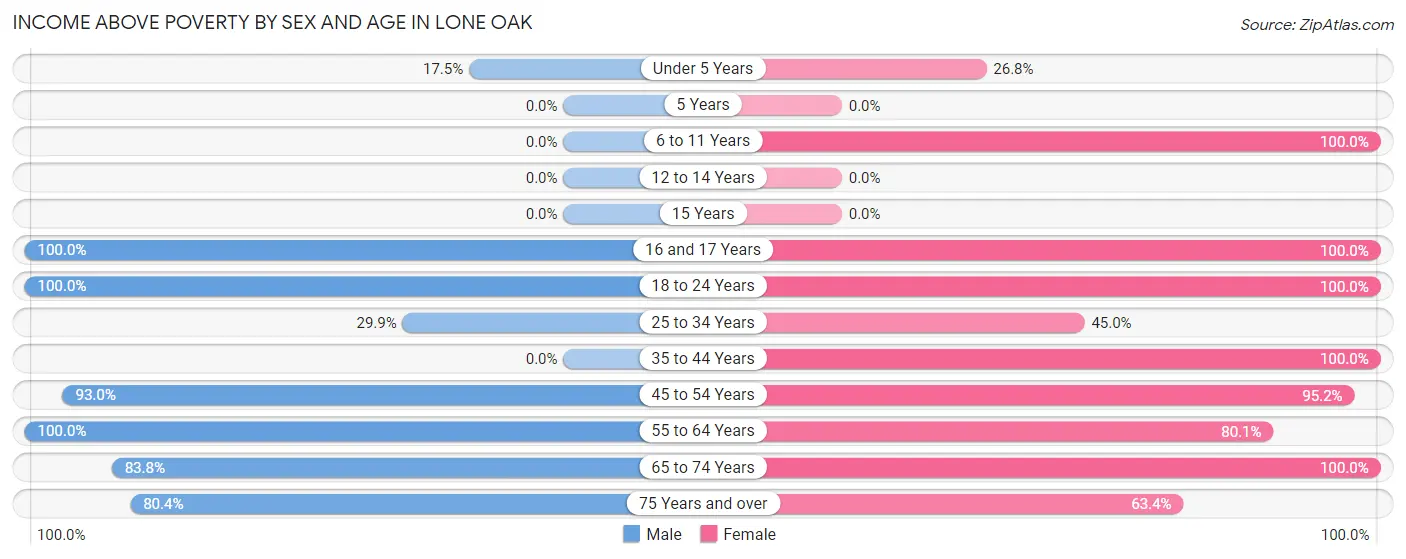
| Age Bracket | Male | Female |
| Under 5 Years | 7 (17.5%) | 11 (26.8%) |
| 5 Years | 0 (0.0%) | 0 (0.0%) |
| 6 to 11 Years | 0 (0.0%) | 79 (100.0%) |
| 12 to 14 Years | 0 (0.0%) | 0 (0.0%) |
| 15 Years | 0 (0.0%) | 0 (0.0%) |
| 16 and 17 Years | 17 (100.0%) | 44 (100.0%) |
| 18 to 24 Years | 64 (100.0%) | 21 (100.0%) |
| 25 to 34 Years | 20 (29.8%) | 59 (45.0%) |
| 35 to 44 Years | 0 (0.0%) | 49 (100.0%) |
| 45 to 54 Years | 145 (92.9%) | 157 (95.2%) |
| 55 to 64 Years | 89 (100.0%) | 157 (80.1%) |
| 65 to 74 Years | 57 (83.8%) | 110 (100.0%) |
| 75 Years and over | 41 (80.4%) | 52 (63.4%) |
| Total | 440 (69.7%) | 739 (77.5%) |
Income Below Poverty Among Married-Couple Families in Lone Oak
The poverty statistics for married-couple families in Lone Oak show that 9.3% or 25 of the total 270 families live below the poverty line. Families with 3 or 4 children have the highest poverty rate of 100.0%, comprising of 11 families. On the other hand, families with 1 or 2 children have the lowest poverty rate of 5.3%, which includes 4 families.
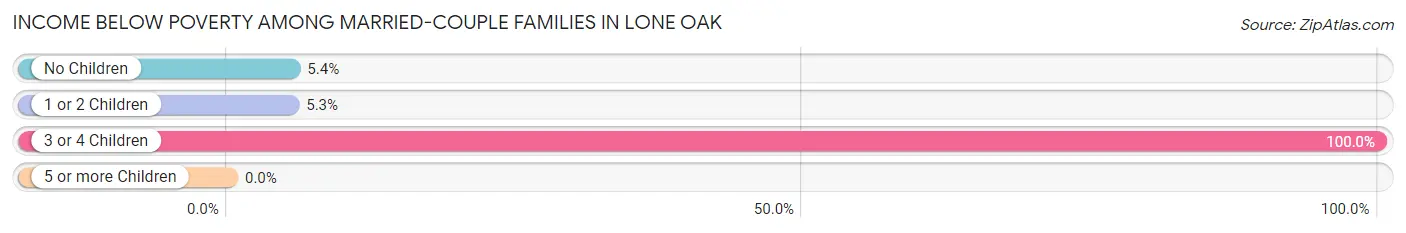
| Children | Above Poverty | Below Poverty |
| No Children | 174 (94.6%) | 10 (5.4%) |
| 1 or 2 Children | 71 (94.7%) | 4 (5.3%) |
| 3 or 4 Children | 0 (0.0%) | 11 (100.0%) |
| 5 or more Children | 0 (0.0%) | 0 (0.0%) |
| Total | 245 (90.7%) | 25 (9.3%) |
Income Below Poverty Among Single-Parent Households in Lone Oak
According to the poverty data in Lone Oak, 58.8% or 10 single-father households and 33.9% or 39 single-mother households are living below the poverty line. Among single-father households, those with 1 or 2 children have the highest poverty rate, with 10 households (58.8%) experiencing poverty. Likewise, among single-mother households, those with 1 or 2 children have the highest poverty rate, with 39 households (39.4%) falling below the poverty line.
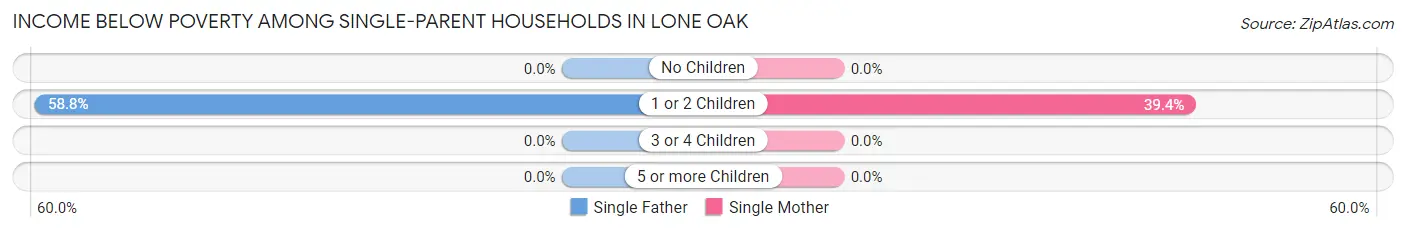
| Children | Single Father | Single Mother |
| No Children | 0 (0.0%) | 0 (0.0%) |
| 1 or 2 Children | 10 (58.8%) | 39 (39.4%) |
| 3 or 4 Children | 0 (0.0%) | 0 (0.0%) |
| 5 or more Children | 0 (0.0%) | 0 (0.0%) |
| Total | 10 (58.8%) | 39 (33.9%) |
Income Below Poverty Among Married-Couple vs Single-Parent Households in Lone Oak
The poverty data for Lone Oak shows that 25 of the married-couple family households (9.3%) and 49 of the single-parent households (37.1%) are living below the poverty level. Within the married-couple family households, those with 3 or 4 children have the highest poverty rate, with 11 households (100.0%) falling below the poverty line. Among the single-parent households, those with 1 or 2 children have the highest poverty rate, with 49 household (42.2%) living below poverty.
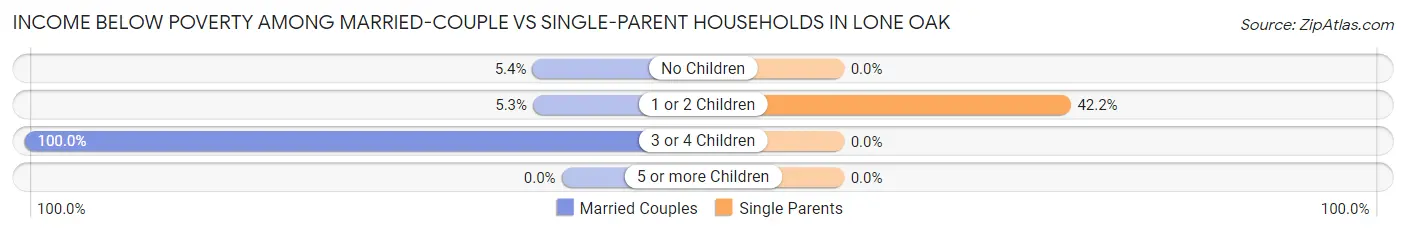
| Children | Married-Couple Families | Single-Parent Households |
| No Children | 10 (5.4%) | 0 (0.0%) |
| 1 or 2 Children | 4 (5.3%) | 49 (42.2%) |
| 3 or 4 Children | 11 (100.0%) | 0 (0.0%) |
| 5 or more Children | 0 (0.0%) | 0 (0.0%) |
| Total | 25 (9.3%) | 49 (37.1%) |
Race in Lone Oak
The most populous races in Lone Oak are White / Caucasian (1,540 | 97.2%), and Asian (44 | 2.8%).
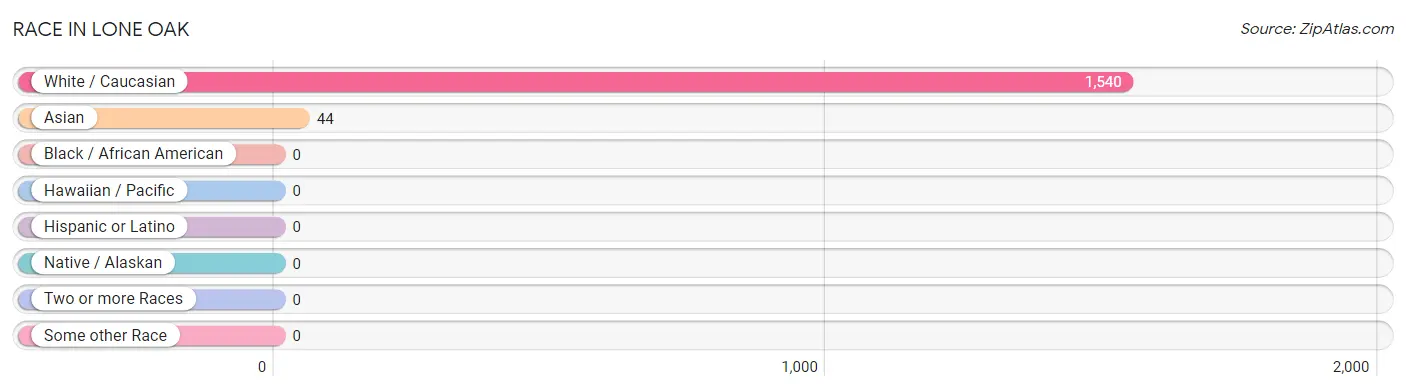
| Race | # Population | % Population |
| Asian | 44 | 2.8% |
| Black / African American | 0 | 0.0% |
| Hawaiian / Pacific | 0 | 0.0% |
| Hispanic or Latino | 0 | 0.0% |
| Native / Alaskan | 0 | 0.0% |
| White / Caucasian | 1,540 | 97.2% |
| Two or more Races | 0 | 0.0% |
| Some other Race | 0 | 0.0% |
| Total | 1,584 | 100.0% |
Ancestry in Lone Oak
The most populous ancestries reported in Lone Oak are English (219 | 13.8%), German (137 | 8.6%), Irish (137 | 8.6%), Scottish (57 | 3.6%), and Indian (Asian) (44 | 2.8%), together accounting for 37.5% of all Lone Oak residents.
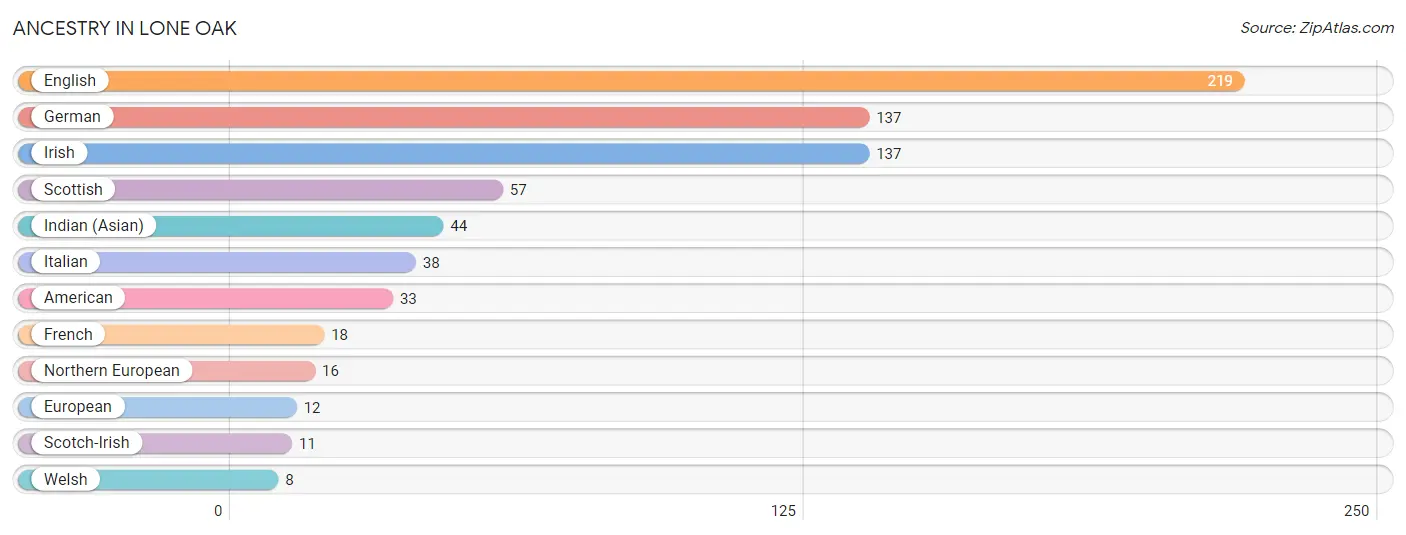
| Ancestry | # Population | % Population |
| American | 33 | 2.1% |
| English | 219 | 13.8% |
| European | 12 | 0.8% |
| French | 18 | 1.1% |
| German | 137 | 8.6% |
| Indian (Asian) | 44 | 2.8% |
| Irish | 137 | 8.6% |
| Italian | 38 | 2.4% |
| Northern European | 16 | 1.0% |
| Scotch-Irish | 11 | 0.7% |
| Scottish | 57 | 3.6% |
| Welsh | 8 | 0.5% | View All 12 Rows |
Immigrants in Lone Oak
The most numerous immigrant groups reported in Lone Oak came from Europe (7 | 0.4%), Germany (7 | 0.4%), and Western Europe (7 | 0.4%), together accounting for 1.3% of all Lone Oak residents.
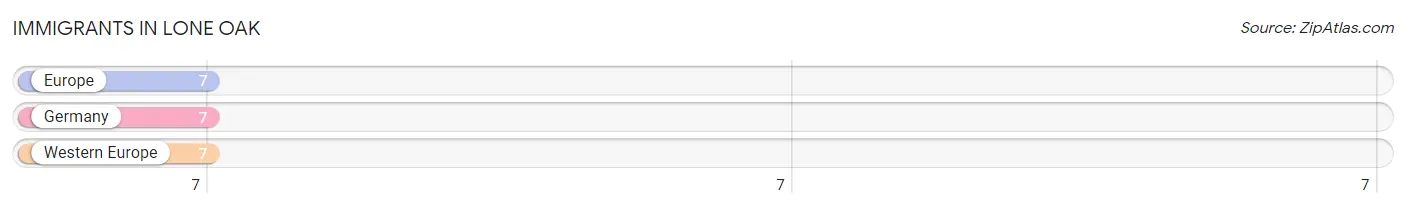
| Immigration Origin | # Population | % Population |
| Europe | 7 | 0.4% |
| Germany | 7 | 0.4% |
| Western Europe | 7 | 0.4% | View All 3 Rows |
Sex and Age in Lone Oak
Sex and Age in Lone Oak
The most populous age groups in Lone Oak are 50 to 54 Years (92 | 14.6%) for men and 55 to 59 Years (129 | 13.5%) for women.
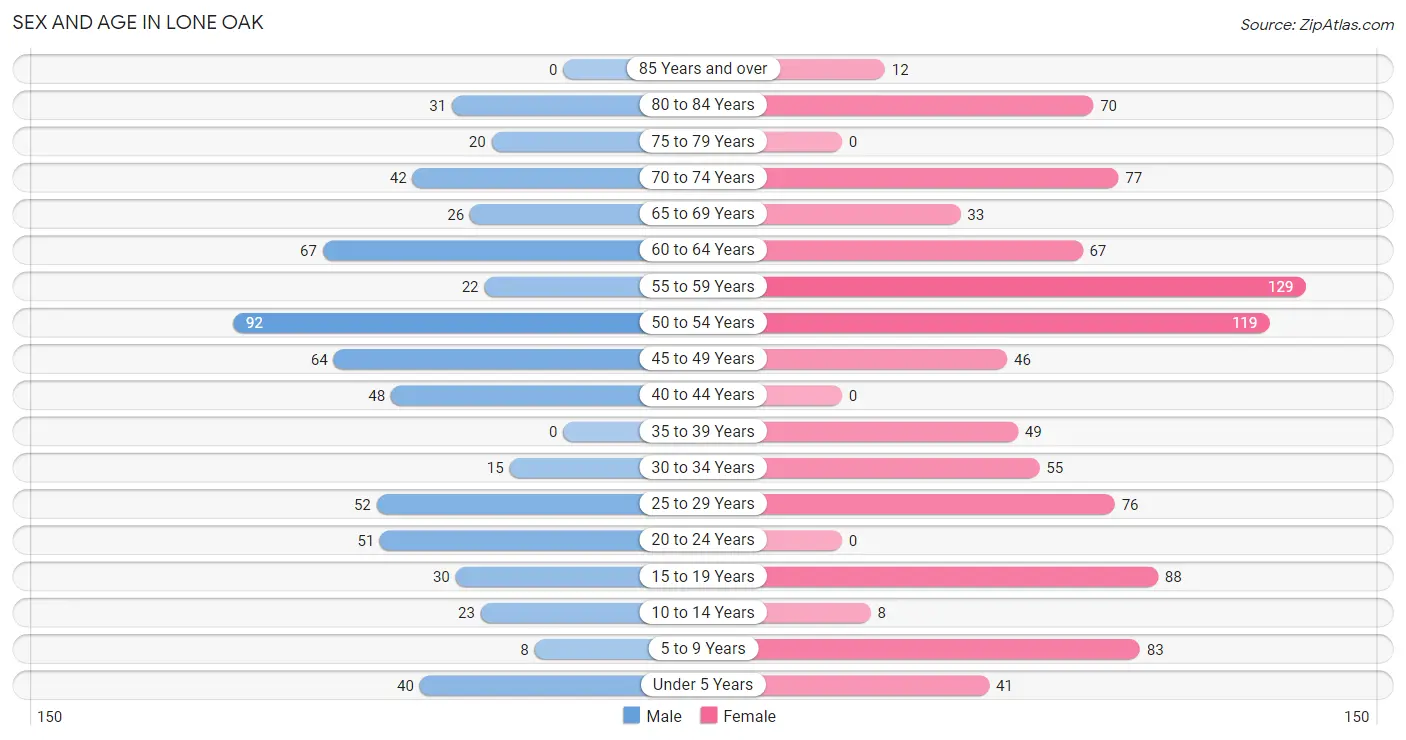
| Age Bracket | Male | Female |
| Under 5 Years | 40 (6.3%) | 41 (4.3%) |
| 5 to 9 Years | 8 (1.3%) | 83 (8.7%) |
| 10 to 14 Years | 23 (3.6%) | 8 (0.8%) |
| 15 to 19 Years | 30 (4.8%) | 88 (9.2%) |
| 20 to 24 Years | 51 (8.1%) | 0 (0.0%) |
| 25 to 29 Years | 52 (8.2%) | 76 (8.0%) |
| 30 to 34 Years | 15 (2.4%) | 55 (5.8%) |
| 35 to 39 Years | 0 (0.0%) | 49 (5.1%) |
| 40 to 44 Years | 48 (7.6%) | 0 (0.0%) |
| 45 to 49 Years | 64 (10.1%) | 46 (4.8%) |
| 50 to 54 Years | 92 (14.6%) | 119 (12.5%) |
| 55 to 59 Years | 22 (3.5%) | 129 (13.5%) |
| 60 to 64 Years | 67 (10.6%) | 67 (7.0%) |
| 65 to 69 Years | 26 (4.1%) | 33 (3.5%) |
| 70 to 74 Years | 42 (6.7%) | 77 (8.1%) |
| 75 to 79 Years | 20 (3.2%) | 0 (0.0%) |
| 80 to 84 Years | 31 (4.9%) | 70 (7.3%) |
| 85 Years and over | 0 (0.0%) | 12 (1.3%) |
| Total | 631 (100.0%) | 953 (100.0%) |
Families and Households in Lone Oak
Median Family Size in Lone Oak
The median family size in Lone Oak is 3.50 persons per family, with single male/father families (17 | 4.2%) accounting for the largest median family size of 3.94 persons per family. On the other hand, married-couple families (270 | 67.2%) represent the smallest median family size with 3.35 persons per family.
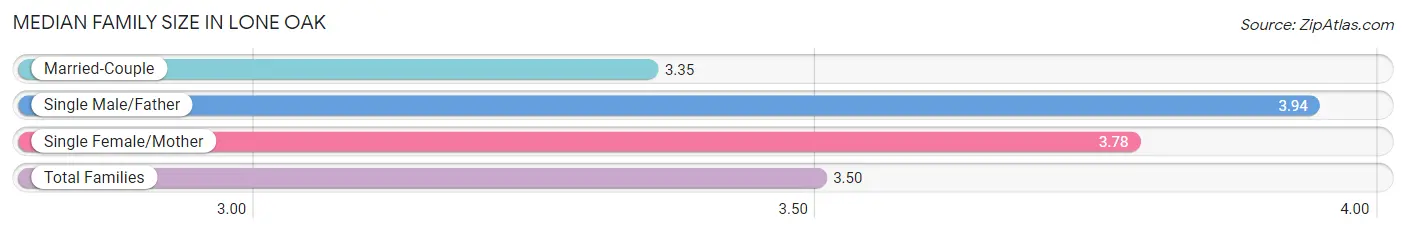
| Family Type | # Families | Family Size |
| Married-Couple | 270 (67.2%) | 3.35 |
| Single Male/Father | 17 (4.2%) | 3.94 |
| Single Female/Mother | 115 (28.6%) | 3.78 |
| Total Families | 402 (100.0%) | 3.50 |
Median Household Size in Lone Oak
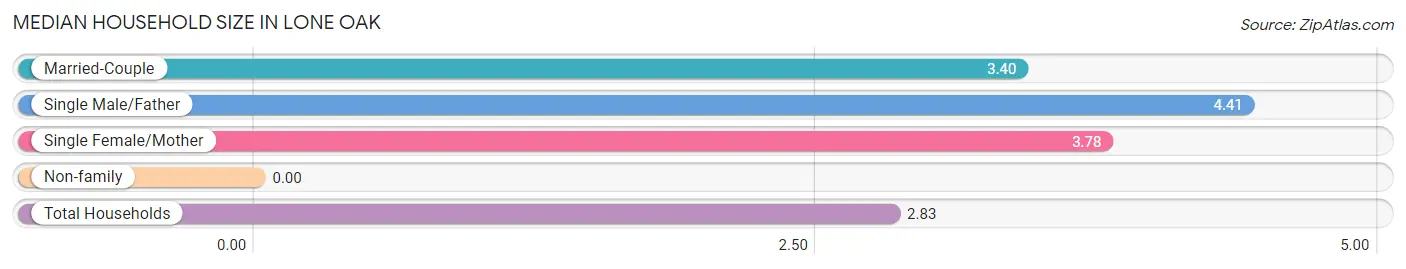
| Household Type | # Households | Household Size |
| Married-Couple | 270 (48.3%) | 3.40 |
| Single Male/Father | 17 (3.0%) | 4.41 |
| Single Female/Mother | 115 (20.6%) | 3.78 |
| Non-family | 157 (28.1%) | - |
| Total Households | 559 (100.0%) | 2.83 |
Household Size by Marriage Status in Lone Oak
Out of a total of 559 households in Lone Oak, 402 (71.9%) are family households, while 157 (28.1%) are nonfamily households. The most numerous type of family households are 2-person households, comprising 179, and the most common type of nonfamily households are 1-person households, comprising 157.
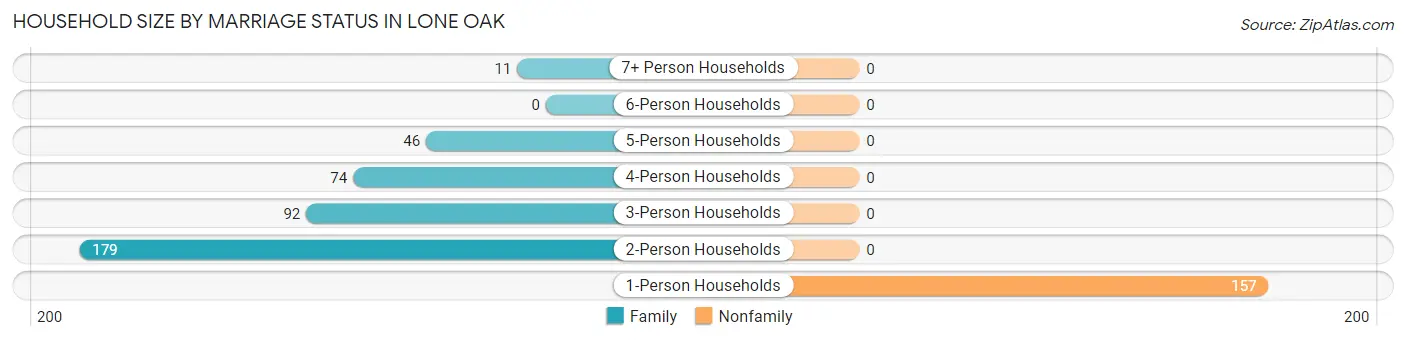
| Household Size | Family Households | Nonfamily Households |
| 1-Person Households | - | 157 (28.1%) |
| 2-Person Households | 179 (32.0%) | 0 (0.0%) |
| 3-Person Households | 92 (16.5%) | 0 (0.0%) |
| 4-Person Households | 74 (13.2%) | 0 (0.0%) |
| 5-Person Households | 46 (8.2%) | 0 (0.0%) |
| 6-Person Households | 0 (0.0%) | 0 (0.0%) |
| 7+ Person Households | 11 (2.0%) | 0 (0.0%) |
| Total | 402 (71.9%) | 157 (28.1%) |
Female Fertility in Lone Oak
Fertility by Age in Lone Oak
Average fertility rate in Lone Oak is 81.0 births per 1,000 women. Women in the age bracket of 20 to 34 years have the highest fertility rate with 198.0 births per 1,000 women. Women in the age bracket of 20 to 34 years acount for 100.0% of all women with births.
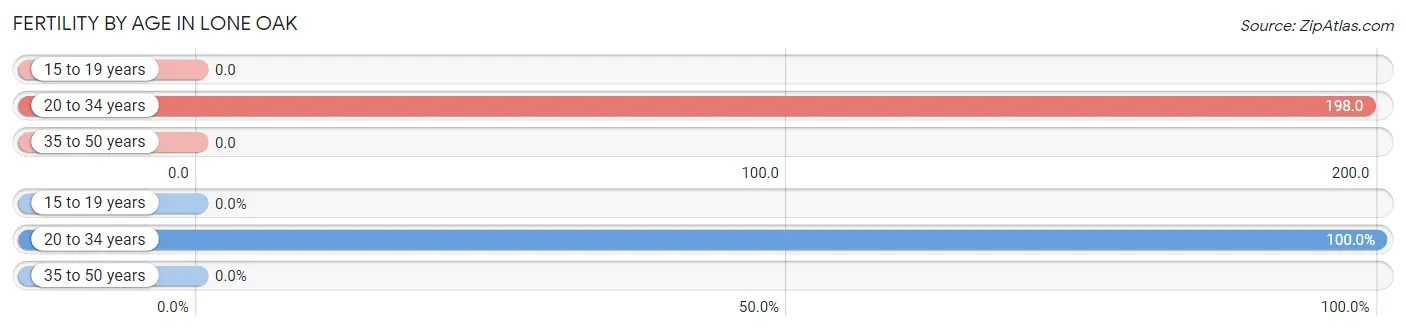
| Age Bracket | Women with Births | Births / 1,000 Women |
| 15 to 19 years | 0 (0.0%) | 0.0 |
| 20 to 34 years | 26 (100.0%) | 198.0 |
| 35 to 50 years | 0 (0.0%) | 0.0 |
| Total | 26 (100.0%) | 81.0 |
Fertility by Age by Marriage Status in Lone Oak
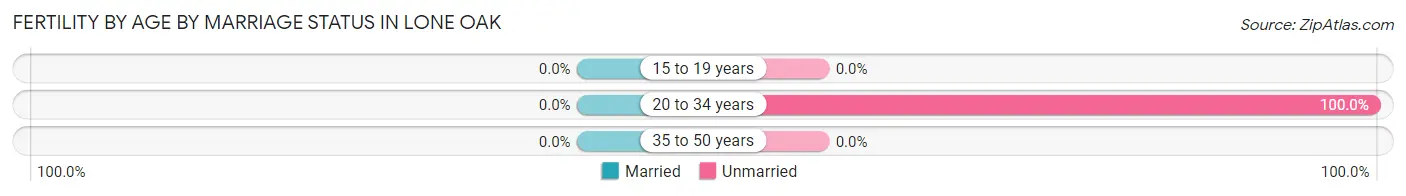
| Age Bracket | Married | Unmarried |
| 15 to 19 years | 0 (0.0%) | 0 (0.0%) |
| 20 to 34 years | 0 (0.0%) | 26 (100.0%) |
| 35 to 50 years | 0 (0.0%) | 0 (0.0%) |
| Total | 0 (0.0%) | 26 (100.0%) |
Fertility by Education in Lone Oak
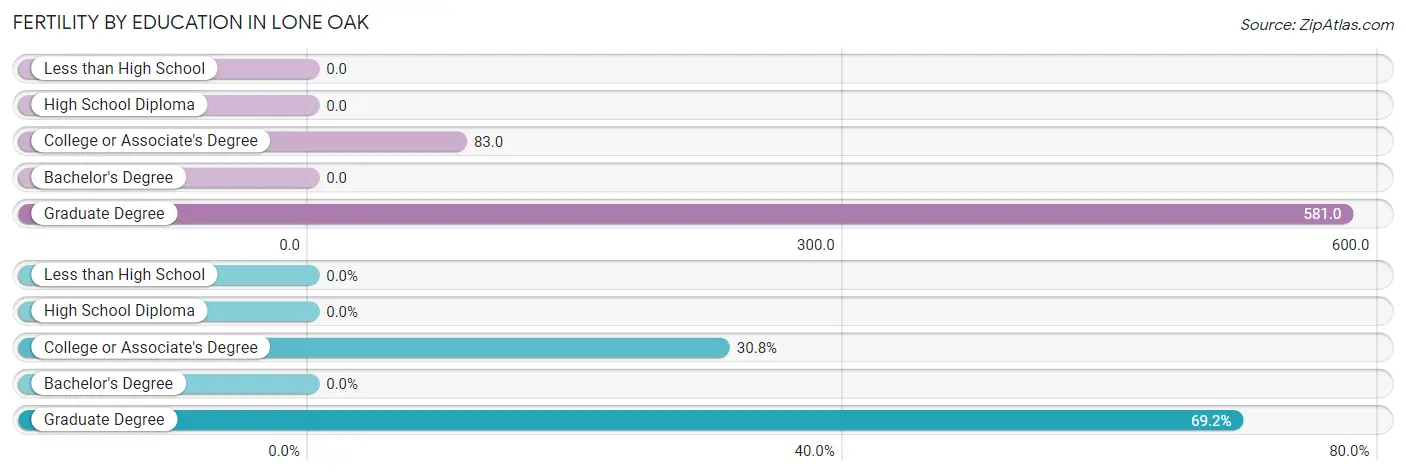
| Educational Attainment | Women with Births | Births / 1,000 Women |
| Less than High School | 0 (0.0%) | 0.0 |
| High School Diploma | 0 (0.0%) | 0.0 |
| College or Associate's Degree | 8 (30.8%) | 83.0 |
| Bachelor's Degree | 0 (0.0%) | 0.0 |
| Graduate Degree | 18 (69.2%) | 581.0 |
| Total | 26 (100.0%) | 81.0 |
Fertility by Education by Marriage Status in Lone Oak
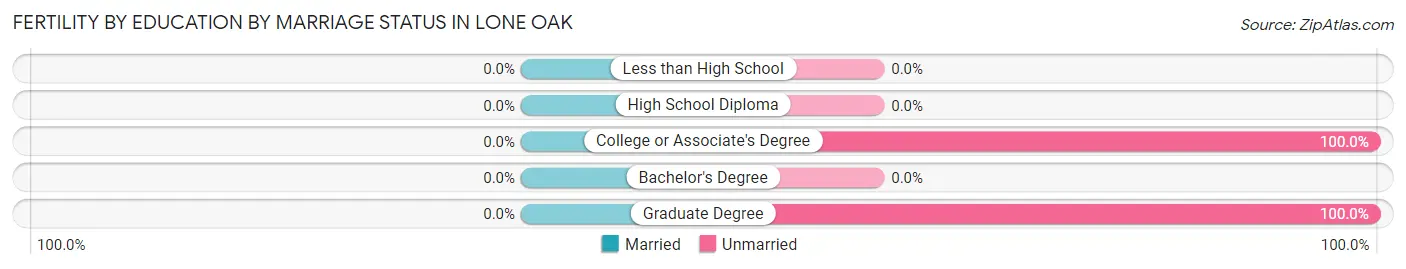
| Educational Attainment | Married | Unmarried |
| Less than High School | 0 (0.0%) | 0 (0.0%) |
| High School Diploma | 0 (0.0%) | 0 (0.0%) |
| College or Associate's Degree | 0 (0.0%) | 8 (100.0%) |
| Bachelor's Degree | 0 (0.0%) | 0 (0.0%) |
| Graduate Degree | 0 (0.0%) | 18 (100.0%) |
| Total | 0 (0.0%) | 26 (100.0%) |
Employment Characteristics in Lone Oak
Employment by Class of Employer in Lone Oak
Among the 625 employed individuals in Lone Oak, private company employees (354 | 56.6%), self-employed (not incorporated) (142 | 22.7%), and not-for-profit organizations (39 | 6.2%) make up the most common classes of employment.
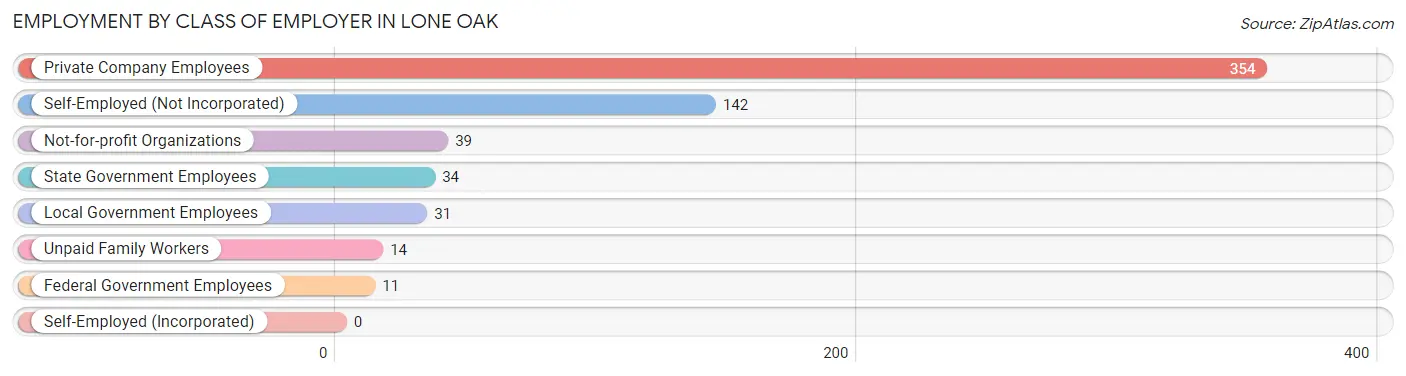
| Employer Class | # Employees | % Employees |
| Private Company Employees | 354 | 56.6% |
| Self-Employed (Incorporated) | 0 | 0.0% |
| Self-Employed (Not Incorporated) | 142 | 22.7% |
| Not-for-profit Organizations | 39 | 6.2% |
| Local Government Employees | 31 | 5.0% |
| State Government Employees | 34 | 5.4% |
| Federal Government Employees | 11 | 1.8% |
| Unpaid Family Workers | 14 | 2.2% |
| Total | 625 | 100.0% |
Employment Status by Age in Lone Oak
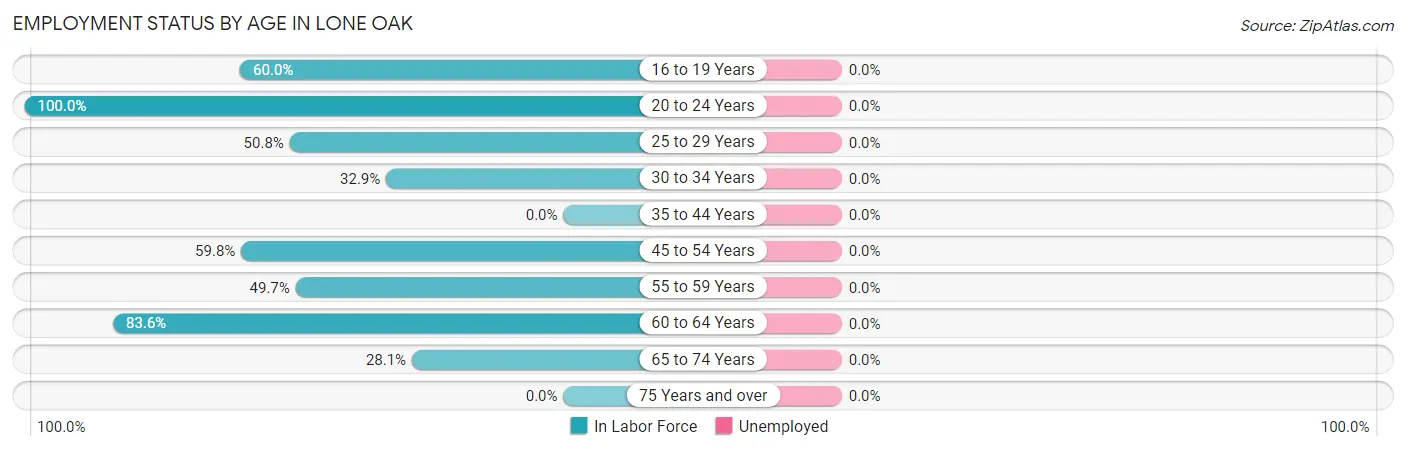
| Age Bracket | In Labor Force | Unemployed |
| 16 to 19 Years | 57 (60.0%) | 0 (0.0%) |
| 20 to 24 Years | 51 (100.0%) | 0 (0.0%) |
| 25 to 29 Years | 65 (50.8%) | 0 (0.0%) |
| 30 to 34 Years | 23 (32.9%) | 0 (0.0%) |
| 35 to 44 Years | 0 (0.0%) | 0 (0.0%) |
| 45 to 54 Years | 192 (59.8%) | 0 (0.0%) |
| 55 to 59 Years | 75 (49.7%) | 0 (0.0%) |
| 60 to 64 Years | 112 (83.6%) | 0 (0.0%) |
| 65 to 74 Years | 50 (28.1%) | 0 (0.0%) |
| 75 Years and over | 0 (0.0%) | 0 (0.0%) |
| Total | 625 (46.0%) | 0 (0.0%) |
Employment Status by Educational Attainment in Lone Oak
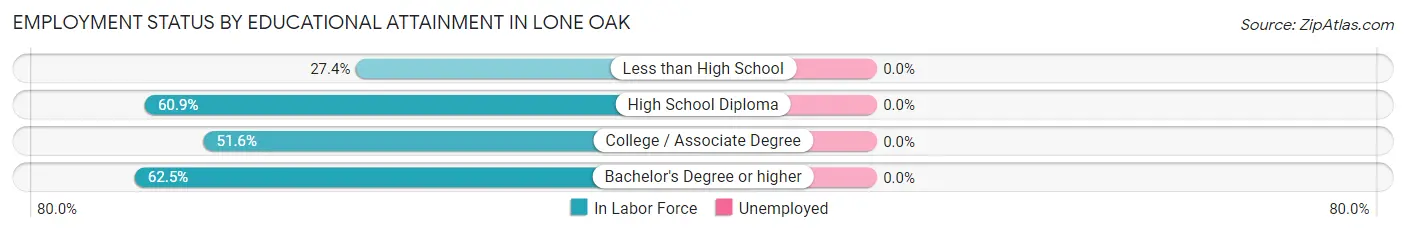
| Educational Attainment | In Labor Force | Unemployed |
| Less than High School | 49 (27.4%) | 0 (0.0%) |
| High School Diploma | 185 (60.9%) | 0 (0.0%) |
| College / Associate Degree | 133 (51.6%) | 0 (0.0%) |
| Bachelor's Degree or higher | 100 (62.5%) | 0 (0.0%) |
| Total | 467 (51.8%) | 0 (0.0%) |
Employment Occupations by Sex in Lone Oak
Management, Business, Science and Arts Occupations
The most common Management, Business, Science and Arts occupations in Lone Oak are Computers, Engineering & Science (60 | 9.6%), Life, Physical & Social Science (34 | 5.4%), Community & Social Service (29 | 4.6%), Computers & Mathematics (26 | 4.2%), and Business & Financial (18 | 2.9%).
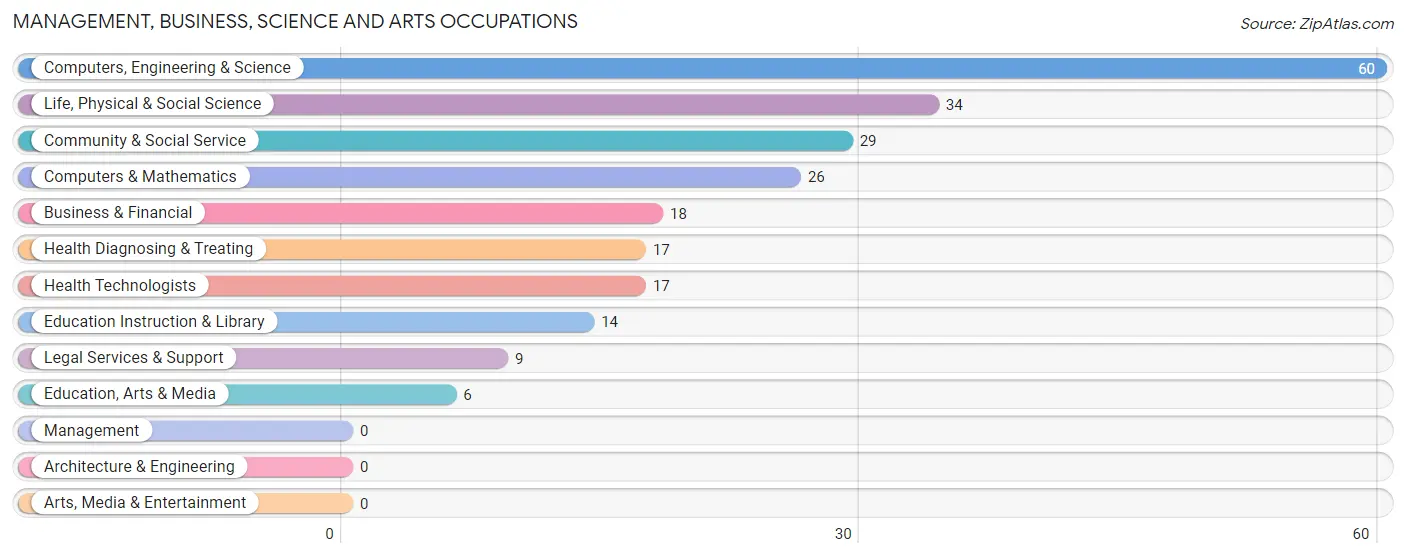
Management, Business, Science and Arts Occupations by Sex
Within the Management, Business, Science and Arts occupations in Lone Oak, the most male-oriented occupations are Business & Financial (100.0%), Computers & Mathematics (100.0%), and Legal Services & Support (100.0%), while the most female-oriented occupations are Education, Arts & Media (100.0%), Education Instruction & Library (100.0%), and Health Diagnosing & Treating (88.2%).
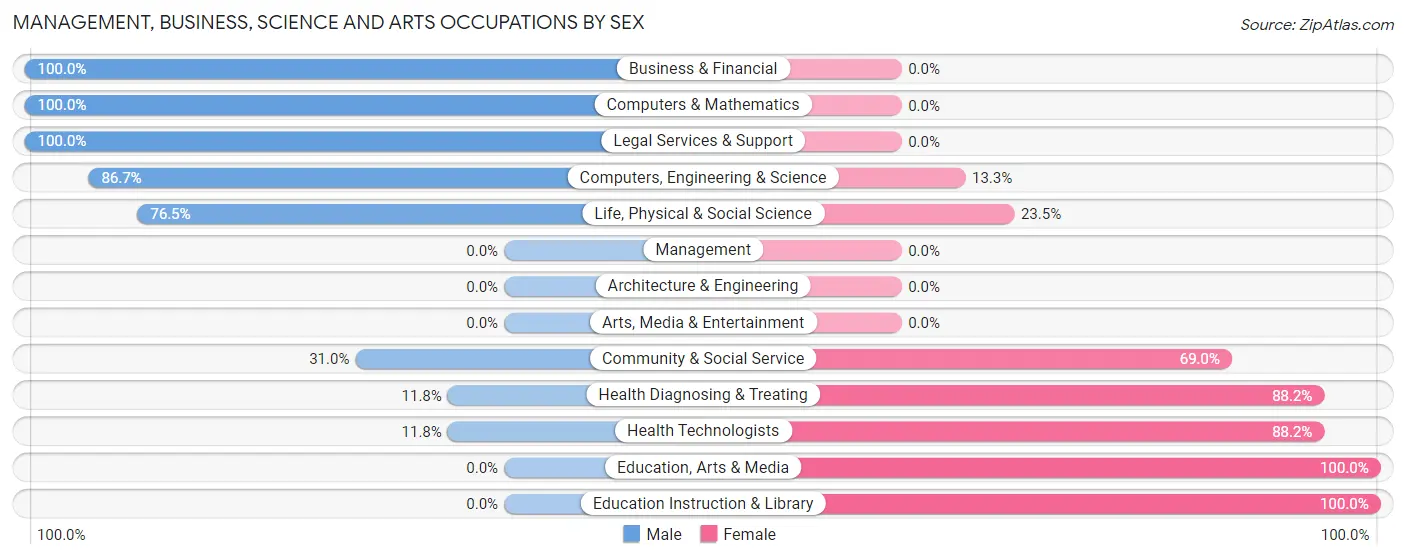
| Occupation | Male | Female |
| Management | 0 (0.0%) | 0 (0.0%) |
| Business & Financial | 18 (100.0%) | 0 (0.0%) |
| Computers, Engineering & Science | 52 (86.7%) | 8 (13.3%) |
| Computers & Mathematics | 26 (100.0%) | 0 (0.0%) |
| Architecture & Engineering | 0 (0.0%) | 0 (0.0%) |
| Life, Physical & Social Science | 26 (76.5%) | 8 (23.5%) |
| Community & Social Service | 9 (31.0%) | 20 (69.0%) |
| Education, Arts & Media | 0 (0.0%) | 6 (100.0%) |
| Legal Services & Support | 9 (100.0%) | 0 (0.0%) |
| Education Instruction & Library | 0 (0.0%) | 14 (100.0%) |
| Arts, Media & Entertainment | 0 (0.0%) | 0 (0.0%) |
| Health Diagnosing & Treating | 2 (11.8%) | 15 (88.2%) |
| Health Technologists | 2 (11.8%) | 15 (88.2%) |
| Total (Category) | 81 (65.3%) | 43 (34.7%) |
| Total (Overall) | 314 (50.2%) | 311 (49.8%) |
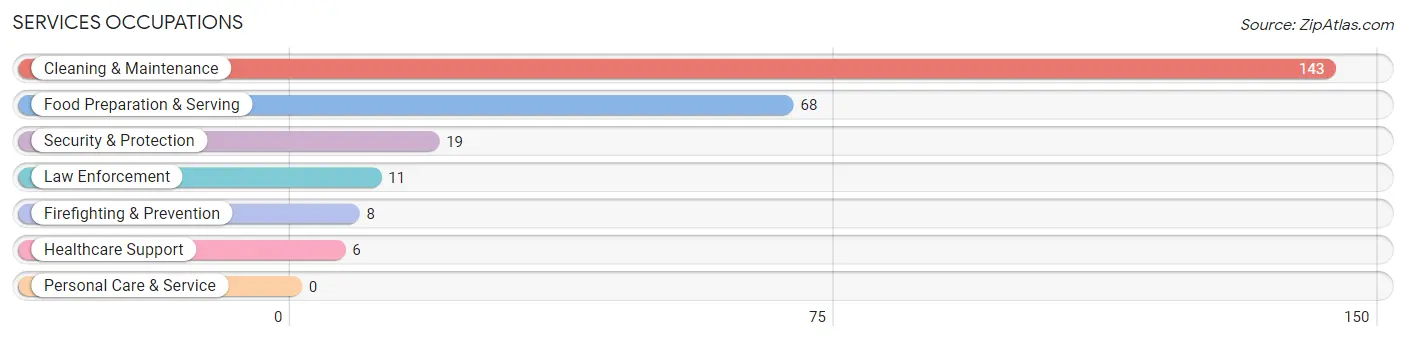
Services Occupations
The most common Services occupations in Lone Oak are Cleaning & Maintenance (143 | 22.9%), Food Preparation & Serving (68 | 10.9%), Security & Protection (19 | 3.0%), Law Enforcement (11 | 1.8%), and Firefighting & Prevention (8 | 1.3%).
Services Occupations by Sex
Within the Services occupations in Lone Oak, the most male-oriented occupations are Firefighting & Prevention (100.0%), Security & Protection (42.1%), and Cleaning & Maintenance (30.8%), while the most female-oriented occupations are Healthcare Support (100.0%), Law Enforcement (100.0%), and Food Preparation & Serving (80.9%).
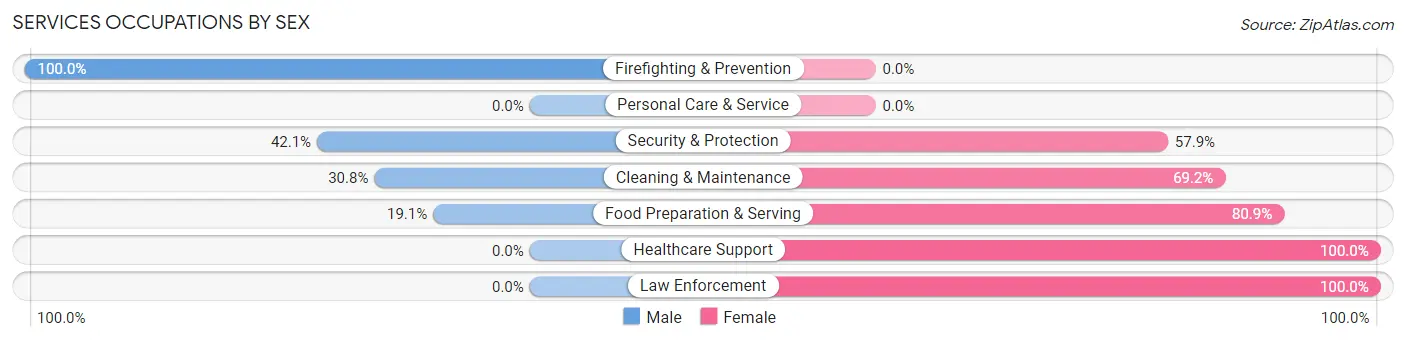
| Occupation | Male | Female |
| Healthcare Support | 0 (0.0%) | 6 (100.0%) |
| Security & Protection | 8 (42.1%) | 11 (57.9%) |
| Firefighting & Prevention | 8 (100.0%) | 0 (0.0%) |
| Law Enforcement | 0 (0.0%) | 11 (100.0%) |
| Food Preparation & Serving | 13 (19.1%) | 55 (80.9%) |
| Cleaning & Maintenance | 44 (30.8%) | 99 (69.2%) |
| Personal Care & Service | 0 (0.0%) | 0 (0.0%) |
| Total (Category) | 65 (27.5%) | 171 (72.5%) |
| Total (Overall) | 314 (50.2%) | 311 (49.8%) |
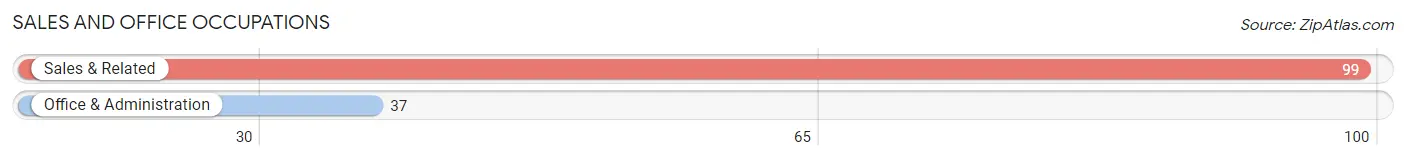
Sales and Office Occupations
The most common Sales and Office occupations in Lone Oak are Sales & Related (99 | 15.8%), and Office & Administration (37 | 5.9%).
Sales and Office Occupations by Sex
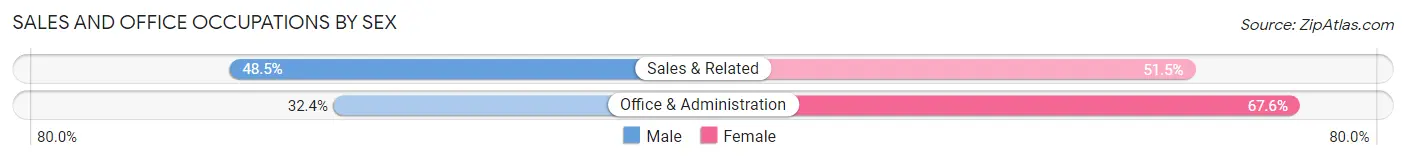
| Occupation | Male | Female |
| Sales & Related | 48 (48.5%) | 51 (51.5%) |
| Office & Administration | 12 (32.4%) | 25 (67.6%) |
| Total (Category) | 60 (44.1%) | 76 (55.9%) |
| Total (Overall) | 314 (50.2%) | 311 (49.8%) |
Natural Resources, Construction and Maintenance Occupations
The most common Natural Resources, Construction and Maintenance occupations in Lone Oak are Construction & Extraction (39 | 6.2%), and Installation, Maintenance & Repair (10 | 1.6%).
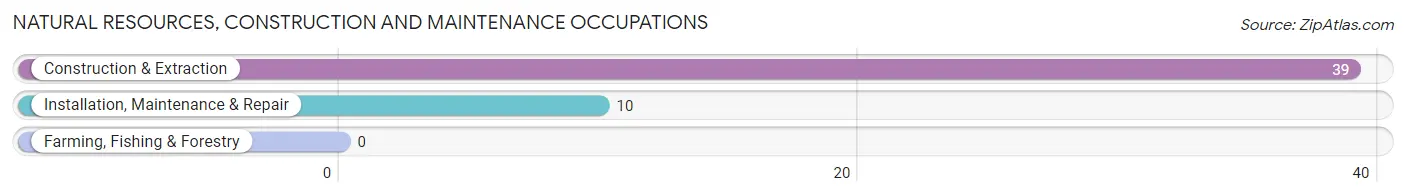
Natural Resources, Construction and Maintenance Occupations by Sex
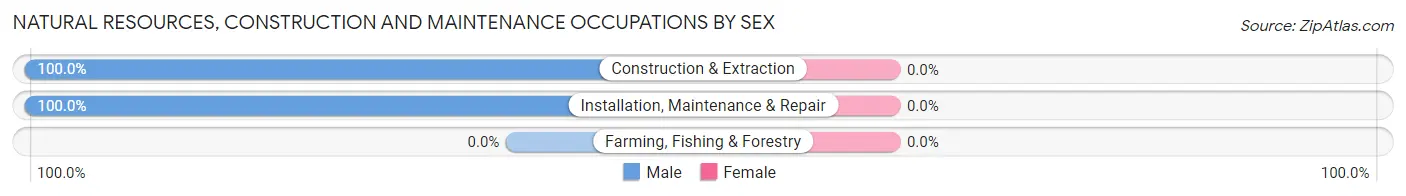
| Occupation | Male | Female |
| Farming, Fishing & Forestry | 0 (0.0%) | 0 (0.0%) |
| Construction & Extraction | 39 (100.0%) | 0 (0.0%) |
| Installation, Maintenance & Repair | 10 (100.0%) | 0 (0.0%) |
| Total (Category) | 49 (100.0%) | 0 (0.0%) |
| Total (Overall) | 314 (50.2%) | 311 (49.8%) |
Production, Transportation and Moving Occupations
The most common Production, Transportation and Moving occupations in Lone Oak are Material Moving (51 | 8.2%), Production (17 | 2.7%), and Transportation (12 | 1.9%).
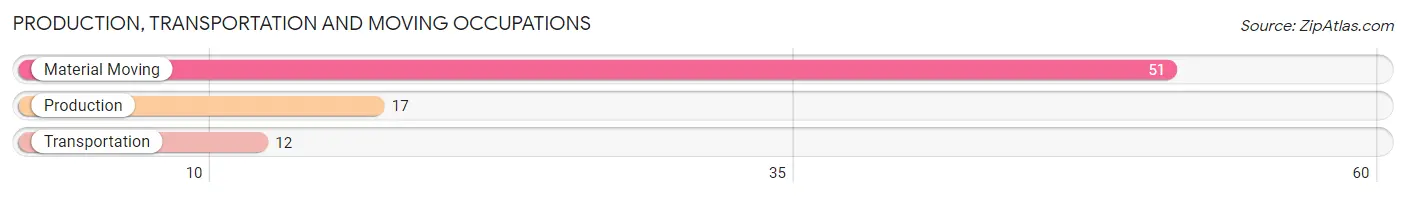
Production, Transportation and Moving Occupations by Sex
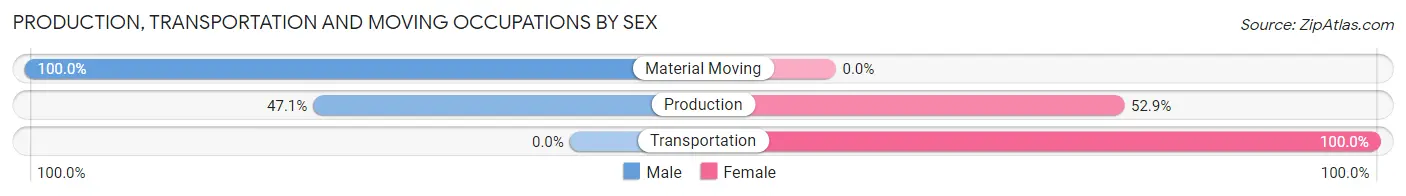
| Occupation | Male | Female |
| Production | 8 (47.1%) | 9 (52.9%) |
| Transportation | 0 (0.0%) | 12 (100.0%) |
| Material Moving | 51 (100.0%) | 0 (0.0%) |
| Total (Category) | 59 (73.8%) | 21 (26.3%) |
| Total (Overall) | 314 (50.2%) | 311 (49.8%) |
Employment Industries by Sex in Lone Oak
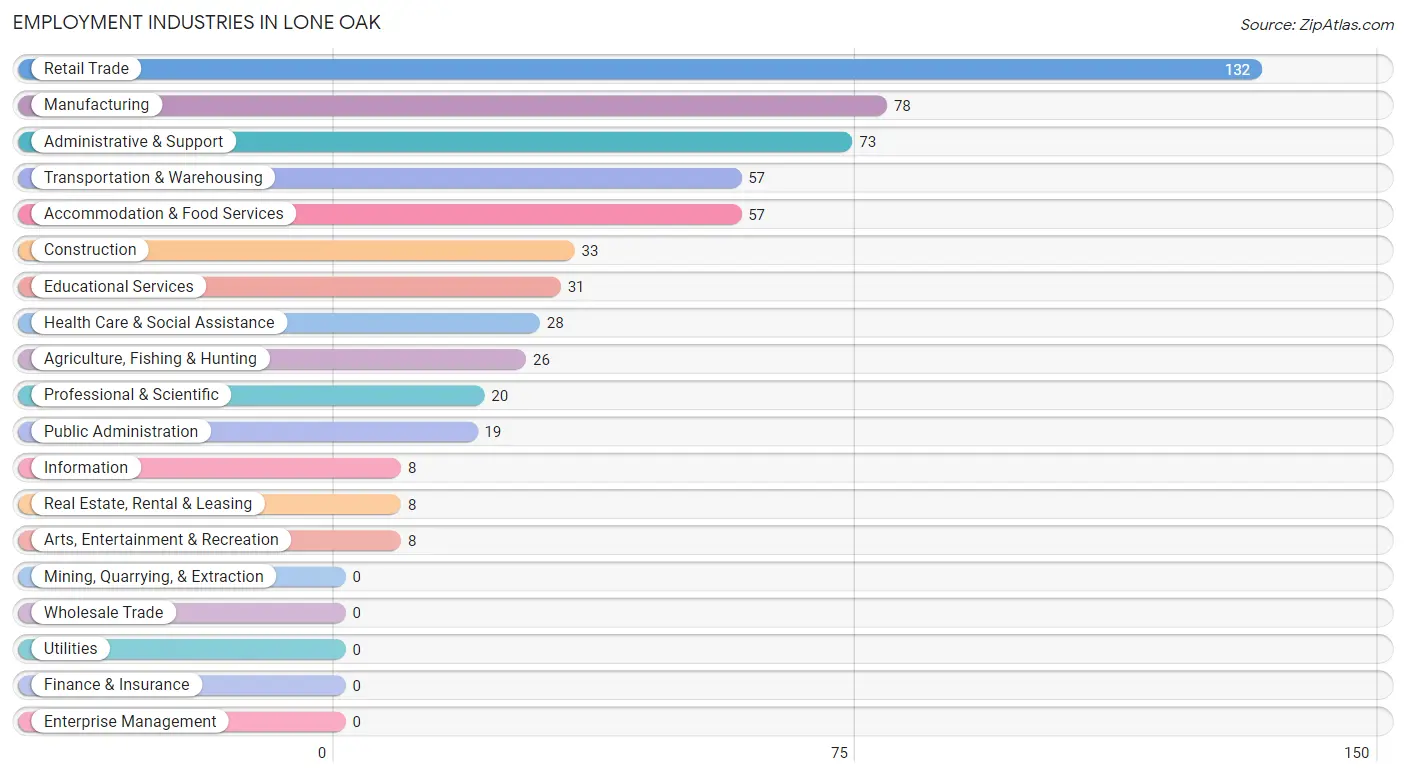
Employment Industries in Lone Oak
The major employment industries in Lone Oak include Retail Trade (132 | 21.1%), Manufacturing (78 | 12.5%), Administrative & Support (73 | 11.7%), Transportation & Warehousing (57 | 9.1%), and Accommodation & Food Services (57 | 9.1%).
Employment Industries by Sex in Lone Oak
The Lone Oak industries that see more men than women are Agriculture, Fishing & Hunting (100.0%), Construction (100.0%), and Transportation & Warehousing (100.0%), whereas the industries that tend to have a higher number of women are Educational Services (100.0%), Arts, Entertainment & Recreation (100.0%), and Public Administration (100.0%).
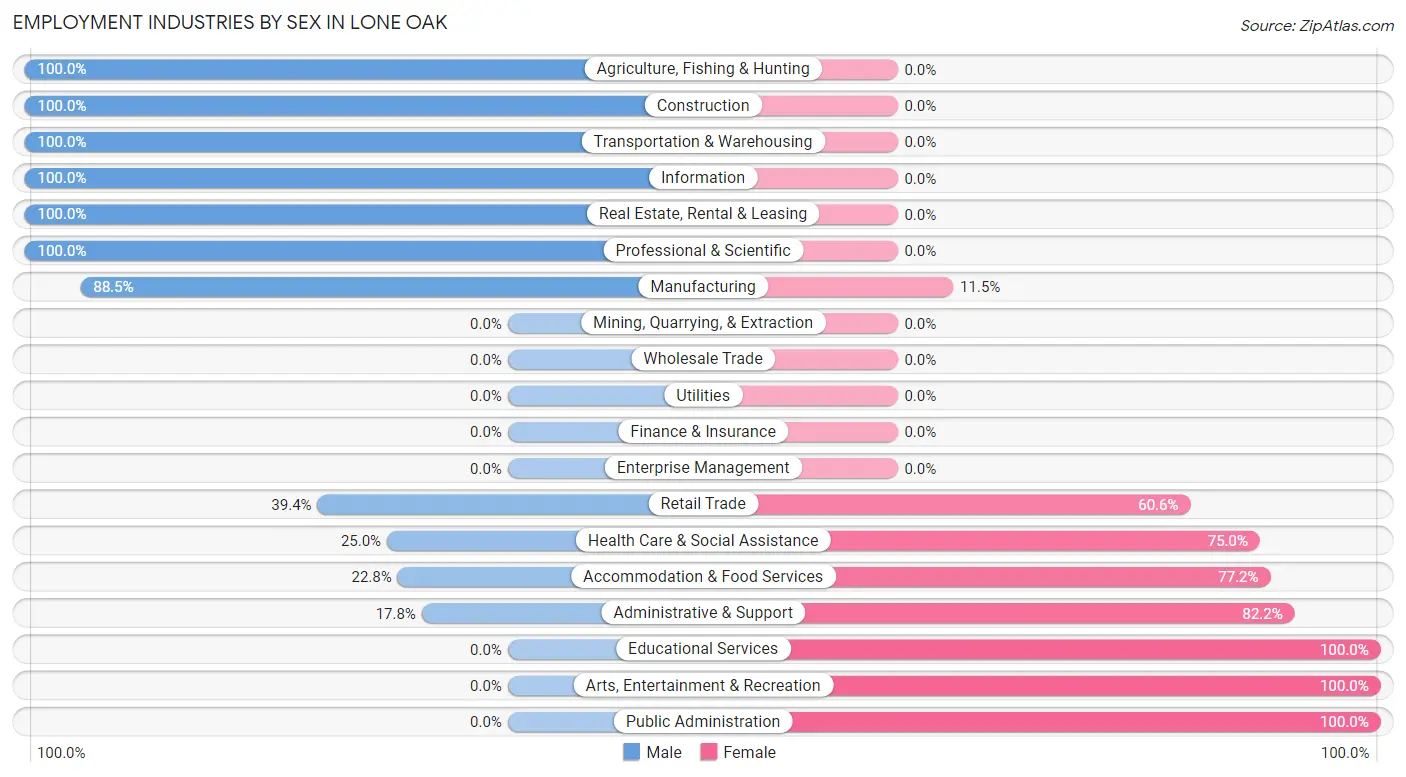
| Industry | Male | Female |
| Agriculture, Fishing & Hunting | 26 (100.0%) | 0 (0.0%) |
| Mining, Quarrying, & Extraction | 0 (0.0%) | 0 (0.0%) |
| Construction | 33 (100.0%) | 0 (0.0%) |
| Manufacturing | 69 (88.5%) | 9 (11.5%) |
| Wholesale Trade | 0 (0.0%) | 0 (0.0%) |
| Retail Trade | 52 (39.4%) | 80 (60.6%) |
| Transportation & Warehousing | 57 (100.0%) | 0 (0.0%) |
| Utilities | 0 (0.0%) | 0 (0.0%) |
| Information | 8 (100.0%) | 0 (0.0%) |
| Finance & Insurance | 0 (0.0%) | 0 (0.0%) |
| Real Estate, Rental & Leasing | 8 (100.0%) | 0 (0.0%) |
| Professional & Scientific | 20 (100.0%) | 0 (0.0%) |
| Enterprise Management | 0 (0.0%) | 0 (0.0%) |
| Administrative & Support | 13 (17.8%) | 60 (82.2%) |
| Educational Services | 0 (0.0%) | 31 (100.0%) |
| Health Care & Social Assistance | 7 (25.0%) | 21 (75.0%) |
| Arts, Entertainment & Recreation | 0 (0.0%) | 8 (100.0%) |
| Accommodation & Food Services | 13 (22.8%) | 44 (77.2%) |
| Public Administration | 0 (0.0%) | 19 (100.0%) |
| Total | 314 (50.2%) | 311 (49.8%) |
Education in Lone Oak
School Enrollment in Lone Oak
The most common levels of schooling among the 216 students in Lone Oak are high school (105 | 48.6%), elementary school (40 | 18.5%), and college / undergraduate (33 | 15.3%).
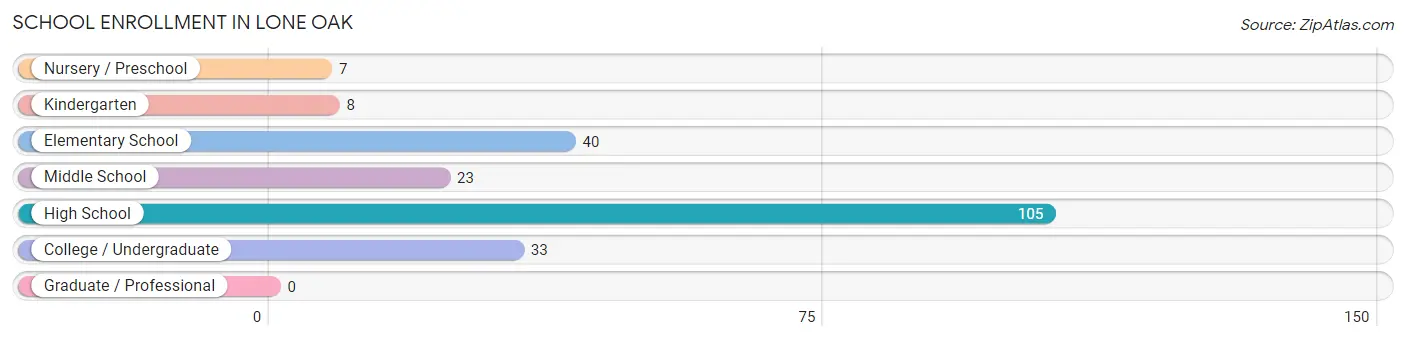
| School Level | # Students | % Students |
| Nursery / Preschool | 7 | 3.2% |
| Kindergarten | 8 | 3.7% |
| Elementary School | 40 | 18.5% |
| Middle School | 23 | 10.6% |
| High School | 105 | 48.6% |
| College / Undergraduate | 33 | 15.3% |
| Graduate / Professional | 0 | 0.0% |
| Total | 216 | 100.0% |
School Enrollment by Age by Funding Source in Lone Oak
Out of a total of 216 students who are enrolled in schools in Lone Oak, 56 (25.9%) attend a private institution, while the remaining 160 (74.1%) are enrolled in public schools. The age group of 15 to 17 year olds has the highest likelihood of being enrolled in private schools, with 44 (52.4% in the age bracket) enrolled. Conversely, the age group of 3 to 4 year olds has the lowest likelihood of being enrolled in a private school, with 7 (100.0% in the age bracket) attending a public institution.
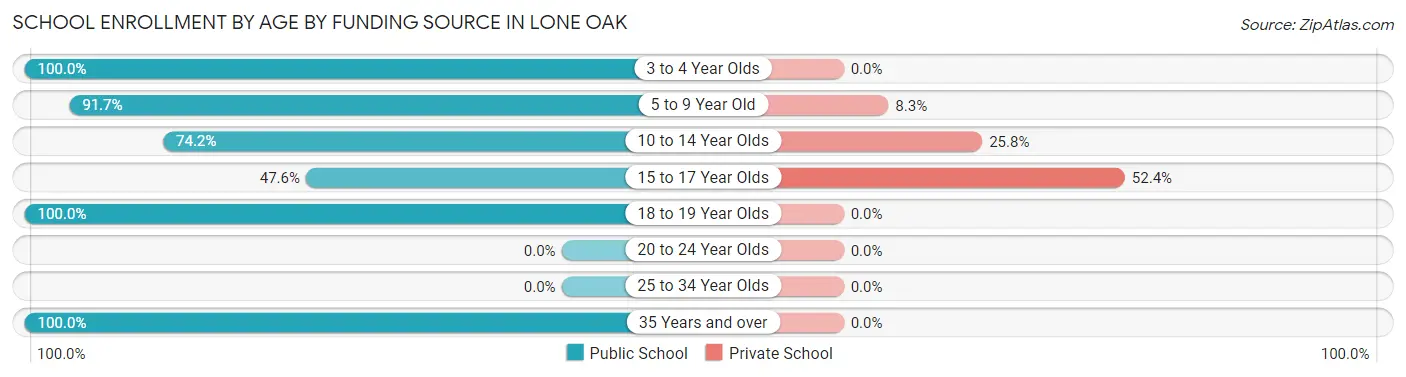
| Age Bracket | Public School | Private School |
| 3 to 4 Year Olds | 7 (100.0%) | 0 (0.0%) |
| 5 to 9 Year Old | 44 (91.7%) | 4 (8.3%) |
| 10 to 14 Year Olds | 23 (74.2%) | 8 (25.8%) |
| 15 to 17 Year Olds | 40 (47.6%) | 44 (52.4%) |
| 18 to 19 Year Olds | 34 (100.0%) | 0 (0.0%) |
| 20 to 24 Year Olds | 0 (0.0%) | 0 (0.0%) |
| 25 to 34 Year Olds | 0 (0.0%) | 0 (0.0%) |
| 35 Years and over | 12 (100.0%) | 0 (0.0%) |
| Total | 160 (74.1%) | 56 (25.9%) |
Educational Attainment by Field of Study in Lone Oak
Education (75 | 32.5%), bio, nature & agricultural (36 | 15.6%), psychology (36 | 15.6%), arts & humanities (23 | 10.0%), and engineering (19 | 8.2%) are the most common fields of study among 231 individuals in Lone Oak who have obtained a bachelor's degree or higher.
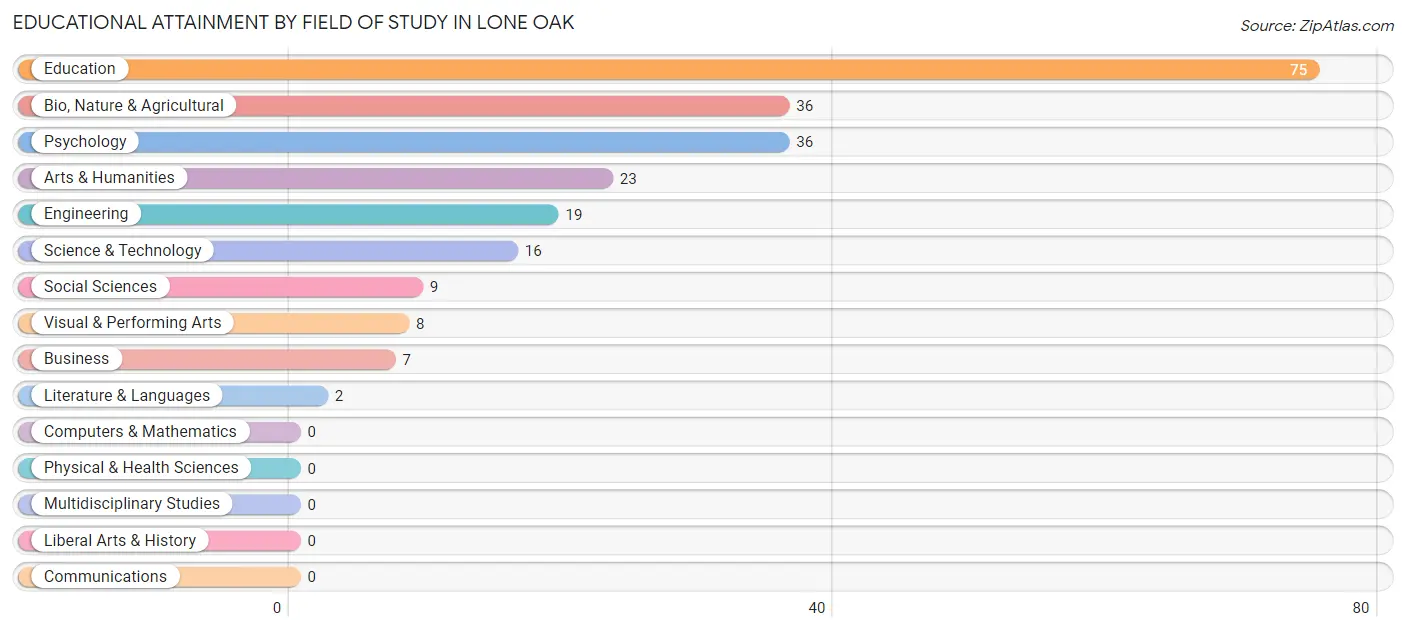
| Field of Study | # Graduates | % Graduates |
| Computers & Mathematics | 0 | 0.0% |
| Bio, Nature & Agricultural | 36 | 15.6% |
| Physical & Health Sciences | 0 | 0.0% |
| Psychology | 36 | 15.6% |
| Social Sciences | 9 | 3.9% |
| Engineering | 19 | 8.2% |
| Multidisciplinary Studies | 0 | 0.0% |
| Science & Technology | 16 | 6.9% |
| Business | 7 | 3.0% |
| Education | 75 | 32.5% |
| Literature & Languages | 2 | 0.9% |
| Liberal Arts & History | 0 | 0.0% |
| Visual & Performing Arts | 8 | 3.5% |
| Communications | 0 | 0.0% |
| Arts & Humanities | 23 | 10.0% |
| Total | 231 | 100.0% |
Transportation & Commute in Lone Oak
Vehicle Availability by Sex in Lone Oak
The most prevalent vehicle ownership categories in Lone Oak are males with 2 vehicles (120, accounting for 38.2%) and females with 2 vehicles (50, making up 38.6%).
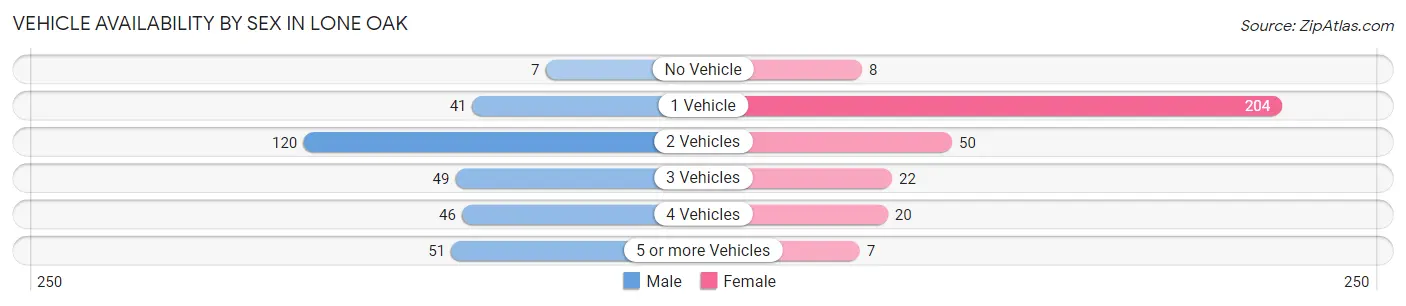
| Vehicles Available | Male | Female |
| No Vehicle | 7 (2.2%) | 8 (2.6%) |
| 1 Vehicle | 41 (13.1%) | 204 (65.6%) |
| 2 Vehicles | 120 (38.2%) | 50 (16.1%) |
| 3 Vehicles | 49 (15.6%) | 22 (7.1%) |
| 4 Vehicles | 46 (14.6%) | 20 (6.4%) |
| 5 or more Vehicles | 51 (16.2%) | 7 (2.2%) |
| Total | 314 (100.0%) | 311 (100.0%) |
Commute Time in Lone Oak
The most frequently occuring commute durations in Lone Oak are 30 to 34 minutes (161 commuters, 28.6%), 45 to 59 minutes (118 commuters, 21.0%), and 35 to 39 minutes (53 commuters, 9.4%).
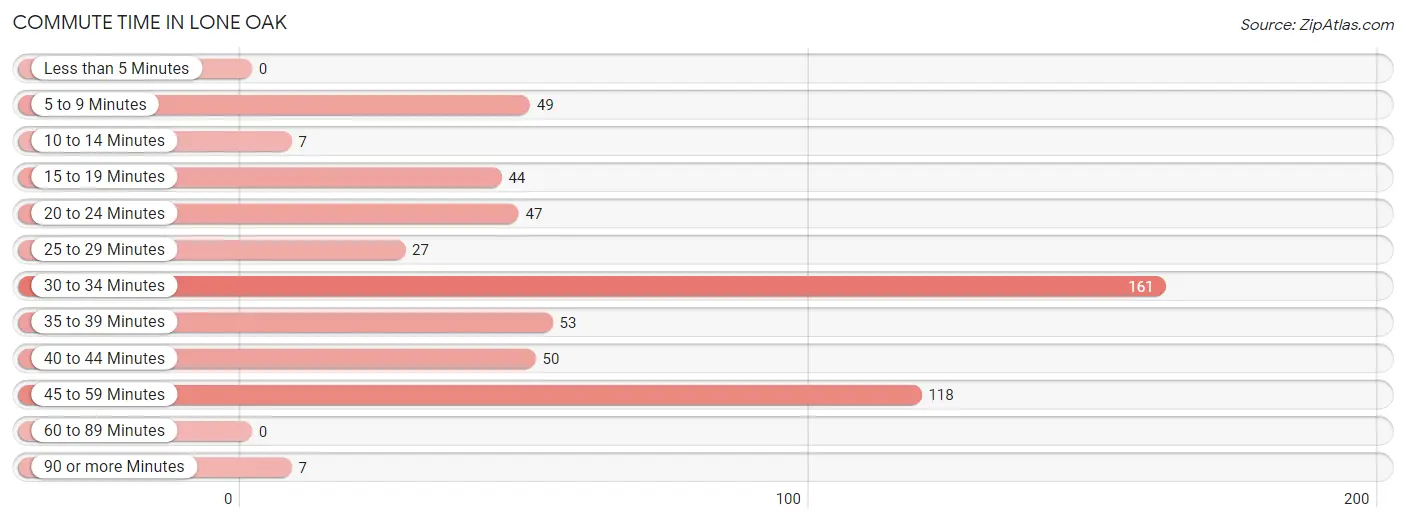
| Commute Time | # Commuters | % Commuters |
| Less than 5 Minutes | 0 | 0.0% |
| 5 to 9 Minutes | 49 | 8.7% |
| 10 to 14 Minutes | 7 | 1.2% |
| 15 to 19 Minutes | 44 | 7.8% |
| 20 to 24 Minutes | 47 | 8.4% |
| 25 to 29 Minutes | 27 | 4.8% |
| 30 to 34 Minutes | 161 | 28.6% |
| 35 to 39 Minutes | 53 | 9.4% |
| 40 to 44 Minutes | 50 | 8.9% |
| 45 to 59 Minutes | 118 | 21.0% |
| 60 to 89 Minutes | 0 | 0.0% |
| 90 or more Minutes | 7 | 1.2% |
Commute Time by Sex in Lone Oak
The most common commute times in Lone Oak are 45 to 59 minutes (118 commuters, 44.9%) for males and 30 to 34 minutes (129 commuters, 43.0%) for females.
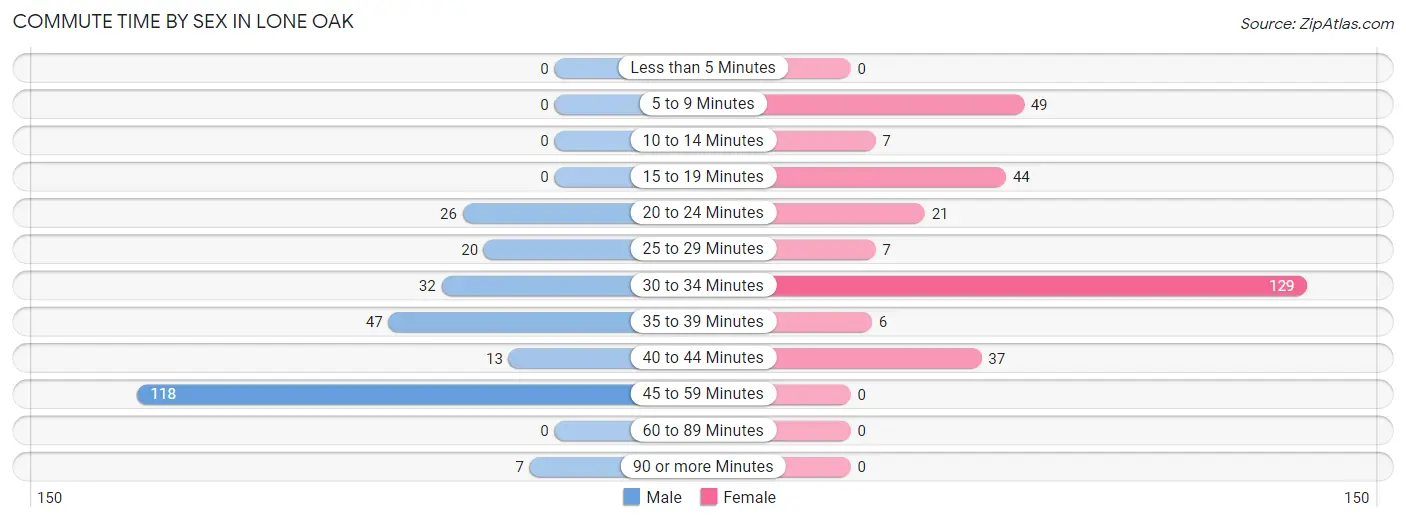
| Commute Time | Male | Female |
| Less than 5 Minutes | 0 (0.0%) | 0 (0.0%) |
| 5 to 9 Minutes | 0 (0.0%) | 49 (16.3%) |
| 10 to 14 Minutes | 0 (0.0%) | 7 (2.3%) |
| 15 to 19 Minutes | 0 (0.0%) | 44 (14.7%) |
| 20 to 24 Minutes | 26 (9.9%) | 21 (7.0%) |
| 25 to 29 Minutes | 20 (7.6%) | 7 (2.3%) |
| 30 to 34 Minutes | 32 (12.2%) | 129 (43.0%) |
| 35 to 39 Minutes | 47 (17.9%) | 6 (2.0%) |
| 40 to 44 Minutes | 13 (4.9%) | 37 (12.3%) |
| 45 to 59 Minutes | 118 (44.9%) | 0 (0.0%) |
| 60 to 89 Minutes | 0 (0.0%) | 0 (0.0%) |
| 90 or more Minutes | 7 (2.7%) | 0 (0.0%) |
Time of Departure to Work by Sex in Lone Oak
The most frequent times of departure to work in Lone Oak are 6:00 AM to 6:29 AM (104, 39.5%) for males and 9:00 AM to 9:59 AM (126, 42.0%) for females.
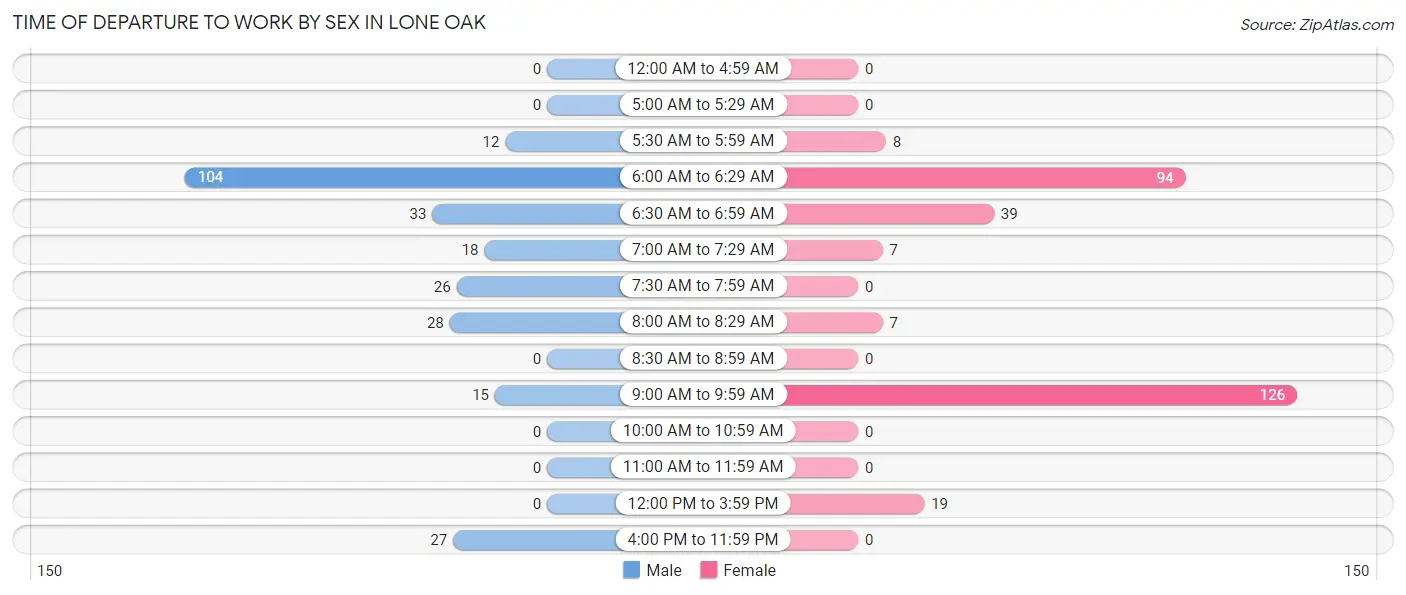
| Time of Departure | Male | Female |
| 12:00 AM to 4:59 AM | 0 (0.0%) | 0 (0.0%) |
| 5:00 AM to 5:29 AM | 0 (0.0%) | 0 (0.0%) |
| 5:30 AM to 5:59 AM | 12 (4.6%) | 8 (2.7%) |
| 6:00 AM to 6:29 AM | 104 (39.5%) | 94 (31.3%) |
| 6:30 AM to 6:59 AM | 33 (12.6%) | 39 (13.0%) |
| 7:00 AM to 7:29 AM | 18 (6.8%) | 7 (2.3%) |
| 7:30 AM to 7:59 AM | 26 (9.9%) | 0 (0.0%) |
| 8:00 AM to 8:29 AM | 28 (10.6%) | 7 (2.3%) |
| 8:30 AM to 8:59 AM | 0 (0.0%) | 0 (0.0%) |
| 9:00 AM to 9:59 AM | 15 (5.7%) | 126 (42.0%) |
| 10:00 AM to 10:59 AM | 0 (0.0%) | 0 (0.0%) |
| 11:00 AM to 11:59 AM | 0 (0.0%) | 0 (0.0%) |
| 12:00 PM to 3:59 PM | 0 (0.0%) | 19 (6.3%) |
| 4:00 PM to 11:59 PM | 27 (10.3%) | 0 (0.0%) |
| Total | 263 (100.0%) | 300 (100.0%) |
Housing Occupancy in Lone Oak
Occupancy by Ownership in Lone Oak
Of the total 559 dwellings in Lone Oak, owner-occupied units account for 385 (68.9%), while renter-occupied units make up 174 (31.1%).
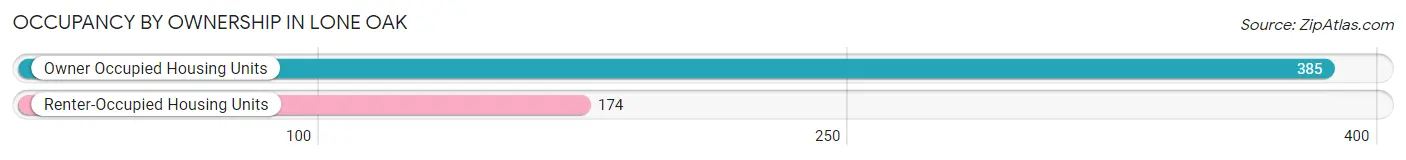
| Occupancy | # Housing Units | % Housing Units |
| Owner Occupied Housing Units | 385 | 68.9% |
| Renter-Occupied Housing Units | 174 | 31.1% |
| Total Occupied Housing Units | 559 | 100.0% |
Occupancy by Household Size in Lone Oak
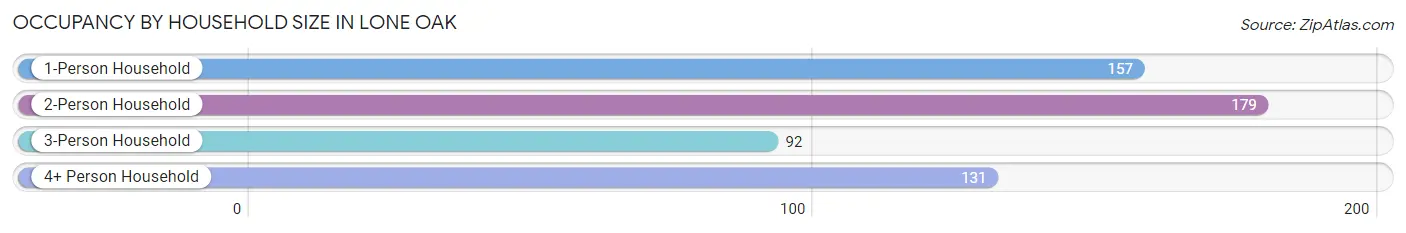
| Household Size | # Housing Units | % Housing Units |
| 1-Person Household | 157 | 28.1% |
| 2-Person Household | 179 | 32.0% |
| 3-Person Household | 92 | 16.5% |
| 4+ Person Household | 131 | 23.4% |
| Total Housing Units | 559 | 100.0% |
Occupancy by Ownership by Household Size in Lone Oak
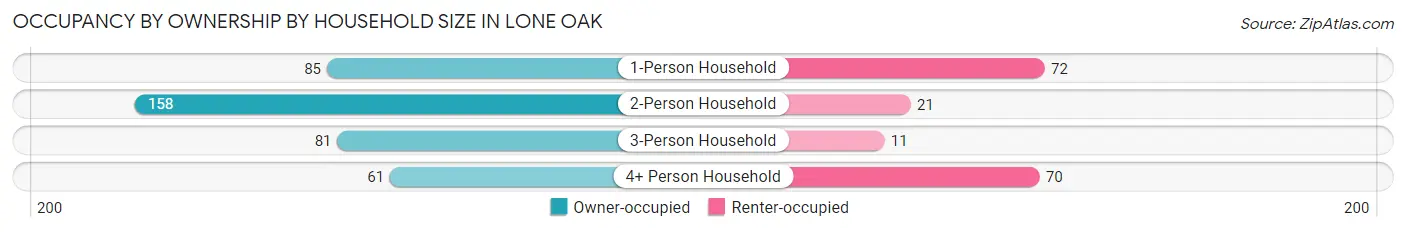
| Household Size | Owner-occupied | Renter-occupied |
| 1-Person Household | 85 (54.1%) | 72 (45.9%) |
| 2-Person Household | 158 (88.3%) | 21 (11.7%) |
| 3-Person Household | 81 (88.0%) | 11 (12.0%) |
| 4+ Person Household | 61 (46.6%) | 70 (53.4%) |
| Total Housing Units | 385 (68.9%) | 174 (31.1%) |
Occupancy by Educational Attainment in Lone Oak
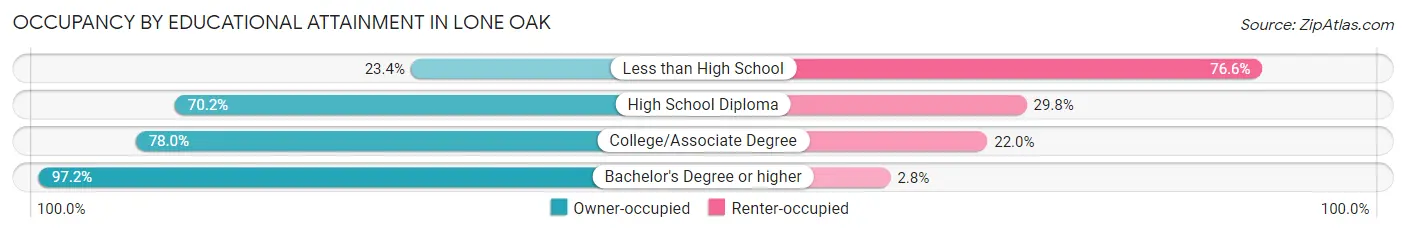
| Household Size | Owner-occupied | Renter-occupied |
| Less than High School | 30 (23.4%) | 98 (76.6%) |
| High School Diploma | 73 (70.2%) | 31 (29.8%) |
| College/Associate Degree | 145 (78.0%) | 41 (22.0%) |
| Bachelor's Degree or higher | 137 (97.2%) | 4 (2.8%) |
Occupancy by Age of Householder in Lone Oak
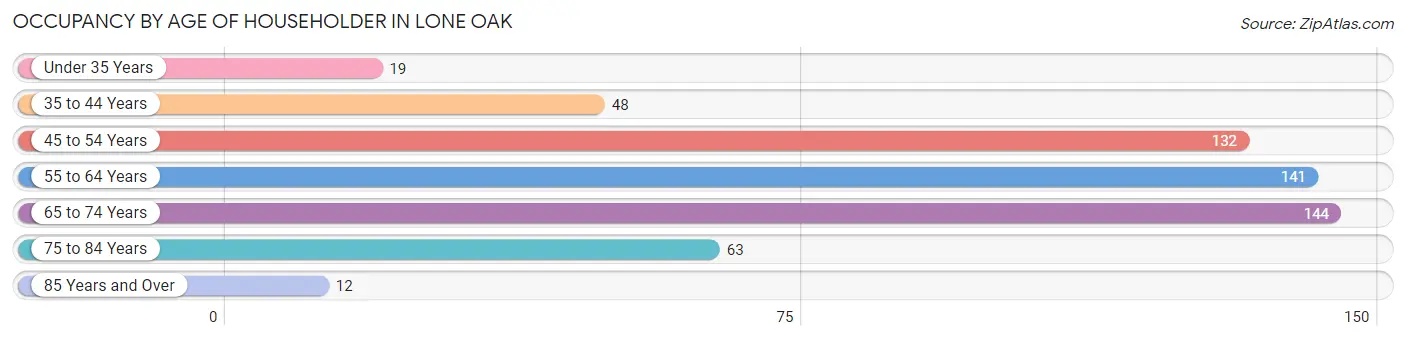
| Age Bracket | # Households | % Households |
| Under 35 Years | 19 | 3.4% |
| 35 to 44 Years | 48 | 8.6% |
| 45 to 54 Years | 132 | 23.6% |
| 55 to 64 Years | 141 | 25.2% |
| 65 to 74 Years | 144 | 25.8% |
| 75 to 84 Years | 63 | 11.3% |
| 85 Years and Over | 12 | 2.1% |
| Total | 559 | 100.0% |
Housing Finances in Lone Oak
Median Income by Occupancy in Lone Oak
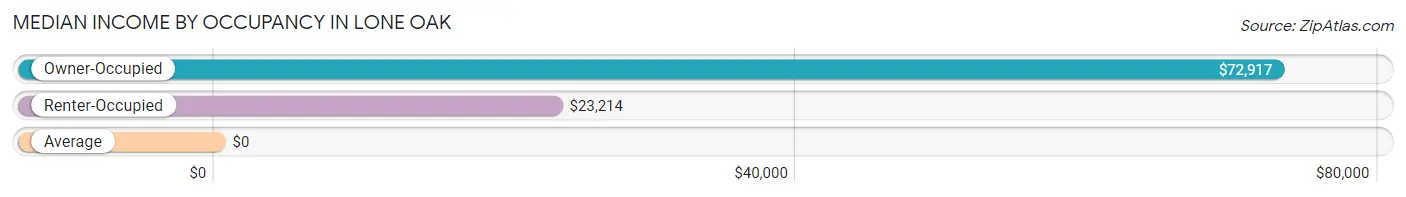
| Occupancy Type | # Households | Median Income |
| Owner-Occupied | 385 (68.9%) | $72,917 |
| Renter-Occupied | 174 (31.1%) | $23,214 |
| Average | 559 (100.0%) | $0 |
Occupancy by Householder Income Bracket in Lone Oak
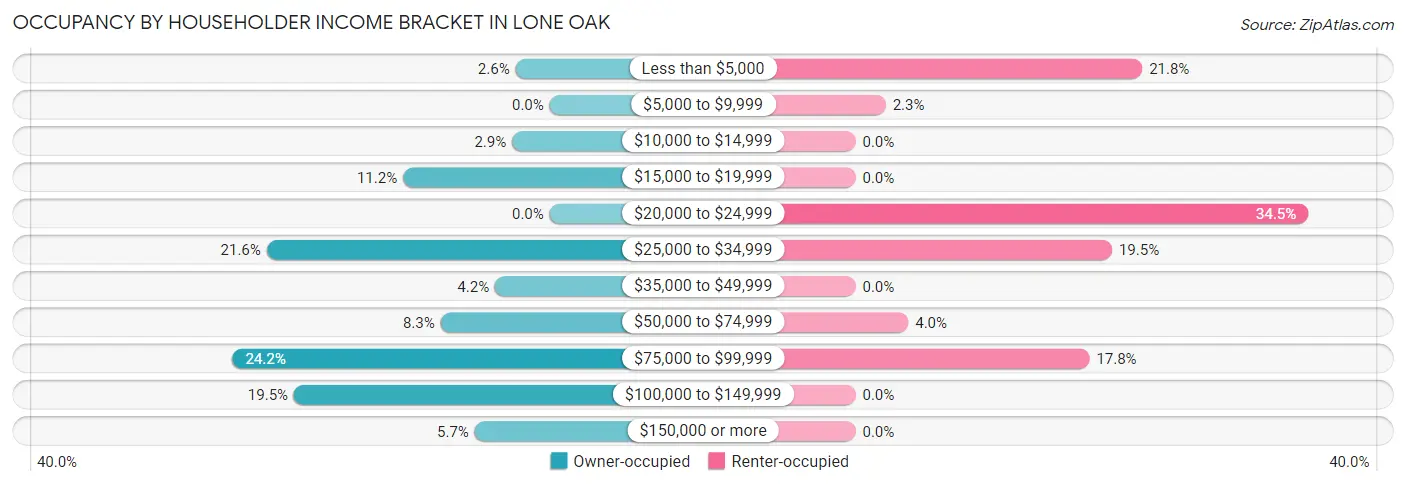
| Income Bracket | Owner-occupied | Renter-occupied |
| Less than $5,000 | 10 (2.6%) | 38 (21.8%) |
| $5,000 to $9,999 | 0 (0.0%) | 4 (2.3%) |
| $10,000 to $14,999 | 11 (2.9%) | 0 (0.0%) |
| $15,000 to $19,999 | 43 (11.2%) | 0 (0.0%) |
| $20,000 to $24,999 | 0 (0.0%) | 60 (34.5%) |
| $25,000 to $34,999 | 83 (21.6%) | 34 (19.5%) |
| $35,000 to $49,999 | 16 (4.2%) | 0 (0.0%) |
| $50,000 to $74,999 | 32 (8.3%) | 7 (4.0%) |
| $75,000 to $99,999 | 93 (24.2%) | 31 (17.8%) |
| $100,000 to $149,999 | 75 (19.5%) | 0 (0.0%) |
| $150,000 or more | 22 (5.7%) | 0 (0.0%) |
| Total | 385 (100.0%) | 174 (100.0%) |
Monthly Housing Cost Tiers in Lone Oak
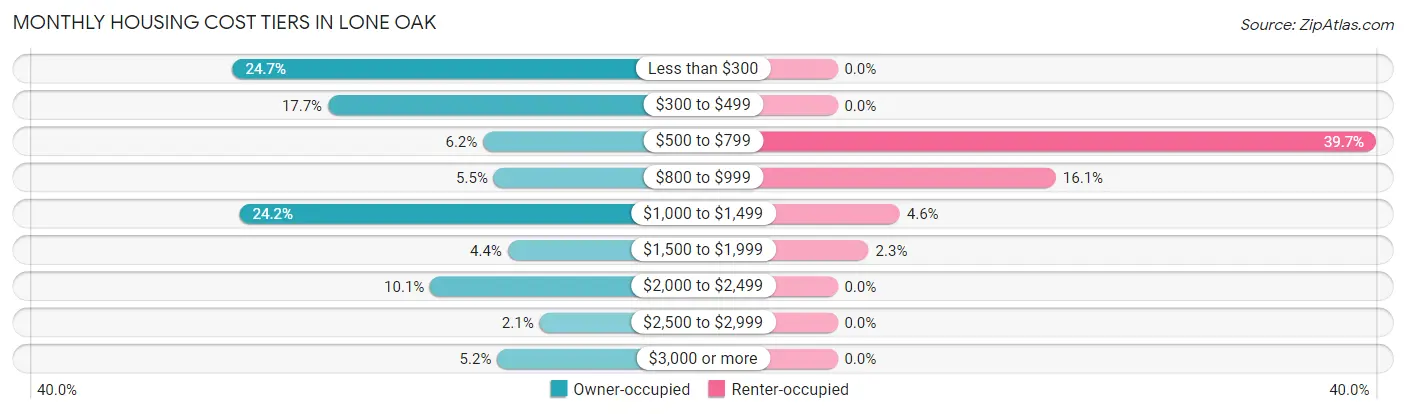
| Monthly Cost | Owner-occupied | Renter-occupied |
| Less than $300 | 95 (24.7%) | 0 (0.0%) |
| $300 to $499 | 68 (17.7%) | 0 (0.0%) |
| $500 to $799 | 24 (6.2%) | 69 (39.7%) |
| $800 to $999 | 21 (5.4%) | 28 (16.1%) |
| $1,000 to $1,499 | 93 (24.2%) | 8 (4.6%) |
| $1,500 to $1,999 | 17 (4.4%) | 4 (2.3%) |
| $2,000 to $2,499 | 39 (10.1%) | 0 (0.0%) |
| $2,500 to $2,999 | 8 (2.1%) | 0 (0.0%) |
| $3,000 or more | 20 (5.2%) | 0 (0.0%) |
| Total | 385 (100.0%) | 174 (100.0%) |
Physical Housing Characteristics in Lone Oak
Housing Structures in Lone Oak
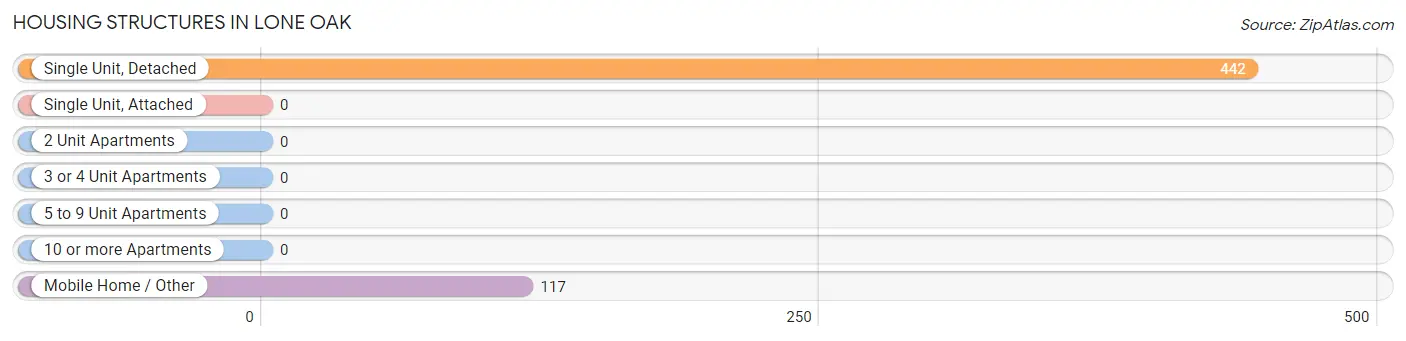
| Structure Type | # Housing Units | % Housing Units |
| Single Unit, Detached | 442 | 79.1% |
| Single Unit, Attached | 0 | 0.0% |
| 2 Unit Apartments | 0 | 0.0% |
| 3 or 4 Unit Apartments | 0 | 0.0% |
| 5 to 9 Unit Apartments | 0 | 0.0% |
| 10 or more Apartments | 0 | 0.0% |
| Mobile Home / Other | 117 | 20.9% |
| Total | 559 | 100.0% |
Housing Structures by Occupancy in Lone Oak
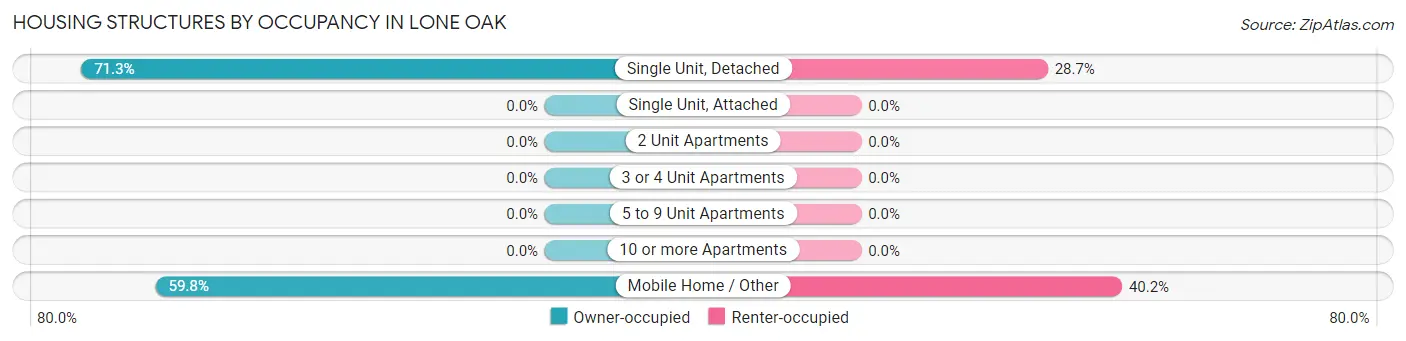
| Structure Type | Owner-occupied | Renter-occupied |
| Single Unit, Detached | 315 (71.3%) | 127 (28.7%) |
| Single Unit, Attached | 0 (0.0%) | 0 (0.0%) |
| 2 Unit Apartments | 0 (0.0%) | 0 (0.0%) |
| 3 or 4 Unit Apartments | 0 (0.0%) | 0 (0.0%) |
| 5 to 9 Unit Apartments | 0 (0.0%) | 0 (0.0%) |
| 10 or more Apartments | 0 (0.0%) | 0 (0.0%) |
| Mobile Home / Other | 70 (59.8%) | 47 (40.2%) |
| Total | 385 (68.9%) | 174 (31.1%) |
Housing Structures by Number of Rooms in Lone Oak
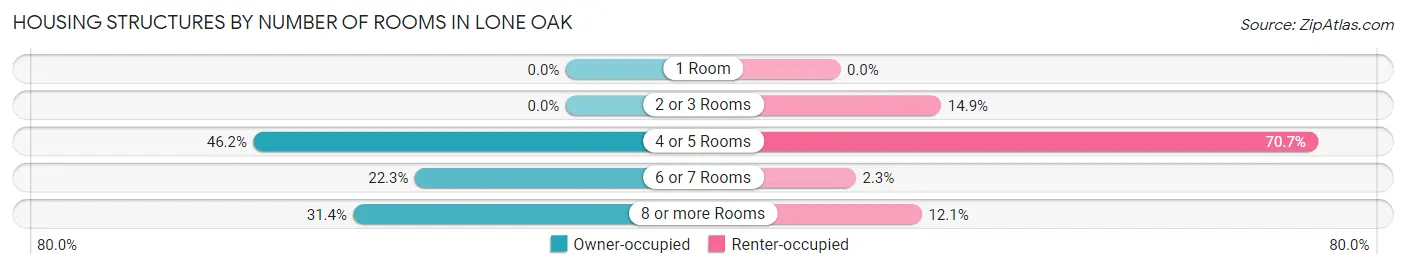
| Number of Rooms | Owner-occupied | Renter-occupied |
| 1 Room | 0 (0.0%) | 0 (0.0%) |
| 2 or 3 Rooms | 0 (0.0%) | 26 (14.9%) |
| 4 or 5 Rooms | 178 (46.2%) | 123 (70.7%) |
| 6 or 7 Rooms | 86 (22.3%) | 4 (2.3%) |
| 8 or more Rooms | 121 (31.4%) | 21 (12.1%) |
| Total | 385 (100.0%) | 174 (100.0%) |
Housing Structure by Heating Type in Lone Oak
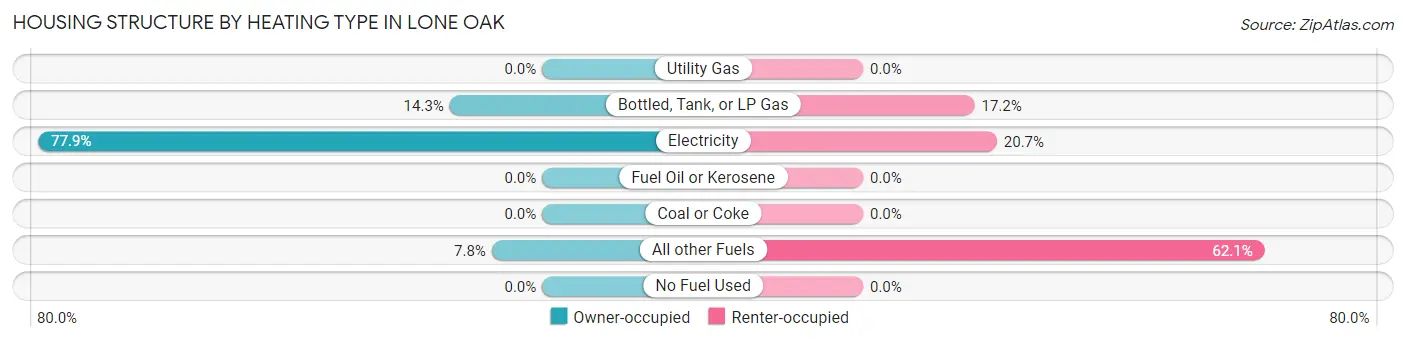
| Heating Type | Owner-occupied | Renter-occupied |
| Utility Gas | 0 (0.0%) | 0 (0.0%) |
| Bottled, Tank, or LP Gas | 55 (14.3%) | 30 (17.2%) |
| Electricity | 300 (77.9%) | 36 (20.7%) |
| Fuel Oil or Kerosene | 0 (0.0%) | 0 (0.0%) |
| Coal or Coke | 0 (0.0%) | 0 (0.0%) |
| All other Fuels | 30 (7.8%) | 108 (62.1%) |
| No Fuel Used | 0 (0.0%) | 0 (0.0%) |
| Total | 385 (100.0%) | 174 (100.0%) |
Household Vehicle Usage in Lone Oak
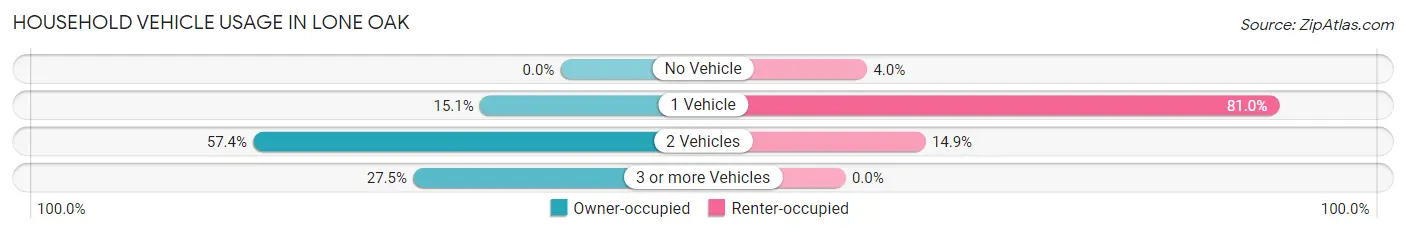
| Vehicles per Household | Owner-occupied | Renter-occupied |
| No Vehicle | 0 (0.0%) | 7 (4.0%) |
| 1 Vehicle | 58 (15.1%) | 141 (81.0%) |
| 2 Vehicles | 221 (57.4%) | 26 (14.9%) |
| 3 or more Vehicles | 106 (27.5%) | 0 (0.0%) |
| Total | 385 (100.0%) | 174 (100.0%) |
Real Estate & Mortgages in Lone Oak
Real Estate and Mortgage Overview in Lone Oak
| Characteristic | Without Mortgage | With Mortgage |
| Housing Units | 189 | 196 |
| Median Property Value | $159,400 | $194,200 |
| Median Household Income | $30,986 | $15 |
| Monthly Housing Costs | $299 | $20 |
| Real Estate Taxes | - | - |
Property Value by Mortgage Status in Lone Oak
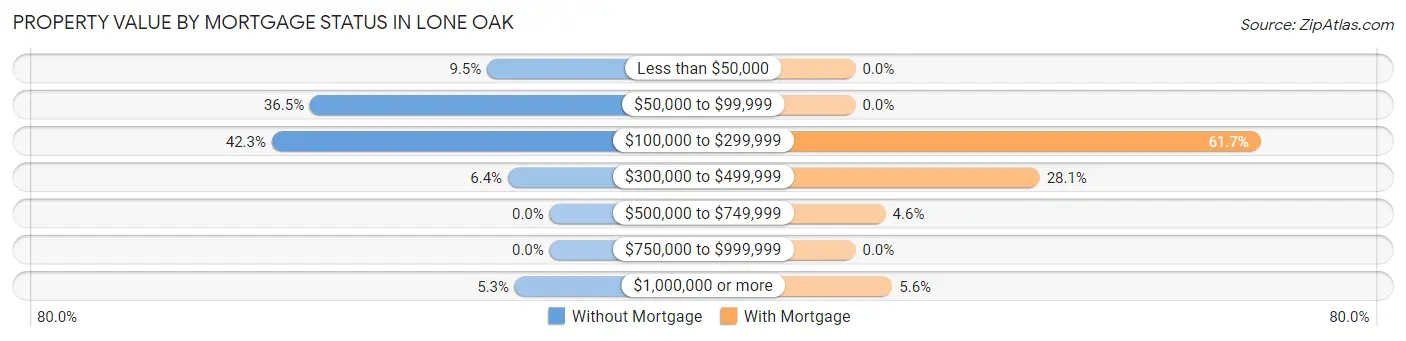
| Property Value | Without Mortgage | With Mortgage |
| Less than $50,000 | 18 (9.5%) | 0 (0.0%) |
| $50,000 to $99,999 | 69 (36.5%) | 0 (0.0%) |
| $100,000 to $299,999 | 80 (42.3%) | 121 (61.7%) |
| $300,000 to $499,999 | 12 (6.4%) | 55 (28.1%) |
| $500,000 to $749,999 | 0 (0.0%) | 9 (4.6%) |
| $750,000 to $999,999 | 0 (0.0%) | 0 (0.0%) |
| $1,000,000 or more | 10 (5.3%) | 11 (5.6%) |
| Total | 189 (100.0%) | 196 (100.0%) |
Household Income by Mortgage Status in Lone Oak
| Household Income | Without Mortgage | With Mortgage |
| Less than $10,000 | 10 (5.3%) | 0 (0.0%) |
| $10,000 to $24,999 | 43 (22.8%) | 0 (0.0%) |
| $25,000 to $34,999 | 73 (38.6%) | 11 (5.6%) |
| $35,000 to $49,999 | 16 (8.5%) | 10 (5.1%) |
| $50,000 to $74,999 | 24 (12.7%) | 0 (0.0%) |
| $75,000 to $99,999 | 16 (8.5%) | 8 (4.1%) |
| $100,000 to $149,999 | 0 (0.0%) | 77 (39.3%) |
| $150,000 or more | 7 (3.7%) | 75 (38.3%) |
| Total | 189 (100.0%) | 196 (100.0%) |
Property Value to Household Income Ratio in Lone Oak
| Value-to-Income Ratio | Without Mortgage | With Mortgage |
| Less than 2.0x | 86 (45.5%) | 94,394 (48,160.2%) |
| 2.0x to 2.9x | 15 (7.9%) | 61 (31.1%) |
| 3.0x to 3.9x | 0 (0.0%) | 75 (38.3%) |
| 4.0x or more | 78 (41.3%) | 0 (0.0%) |
| Total | 189 (100.0%) | 196 (100.0%) |
Real Estate Taxes by Mortgage Status in Lone Oak
| Property Taxes | Without Mortgage | With Mortgage |
| Less than $800 | 96 (50.8%) | 0 (0.0%) |
| $800 to $1,499 | 55 (29.1%) | 71 (36.2%) |
| $800 to $1,499 | 9 (4.8%) | 67 (34.2%) |
| Total | 189 (100.0%) | 196 (100.0%) |
Health & Disability in Lone Oak
Health Insurance Coverage by Age in Lone Oak
| Age Bracket | With Coverage | Without Coverage |
| Under 6 Years | 93 (100.0%) | 0 (0.0%) |
| 6 to 18 Years | 207 (100.0%) | 0 (0.0%) |
| 19 to 25 Years | 69 (76.7%) | 21 (23.3%) |
| 26 to 34 Years | 85 (47.2%) | 95 (52.8%) |
| 35 to 44 Years | 59 (60.8%) | 38 (39.2%) |
| 45 to 54 Years | 264 (82.2%) | 57 (17.8%) |
| 55 to 64 Years | 210 (73.7%) | 75 (26.3%) |
| 65 to 74 Years | 178 (100.0%) | 0 (0.0%) |
| 75 Years and older | 133 (100.0%) | 0 (0.0%) |
| Total | 1,298 (81.9%) | 286 (18.1%) |
Health Insurance Coverage by Citizenship Status in Lone Oak
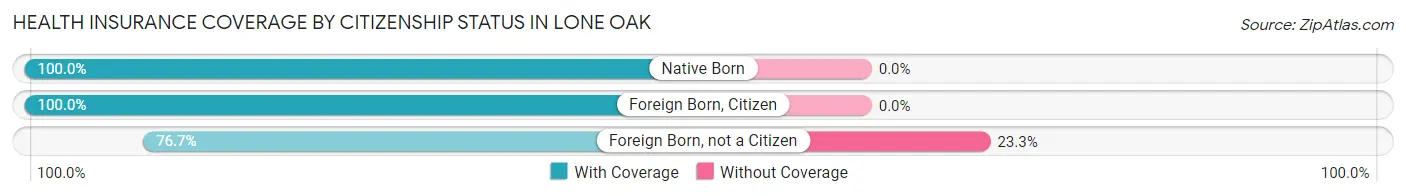
| Citizenship Status | With Coverage | Without Coverage |
| Native Born | 93 (100.0%) | 0 (0.0%) |
| Foreign Born, Citizen | 207 (100.0%) | 0 (0.0%) |
| Foreign Born, not a Citizen | 69 (76.7%) | 21 (23.3%) |
Health Insurance Coverage by Household Income in Lone Oak
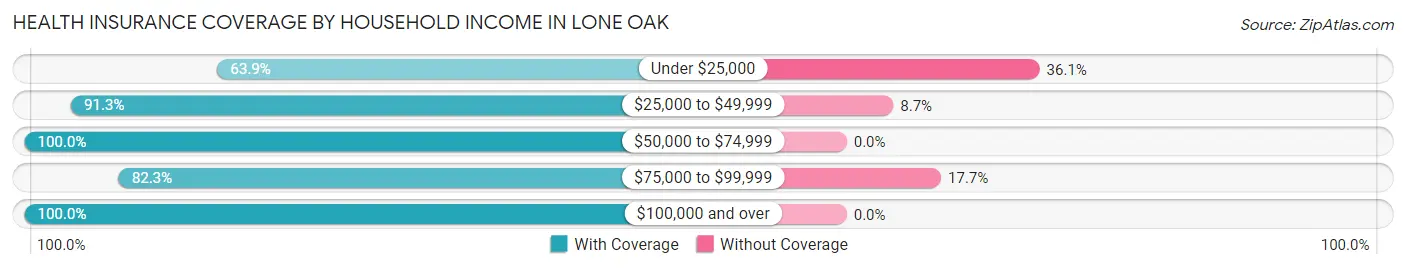
| Household Income | With Coverage | Without Coverage |
| Under $25,000 | 304 (63.9%) | 172 (36.1%) |
| $25,000 to $49,999 | 272 (91.3%) | 26 (8.7%) |
| $50,000 to $74,999 | 85 (100.0%) | 0 (0.0%) |
| $75,000 to $99,999 | 410 (82.3%) | 88 (17.7%) |
| $100,000 and over | 227 (100.0%) | 0 (0.0%) |
Public vs Private Health Insurance Coverage by Age in Lone Oak
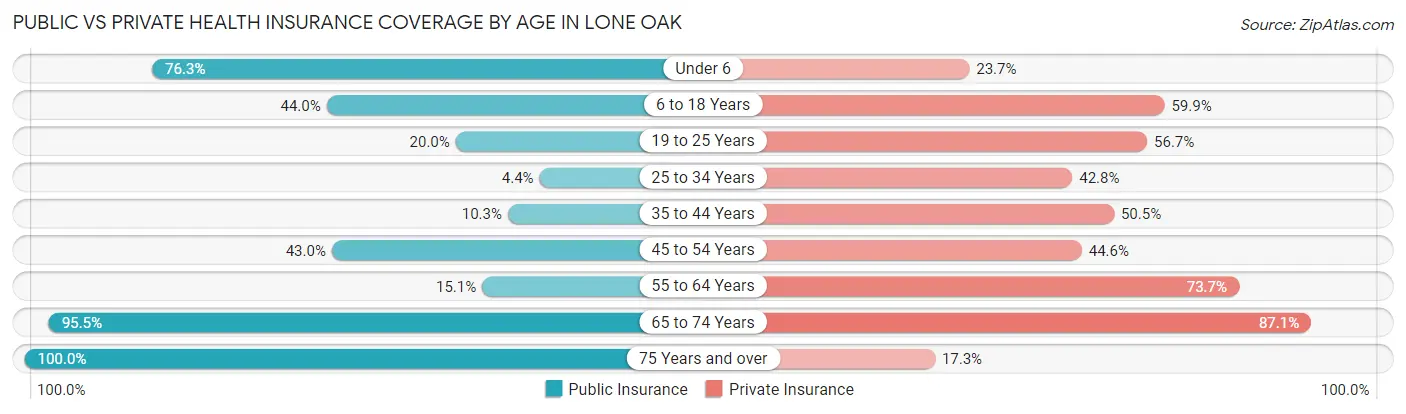
| Age Bracket | Public Insurance | Private Insurance |
| Under 6 | 71 (76.3%) | 22 (23.7%) |
| 6 to 18 Years | 91 (44.0%) | 124 (59.9%) |
| 19 to 25 Years | 18 (20.0%) | 51 (56.7%) |
| 25 to 34 Years | 8 (4.4%) | 77 (42.8%) |
| 35 to 44 Years | 10 (10.3%) | 49 (50.5%) |
| 45 to 54 Years | 138 (43.0%) | 143 (44.6%) |
| 55 to 64 Years | 43 (15.1%) | 210 (73.7%) |
| 65 to 74 Years | 170 (95.5%) | 155 (87.1%) |
| 75 Years and over | 133 (100.0%) | 23 (17.3%) |
| Total | 682 (43.1%) | 854 (53.9%) |
Disability Status by Sex by Age in Lone Oak
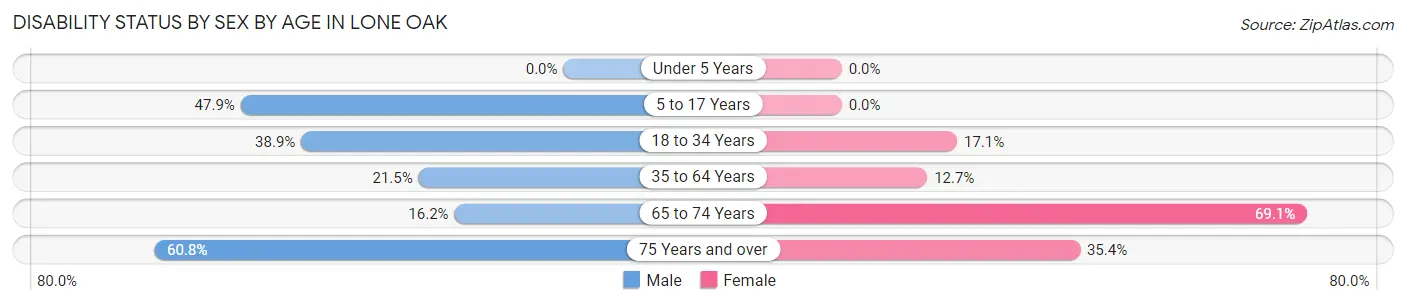
| Age Bracket | Male | Female |
| Under 5 Years | 0 (0.0%) | 0 (0.0%) |
| 5 to 17 Years | 23 (47.9%) | 0 (0.0%) |
| 18 to 34 Years | 51 (38.9%) | 26 (17.1%) |
| 35 to 64 Years | 63 (21.5%) | 52 (12.7%) |
| 65 to 74 Years | 11 (16.2%) | 76 (69.1%) |
| 75 Years and over | 31 (60.8%) | 29 (35.4%) |
Disability Class by Sex by Age in Lone Oak
Disability Class: Hearing Difficulty
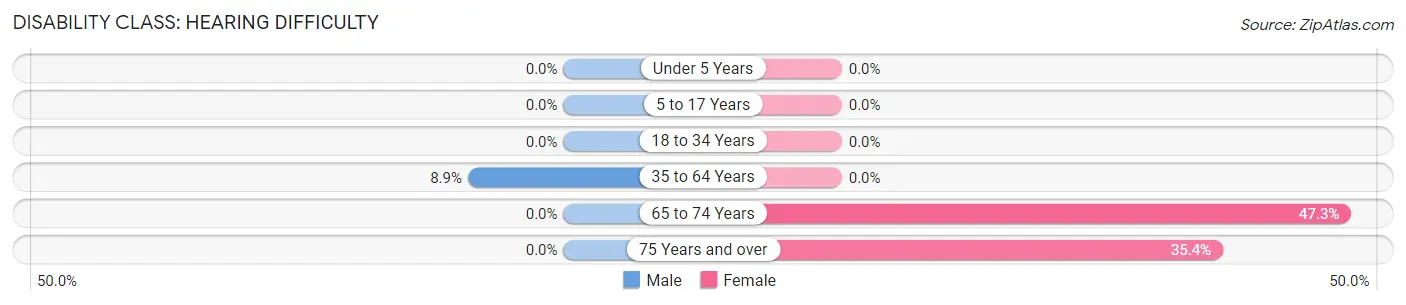
| Age Bracket | Male | Female |
| Under 5 Years | 0 (0.0%) | 0 (0.0%) |
| 5 to 17 Years | 0 (0.0%) | 0 (0.0%) |
| 18 to 34 Years | 0 (0.0%) | 0 (0.0%) |
| 35 to 64 Years | 26 (8.9%) | 0 (0.0%) |
| 65 to 74 Years | 0 (0.0%) | 52 (47.3%) |
| 75 Years and over | 0 (0.0%) | 29 (35.4%) |
Disability Class: Vision Difficulty
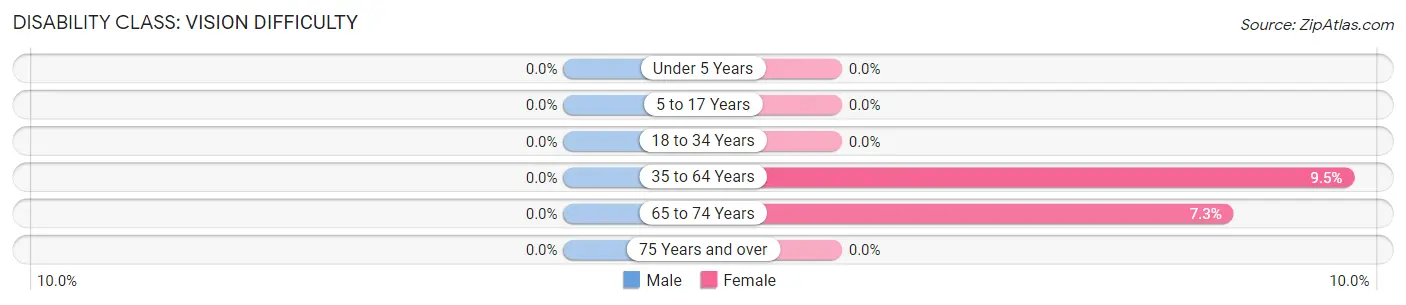
| Age Bracket | Male | Female |
| Under 5 Years | 0 (0.0%) | 0 (0.0%) |
| 5 to 17 Years | 0 (0.0%) | 0 (0.0%) |
| 18 to 34 Years | 0 (0.0%) | 0 (0.0%) |
| 35 to 64 Years | 0 (0.0%) | 39 (9.5%) |
| 65 to 74 Years | 0 (0.0%) | 8 (7.3%) |
| 75 Years and over | 0 (0.0%) | 0 (0.0%) |
Disability Class: Cognitive Difficulty
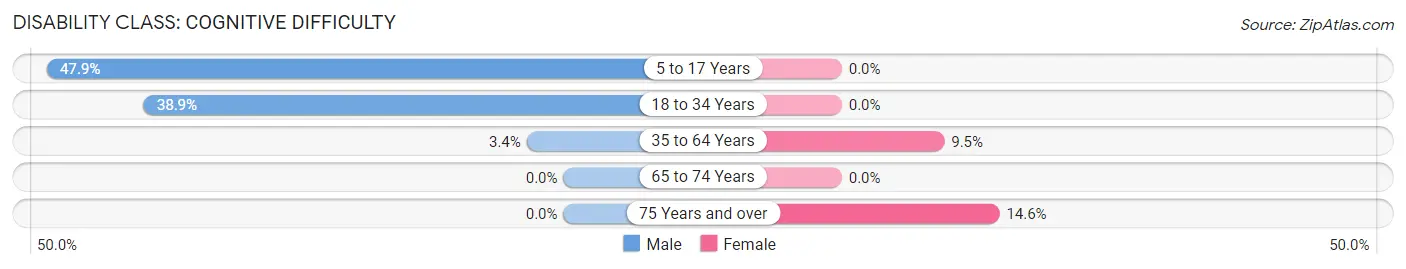
| Age Bracket | Male | Female |
| 5 to 17 Years | 23 (47.9%) | 0 (0.0%) |
| 18 to 34 Years | 51 (38.9%) | 0 (0.0%) |
| 35 to 64 Years | 10 (3.4%) | 39 (9.5%) |
| 65 to 74 Years | 0 (0.0%) | 0 (0.0%) |
| 75 Years and over | 0 (0.0%) | 12 (14.6%) |
Disability Class: Ambulatory Difficulty
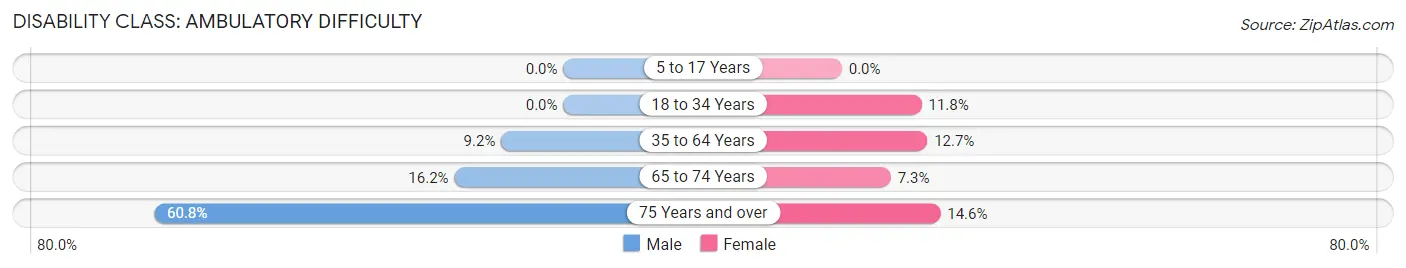
| Age Bracket | Male | Female |
| 5 to 17 Years | 0 (0.0%) | 0 (0.0%) |
| 18 to 34 Years | 0 (0.0%) | 18 (11.8%) |
| 35 to 64 Years | 27 (9.2%) | 52 (12.7%) |
| 65 to 74 Years | 11 (16.2%) | 8 (7.3%) |
| 75 Years and over | 31 (60.8%) | 12 (14.6%) |
Disability Class: Self-Care Difficulty
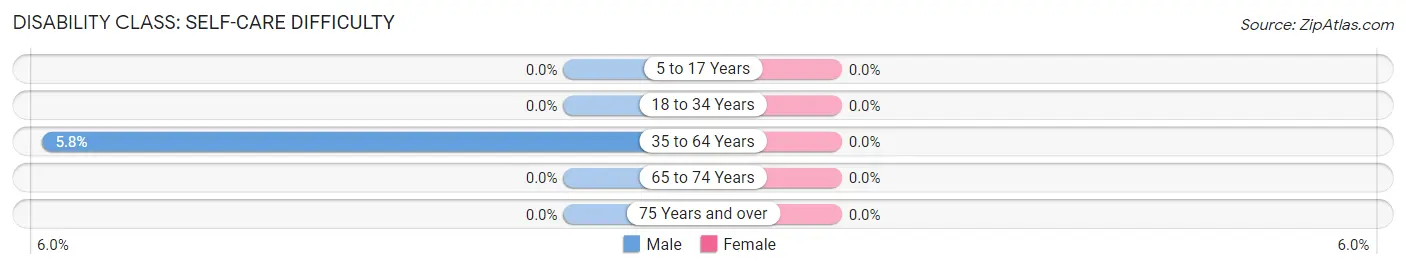
| Age Bracket | Male | Female |
| 5 to 17 Years | 0 (0.0%) | 0 (0.0%) |
| 18 to 34 Years | 0 (0.0%) | 0 (0.0%) |
| 35 to 64 Years | 17 (5.8%) | 0 (0.0%) |
| 65 to 74 Years | 0 (0.0%) | 0 (0.0%) |
| 75 Years and over | 0 (0.0%) | 0 (0.0%) |
Technology Access in Lone Oak
Computing Device Access in Lone Oak
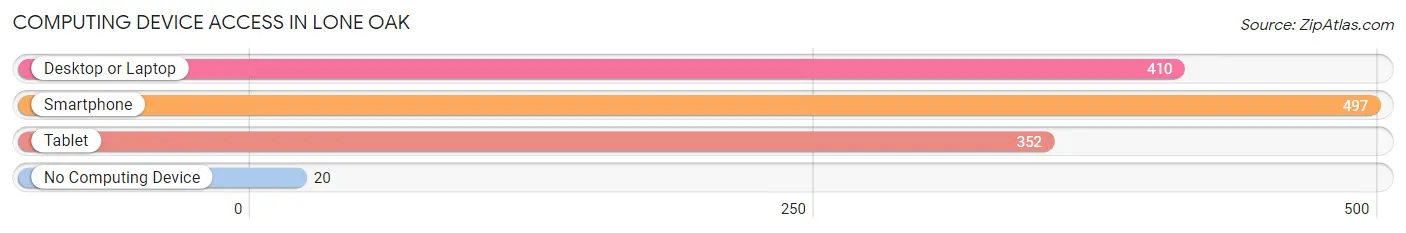
| Device Type | # Households | % Households |
| Desktop or Laptop | 410 | 73.4% |
| Smartphone | 497 | 88.9% |
| Tablet | 352 | 63.0% |
| No Computing Device | 20 | 3.6% |
| Total | 559 | 100.0% |
Internet Access in Lone Oak
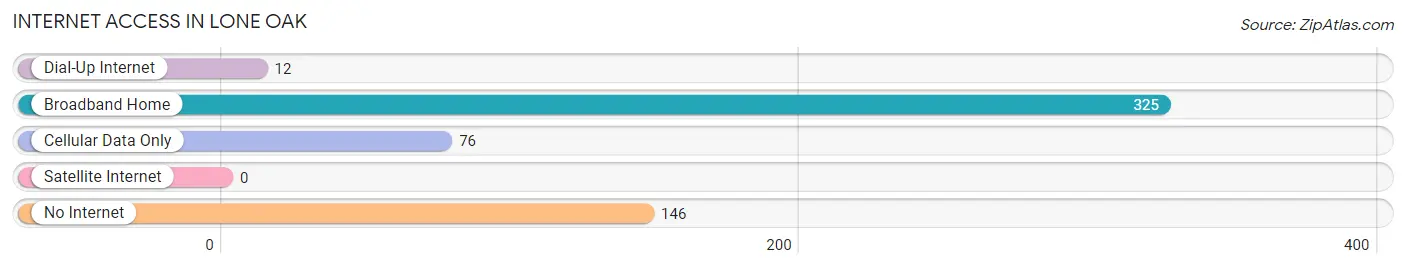
| Internet Type | # Households | % Households |
| Dial-Up Internet | 12 | 2.1% |
| Broadband Home | 325 | 58.1% |
| Cellular Data Only | 76 | 13.6% |
| Satellite Internet | 0 | 0.0% |
| No Internet | 146 | 26.1% |
| Total | 559 | 100.0% |
Lone Oak Summary
Lone Oak is a small town located in the northwest corner of Tennessee, in the county of Obion. It is situated on the banks of the Obion River, and is surrounded by rolling hills and farmland. The town has a population of just over 1,000 people, and is known for its small-town charm and friendly atmosphere.
History
Lone Oak was founded in 1845 by a group of settlers from North Carolina. The town was named after a large oak tree that stood alone in the area. The settlers built a log cabin near the tree, and the town grew from there. The town was incorporated in 1876, and the first post office was established in 1877.
In the late 19th century, Lone Oak was a thriving agricultural community. The town was home to several cotton gins, a grist mill, and a sawmill. The town also had a blacksmith shop, a general store, and a hotel.
In the early 20th century, the town began to decline as the railroad bypassed it. The town’s population decreased, and many of the businesses closed. In the 1950s, the town was revitalized when a new highway was built through the area. This brought new businesses and people to the town, and the population began to grow again.
Geography
Lone Oak is located in the northwest corner of Tennessee, in the county of Obion. It is situated on the banks of the Obion River, and is surrounded by rolling hills and farmland. The town is located about 30 miles from the state capital of Nashville.
The climate in Lone Oak is humid subtropical, with hot summers and mild winters. The average annual temperature is around 65 degrees Fahrenheit. The town receives an average of 45 inches of rain per year.
Economy
The economy of Lone Oak is largely based on agriculture. The town is home to several farms, and the surrounding area is known for its production of cotton, soybeans, and corn. The town also has a few small businesses, including a grocery store, a hardware store, and a few restaurants.
Demographics
As of the 2010 census, the population of Lone Oak was 1,072. The racial makeup of the town was 95.3% White, 2.2% African American, 0.3% Native American, 0.2% Asian, 0.1% Pacific Islander, and 1.9% from other races. The median household income was $35,000, and the median age was 38.
Lone Oak is a small town with a friendly atmosphere and a rich history. The town is known for its agricultural roots, and its economy is largely based on farming. The town has a diverse population, and is a great place to live and raise a family.
Common Questions
What is Per Capita Income in Lone Oak?
Per Capita income in Lone Oak is $22,537.
What is the Median Family Income in Lone Oak?
Median Family Income in Lone Oak is $75,000.
What is Income or Wage Gap in Lone Oak?
Income or Wage Gap in Lone Oak is 73.8%.
Women in Lone Oak earn 26.2 cents for every dollar earned by a man.
What is Inequality or Gini Index in Lone Oak?
Inequality or Gini Index in Lone Oak is 0.43.
What is the Total Population of Lone Oak?
Total Population of Lone Oak is 1,584.
What is the Total Male Population of Lone Oak?
Total Male Population of Lone Oak is 631.
What is the Total Female Population of Lone Oak?
Total Female Population of Lone Oak is 953.
What is the Ratio of Males per 100 Females in Lone Oak?
There are 66.21 Males per 100 Females in Lone Oak.
What is the Ratio of Females per 100 Males in Lone Oak?
There are 151.03 Females per 100 Males in Lone Oak.
What is the Median Population Age in Lone Oak?
Median Population Age in Lone Oak is 51.1 Years.
What is the Average Family Size in Lone Oak
Average Family Size in Lone Oak is 3.5 People.
What is the Average Household Size in Lone Oak
Average Household Size in Lone Oak is 2.8 People.
How Large is the Labor Force in Lone Oak?
There are 625 People in the Labor Forcein in Lone Oak.
What is the Percentage of People in the Labor Force in Lone Oak?
46.0% of People are in the Labor Force in Lone Oak.