Zip Codes with the Highest Percentage of Population Employed in Food Preparation & Serving in Cleveland, TN
RELATED REPORTS & OPTIONS
Food Preparation & Serving
Cleveland
Compare Zip Codes
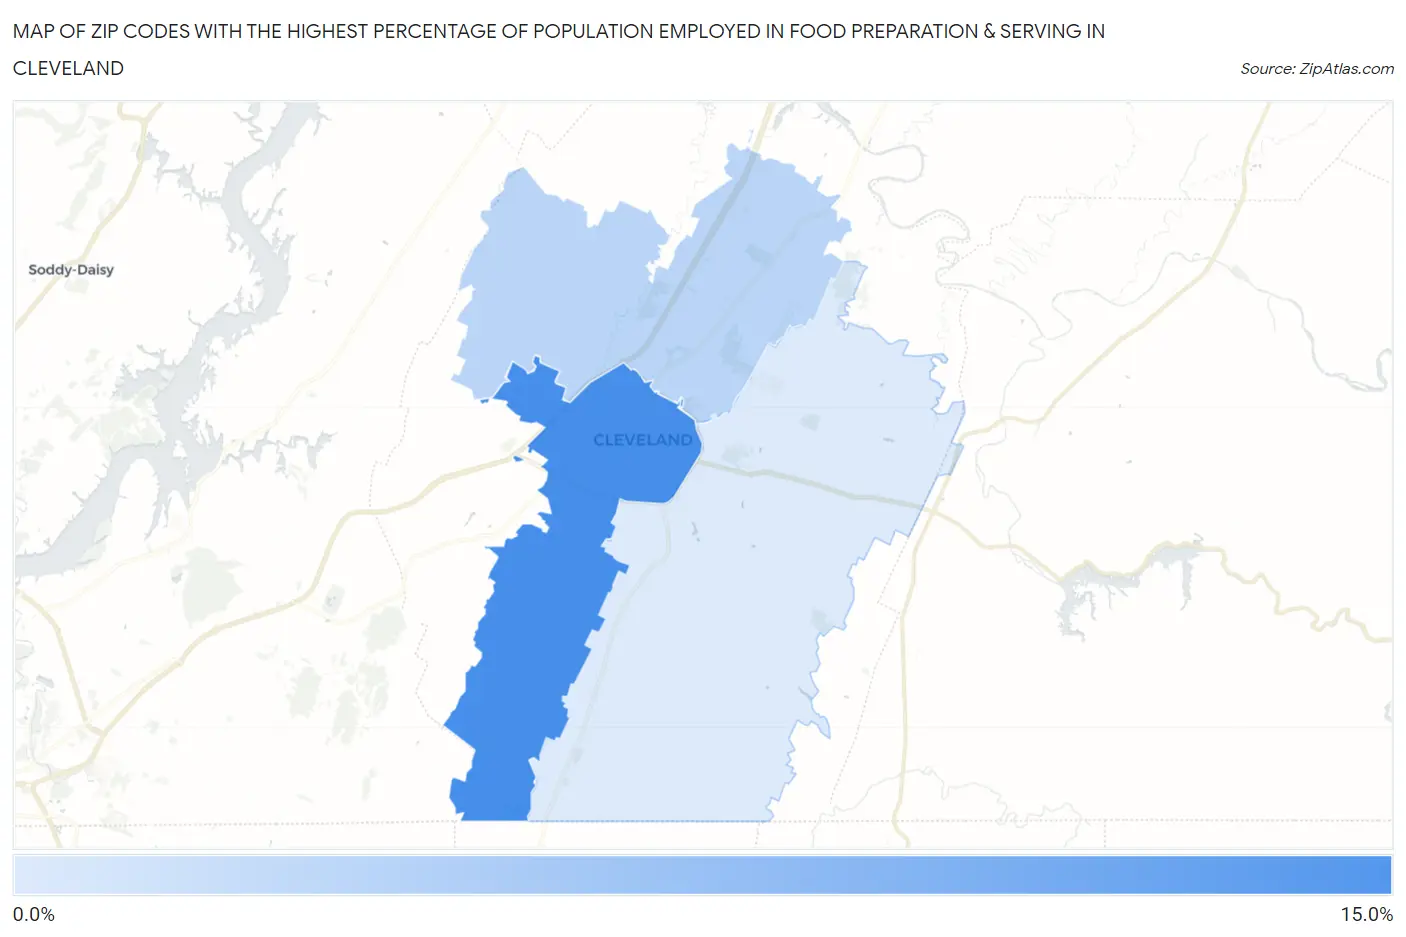
Map of Zip Codes with the Highest Percentage of Population Employed in Food Preparation & Serving in Cleveland
3.3%
10.3%
Zip Codes with the Highest Percentage of Population Employed in Food Preparation & Serving in Cleveland, TN
| Zip Code | % Employed | vs State | vs National | |
| 1. | 37311 | 10.3% | 5.4%(+4.85)#43 | 5.3%(+4.99)#2,440 |
| 2. | 37312 | 4.9% | 5.4%(-0.552)#266 | 5.3%(-0.419)#13,489 |
| 3. | 37323 | 3.3% | 5.4%(-2.08)#400 | 5.3%(-1.95)#19,888 |
1
Common Questions
What are the Top Zip Codes with the Highest Percentage of Population Employed in Food Preparation & Serving in Cleveland, TN?
Top Zip Codes with the Highest Percentage of Population Employed in Food Preparation & Serving in Cleveland, TN are:
What zip code has the Highest Percentage of Population Employed in Food Preparation & Serving in Cleveland, TN?
37311 has the Highest Percentage of Population Employed in Food Preparation & Serving in Cleveland, TN with 10.3%.
What is the Percentage of Population Employed in Food Preparation & Serving in Cleveland, TN?
Percentage of Population Employed in Food Preparation & Serving in Cleveland is 8.6%.
What is the Percentage of Population Employed in Food Preparation & Serving in Tennessee?
Percentage of Population Employed in Food Preparation & Serving in Tennessee is 5.4%.
What is the Percentage of Population Employed in Food Preparation & Serving in the United States?
Percentage of Population Employed in Food Preparation & Serving in the United States is 5.3%.