Gilt Edge, TN Map & Demographics
Gilt Edge Map
Gilt Edge Overview
$28,182
PER CAPITA INCOME
$56,875
AVG FAMILY INCOME
$48,906
AVG HOUSEHOLD INCOME
51.3%
WAGE / INCOME GAP [ % ]
48.7¢/ $1
WAGE / INCOME GAP [ $ ]
0.43
INEQUALITY / GINI INDEX
513
TOTAL POPULATION
233
MALE POPULATION
280
FEMALE POPULATION
83.21
MALES / 100 FEMALES
120.17
FEMALES / 100 MALES
37.0
MEDIAN AGE
3.0
AVG FAMILY SIZE
2.5
AVG HOUSEHOLD SIZE
273
LABOR FORCE [ PEOPLE ]
64.7%
PERCENT IN LABOR FORCE
3.3%
UNEMPLOYMENT RATE
Gilt Edge Area Codes
Income in Gilt Edge
Income Overview in Gilt Edge
Per Capita Income in Gilt Edge is $28,182, while median incomes of families and households are $56,875 and $48,906 respectively.
| Characteristic | Number | Measure |
| Per Capita Income | 513 | $28,182 |
| Median Family Income | 135 | $56,875 |
| Mean Family Income | 135 | $79,888 |
| Median Household Income | 193 | $48,906 |
| Mean Household Income | 193 | $69,675 |
| Income Deficit | 135 | $0 |
| Wage / Income Gap (%) | 513 | 51.33% |
| Wage / Income Gap ($) | 513 | 48.67¢ per $1 |
| Gini / Inequality Index | 513 | 0.43 |
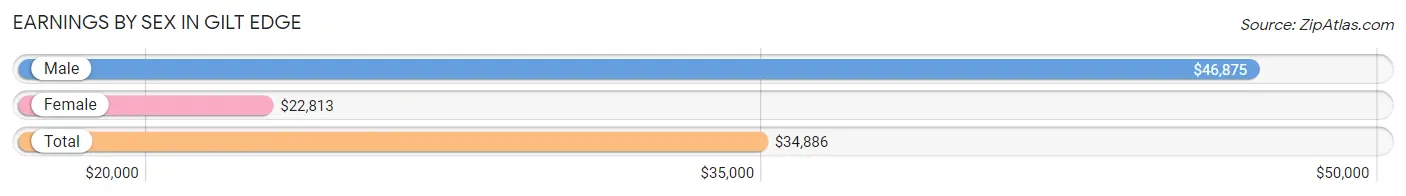
Earnings by Sex in Gilt Edge
Average Earnings in Gilt Edge are $34,886, $46,875 for men and $22,813 for women, a difference of 51.3%.
| Sex | Number | Average Earnings |
| Male | 122 (44.4%) | $46,875 |
| Female | 153 (55.6%) | $22,813 |
| Total | 275 (100.0%) | $34,886 |
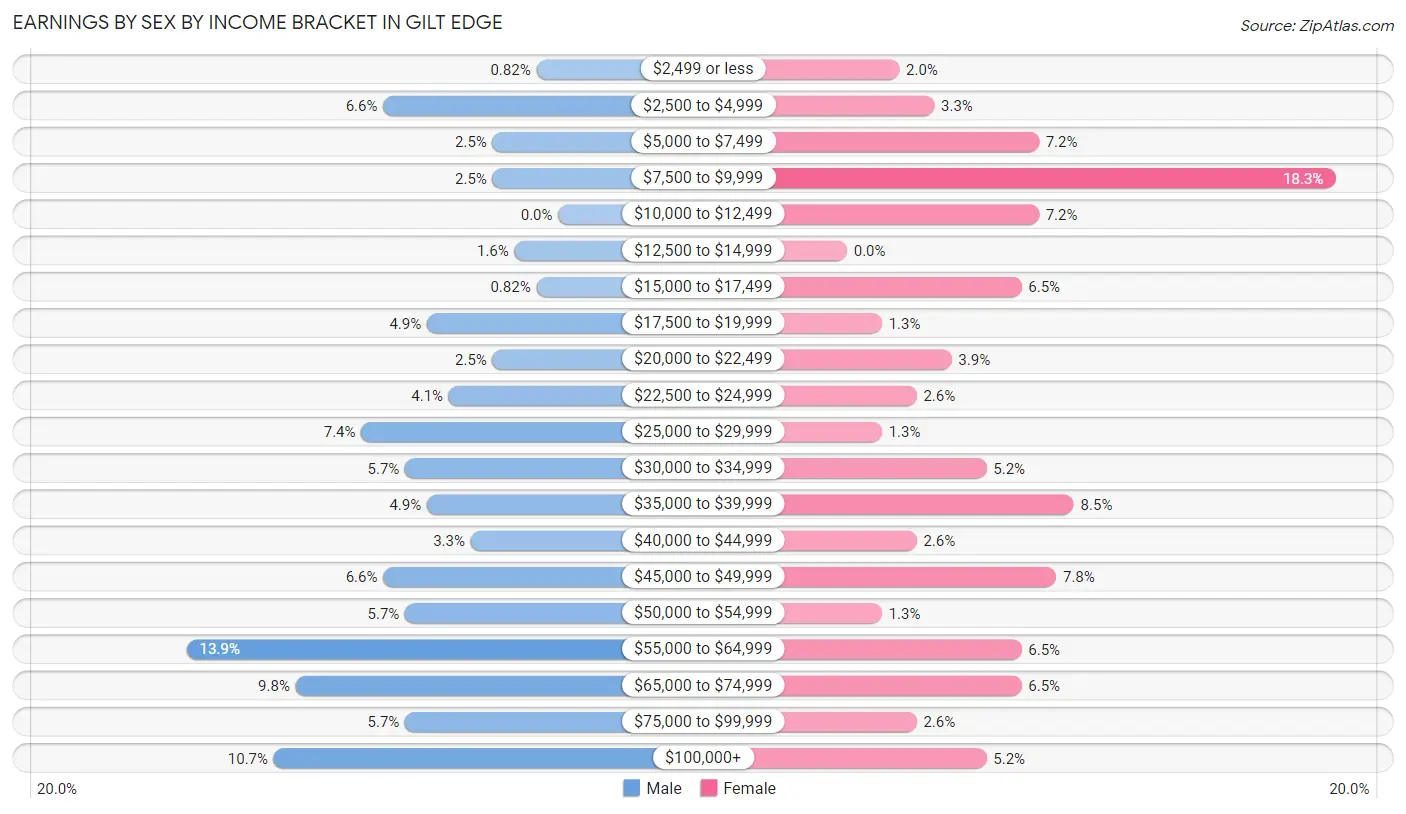
Earnings by Sex by Income Bracket in Gilt Edge
The most common earnings brackets in Gilt Edge are $55,000 to $64,999 for men (17 | 13.9%) and $7,500 to $9,999 for women (28 | 18.3%).
| Income | Male | Female |
| $2,499 or less | 1 (0.8%) | 3 (2.0%) |
| $2,500 to $4,999 | 8 (6.6%) | 5 (3.3%) |
| $5,000 to $7,499 | 3 (2.5%) | 11 (7.2%) |
| $7,500 to $9,999 | 3 (2.5%) | 28 (18.3%) |
| $10,000 to $12,499 | 0 (0.0%) | 11 (7.2%) |
| $12,500 to $14,999 | 2 (1.6%) | 0 (0.0%) |
| $15,000 to $17,499 | 1 (0.8%) | 10 (6.5%) |
| $17,500 to $19,999 | 6 (4.9%) | 2 (1.3%) |
| $20,000 to $22,499 | 3 (2.5%) | 6 (3.9%) |
| $22,500 to $24,999 | 5 (4.1%) | 4 (2.6%) |
| $25,000 to $29,999 | 9 (7.4%) | 2 (1.3%) |
| $30,000 to $34,999 | 7 (5.7%) | 8 (5.2%) |
| $35,000 to $39,999 | 6 (4.9%) | 13 (8.5%) |
| $40,000 to $44,999 | 4 (3.3%) | 4 (2.6%) |
| $45,000 to $49,999 | 8 (6.6%) | 12 (7.8%) |
| $50,000 to $54,999 | 7 (5.7%) | 2 (1.3%) |
| $55,000 to $64,999 | 17 (13.9%) | 10 (6.5%) |
| $65,000 to $74,999 | 12 (9.8%) | 10 (6.5%) |
| $75,000 to $99,999 | 7 (5.7%) | 4 (2.6%) |
| $100,000+ | 13 (10.7%) | 8 (5.2%) |
| Total | 122 (100.0%) | 153 (100.0%) |
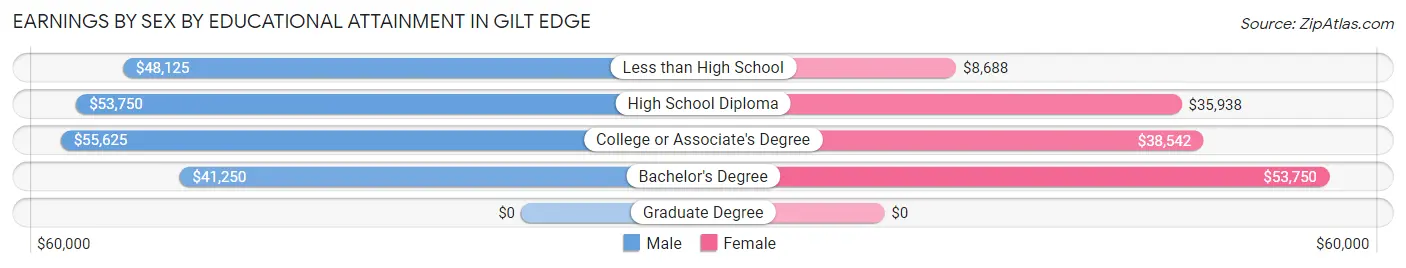
Earnings by Sex by Educational Attainment in Gilt Edge
Average earnings in Gilt Edge are $50,833 for men and $32,500 for women, a difference of 36.1%. Men with an educational attainment of college or associate's degree enjoy the highest average annual earnings of $55,625, while those with bachelor's degree education earn the least with $41,250. Women with an educational attainment of bachelor's degree earn the most with the average annual earnings of $53,750, while those with less than high school education have the smallest earnings of $8,688.
| Educational Attainment | Male Income | Female Income |
| Less than High School | $48,125 | $8,688 |
| High School Diploma | $53,750 | $35,938 |
| College or Associate's Degree | $55,625 | $38,542 |
| Bachelor's Degree | $41,250 | $53,750 |
| Graduate Degree | - | - |
| Total | $50,833 | $32,500 |
Family Income in Gilt Edge
Family Income Brackets in Gilt Edge
According to the Gilt Edge family income data, there are 31 families falling into the $35,000 to $49,999 income range, which is the most common income bracket and makes up 23.0% of all families. Conversely, the $15,000 to $24,999 income bracket is the least frequent group with only 1 families (0.7%) belonging to this category.
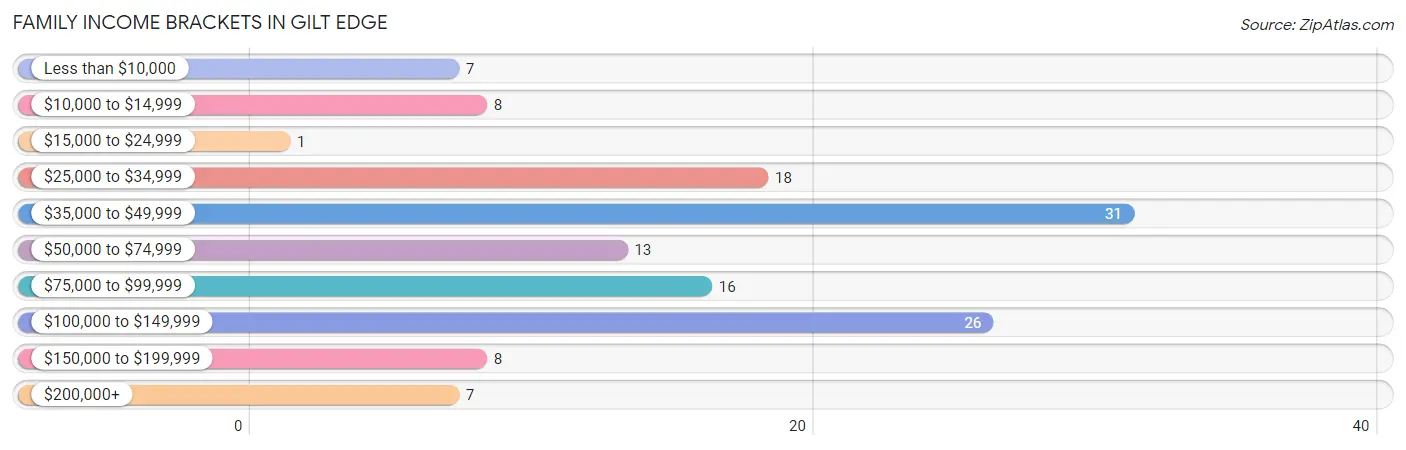
| Income Bracket | # Families | % Families |
| Less than $10,000 | 7 | 5.2% |
| $10,000 to $14,999 | 8 | 5.9% |
| $15,000 to $24,999 | 1 | 0.7% |
| $25,000 to $34,999 | 18 | 13.3% |
| $35,000 to $49,999 | 31 | 23.0% |
| $50,000 to $74,999 | 13 | 9.6% |
| $75,000 to $99,999 | 16 | 11.9% |
| $100,000 to $149,999 | 26 | 19.3% |
| $150,000 to $199,999 | 8 | 5.9% |
| $200,000+ | 7 | 5.2% |
Family Income by Famaliy Size in Gilt Edge
4-person families (38 | 28.1%) account for the highest median family income in Gilt Edge with $107,500 per family, while 4-person families (38 | 28.1%) have the highest median income of $26,875 per family member.
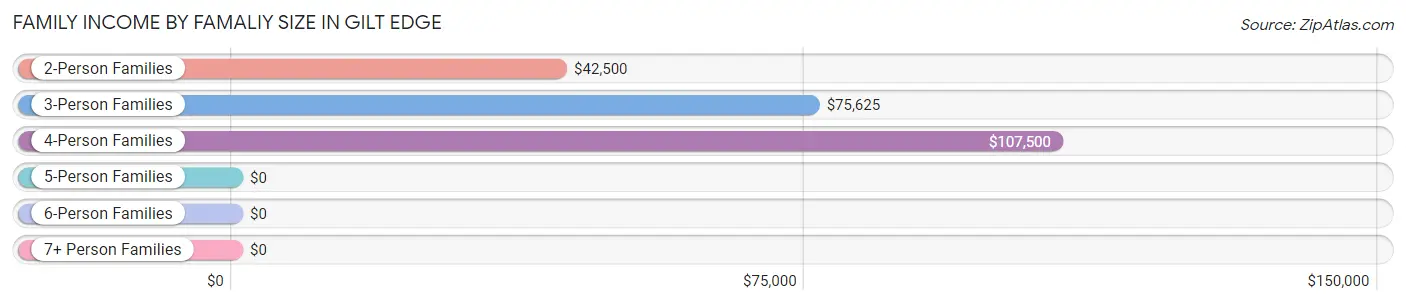
| Income Bracket | # Families | Median Income |
| 2-Person Families | 58 (43.0%) | $42,500 |
| 3-Person Families | 35 (25.9%) | $75,625 |
| 4-Person Families | 38 (28.1%) | $107,500 |
| 5-Person Families | 3 (2.2%) | $0 |
| 6-Person Families | 0 (0.0%) | $0 |
| 7+ Person Families | 1 (0.7%) | $0 |
| Total | 135 (100.0%) | $56,875 |
Family Income by Number of Earners in Gilt Edge
The median family income in Gilt Edge is $56,875, with families comprising 3+ earners (5) having the highest median family income of $172,917, while families with no earners (20) have the lowest median family income of $34,583, accounting for 3.7% and 14.8% of families, respectively.
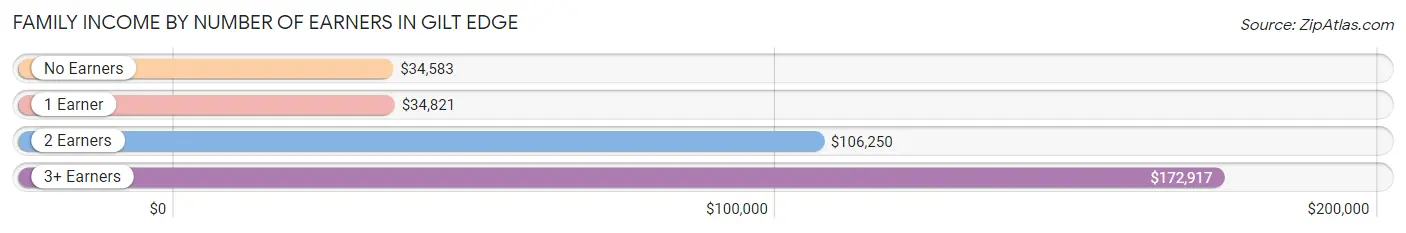
| Number of Earners | # Families | Median Income |
| No Earners | 20 (14.8%) | $34,583 |
| 1 Earner | 45 (33.3%) | $34,821 |
| 2 Earners | 65 (48.1%) | $106,250 |
| 3+ Earners | 5 (3.7%) | $172,917 |
| Total | 135 (100.0%) | $56,875 |
Household Income in Gilt Edge
Household Income Brackets in Gilt Edge
With 41 households falling in the category, the $35,000 to $49,999 income range is the most frequent in Gilt Edge, accounting for 21.2% of all households. In contrast, only 8 households (4.2%) fall into the $15,000 to $24,999 income bracket, making it the least populous group.
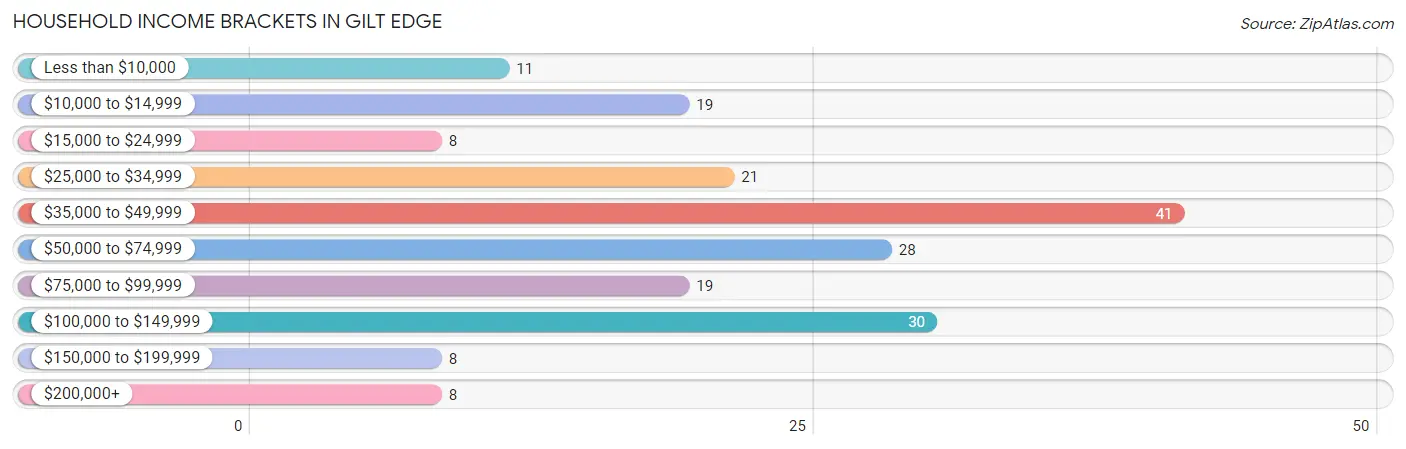
| Income Bracket | # Households | % Households |
| Less than $10,000 | 11 | 5.7% |
| $10,000 to $14,999 | 19 | 9.8% |
| $15,000 to $24,999 | 8 | 4.1% |
| $25,000 to $34,999 | 21 | 10.9% |
| $35,000 to $49,999 | 41 | 21.2% |
| $50,000 to $74,999 | 28 | 14.5% |
| $75,000 to $99,999 | 19 | 9.8% |
| $100,000 to $149,999 | 30 | 15.5% |
| $150,000 to $199,999 | 8 | 4.1% |
| $200,000+ | 8 | 4.1% |
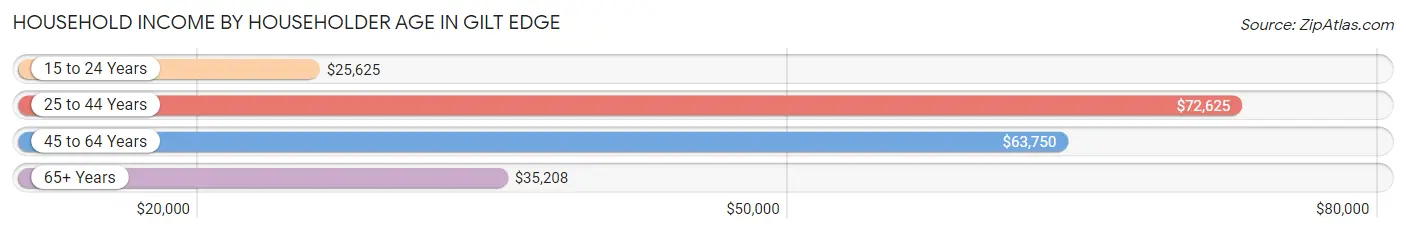
Household Income by Householder Age in Gilt Edge
The median household income in Gilt Edge is $48,906, with the highest median household income of $72,625 found in the 25 to 44 years age bracket for the primary householder. A total of 73 households (37.8%) fall into this category. Meanwhile, the 15 to 24 years age bracket for the primary householder has the lowest median household income of $25,625, with 11 households (5.7%) in this group.
| Income Bracket | # Households | Median Income |
| 15 to 24 Years | 11 (5.7%) | $25,625 |
| 25 to 44 Years | 73 (37.8%) | $72,625 |
| 45 to 64 Years | 64 (33.2%) | $63,750 |
| 65+ Years | 45 (23.3%) | $35,208 |
| Total | 193 (100.0%) | $48,906 |
Poverty in Gilt Edge
Income Below Poverty by Sex and Age in Gilt Edge
With 8.6% poverty level for males and 18.9% for females among the residents of Gilt Edge, under 5 year old males and 15 year old females are the most vulnerable to poverty, with 6 males (46.2%) and 2 females (66.7%) in their respective age groups living below the poverty level.
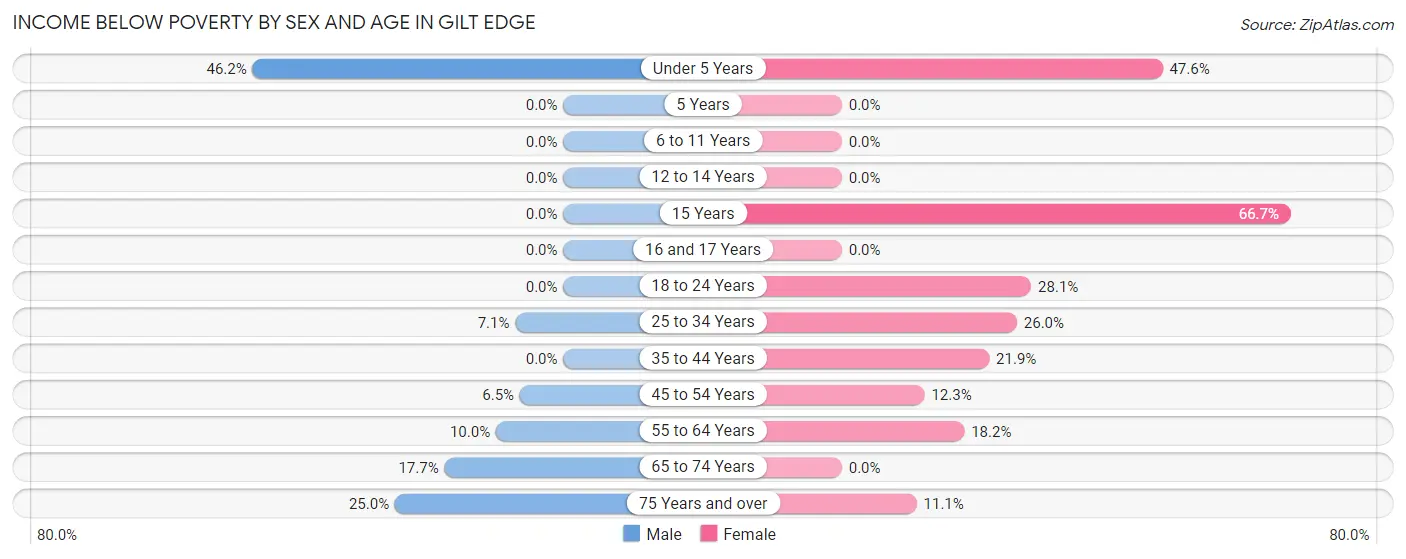
| Age Bracket | Male | Female |
| Under 5 Years | 6 (46.2%) | 10 (47.6%) |
| 5 Years | 0 (0.0%) | 0 (0.0%) |
| 6 to 11 Years | 0 (0.0%) | 0 (0.0%) |
| 12 to 14 Years | 0 (0.0%) | 0 (0.0%) |
| 15 Years | 0 (0.0%) | 2 (66.7%) |
| 16 and 17 Years | 0 (0.0%) | 0 (0.0%) |
| 18 to 24 Years | 0 (0.0%) | 9 (28.1%) |
| 25 to 34 Years | 2 (7.1%) | 13 (26.0%) |
| 35 to 44 Years | 0 (0.0%) | 7 (21.9%) |
| 45 to 54 Years | 2 (6.5%) | 7 (12.3%) |
| 55 to 64 Years | 3 (10.0%) | 4 (18.2%) |
| 65 to 74 Years | 3 (17.6%) | 0 (0.0%) |
| 75 Years and over | 4 (25.0%) | 1 (11.1%) |
| Total | 20 (8.6%) | 53 (18.9%) |
Income Above Poverty by Sex and Age in Gilt Edge
According to the poverty statistics in Gilt Edge, males aged 6 to 11 years and females aged 5 years are the age groups that are most secure financially, with 100.0% of males and 100.0% of females in these age groups living above the poverty line.
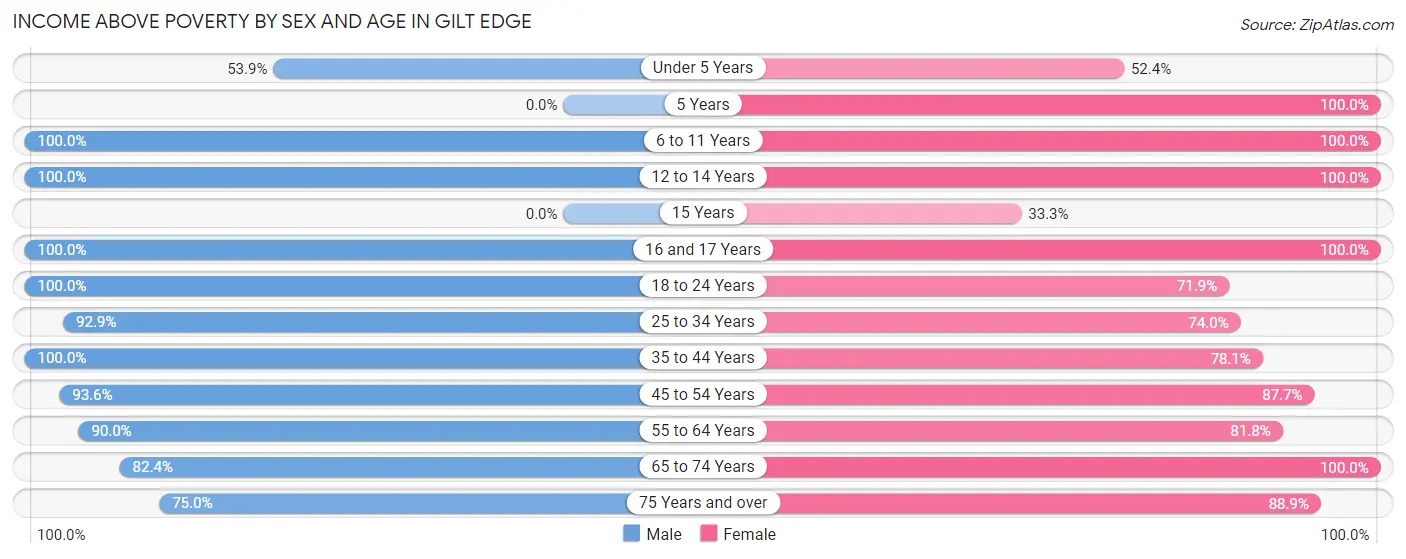
| Age Bracket | Male | Female |
| Under 5 Years | 7 (53.8%) | 11 (52.4%) |
| 5 Years | 0 (0.0%) | 7 (100.0%) |
| 6 to 11 Years | 19 (100.0%) | 11 (100.0%) |
| 12 to 14 Years | 7 (100.0%) | 9 (100.0%) |
| 15 Years | 0 (0.0%) | 1 (33.3%) |
| 16 and 17 Years | 9 (100.0%) | 7 (100.0%) |
| 18 to 24 Years | 18 (100.0%) | 23 (71.9%) |
| 25 to 34 Years | 26 (92.9%) | 37 (74.0%) |
| 35 to 44 Years | 44 (100.0%) | 25 (78.1%) |
| 45 to 54 Years | 29 (93.5%) | 50 (87.7%) |
| 55 to 64 Years | 27 (90.0%) | 18 (81.8%) |
| 65 to 74 Years | 14 (82.4%) | 20 (100.0%) |
| 75 Years and over | 12 (75.0%) | 8 (88.9%) |
| Total | 212 (91.4%) | 227 (81.1%) |
Income Below Poverty Among Married-Couple Families in Gilt Edge
The poverty statistics for married-couple families in Gilt Edge show that 2.1% or 2 of the total 96 families live below the poverty line. Families with no children have the highest poverty rate of 4.2%, comprising of 2 families. On the other hand, families with 1 or 2 children have the lowest poverty rate of 0.0%, which includes 0 families.
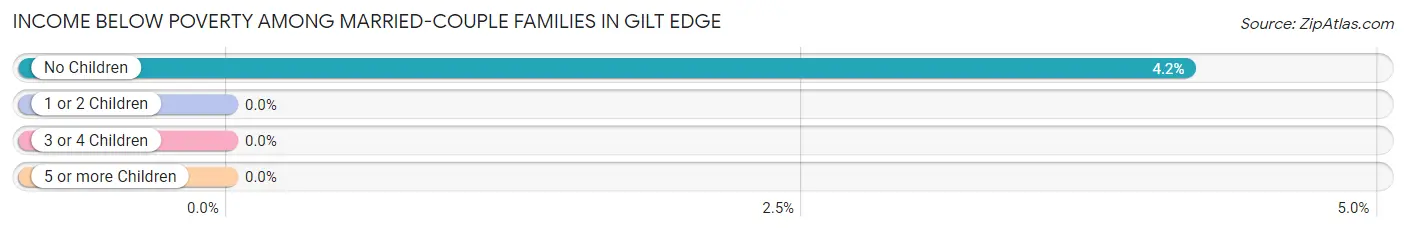
| Children | Above Poverty | Below Poverty |
| No Children | 46 (95.8%) | 2 (4.2%) |
| 1 or 2 Children | 46 (100.0%) | 0 (0.0%) |
| 3 or 4 Children | 2 (100.0%) | 0 (0.0%) |
| 5 or more Children | 0 (0.0%) | 0 (0.0%) |
| Total | 94 (97.9%) | 2 (2.1%) |
Income Below Poverty Among Single-Parent Households in Gilt Edge
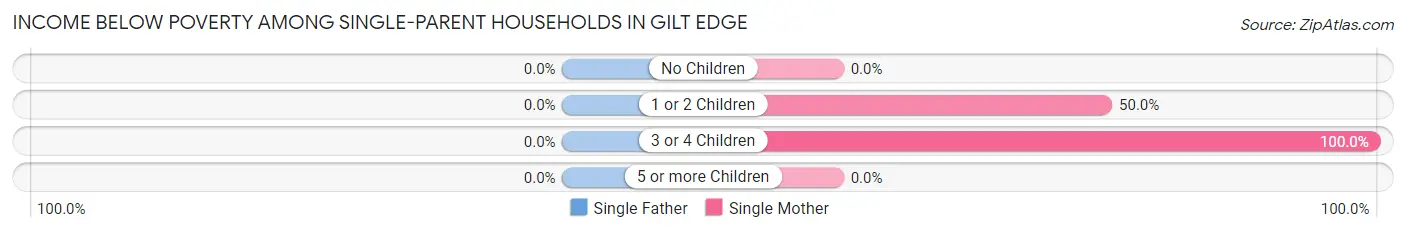
| Children | Single Father | Single Mother |
| No Children | 0 (0.0%) | 0 (0.0%) |
| 1 or 2 Children | 0 (0.0%) | 6 (50.0%) |
| 3 or 4 Children | 0 (0.0%) | 7 (100.0%) |
| 5 or more Children | 0 (0.0%) | 0 (0.0%) |
| Total | 0 (0.0%) | 13 (44.8%) |
Income Below Poverty Among Married-Couple vs Single-Parent Households in Gilt Edge
The poverty data for Gilt Edge shows that 2 of the married-couple family households (2.1%) and 13 of the single-parent households (33.3%) are living below the poverty level. Within the married-couple family households, those with no children have the highest poverty rate, with 2 households (4.2%) falling below the poverty line. Among the single-parent households, those with 3 or 4 children have the highest poverty rate, with 7 household (100.0%) living below poverty.
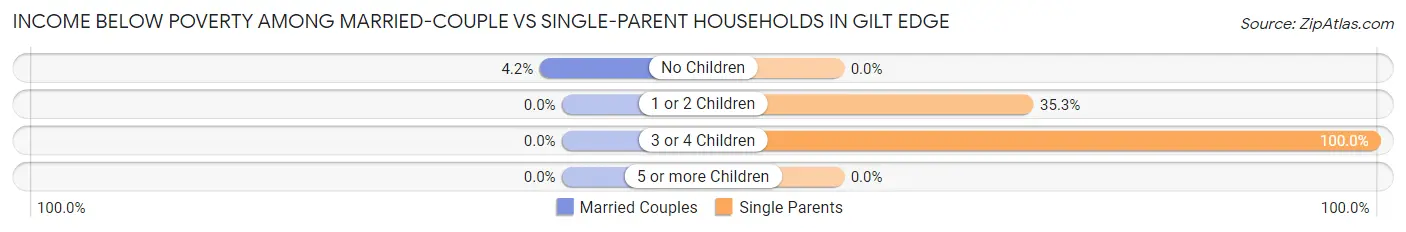
| Children | Married-Couple Families | Single-Parent Households |
| No Children | 2 (4.2%) | 0 (0.0%) |
| 1 or 2 Children | 0 (0.0%) | 6 (35.3%) |
| 3 or 4 Children | 0 (0.0%) | 7 (100.0%) |
| 5 or more Children | 0 (0.0%) | 0 (0.0%) |
| Total | 2 (2.1%) | 13 (33.3%) |
Race in Gilt Edge
The most populous races in Gilt Edge are White / Caucasian (470 | 91.6%), Black / African American (31 | 6.0%), and Two or more Races (12 | 2.3%).
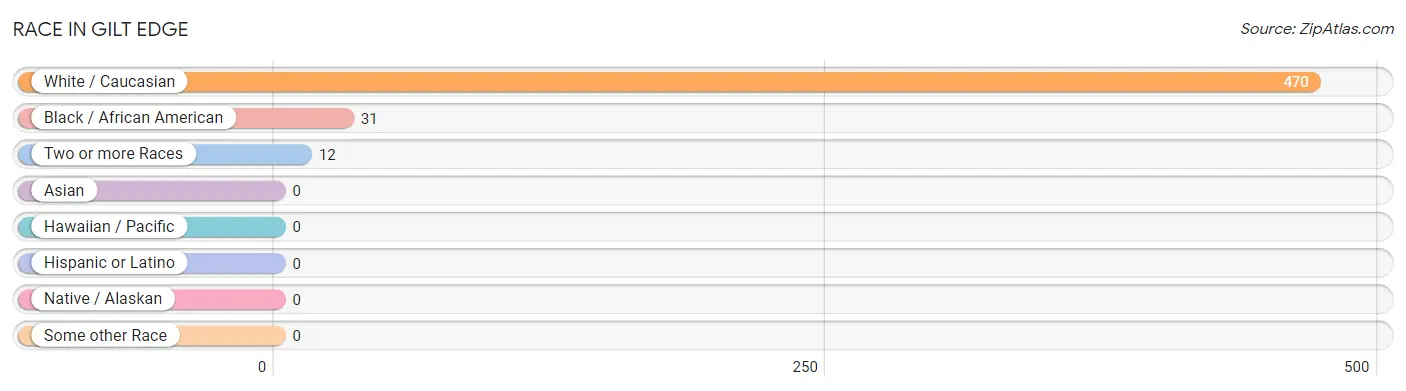
| Race | # Population | % Population |
| Asian | 0 | 0.0% |
| Black / African American | 31 | 6.0% |
| Hawaiian / Pacific | 0 | 0.0% |
| Hispanic or Latino | 0 | 0.0% |
| Native / Alaskan | 0 | 0.0% |
| White / Caucasian | 470 | 91.6% |
| Two or more Races | 12 | 2.3% |
| Some other Race | 0 | 0.0% |
| Total | 513 | 100.0% |
Ancestry in Gilt Edge
The most populous ancestries reported in Gilt Edge are American (192 | 37.4%), Irish (57 | 11.1%), English (41 | 8.0%), German (37 | 7.2%), and European (31 | 6.0%), together accounting for 69.8% of all Gilt Edge residents.
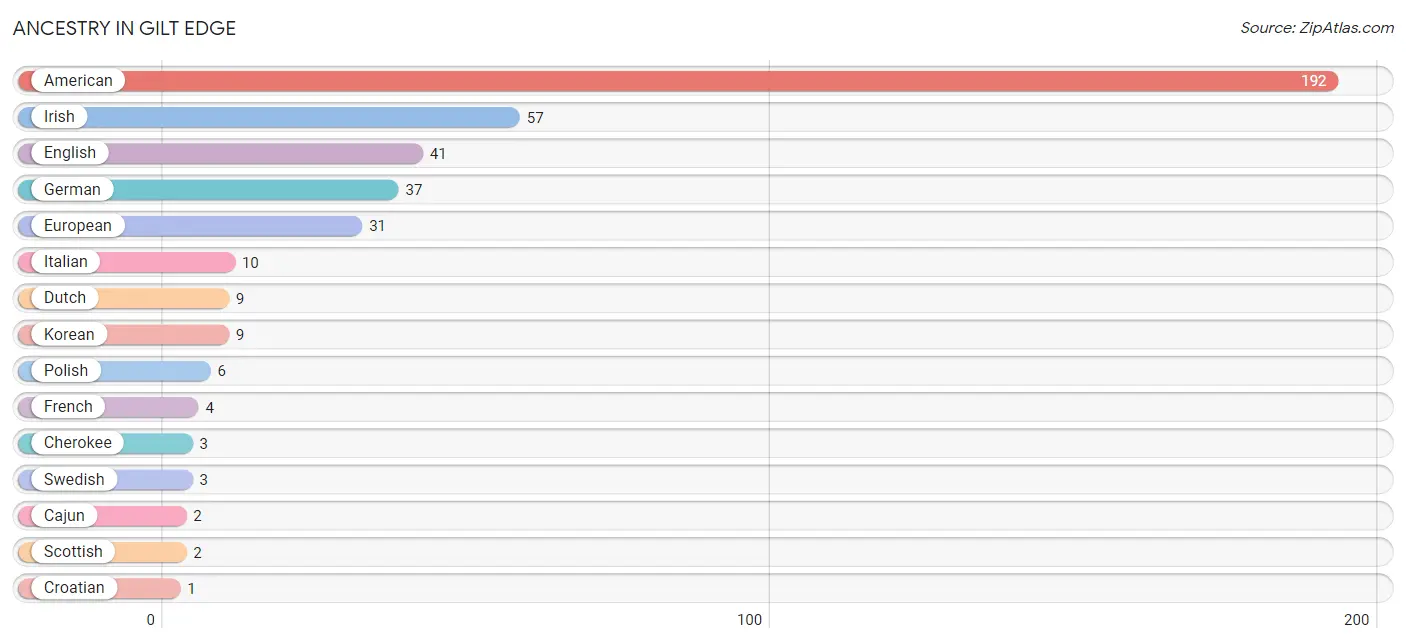
| Ancestry | # Population | % Population |
| American | 192 | 37.4% |
| Cajun | 2 | 0.4% |
| Cherokee | 3 | 0.6% |
| Croatian | 1 | 0.2% |
| Danish | 1 | 0.2% |
| Dutch | 9 | 1.8% |
| English | 41 | 8.0% |
| European | 31 | 6.0% |
| French | 4 | 0.8% |
| German | 37 | 7.2% |
| Irish | 57 | 11.1% |
| Italian | 10 | 1.9% |
| Korean | 9 | 1.8% |
| Polish | 6 | 1.2% |
| Scotch-Irish | 1 | 0.2% |
| Scottish | 2 | 0.4% |
| Swedish | 3 | 0.6% | View All 17 Rows |
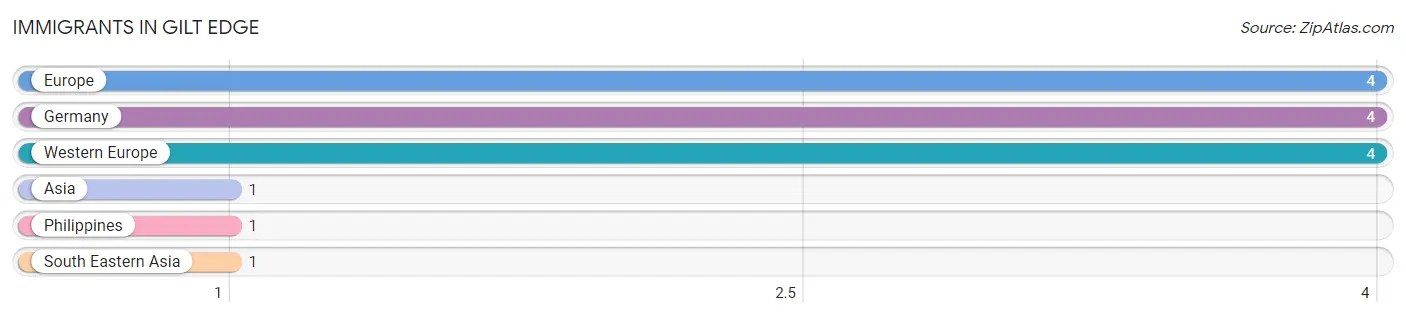
Immigrants in Gilt Edge
The most numerous immigrant groups reported in Gilt Edge came from Europe (4 | 0.8%), Germany (4 | 0.8%), Western Europe (4 | 0.8%), Asia (1 | 0.2%), and Philippines (1 | 0.2%), together accounting for 2.7% of all Gilt Edge residents.
| Immigration Origin | # Population | % Population |
| Asia | 1 | 0.2% |
| Europe | 4 | 0.8% |
| Germany | 4 | 0.8% |
| Philippines | 1 | 0.2% |
| South Eastern Asia | 1 | 0.2% |
| Western Europe | 4 | 0.8% | View All 6 Rows |
Sex and Age in Gilt Edge
Sex and Age in Gilt Edge
The most populous age groups in Gilt Edge are 35 to 39 Years (30 | 12.9%) for men and 45 to 49 Years (42 | 15.0%) for women.
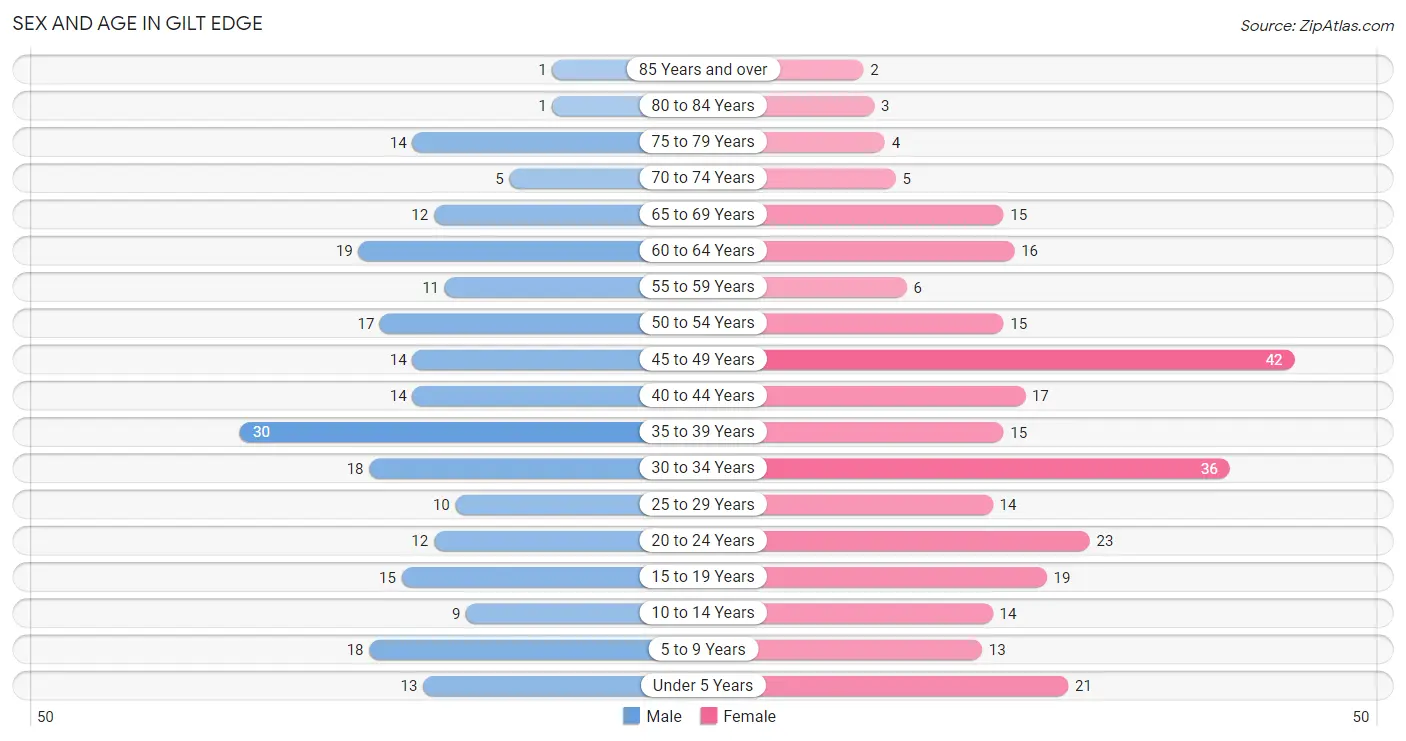
| Age Bracket | Male | Female |
| Under 5 Years | 13 (5.6%) | 21 (7.5%) |
| 5 to 9 Years | 18 (7.7%) | 13 (4.6%) |
| 10 to 14 Years | 9 (3.9%) | 14 (5.0%) |
| 15 to 19 Years | 15 (6.4%) | 19 (6.8%) |
| 20 to 24 Years | 12 (5.1%) | 23 (8.2%) |
| 25 to 29 Years | 10 (4.3%) | 14 (5.0%) |
| 30 to 34 Years | 18 (7.7%) | 36 (12.9%) |
| 35 to 39 Years | 30 (12.9%) | 15 (5.4%) |
| 40 to 44 Years | 14 (6.0%) | 17 (6.1%) |
| 45 to 49 Years | 14 (6.0%) | 42 (15.0%) |
| 50 to 54 Years | 17 (7.3%) | 15 (5.4%) |
| 55 to 59 Years | 11 (4.7%) | 6 (2.1%) |
| 60 to 64 Years | 19 (8.2%) | 16 (5.7%) |
| 65 to 69 Years | 12 (5.1%) | 15 (5.4%) |
| 70 to 74 Years | 5 (2.1%) | 5 (1.8%) |
| 75 to 79 Years | 14 (6.0%) | 4 (1.4%) |
| 80 to 84 Years | 1 (0.4%) | 3 (1.1%) |
| 85 Years and over | 1 (0.4%) | 2 (0.7%) |
| Total | 233 (100.0%) | 280 (100.0%) |
Families and Households in Gilt Edge
Median Family Size in Gilt Edge
The median family size in Gilt Edge is 2.95 persons per family, with married-couple families (96 | 71.1%) accounting for the largest median family size of 3.21 persons per family. On the other hand, single female/mother families (29 | 21.5%) represent the smallest median family size with 2.28 persons per family.
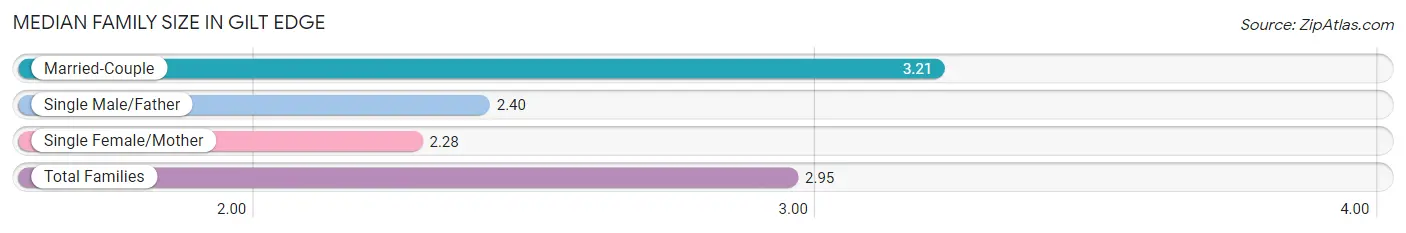
| Family Type | # Families | Family Size |
| Married-Couple | 96 (71.1%) | 3.21 |
| Single Male/Father | 10 (7.4%) | 2.40 |
| Single Female/Mother | 29 (21.5%) | 2.28 |
| Total Families | 135 (100.0%) | 2.95 |
Median Household Size in Gilt Edge
The median household size in Gilt Edge is 2.54 persons per household, with married-couple households (96 | 49.7%) accounting for the largest median household size of 3.21 persons per household. non-family households (58 | 30.0%) represent the smallest median household size with 1.45 persons per household.
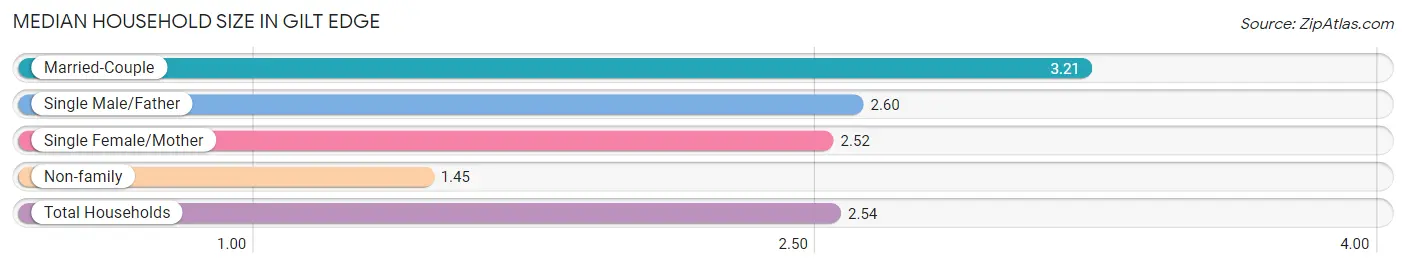
| Household Type | # Households | Household Size |
| Married-Couple | 96 (49.7%) | 3.21 |
| Single Male/Father | 10 (5.2%) | 2.60 |
| Single Female/Mother | 29 (15.0%) | 2.52 |
| Non-family | 58 (30.0%) | 1.45 |
| Total Households | 193 (100.0%) | 2.54 |
Household Size by Marriage Status in Gilt Edge
Out of a total of 193 households in Gilt Edge, 135 (70.0%) are family households, while 58 (30.0%) are nonfamily households. The most numerous type of family households are 2-person households, comprising 52, and the most common type of nonfamily households are 1-person households, comprising 38.
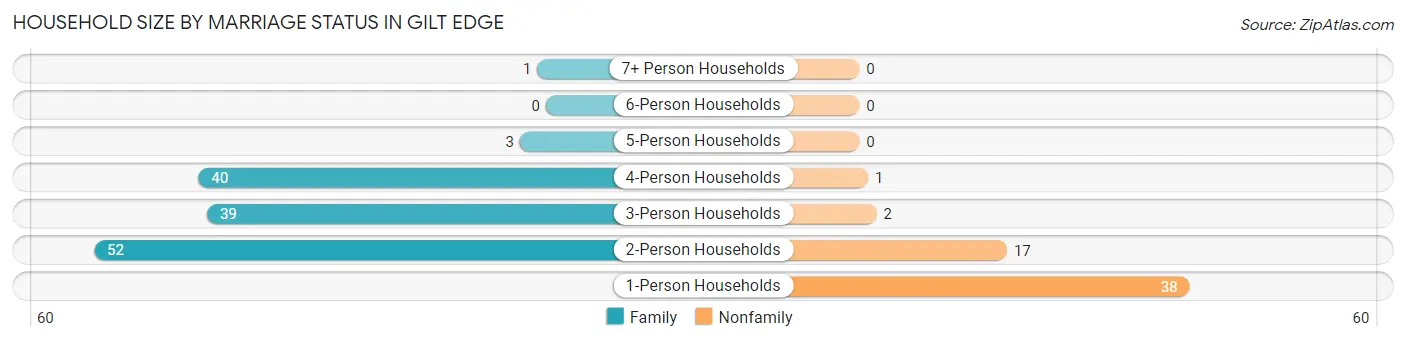
| Household Size | Family Households | Nonfamily Households |
| 1-Person Households | - | 38 (19.7%) |
| 2-Person Households | 52 (26.9%) | 17 (8.8%) |
| 3-Person Households | 39 (20.2%) | 2 (1.0%) |
| 4-Person Households | 40 (20.7%) | 1 (0.5%) |
| 5-Person Households | 3 (1.5%) | 0 (0.0%) |
| 6-Person Households | 0 (0.0%) | 0 (0.0%) |
| 7+ Person Households | 1 (0.5%) | 0 (0.0%) |
| Total | 135 (70.0%) | 58 (30.0%) |
Female Fertility in Gilt Edge
Fertility by Age in Gilt Edge
Average fertility rate in Gilt Edge is 65.0 births per 1,000 women. Women in the age bracket of 20 to 34 years have the highest fertility rate with 137.0 births per 1,000 women. Women in the age bracket of 20 to 34 years acount for 90.9% of all women with births.
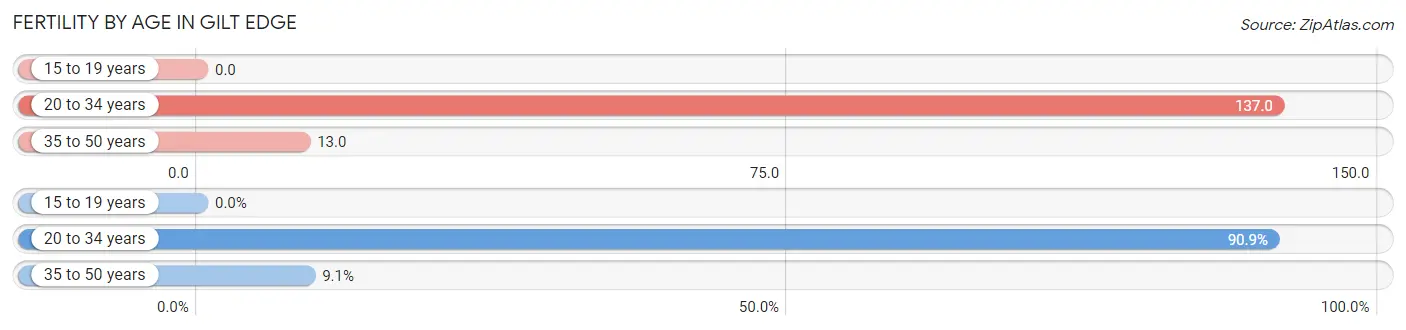
| Age Bracket | Women with Births | Births / 1,000 Women |
| 15 to 19 years | 0 (0.0%) | 0.0 |
| 20 to 34 years | 10 (90.9%) | 137.0 |
| 35 to 50 years | 1 (9.1%) | 13.0 |
| Total | 11 (100.0%) | 65.0 |
Fertility by Age by Marriage Status in Gilt Edge
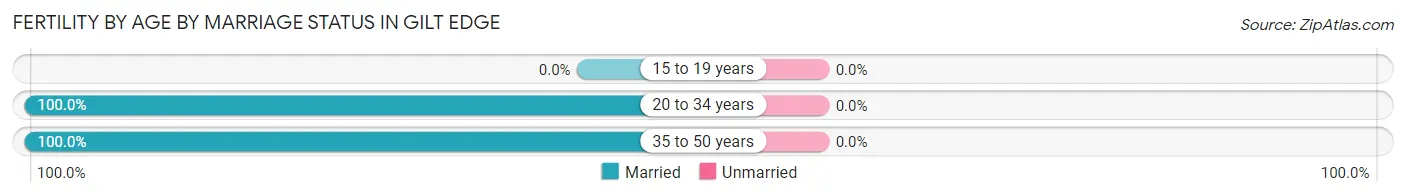
| Age Bracket | Married | Unmarried |
| 15 to 19 years | 0 (0.0%) | 0 (0.0%) |
| 20 to 34 years | 10 (100.0%) | 0 (0.0%) |
| 35 to 50 years | 1 (100.0%) | 0 (0.0%) |
| Total | 11 (100.0%) | 0 (0.0%) |
Fertility by Education in Gilt Edge
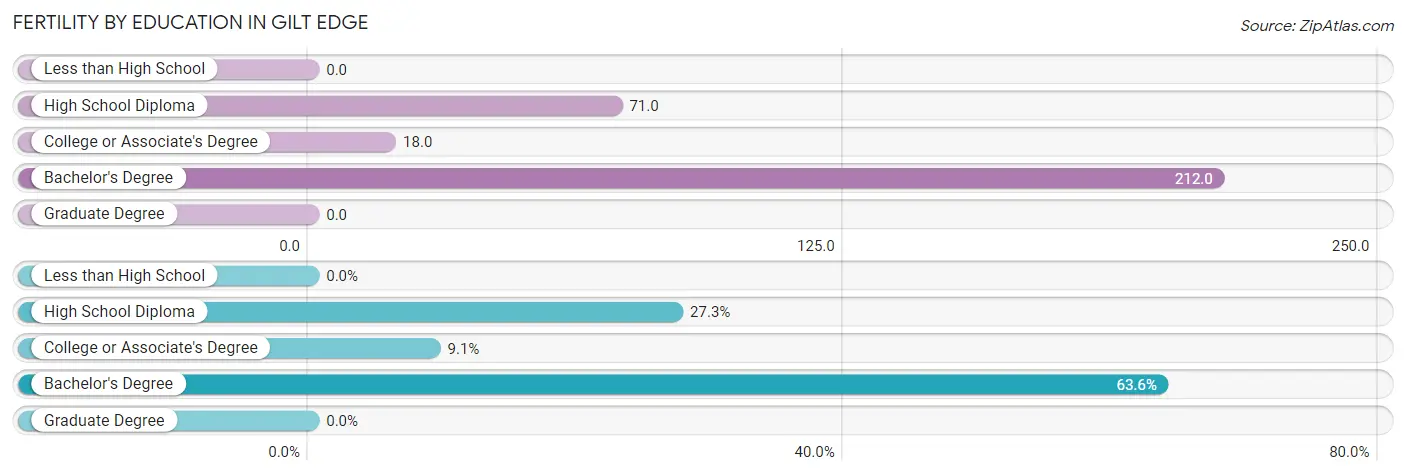
| Educational Attainment | Women with Births | Births / 1,000 Women |
| Less than High School | 0 (0.0%) | 0.0 |
| High School Diploma | 3 (27.3%) | 71.0 |
| College or Associate's Degree | 1 (9.1%) | 18.0 |
| Bachelor's Degree | 7 (63.6%) | 212.0 |
| Graduate Degree | 0 (0.0%) | 0.0 |
| Total | 11 (100.0%) | 65.0 |
Fertility by Education by Marriage Status in Gilt Edge
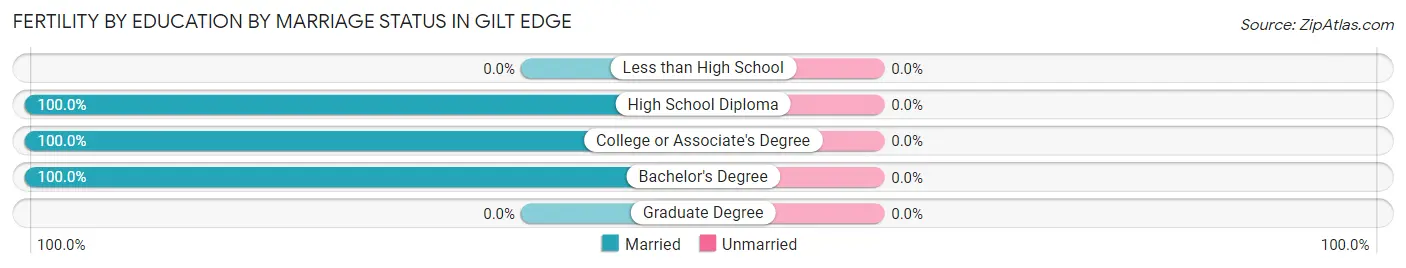
| Educational Attainment | Married | Unmarried |
| Less than High School | 0 (0.0%) | 0 (0.0%) |
| High School Diploma | 3 (100.0%) | 0 (0.0%) |
| College or Associate's Degree | 1 (100.0%) | 0 (0.0%) |
| Bachelor's Degree | 7 (100.0%) | 0 (0.0%) |
| Graduate Degree | 0 (0.0%) | 0 (0.0%) |
| Total | 11 (100.0%) | 0 (0.0%) |
Employment Characteristics in Gilt Edge
Employment by Class of Employer in Gilt Edge
Among the 263 employed individuals in Gilt Edge, private company employees (175 | 66.5%), self-employed (not incorporated) (25 | 9.5%), and local government employees (19 | 7.2%) make up the most common classes of employment.
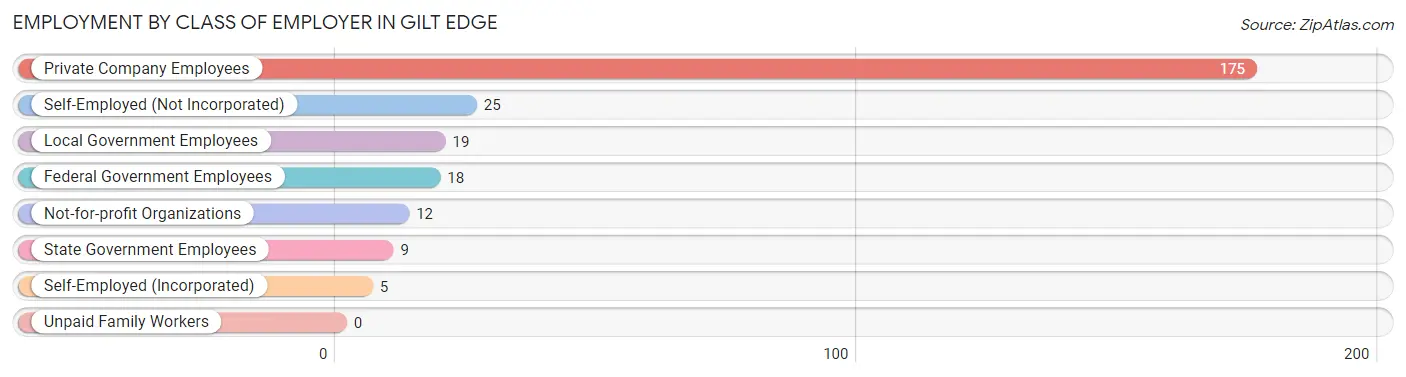
| Employer Class | # Employees | % Employees |
| Private Company Employees | 175 | 66.5% |
| Self-Employed (Incorporated) | 5 | 1.9% |
| Self-Employed (Not Incorporated) | 25 | 9.5% |
| Not-for-profit Organizations | 12 | 4.6% |
| Local Government Employees | 19 | 7.2% |
| State Government Employees | 9 | 3.4% |
| Federal Government Employees | 18 | 6.8% |
| Unpaid Family Workers | 0 | 0.0% |
| Total | 263 | 100.0% |
Employment Status by Age in Gilt Edge
According to the labor force statistics for Gilt Edge, out of the total population over 16 years of age (422), 64.7% or 273 individuals are in the labor force, with 3.3% or 9 of them unemployed. The age group with the highest labor force participation rate is 30 to 34 years, with 100.0% or 54 individuals in the labor force. Within the labor force, the 65 to 74 years age range has the highest percentage of unemployed individuals, with 50.0% or 3 of them being unemployed.
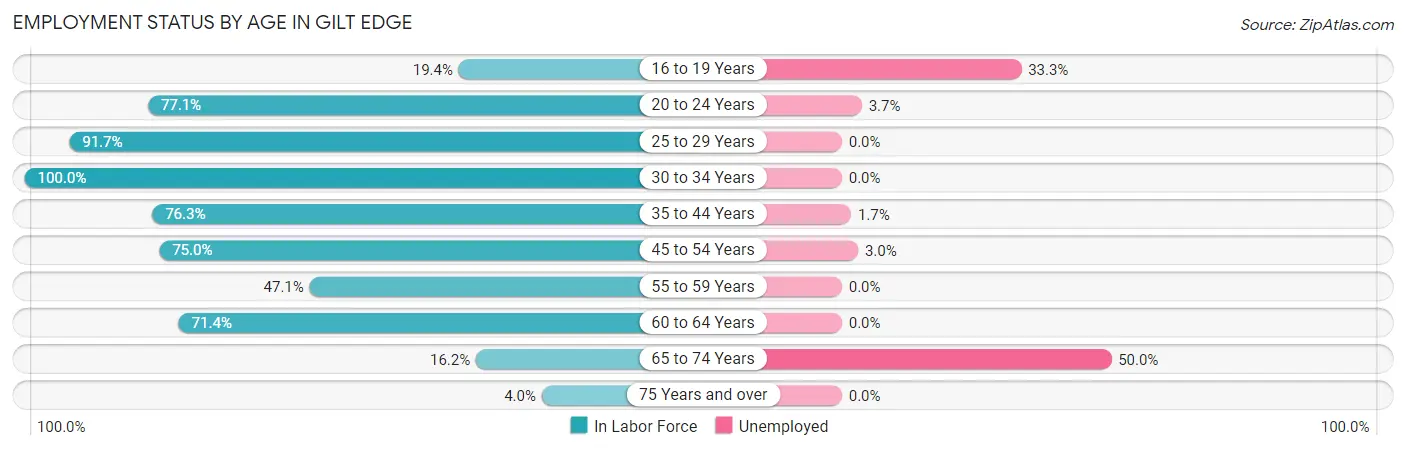
| Age Bracket | In Labor Force | Unemployed |
| 16 to 19 Years | 6 (19.4%) | 2 (33.3%) |
| 20 to 24 Years | 27 (77.1%) | 1 (3.7%) |
| 25 to 29 Years | 22 (91.7%) | 0 (0.0%) |
| 30 to 34 Years | 54 (100.0%) | 0 (0.0%) |
| 35 to 44 Years | 58 (76.3%) | 1 (1.7%) |
| 45 to 54 Years | 66 (75.0%) | 2 (3.0%) |
| 55 to 59 Years | 8 (47.1%) | 0 (0.0%) |
| 60 to 64 Years | 25 (71.4%) | 0 (0.0%) |
| 65 to 74 Years | 6 (16.2%) | 3 (50.0%) |
| 75 Years and over | 1 (4.0%) | 0 (0.0%) |
| Total | 273 (64.7%) | 9 (3.3%) |
Employment Status by Educational Attainment in Gilt Edge
According to labor force statistics for Gilt Edge, 79.3% of individuals (233) out of the total population between 25 and 64 years of age (294) are in the labor force, with 1.3% or 3 of them being unemployed. The group with the highest labor force participation rate are those with the educational attainment of bachelor's degree or higher, with 94.0% or 47 individuals in the labor force. Within the labor force, individuals with less than high school education have the highest percentage of unemployment, with 3.8% or 2 of them being unemployed.
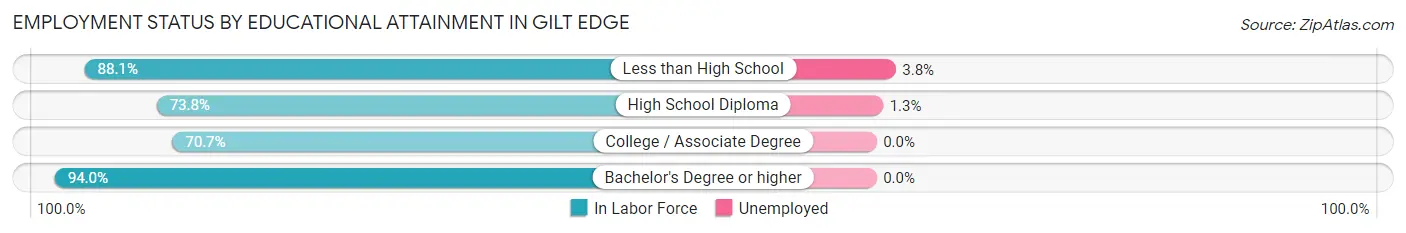
| Educational Attainment | In Labor Force | Unemployed |
| Less than High School | 52 (88.1%) | 2 (3.8%) |
| High School Diploma | 76 (73.8%) | 1 (1.3%) |
| College / Associate Degree | 58 (70.7%) | 0 (0.0%) |
| Bachelor's Degree or higher | 47 (94.0%) | 0 (0.0%) |
| Total | 233 (79.3%) | 4 (1.3%) |
Employment Occupations by Sex in Gilt Edge
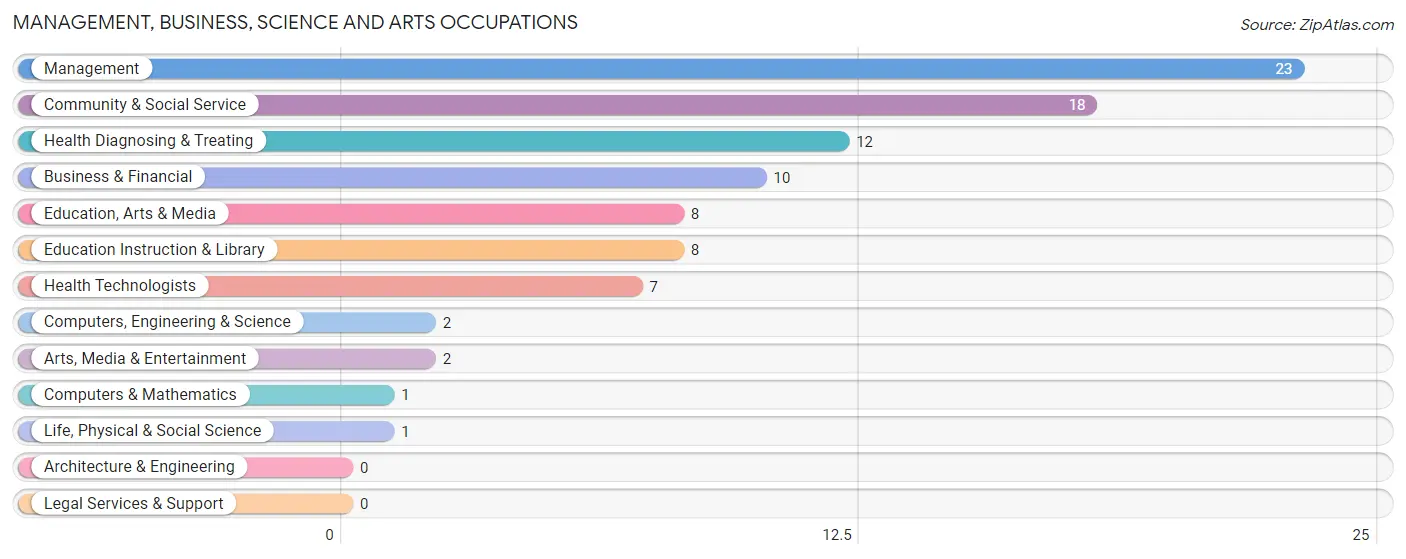
Management, Business, Science and Arts Occupations
The most common Management, Business, Science and Arts occupations in Gilt Edge are Management (23 | 8.7%), Community & Social Service (18 | 6.8%), Health Diagnosing & Treating (12 | 4.5%), Business & Financial (10 | 3.8%), and Education, Arts & Media (8 | 3.0%).
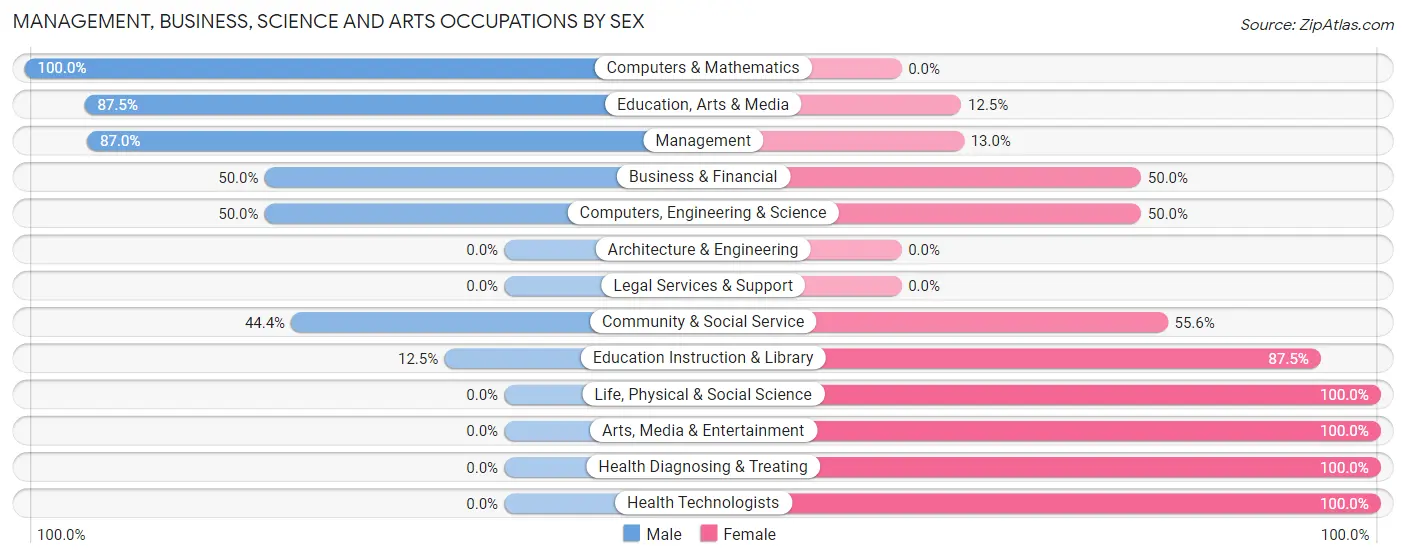
Management, Business, Science and Arts Occupations by Sex
Within the Management, Business, Science and Arts occupations in Gilt Edge, the most male-oriented occupations are Computers & Mathematics (100.0%), Education, Arts & Media (87.5%), and Management (87.0%), while the most female-oriented occupations are Life, Physical & Social Science (100.0%), Arts, Media & Entertainment (100.0%), and Health Diagnosing & Treating (100.0%).
| Occupation | Male | Female |
| Management | 20 (87.0%) | 3 (13.0%) |
| Business & Financial | 5 (50.0%) | 5 (50.0%) |
| Computers, Engineering & Science | 1 (50.0%) | 1 (50.0%) |
| Computers & Mathematics | 1 (100.0%) | 0 (0.0%) |
| Architecture & Engineering | 0 (0.0%) | 0 (0.0%) |
| Life, Physical & Social Science | 0 (0.0%) | 1 (100.0%) |
| Community & Social Service | 8 (44.4%) | 10 (55.6%) |
| Education, Arts & Media | 7 (87.5%) | 1 (12.5%) |
| Legal Services & Support | 0 (0.0%) | 0 (0.0%) |
| Education Instruction & Library | 1 (12.5%) | 7 (87.5%) |
| Arts, Media & Entertainment | 0 (0.0%) | 2 (100.0%) |
| Health Diagnosing & Treating | 0 (0.0%) | 12 (100.0%) |
| Health Technologists | 0 (0.0%) | 7 (100.0%) |
| Total (Category) | 34 (52.3%) | 31 (47.7%) |
| Total (Overall) | 120 (45.5%) | 144 (54.5%) |
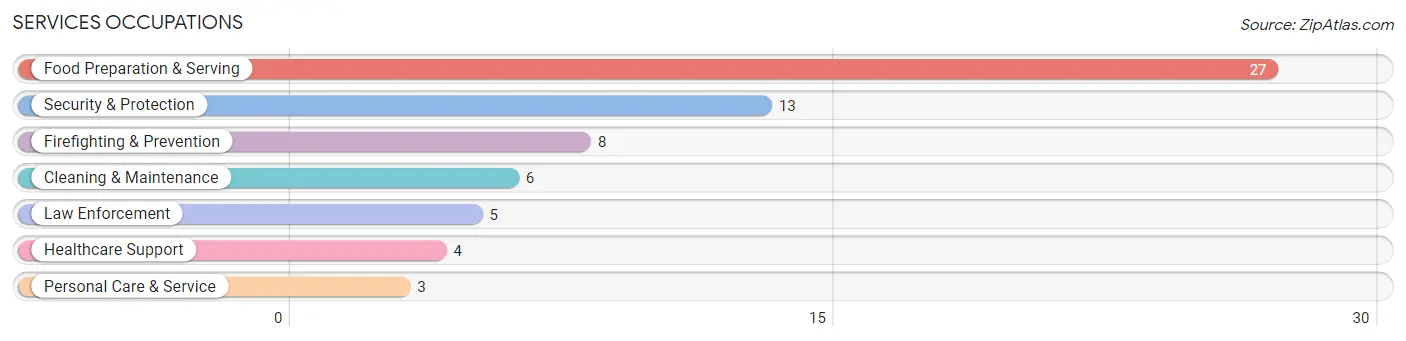
Services Occupations
The most common Services occupations in Gilt Edge are Food Preparation & Serving (27 | 10.2%), Security & Protection (13 | 4.9%), Firefighting & Prevention (8 | 3.0%), Cleaning & Maintenance (6 | 2.3%), and Law Enforcement (5 | 1.9%).
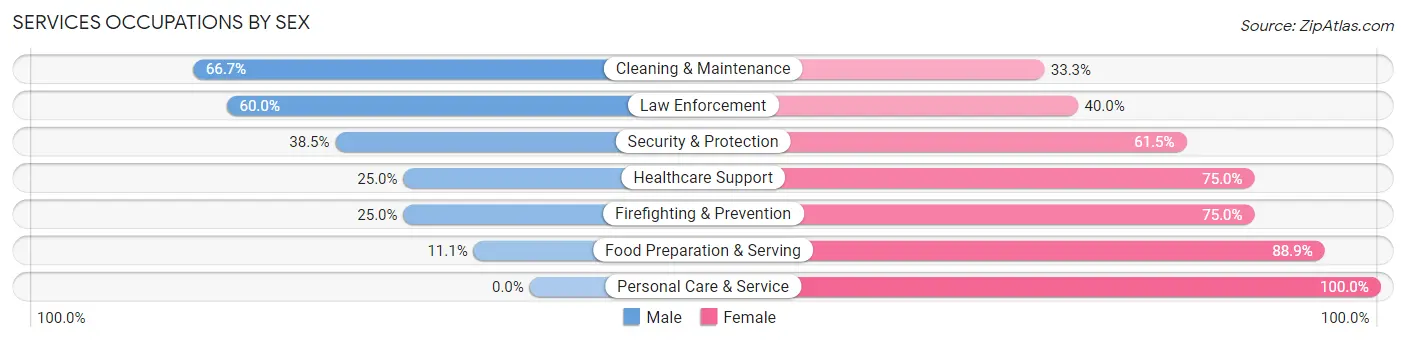
Services Occupations by Sex
Within the Services occupations in Gilt Edge, the most male-oriented occupations are Cleaning & Maintenance (66.7%), Law Enforcement (60.0%), and Security & Protection (38.5%), while the most female-oriented occupations are Personal Care & Service (100.0%), Food Preparation & Serving (88.9%), and Healthcare Support (75.0%).
| Occupation | Male | Female |
| Healthcare Support | 1 (25.0%) | 3 (75.0%) |
| Security & Protection | 5 (38.5%) | 8 (61.5%) |
| Firefighting & Prevention | 2 (25.0%) | 6 (75.0%) |
| Law Enforcement | 3 (60.0%) | 2 (40.0%) |
| Food Preparation & Serving | 3 (11.1%) | 24 (88.9%) |
| Cleaning & Maintenance | 4 (66.7%) | 2 (33.3%) |
| Personal Care & Service | 0 (0.0%) | 3 (100.0%) |
| Total (Category) | 13 (24.5%) | 40 (75.5%) |
| Total (Overall) | 120 (45.5%) | 144 (54.5%) |
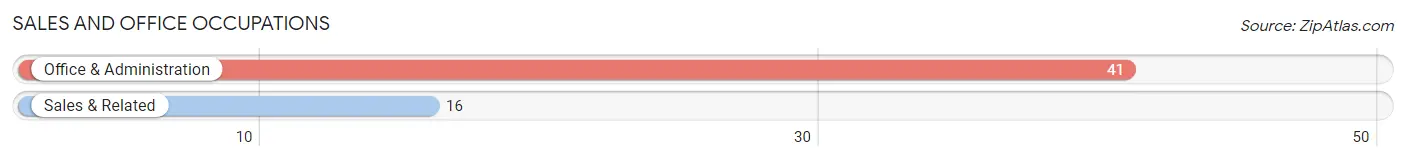
Sales and Office Occupations
The most common Sales and Office occupations in Gilt Edge are Office & Administration (41 | 15.5%), and Sales & Related (16 | 6.1%).
Sales and Office Occupations by Sex
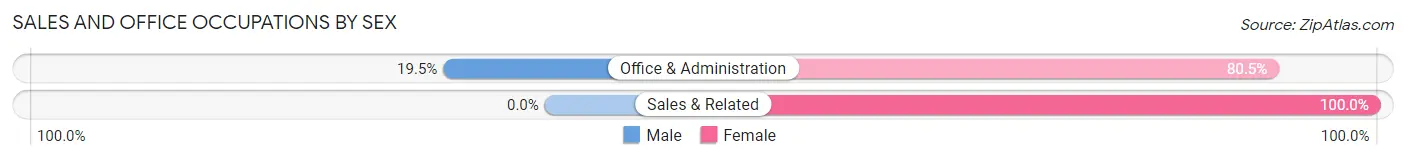
| Occupation | Male | Female |
| Sales & Related | 0 (0.0%) | 16 (100.0%) |
| Office & Administration | 8 (19.5%) | 33 (80.5%) |
| Total (Category) | 8 (14.0%) | 49 (86.0%) |
| Total (Overall) | 120 (45.5%) | 144 (54.5%) |
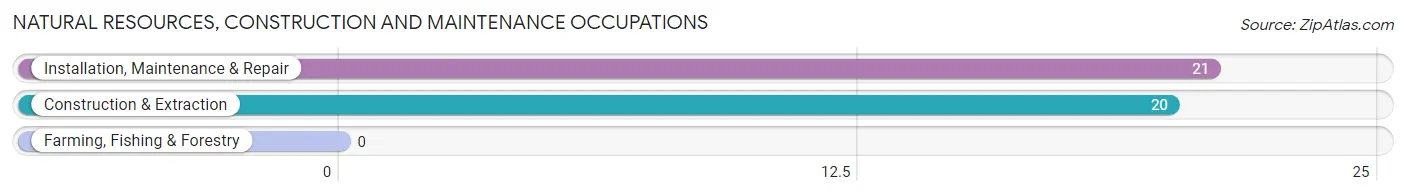
Natural Resources, Construction and Maintenance Occupations
The most common Natural Resources, Construction and Maintenance occupations in Gilt Edge are Installation, Maintenance & Repair (21 | 8.0%), and Construction & Extraction (20 | 7.6%).
Natural Resources, Construction and Maintenance Occupations by Sex
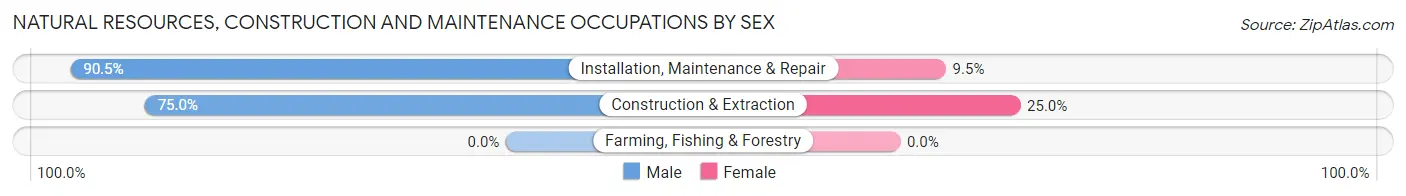
| Occupation | Male | Female |
| Farming, Fishing & Forestry | 0 (0.0%) | 0 (0.0%) |
| Construction & Extraction | 15 (75.0%) | 5 (25.0%) |
| Installation, Maintenance & Repair | 19 (90.5%) | 2 (9.5%) |
| Total (Category) | 34 (82.9%) | 7 (17.1%) |
| Total (Overall) | 120 (45.5%) | 144 (54.5%) |
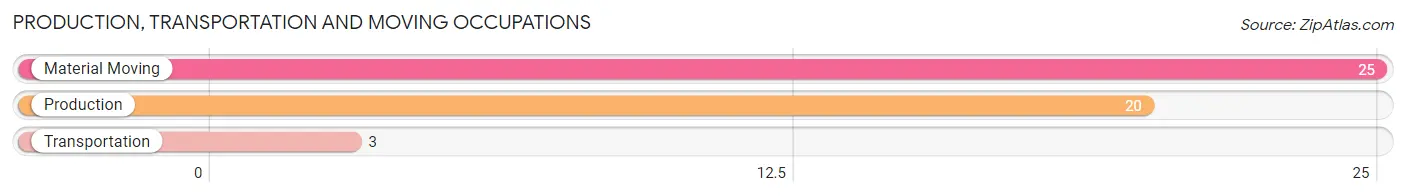
Production, Transportation and Moving Occupations
The most common Production, Transportation and Moving occupations in Gilt Edge are Material Moving (25 | 9.5%), Production (20 | 7.6%), and Transportation (3 | 1.1%).
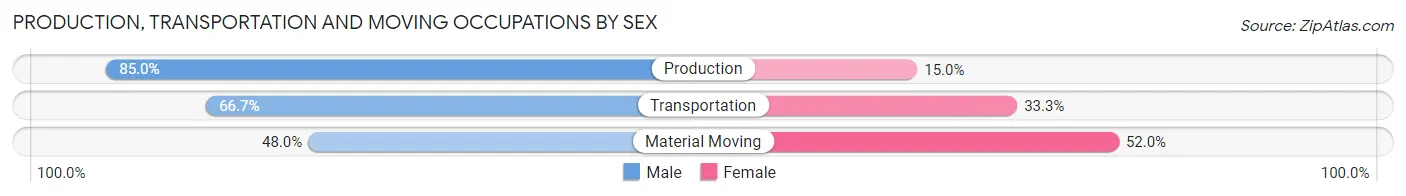
Production, Transportation and Moving Occupations by Sex
| Occupation | Male | Female |
| Production | 17 (85.0%) | 3 (15.0%) |
| Transportation | 2 (66.7%) | 1 (33.3%) |
| Material Moving | 12 (48.0%) | 13 (52.0%) |
| Total (Category) | 31 (64.6%) | 17 (35.4%) |
| Total (Overall) | 120 (45.5%) | 144 (54.5%) |
Employment Industries by Sex in Gilt Edge
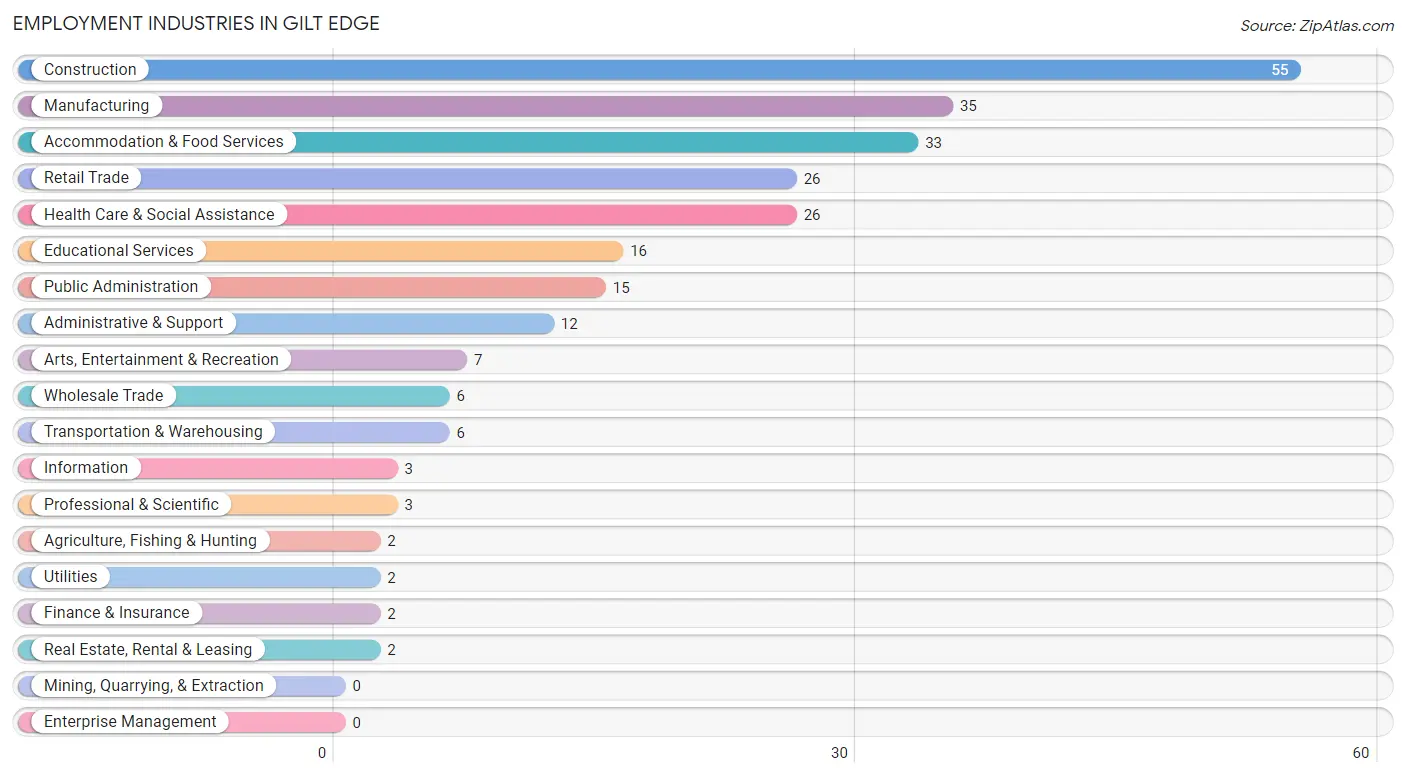
Employment Industries in Gilt Edge
The major employment industries in Gilt Edge include Construction (55 | 20.8%), Manufacturing (35 | 13.3%), Accommodation & Food Services (33 | 12.5%), Retail Trade (26 | 9.9%), and Health Care & Social Assistance (26 | 9.9%).
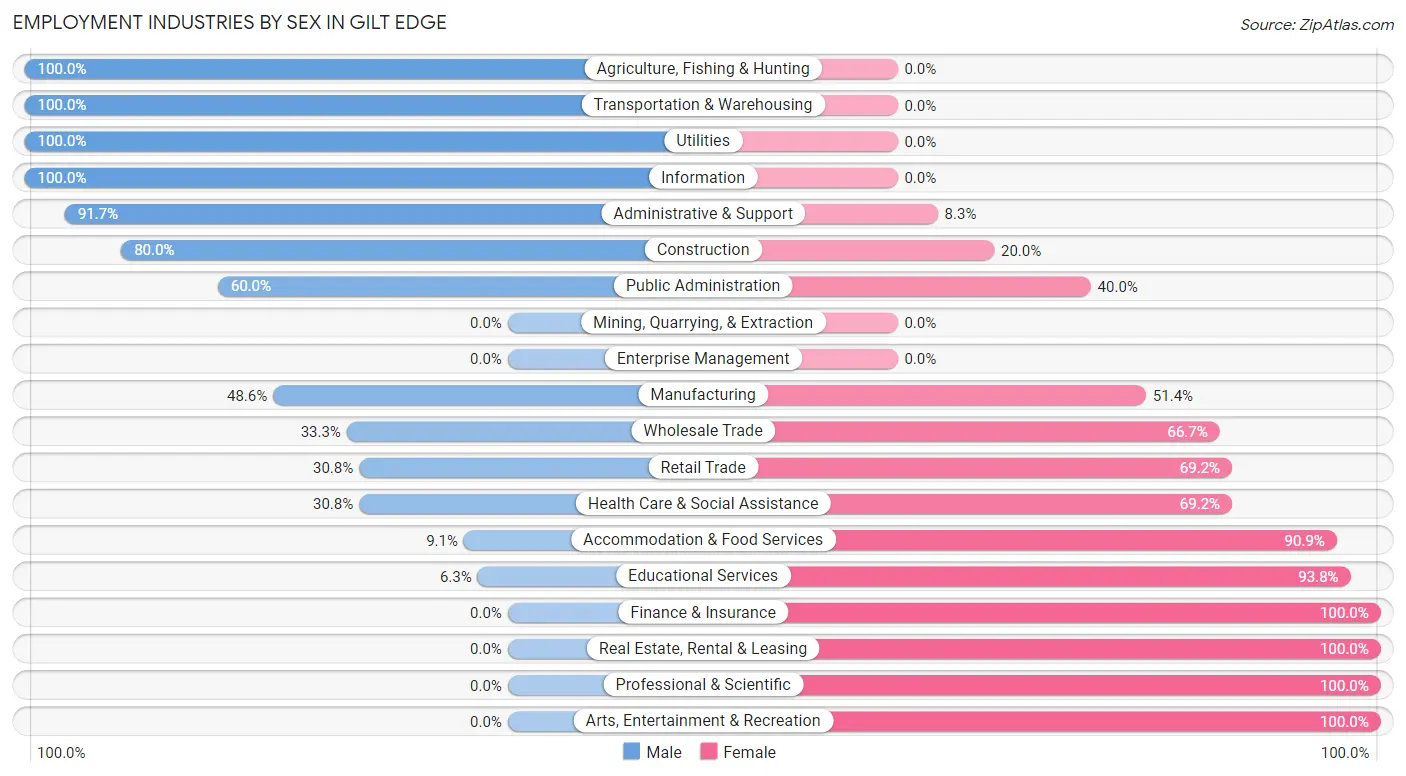
Employment Industries by Sex in Gilt Edge
The Gilt Edge industries that see more men than women are Agriculture, Fishing & Hunting (100.0%), Transportation & Warehousing (100.0%), and Utilities (100.0%), whereas the industries that tend to have a higher number of women are Finance & Insurance (100.0%), Real Estate, Rental & Leasing (100.0%), and Professional & Scientific (100.0%).
| Industry | Male | Female |
| Agriculture, Fishing & Hunting | 2 (100.0%) | 0 (0.0%) |
| Mining, Quarrying, & Extraction | 0 (0.0%) | 0 (0.0%) |
| Construction | 44 (80.0%) | 11 (20.0%) |
| Manufacturing | 17 (48.6%) | 18 (51.4%) |
| Wholesale Trade | 2 (33.3%) | 4 (66.7%) |
| Retail Trade | 8 (30.8%) | 18 (69.2%) |
| Transportation & Warehousing | 6 (100.0%) | 0 (0.0%) |
| Utilities | 2 (100.0%) | 0 (0.0%) |
| Information | 3 (100.0%) | 0 (0.0%) |
| Finance & Insurance | 0 (0.0%) | 2 (100.0%) |
| Real Estate, Rental & Leasing | 0 (0.0%) | 2 (100.0%) |
| Professional & Scientific | 0 (0.0%) | 3 (100.0%) |
| Enterprise Management | 0 (0.0%) | 0 (0.0%) |
| Administrative & Support | 11 (91.7%) | 1 (8.3%) |
| Educational Services | 1 (6.2%) | 15 (93.8%) |
| Health Care & Social Assistance | 8 (30.8%) | 18 (69.2%) |
| Arts, Entertainment & Recreation | 0 (0.0%) | 7 (100.0%) |
| Accommodation & Food Services | 3 (9.1%) | 30 (90.9%) |
| Public Administration | 9 (60.0%) | 6 (40.0%) |
| Total | 120 (45.5%) | 144 (54.5%) |
Education in Gilt Edge
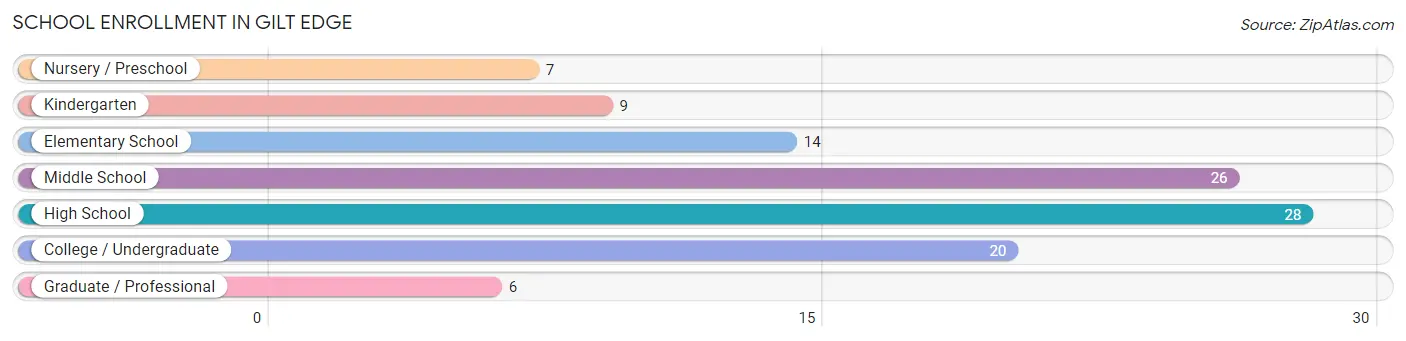
School Enrollment in Gilt Edge
The most common levels of schooling among the 110 students in Gilt Edge are high school (28 | 25.5%), middle school (26 | 23.6%), and college / undergraduate (20 | 18.2%).
| School Level | # Students | % Students |
| Nursery / Preschool | 7 | 6.4% |
| Kindergarten | 9 | 8.2% |
| Elementary School | 14 | 12.7% |
| Middle School | 26 | 23.6% |
| High School | 28 | 25.5% |
| College / Undergraduate | 20 | 18.2% |
| Graduate / Professional | 6 | 5.4% |
| Total | 110 | 100.0% |
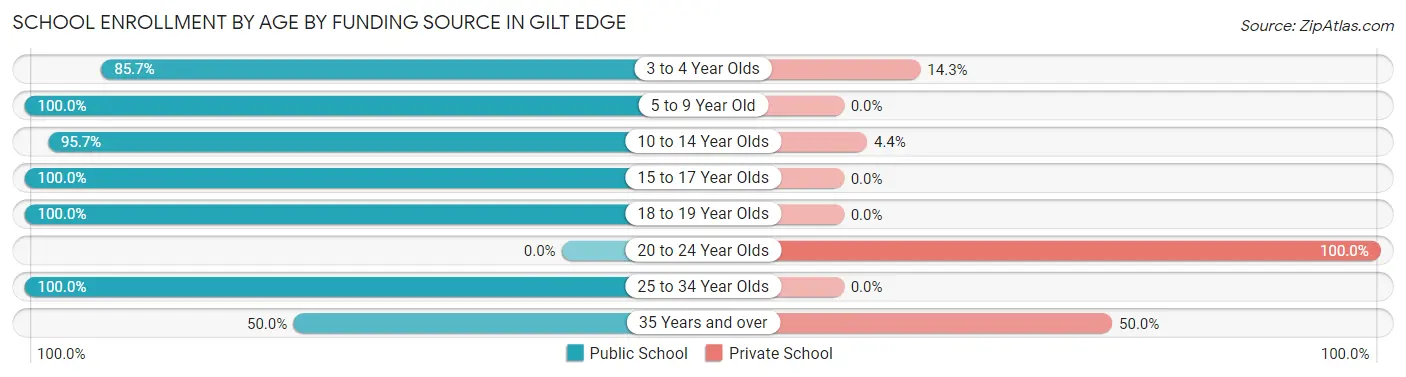
School Enrollment by Age by Funding Source in Gilt Edge
Out of a total of 110 students who are enrolled in schools in Gilt Edge, 13 (11.8%) attend a private institution, while the remaining 97 (88.2%) are enrolled in public schools. The age group of 20 to 24 year olds has the highest likelihood of being enrolled in private schools, with 10 (100.0% in the age bracket) enrolled. Conversely, the age group of 5 to 9 year old has the lowest likelihood of being enrolled in a private school, with 26 (100.0% in the age bracket) attending a public institution.
| Age Bracket | Public School | Private School |
| 3 to 4 Year Olds | 6 (85.7%) | 1 (14.3%) |
| 5 to 9 Year Old | 26 (100.0%) | 0 (0.0%) |
| 10 to 14 Year Olds | 22 (95.7%) | 1 (4.3%) |
| 15 to 17 Year Olds | 19 (100.0%) | 0 (0.0%) |
| 18 to 19 Year Olds | 10 (100.0%) | 0 (0.0%) |
| 20 to 24 Year Olds | 0 (0.0%) | 10 (100.0%) |
| 25 to 34 Year Olds | 13 (100.0%) | 0 (0.0%) |
| 35 Years and over | 1 (50.0%) | 1 (50.0%) |
| Total | 97 (88.2%) | 13 (11.8%) |
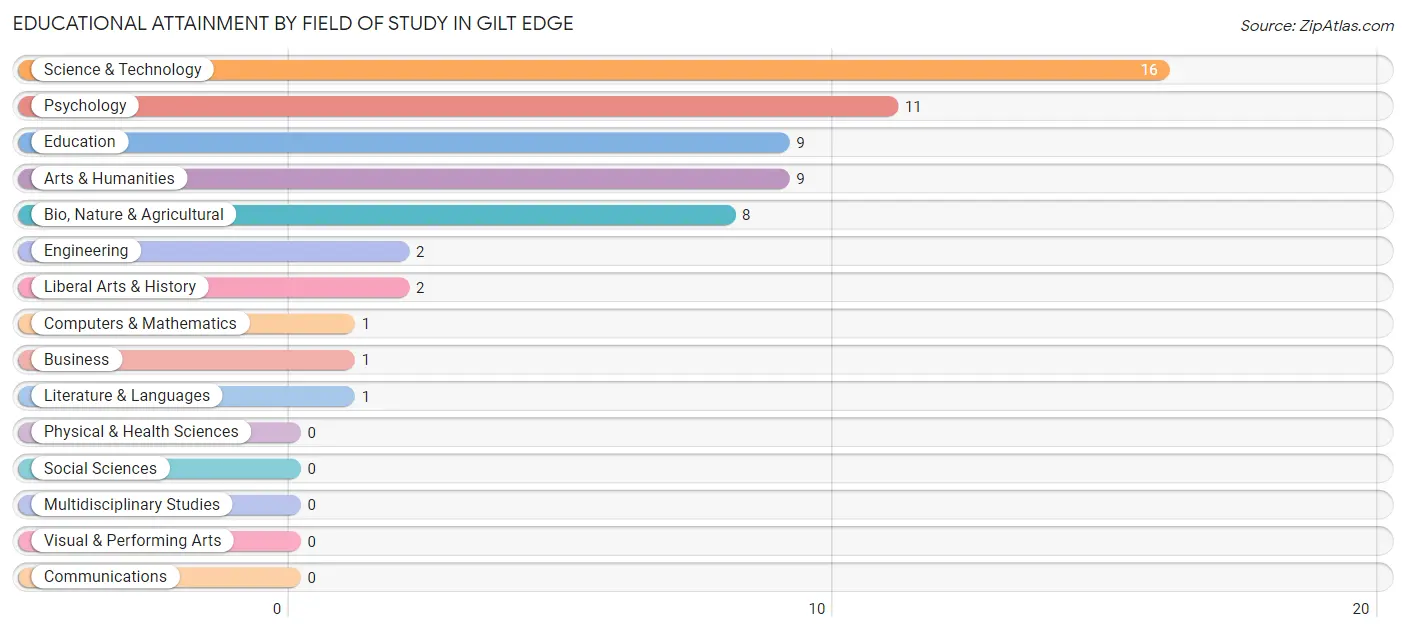
Educational Attainment by Field of Study in Gilt Edge
Science & technology (16 | 26.7%), psychology (11 | 18.3%), education (9 | 15.0%), arts & humanities (9 | 15.0%), and bio, nature & agricultural (8 | 13.3%) are the most common fields of study among 60 individuals in Gilt Edge who have obtained a bachelor's degree or higher.
| Field of Study | # Graduates | % Graduates |
| Computers & Mathematics | 1 | 1.7% |
| Bio, Nature & Agricultural | 8 | 13.3% |
| Physical & Health Sciences | 0 | 0.0% |
| Psychology | 11 | 18.3% |
| Social Sciences | 0 | 0.0% |
| Engineering | 2 | 3.3% |
| Multidisciplinary Studies | 0 | 0.0% |
| Science & Technology | 16 | 26.7% |
| Business | 1 | 1.7% |
| Education | 9 | 15.0% |
| Literature & Languages | 1 | 1.7% |
| Liberal Arts & History | 2 | 3.3% |
| Visual & Performing Arts | 0 | 0.0% |
| Communications | 0 | 0.0% |
| Arts & Humanities | 9 | 15.0% |
| Total | 60 | 100.0% |
Transportation & Commute in Gilt Edge
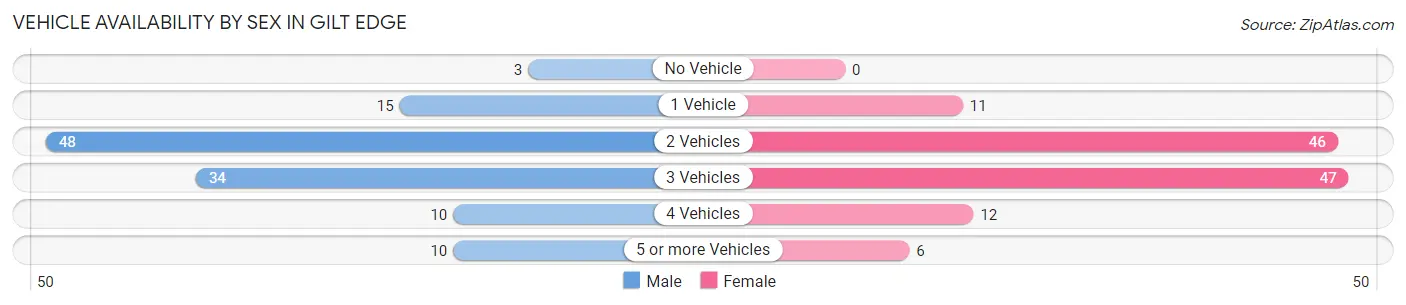
Vehicle Availability by Sex in Gilt Edge
The most prevalent vehicle ownership categories in Gilt Edge are males with 2 vehicles (48, accounting for 40.0%) and females with 2 vehicles (46, making up 39.3%).
| Vehicles Available | Male | Female |
| No Vehicle | 3 (2.5%) | 0 (0.0%) |
| 1 Vehicle | 15 (12.5%) | 11 (9.0%) |
| 2 Vehicles | 48 (40.0%) | 46 (37.7%) |
| 3 Vehicles | 34 (28.3%) | 47 (38.5%) |
| 4 Vehicles | 10 (8.3%) | 12 (9.8%) |
| 5 or more Vehicles | 10 (8.3%) | 6 (4.9%) |
| Total | 120 (100.0%) | 122 (100.0%) |
Commute Time in Gilt Edge
The most frequently occuring commute durations in Gilt Edge are 30 to 34 minutes (58 commuters, 23.5%), 45 to 59 minutes (45 commuters, 18.2%), and 20 to 24 minutes (31 commuters, 12.6%).
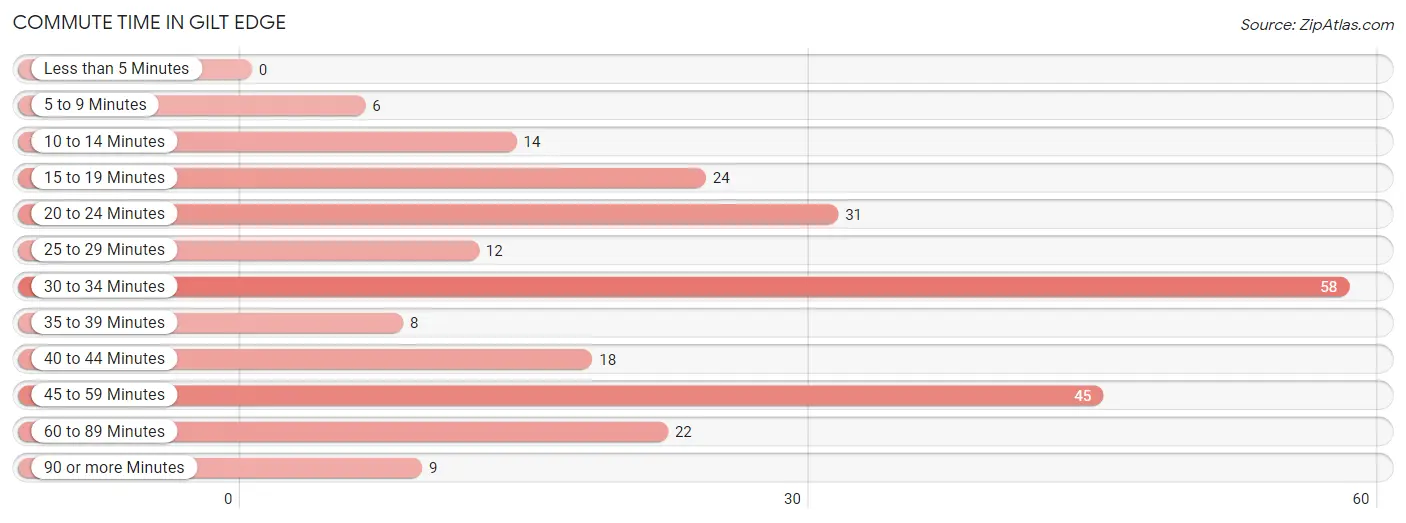
| Commute Time | # Commuters | % Commuters |
| Less than 5 Minutes | 0 | 0.0% |
| 5 to 9 Minutes | 6 | 2.4% |
| 10 to 14 Minutes | 14 | 5.7% |
| 15 to 19 Minutes | 24 | 9.7% |
| 20 to 24 Minutes | 31 | 12.6% |
| 25 to 29 Minutes | 12 | 4.9% |
| 30 to 34 Minutes | 58 | 23.5% |
| 35 to 39 Minutes | 8 | 3.2% |
| 40 to 44 Minutes | 18 | 7.3% |
| 45 to 59 Minutes | 45 | 18.2% |
| 60 to 89 Minutes | 22 | 8.9% |
| 90 or more Minutes | 9 | 3.6% |
Commute Time by Sex in Gilt Edge
The most common commute times in Gilt Edge are 30 to 34 minutes (20 commuters, 18.0%) for males and 30 to 34 minutes (38 commuters, 27.9%) for females.
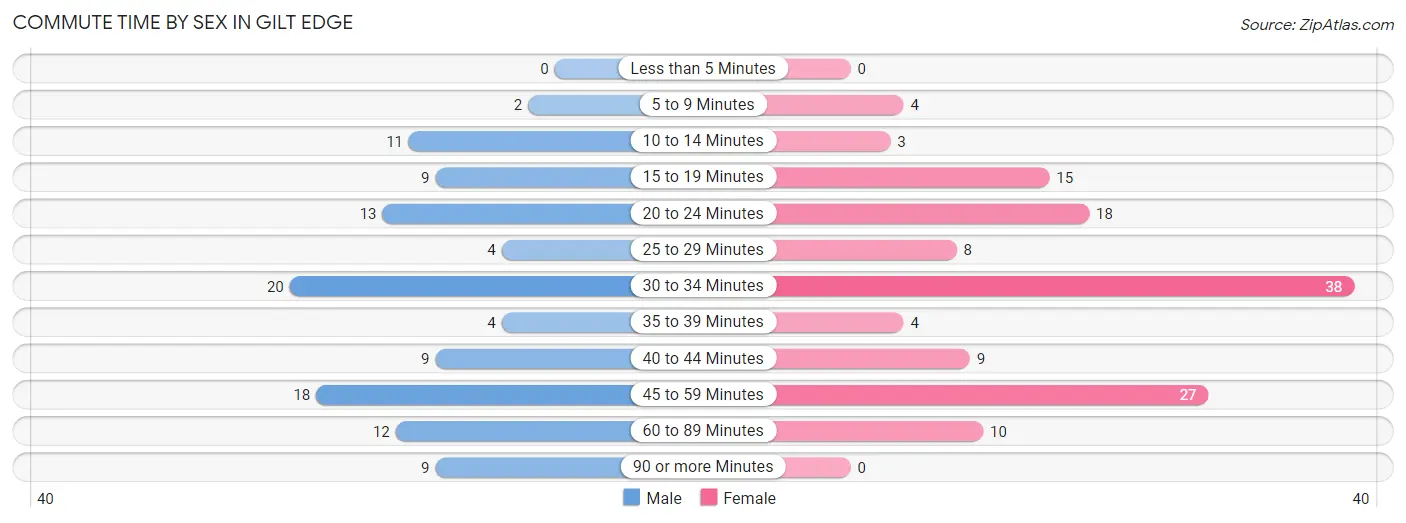
| Commute Time | Male | Female |
| Less than 5 Minutes | 0 (0.0%) | 0 (0.0%) |
| 5 to 9 Minutes | 2 (1.8%) | 4 (2.9%) |
| 10 to 14 Minutes | 11 (9.9%) | 3 (2.2%) |
| 15 to 19 Minutes | 9 (8.1%) | 15 (11.0%) |
| 20 to 24 Minutes | 13 (11.7%) | 18 (13.2%) |
| 25 to 29 Minutes | 4 (3.6%) | 8 (5.9%) |
| 30 to 34 Minutes | 20 (18.0%) | 38 (27.9%) |
| 35 to 39 Minutes | 4 (3.6%) | 4 (2.9%) |
| 40 to 44 Minutes | 9 (8.1%) | 9 (6.6%) |
| 45 to 59 Minutes | 18 (16.2%) | 27 (19.9%) |
| 60 to 89 Minutes | 12 (10.8%) | 10 (7.3%) |
| 90 or more Minutes | 9 (8.1%) | 0 (0.0%) |
Time of Departure to Work by Sex in Gilt Edge
The most frequent times of departure to work in Gilt Edge are 7:00 AM to 7:29 AM (28, 25.2%) for males and 9:00 AM to 9:59 AM (23, 16.9%) for females.
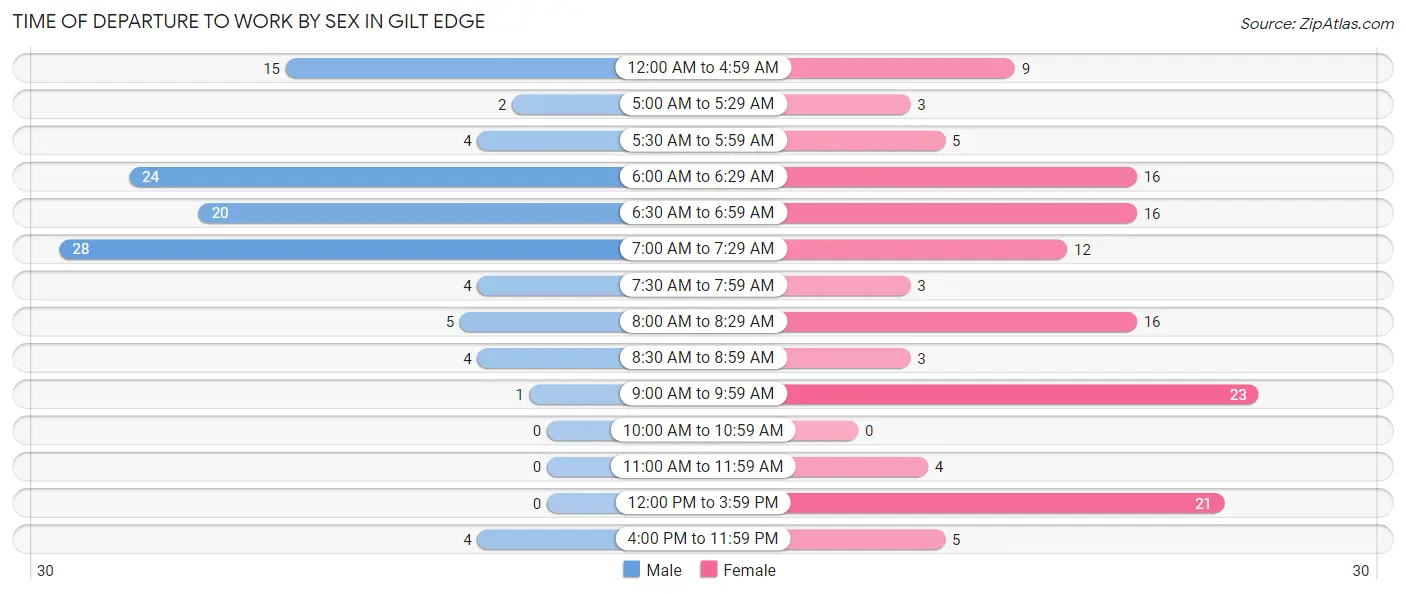
| Time of Departure | Male | Female |
| 12:00 AM to 4:59 AM | 15 (13.5%) | 9 (6.6%) |
| 5:00 AM to 5:29 AM | 2 (1.8%) | 3 (2.2%) |
| 5:30 AM to 5:59 AM | 4 (3.6%) | 5 (3.7%) |
| 6:00 AM to 6:29 AM | 24 (21.6%) | 16 (11.8%) |
| 6:30 AM to 6:59 AM | 20 (18.0%) | 16 (11.8%) |
| 7:00 AM to 7:29 AM | 28 (25.2%) | 12 (8.8%) |
| 7:30 AM to 7:59 AM | 4 (3.6%) | 3 (2.2%) |
| 8:00 AM to 8:29 AM | 5 (4.5%) | 16 (11.8%) |
| 8:30 AM to 8:59 AM | 4 (3.6%) | 3 (2.2%) |
| 9:00 AM to 9:59 AM | 1 (0.9%) | 23 (16.9%) |
| 10:00 AM to 10:59 AM | 0 (0.0%) | 0 (0.0%) |
| 11:00 AM to 11:59 AM | 0 (0.0%) | 4 (2.9%) |
| 12:00 PM to 3:59 PM | 0 (0.0%) | 21 (15.4%) |
| 4:00 PM to 11:59 PM | 4 (3.6%) | 5 (3.7%) |
| Total | 111 (100.0%) | 136 (100.0%) |
Housing Occupancy in Gilt Edge
Occupancy by Ownership in Gilt Edge
Of the total 193 dwellings in Gilt Edge, owner-occupied units account for 127 (65.8%), while renter-occupied units make up 66 (34.2%).
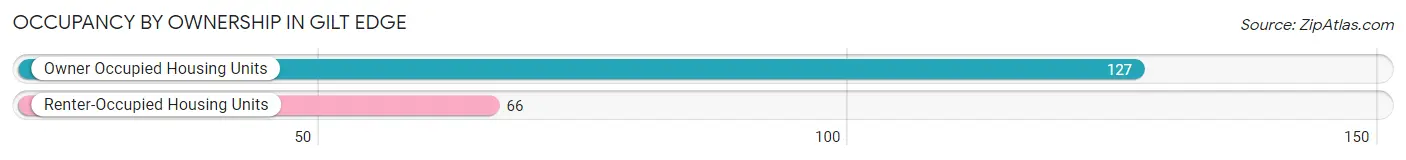
| Occupancy | # Housing Units | % Housing Units |
| Owner Occupied Housing Units | 127 | 65.8% |
| Renter-Occupied Housing Units | 66 | 34.2% |
| Total Occupied Housing Units | 193 | 100.0% |
Occupancy by Household Size in Gilt Edge
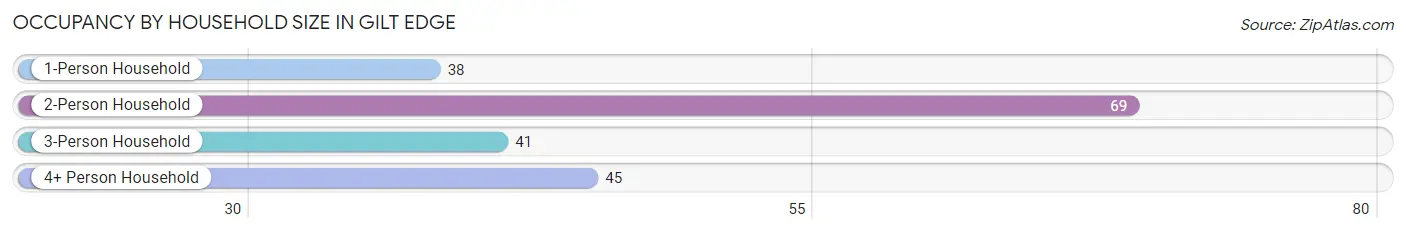
| Household Size | # Housing Units | % Housing Units |
| 1-Person Household | 38 | 19.7% |
| 2-Person Household | 69 | 35.7% |
| 3-Person Household | 41 | 21.2% |
| 4+ Person Household | 45 | 23.3% |
| Total Housing Units | 193 | 100.0% |
Occupancy by Ownership by Household Size in Gilt Edge
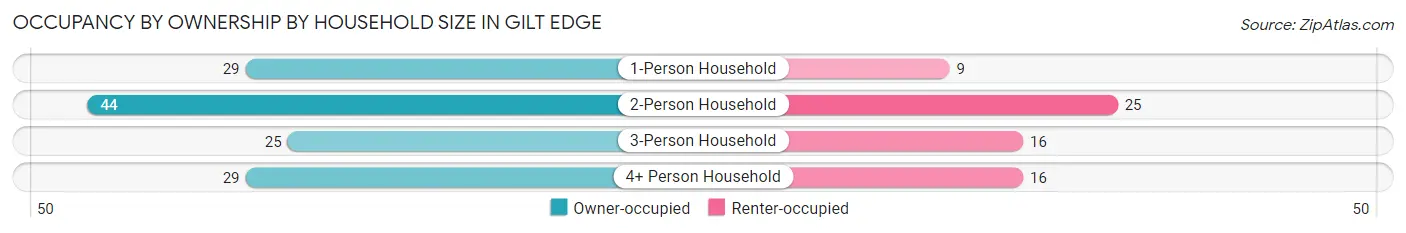
| Household Size | Owner-occupied | Renter-occupied |
| 1-Person Household | 29 (76.3%) | 9 (23.7%) |
| 2-Person Household | 44 (63.8%) | 25 (36.2%) |
| 3-Person Household | 25 (61.0%) | 16 (39.0%) |
| 4+ Person Household | 29 (64.4%) | 16 (35.6%) |
| Total Housing Units | 127 (65.8%) | 66 (34.2%) |
Occupancy by Educational Attainment in Gilt Edge
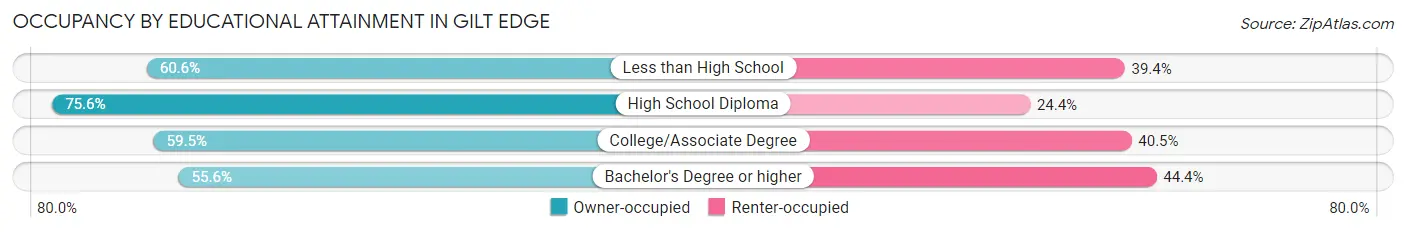
| Household Size | Owner-occupied | Renter-occupied |
| Less than High School | 20 (60.6%) | 13 (39.4%) |
| High School Diploma | 62 (75.6%) | 20 (24.4%) |
| College/Associate Degree | 25 (59.5%) | 17 (40.5%) |
| Bachelor's Degree or higher | 20 (55.6%) | 16 (44.4%) |
Occupancy by Age of Householder in Gilt Edge
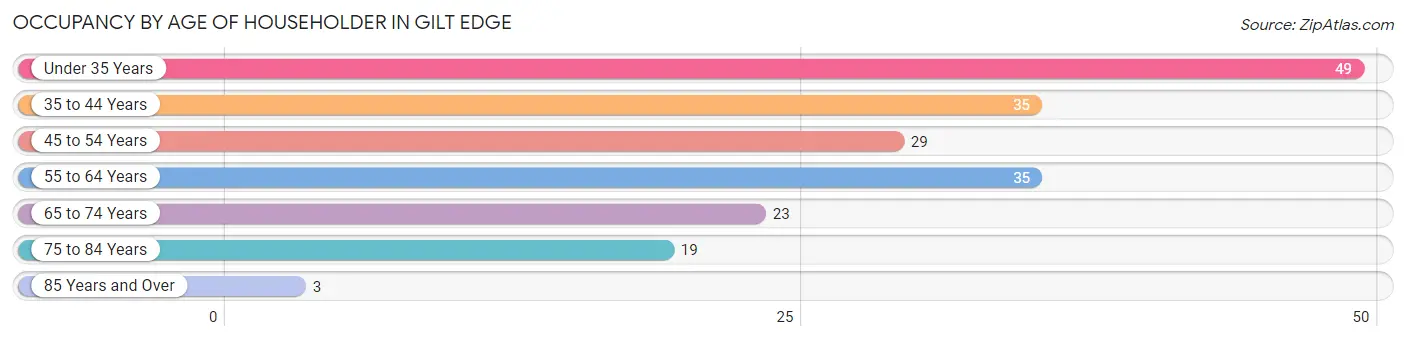
| Age Bracket | # Households | % Households |
| Under 35 Years | 49 | 25.4% |
| 35 to 44 Years | 35 | 18.1% |
| 45 to 54 Years | 29 | 15.0% |
| 55 to 64 Years | 35 | 18.1% |
| 65 to 74 Years | 23 | 11.9% |
| 75 to 84 Years | 19 | 9.8% |
| 85 Years and Over | 3 | 1.5% |
| Total | 193 | 100.0% |
Housing Finances in Gilt Edge
Median Income by Occupancy in Gilt Edge
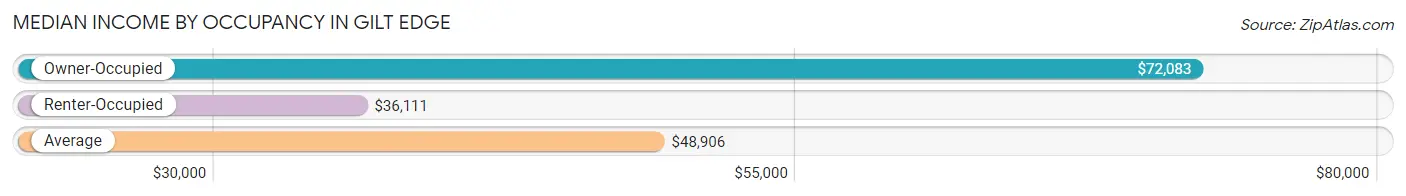
| Occupancy Type | # Households | Median Income |
| Owner-Occupied | 127 (65.8%) | $72,083 |
| Renter-Occupied | 66 (34.2%) | $36,111 |
| Average | 193 (100.0%) | $48,906 |
Occupancy by Householder Income Bracket in Gilt Edge
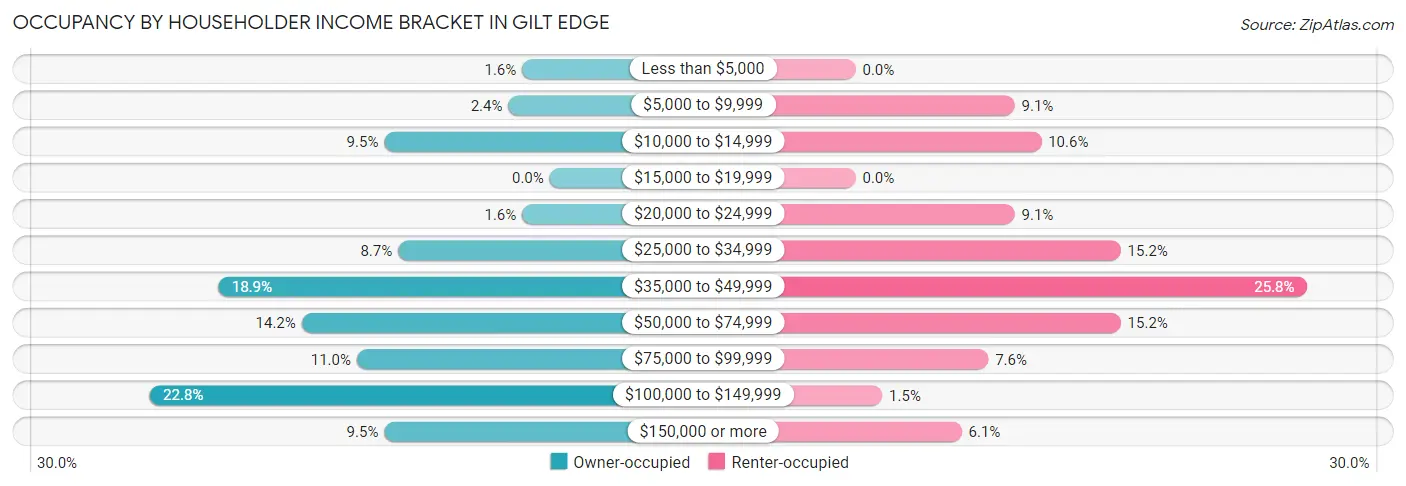
| Income Bracket | Owner-occupied | Renter-occupied |
| Less than $5,000 | 2 (1.6%) | 0 (0.0%) |
| $5,000 to $9,999 | 3 (2.4%) | 6 (9.1%) |
| $10,000 to $14,999 | 12 (9.5%) | 7 (10.6%) |
| $15,000 to $19,999 | 0 (0.0%) | 0 (0.0%) |
| $20,000 to $24,999 | 2 (1.6%) | 6 (9.1%) |
| $25,000 to $34,999 | 11 (8.7%) | 10 (15.1%) |
| $35,000 to $49,999 | 24 (18.9%) | 17 (25.8%) |
| $50,000 to $74,999 | 18 (14.2%) | 10 (15.1%) |
| $75,000 to $99,999 | 14 (11.0%) | 5 (7.6%) |
| $100,000 to $149,999 | 29 (22.8%) | 1 (1.5%) |
| $150,000 or more | 12 (9.5%) | 4 (6.1%) |
| Total | 127 (100.0%) | 66 (100.0%) |
Monthly Housing Cost Tiers in Gilt Edge
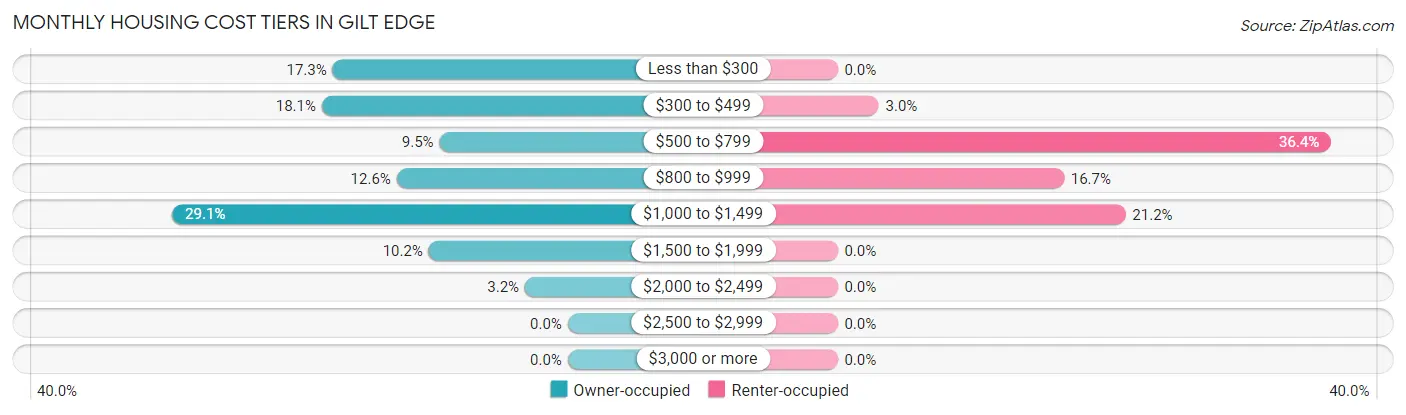
| Monthly Cost | Owner-occupied | Renter-occupied |
| Less than $300 | 22 (17.3%) | 0 (0.0%) |
| $300 to $499 | 23 (18.1%) | 2 (3.0%) |
| $500 to $799 | 12 (9.5%) | 24 (36.4%) |
| $800 to $999 | 16 (12.6%) | 11 (16.7%) |
| $1,000 to $1,499 | 37 (29.1%) | 14 (21.2%) |
| $1,500 to $1,999 | 13 (10.2%) | 0 (0.0%) |
| $2,000 to $2,499 | 4 (3.2%) | 0 (0.0%) |
| $2,500 to $2,999 | 0 (0.0%) | 0 (0.0%) |
| $3,000 or more | 0 (0.0%) | 0 (0.0%) |
| Total | 127 (100.0%) | 66 (100.0%) |
Physical Housing Characteristics in Gilt Edge
Housing Structures in Gilt Edge
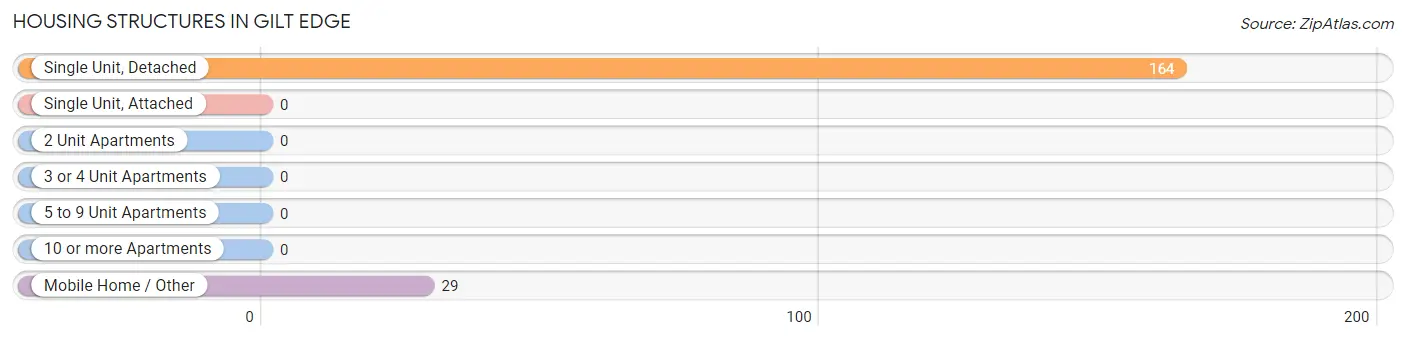
| Structure Type | # Housing Units | % Housing Units |
| Single Unit, Detached | 164 | 85.0% |
| Single Unit, Attached | 0 | 0.0% |
| 2 Unit Apartments | 0 | 0.0% |
| 3 or 4 Unit Apartments | 0 | 0.0% |
| 5 to 9 Unit Apartments | 0 | 0.0% |
| 10 or more Apartments | 0 | 0.0% |
| Mobile Home / Other | 29 | 15.0% |
| Total | 193 | 100.0% |
Housing Structures by Occupancy in Gilt Edge
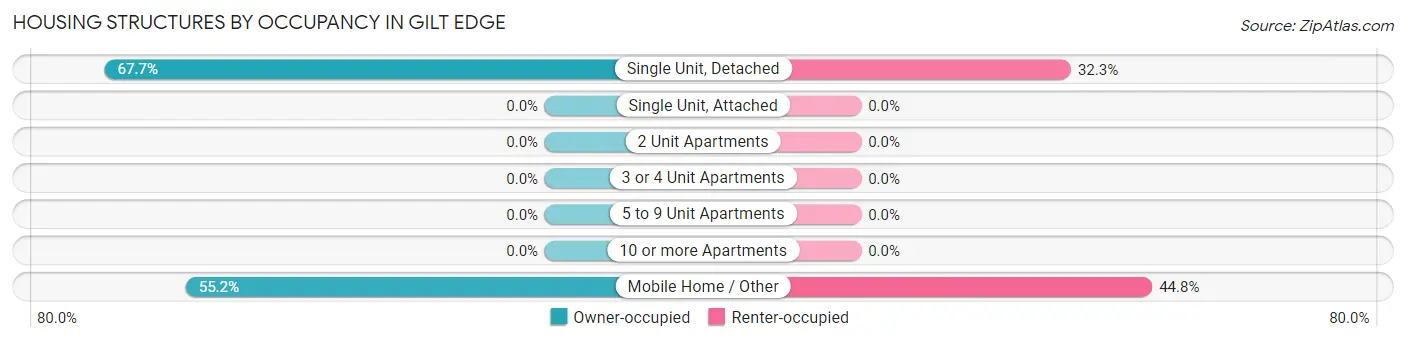
| Structure Type | Owner-occupied | Renter-occupied |
| Single Unit, Detached | 111 (67.7%) | 53 (32.3%) |
| Single Unit, Attached | 0 (0.0%) | 0 (0.0%) |
| 2 Unit Apartments | 0 (0.0%) | 0 (0.0%) |
| 3 or 4 Unit Apartments | 0 (0.0%) | 0 (0.0%) |
| 5 to 9 Unit Apartments | 0 (0.0%) | 0 (0.0%) |
| 10 or more Apartments | 0 (0.0%) | 0 (0.0%) |
| Mobile Home / Other | 16 (55.2%) | 13 (44.8%) |
| Total | 127 (65.8%) | 66 (34.2%) |
Housing Structures by Number of Rooms in Gilt Edge
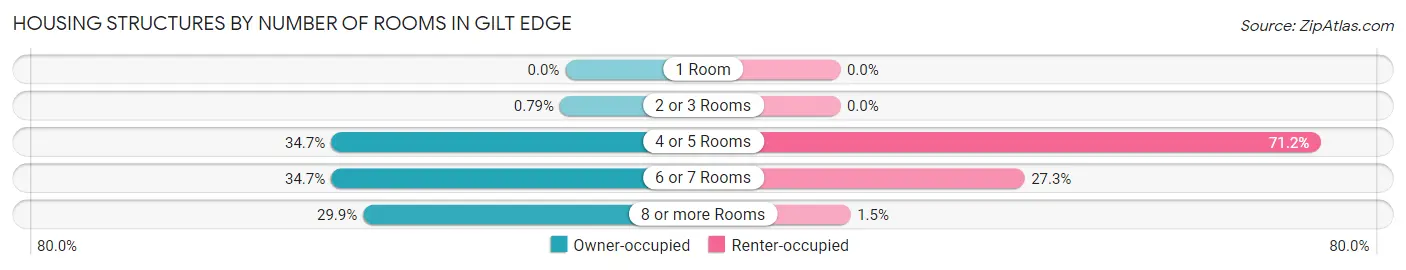
| Number of Rooms | Owner-occupied | Renter-occupied |
| 1 Room | 0 (0.0%) | 0 (0.0%) |
| 2 or 3 Rooms | 1 (0.8%) | 0 (0.0%) |
| 4 or 5 Rooms | 44 (34.6%) | 47 (71.2%) |
| 6 or 7 Rooms | 44 (34.6%) | 18 (27.3%) |
| 8 or more Rooms | 38 (29.9%) | 1 (1.5%) |
| Total | 127 (100.0%) | 66 (100.0%) |
Housing Structure by Heating Type in Gilt Edge
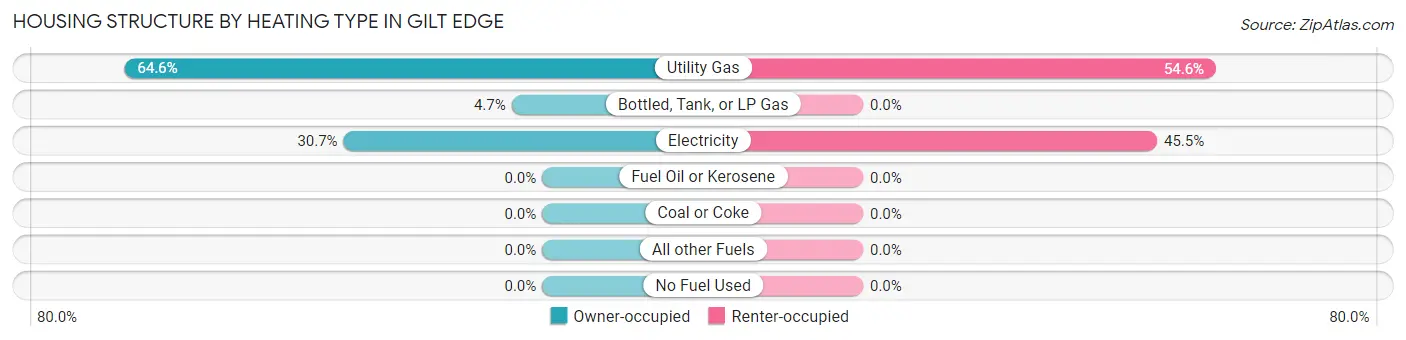
| Heating Type | Owner-occupied | Renter-occupied |
| Utility Gas | 82 (64.6%) | 36 (54.5%) |
| Bottled, Tank, or LP Gas | 6 (4.7%) | 0 (0.0%) |
| Electricity | 39 (30.7%) | 30 (45.5%) |
| Fuel Oil or Kerosene | 0 (0.0%) | 0 (0.0%) |
| Coal or Coke | 0 (0.0%) | 0 (0.0%) |
| All other Fuels | 0 (0.0%) | 0 (0.0%) |
| No Fuel Used | 0 (0.0%) | 0 (0.0%) |
| Total | 127 (100.0%) | 66 (100.0%) |
Household Vehicle Usage in Gilt Edge
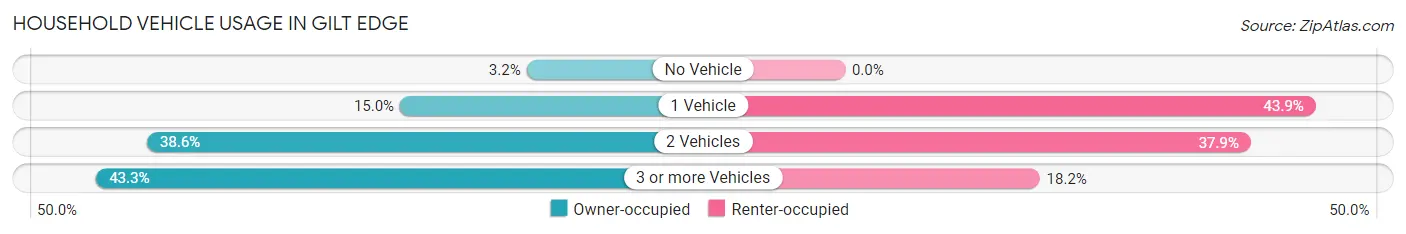
| Vehicles per Household | Owner-occupied | Renter-occupied |
| No Vehicle | 4 (3.2%) | 0 (0.0%) |
| 1 Vehicle | 19 (15.0%) | 29 (43.9%) |
| 2 Vehicles | 49 (38.6%) | 25 (37.9%) |
| 3 or more Vehicles | 55 (43.3%) | 12 (18.2%) |
| Total | 127 (100.0%) | 66 (100.0%) |
Real Estate & Mortgages in Gilt Edge
Real Estate and Mortgage Overview in Gilt Edge
| Characteristic | Without Mortgage | With Mortgage |
| Housing Units | 53 | 74 |
| Median Property Value | $122,500 | $175,000 |
| Median Household Income | $40,625 | $11 |
| Monthly Housing Costs | $328 | $0 |
| Real Estate Taxes | $567 | $1 |
Property Value by Mortgage Status in Gilt Edge
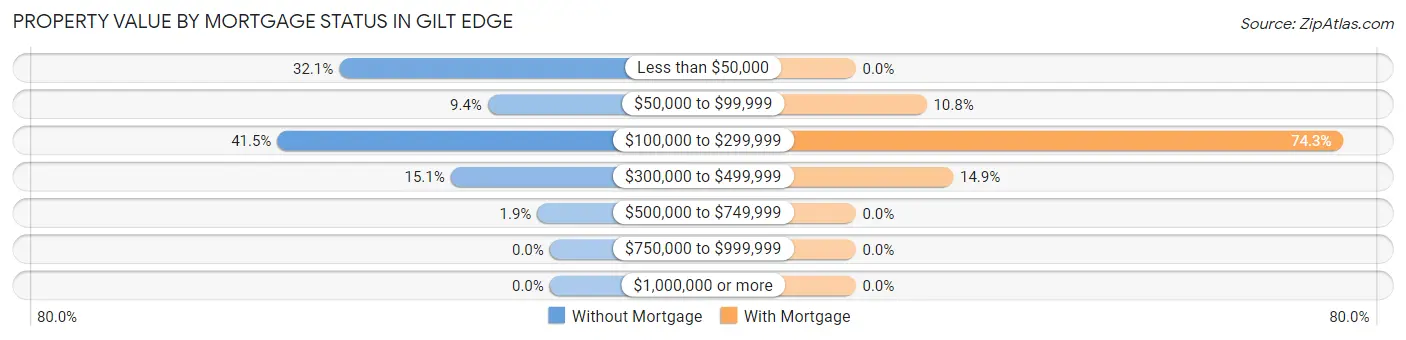
| Property Value | Without Mortgage | With Mortgage |
| Less than $50,000 | 17 (32.1%) | 0 (0.0%) |
| $50,000 to $99,999 | 5 (9.4%) | 8 (10.8%) |
| $100,000 to $299,999 | 22 (41.5%) | 55 (74.3%) |
| $300,000 to $499,999 | 8 (15.1%) | 11 (14.9%) |
| $500,000 to $749,999 | 1 (1.9%) | 0 (0.0%) |
| $750,000 to $999,999 | 0 (0.0%) | 0 (0.0%) |
| $1,000,000 or more | 0 (0.0%) | 0 (0.0%) |
| Total | 53 (100.0%) | 74 (100.0%) |
Household Income by Mortgage Status in Gilt Edge
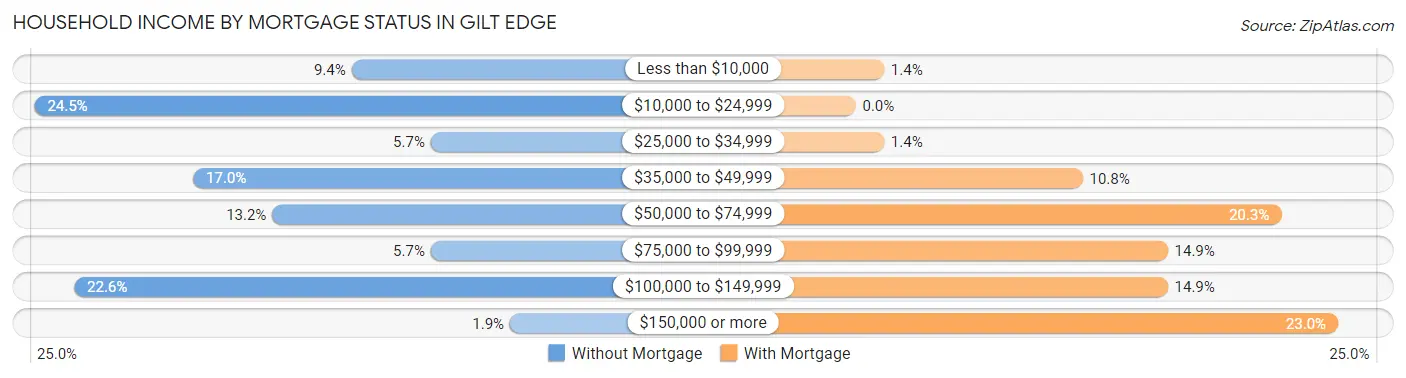
| Household Income | Without Mortgage | With Mortgage |
| Less than $10,000 | 5 (9.4%) | 1 (1.3%) |
| $10,000 to $24,999 | 13 (24.5%) | 0 (0.0%) |
| $25,000 to $34,999 | 3 (5.7%) | 1 (1.3%) |
| $35,000 to $49,999 | 9 (17.0%) | 8 (10.8%) |
| $50,000 to $74,999 | 7 (13.2%) | 15 (20.3%) |
| $75,000 to $99,999 | 3 (5.7%) | 11 (14.9%) |
| $100,000 to $149,999 | 12 (22.6%) | 11 (14.9%) |
| $150,000 or more | 1 (1.9%) | 17 (23.0%) |
| Total | 53 (100.0%) | 74 (100.0%) |
Property Value to Household Income Ratio in Gilt Edge
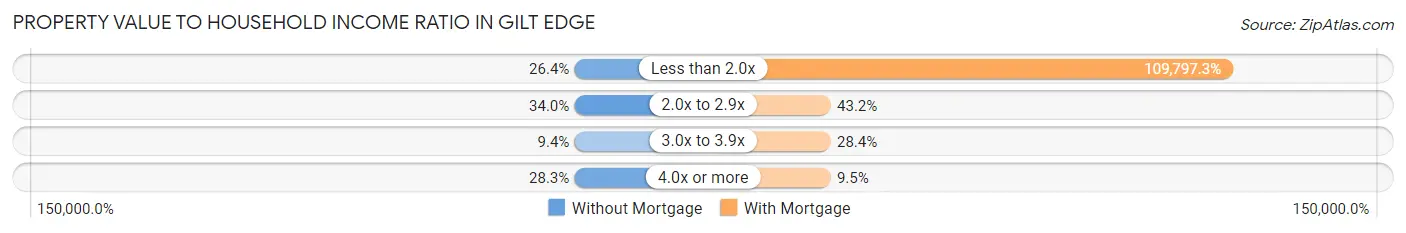
| Value-to-Income Ratio | Without Mortgage | With Mortgage |
| Less than 2.0x | 14 (26.4%) | 81,250 (109,797.3%) |
| 2.0x to 2.9x | 18 (34.0%) | 32 (43.2%) |
| 3.0x to 3.9x | 5 (9.4%) | 21 (28.4%) |
| 4.0x or more | 15 (28.3%) | 7 (9.5%) |
| Total | 53 (100.0%) | 74 (100.0%) |
Real Estate Taxes by Mortgage Status in Gilt Edge
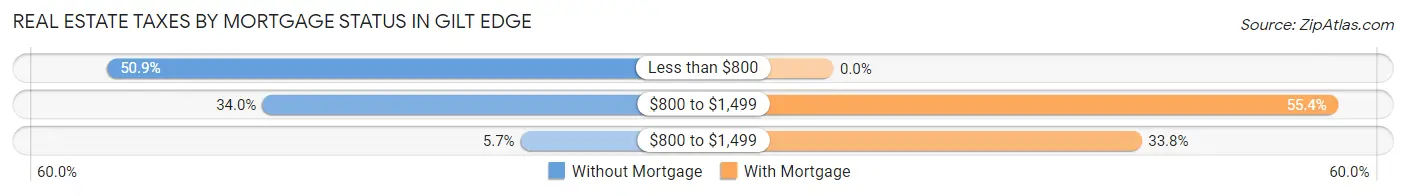
| Property Taxes | Without Mortgage | With Mortgage |
| Less than $800 | 27 (50.9%) | 0 (0.0%) |
| $800 to $1,499 | 18 (34.0%) | 41 (55.4%) |
| $800 to $1,499 | 3 (5.7%) | 25 (33.8%) |
| Total | 53 (100.0%) | 74 (100.0%) |
Health & Disability in Gilt Edge
Health Insurance Coverage by Age in Gilt Edge
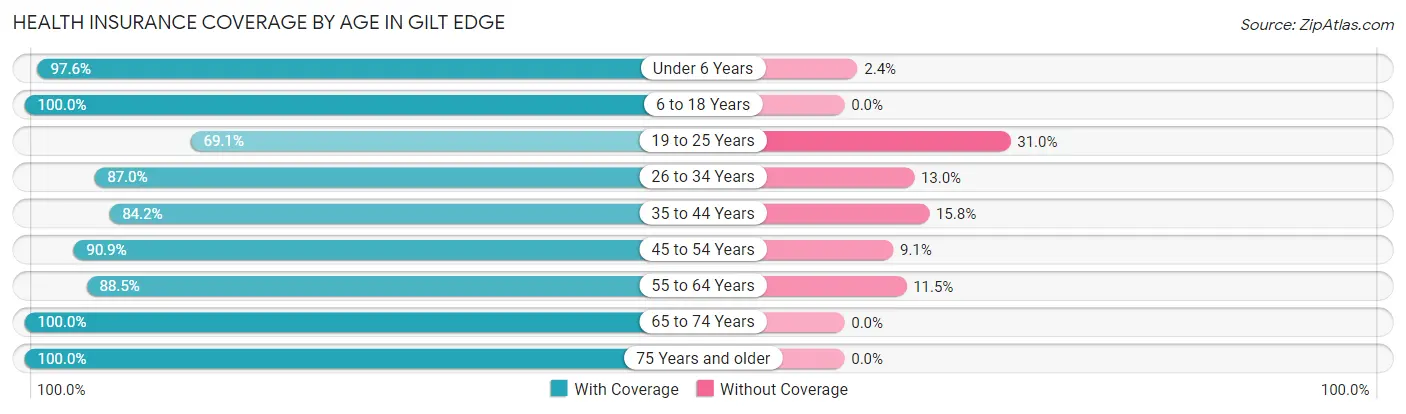
| Age Bracket | With Coverage | Without Coverage |
| Under 6 Years | 40 (97.6%) | 1 (2.4%) |
| 6 to 18 Years | 75 (100.0%) | 0 (0.0%) |
| 19 to 25 Years | 29 (69.1%) | 13 (30.9%) |
| 26 to 34 Years | 67 (87.0%) | 10 (13.0%) |
| 35 to 44 Years | 64 (84.2%) | 12 (15.8%) |
| 45 to 54 Years | 80 (90.9%) | 8 (9.1%) |
| 55 to 64 Years | 46 (88.5%) | 6 (11.5%) |
| 65 to 74 Years | 37 (100.0%) | 0 (0.0%) |
| 75 Years and older | 25 (100.0%) | 0 (0.0%) |
| Total | 463 (90.2%) | 50 (9.8%) |
Health Insurance Coverage by Citizenship Status in Gilt Edge
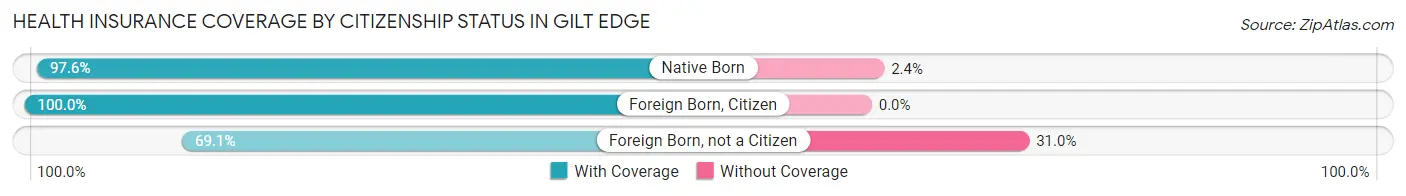
| Citizenship Status | With Coverage | Without Coverage |
| Native Born | 40 (97.6%) | 1 (2.4%) |
| Foreign Born, Citizen | 75 (100.0%) | 0 (0.0%) |
| Foreign Born, not a Citizen | 29 (69.1%) | 13 (30.9%) |
Health Insurance Coverage by Household Income in Gilt Edge
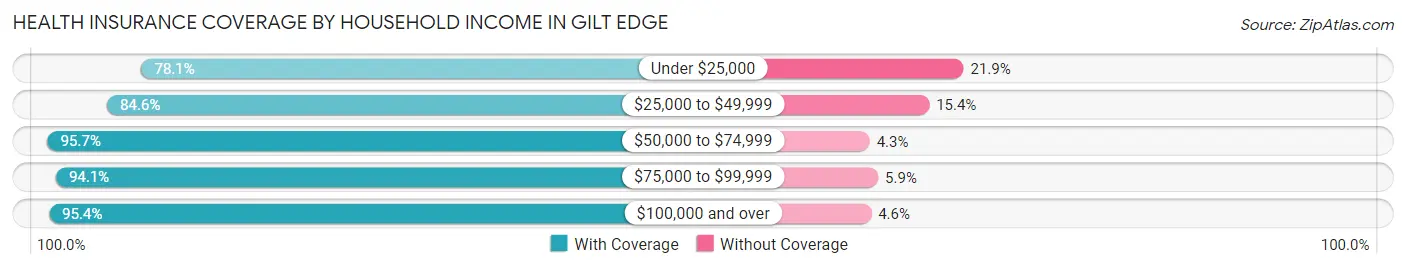
| Household Income | With Coverage | Without Coverage |
| Under $25,000 | 50 (78.1%) | 14 (21.9%) |
| $25,000 to $49,999 | 115 (84.6%) | 21 (15.4%) |
| $50,000 to $74,999 | 67 (95.7%) | 3 (4.3%) |
| $75,000 to $99,999 | 64 (94.1%) | 4 (5.9%) |
| $100,000 and over | 146 (95.4%) | 7 (4.6%) |
Public vs Private Health Insurance Coverage by Age in Gilt Edge
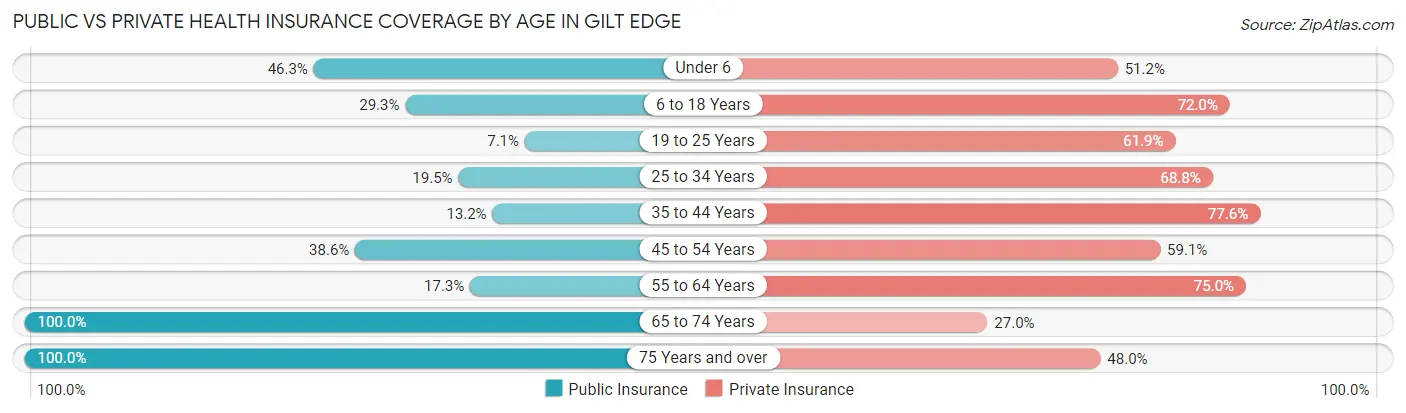
| Age Bracket | Public Insurance | Private Insurance |
| Under 6 | 19 (46.3%) | 21 (51.2%) |
| 6 to 18 Years | 22 (29.3%) | 54 (72.0%) |
| 19 to 25 Years | 3 (7.1%) | 26 (61.9%) |
| 25 to 34 Years | 15 (19.5%) | 53 (68.8%) |
| 35 to 44 Years | 10 (13.2%) | 59 (77.6%) |
| 45 to 54 Years | 34 (38.6%) | 52 (59.1%) |
| 55 to 64 Years | 9 (17.3%) | 39 (75.0%) |
| 65 to 74 Years | 37 (100.0%) | 10 (27.0%) |
| 75 Years and over | 25 (100.0%) | 12 (48.0%) |
| Total | 174 (33.9%) | 326 (63.5%) |
Disability Status by Sex by Age in Gilt Edge
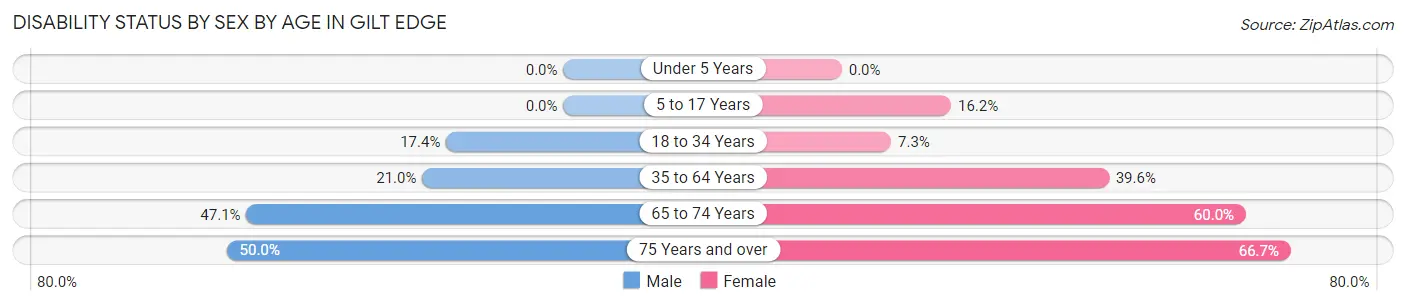
| Age Bracket | Male | Female |
| Under 5 Years | 0 (0.0%) | 0 (0.0%) |
| 5 to 17 Years | 0 (0.0%) | 6 (16.2%) |
| 18 to 34 Years | 8 (17.4%) | 6 (7.3%) |
| 35 to 64 Years | 22 (20.9%) | 44 (39.6%) |
| 65 to 74 Years | 8 (47.1%) | 12 (60.0%) |
| 75 Years and over | 8 (50.0%) | 6 (66.7%) |
Disability Class by Sex by Age in Gilt Edge
Disability Class: Hearing Difficulty
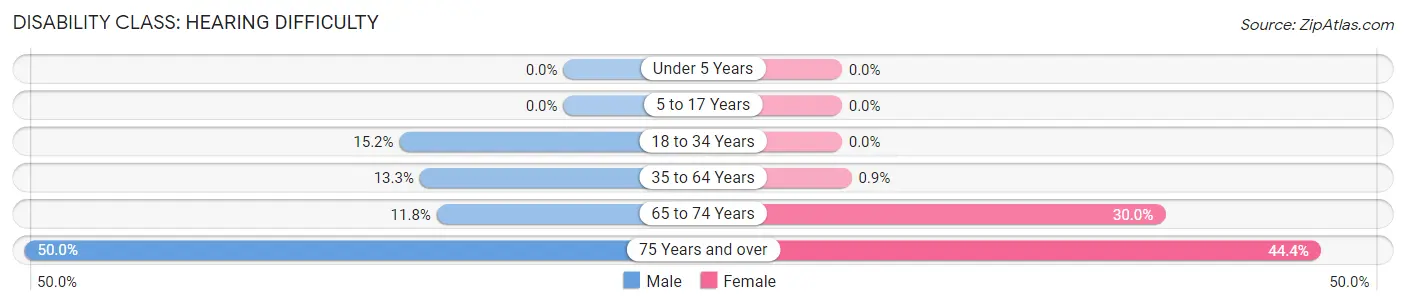
| Age Bracket | Male | Female |
| Under 5 Years | 0 (0.0%) | 0 (0.0%) |
| 5 to 17 Years | 0 (0.0%) | 0 (0.0%) |
| 18 to 34 Years | 7 (15.2%) | 0 (0.0%) |
| 35 to 64 Years | 14 (13.3%) | 1 (0.9%) |
| 65 to 74 Years | 2 (11.8%) | 6 (30.0%) |
| 75 Years and over | 8 (50.0%) | 4 (44.4%) |
Disability Class: Vision Difficulty

| Age Bracket | Male | Female |
| Under 5 Years | 0 (0.0%) | 0 (0.0%) |
| 5 to 17 Years | 0 (0.0%) | 0 (0.0%) |
| 18 to 34 Years | 2 (4.3%) | 0 (0.0%) |
| 35 to 64 Years | 7 (6.7%) | 6 (5.4%) |
| 65 to 74 Years | 0 (0.0%) | 3 (15.0%) |
| 75 Years and over | 0 (0.0%) | 1 (11.1%) |
Disability Class: Cognitive Difficulty
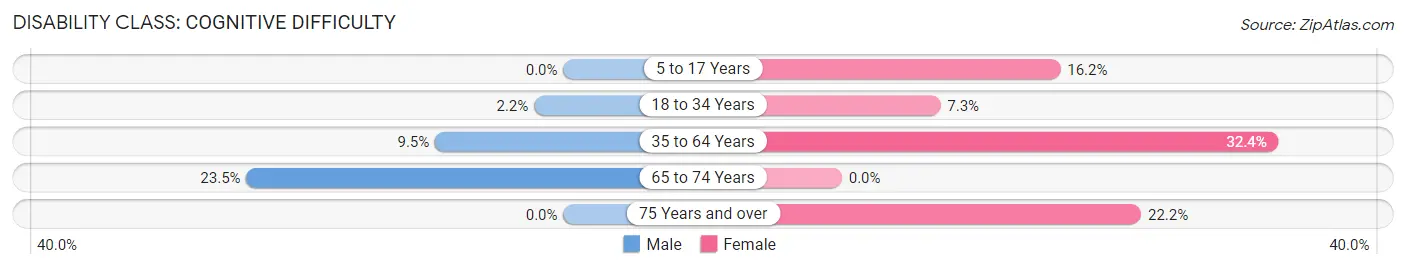
| Age Bracket | Male | Female |
| 5 to 17 Years | 0 (0.0%) | 6 (16.2%) |
| 18 to 34 Years | 1 (2.2%) | 6 (7.3%) |
| 35 to 64 Years | 10 (9.5%) | 36 (32.4%) |
| 65 to 74 Years | 4 (23.5%) | 0 (0.0%) |
| 75 Years and over | 0 (0.0%) | 2 (22.2%) |
Disability Class: Ambulatory Difficulty
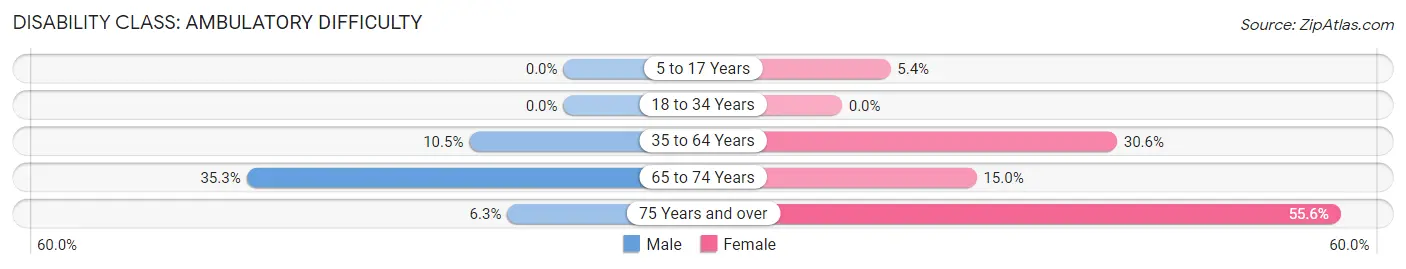
| Age Bracket | Male | Female |
| 5 to 17 Years | 0 (0.0%) | 2 (5.4%) |
| 18 to 34 Years | 0 (0.0%) | 0 (0.0%) |
| 35 to 64 Years | 11 (10.5%) | 34 (30.6%) |
| 65 to 74 Years | 6 (35.3%) | 3 (15.0%) |
| 75 Years and over | 1 (6.2%) | 5 (55.6%) |
Disability Class: Self-Care Difficulty
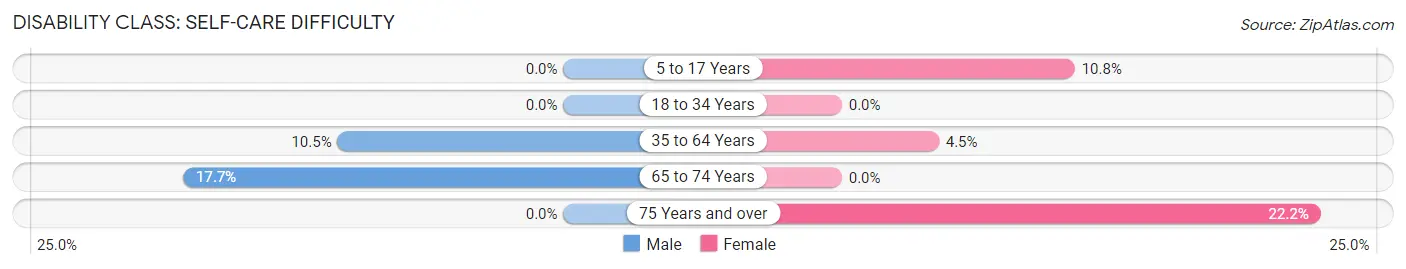
| Age Bracket | Male | Female |
| 5 to 17 Years | 0 (0.0%) | 4 (10.8%) |
| 18 to 34 Years | 0 (0.0%) | 0 (0.0%) |
| 35 to 64 Years | 11 (10.5%) | 5 (4.5%) |
| 65 to 74 Years | 3 (17.6%) | 0 (0.0%) |
| 75 Years and over | 0 (0.0%) | 2 (22.2%) |
Technology Access in Gilt Edge
Computing Device Access in Gilt Edge
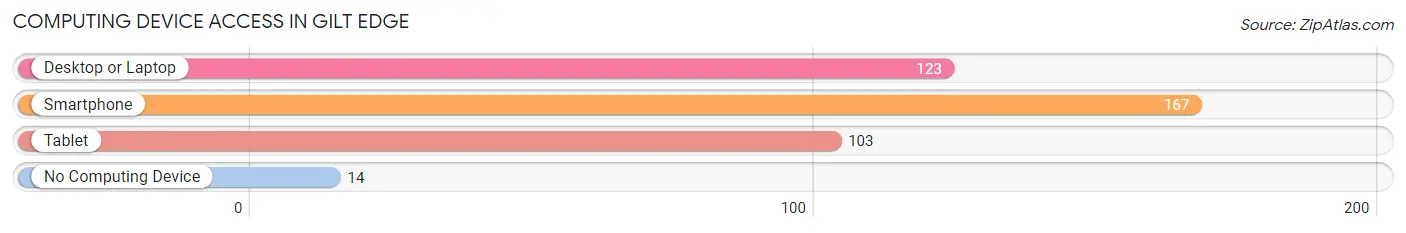
| Device Type | # Households | % Households |
| Desktop or Laptop | 123 | 63.7% |
| Smartphone | 167 | 86.5% |
| Tablet | 103 | 53.4% |
| No Computing Device | 14 | 7.2% |
| Total | 193 | 100.0% |
Internet Access in Gilt Edge
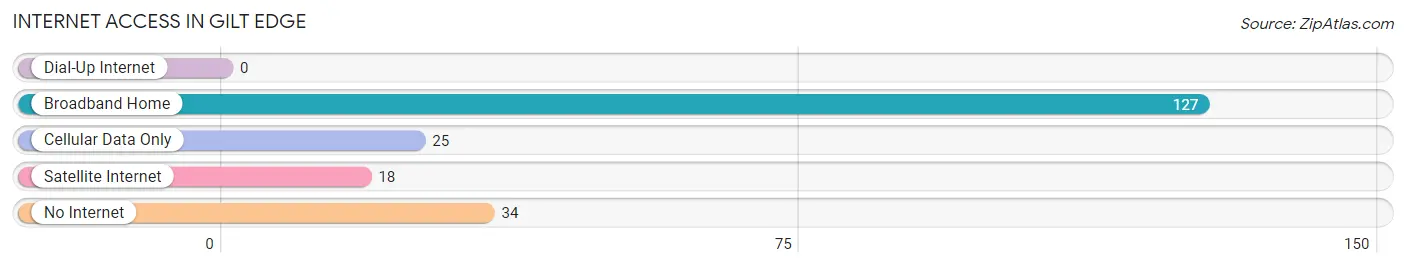
| Internet Type | # Households | % Households |
| Dial-Up Internet | 0 | 0.0% |
| Broadband Home | 127 | 65.8% |
| Cellular Data Only | 25 | 13.0% |
| Satellite Internet | 18 | 9.3% |
| No Internet | 34 | 17.6% |
| Total | 193 | 100.0% |
Gilt Edge Summary
Gilt Edge, Tennessee is a small town located in the foothills of the Appalachian Mountains in the eastern part of the state. It is situated in the county of Fentress, and is part of the Crossville-Cookville Micropolitan Statistical Area. The town has a population of just over 500 people, and is known for its rural charm and friendly atmosphere.
Geography
Gilt Edge is located in the eastern part of Tennessee, in the foothills of the Appalachian Mountains. It is situated in the county of Fentress, and is part of the Crossville-Cookville Micropolitan Statistical Area. The town is located at an elevation of 1,000 feet above sea level, and is surrounded by rolling hills and lush forests. The town is located near the Big South Fork National River and Recreation Area, which is a popular destination for outdoor activities such as hiking, camping, and fishing.
Economy
Gilt Edge is a small, rural town with a limited economy. The town is home to a few small businesses, including a grocery store, a hardware store, and a few restaurants. The town also has a few small manufacturing companies, which produce items such as furniture and clothing. The town is also home to a few farms, which produce a variety of crops, including corn, soybeans, and hay.
Demographics
As of the 2010 census, Gilt Edge had a population of 517 people. The racial makeup of the town was 97.3% White, 0.6% African American, 0.2% Native American, 0.2% Asian, 0.2% from other races, and 1.5% from two or more races. The median household income was $30,000, and the median family income was $35,000. The per capita income was $14,000.
History
Gilt Edge was founded in the late 1800s by a group of settlers from North Carolina. The town was originally known as “Gilt Edge” due to the gold-colored soil found in the area. The town was incorporated in 1891, and the first post office was established in 1892. The town grew slowly over the years, and by the early 1900s, it had become a thriving community with a population of over 500 people.
Gilt Edge has remained a small, rural town throughout its history. The town has seen some growth in recent years, as more people have moved to the area to take advantage of the town’s rural charm and friendly atmosphere. The town is also home to a few small businesses, which provide employment opportunities for the local residents.
Common Questions
What is Per Capita Income in Gilt Edge?
Per Capita income in Gilt Edge is $28,182.
What is the Median Family Income in Gilt Edge?
Median Family Income in Gilt Edge is $56,875.
What is the Median Household income in Gilt Edge?
Median Household Income in Gilt Edge is $48,906.
What is Income or Wage Gap in Gilt Edge?
Income or Wage Gap in Gilt Edge is 51.3%.
Women in Gilt Edge earn 48.7 cents for every dollar earned by a man.
What is Inequality or Gini Index in Gilt Edge?
Inequality or Gini Index in Gilt Edge is 0.43.
What is the Total Population of Gilt Edge?
Total Population of Gilt Edge is 513.
What is the Total Male Population of Gilt Edge?
Total Male Population of Gilt Edge is 233.
What is the Total Female Population of Gilt Edge?
Total Female Population of Gilt Edge is 280.
What is the Ratio of Males per 100 Females in Gilt Edge?
There are 83.21 Males per 100 Females in Gilt Edge.
What is the Ratio of Females per 100 Males in Gilt Edge?
There are 120.17 Females per 100 Males in Gilt Edge.
What is the Median Population Age in Gilt Edge?
Median Population Age in Gilt Edge is 37.0 Years.
What is the Average Family Size in Gilt Edge
Average Family Size in Gilt Edge is 3.0 People.
What is the Average Household Size in Gilt Edge
Average Household Size in Gilt Edge is 2.5 People.
How Large is the Labor Force in Gilt Edge?
There are 273 People in the Labor Forcein in Gilt Edge.
What is the Percentage of People in the Labor Force in Gilt Edge?
64.7% of People are in the Labor Force in Gilt Edge.
What is the Unemployment Rate in Gilt Edge?
Unemployment Rate in Gilt Edge is 3.3%.