Zip Codes with the Highest Percentage of Population Employed in Food Preparation & Serving in Knoxville, TN
RELATED REPORTS & OPTIONS
Food Preparation & Serving
Knoxville
Compare Zip Codes
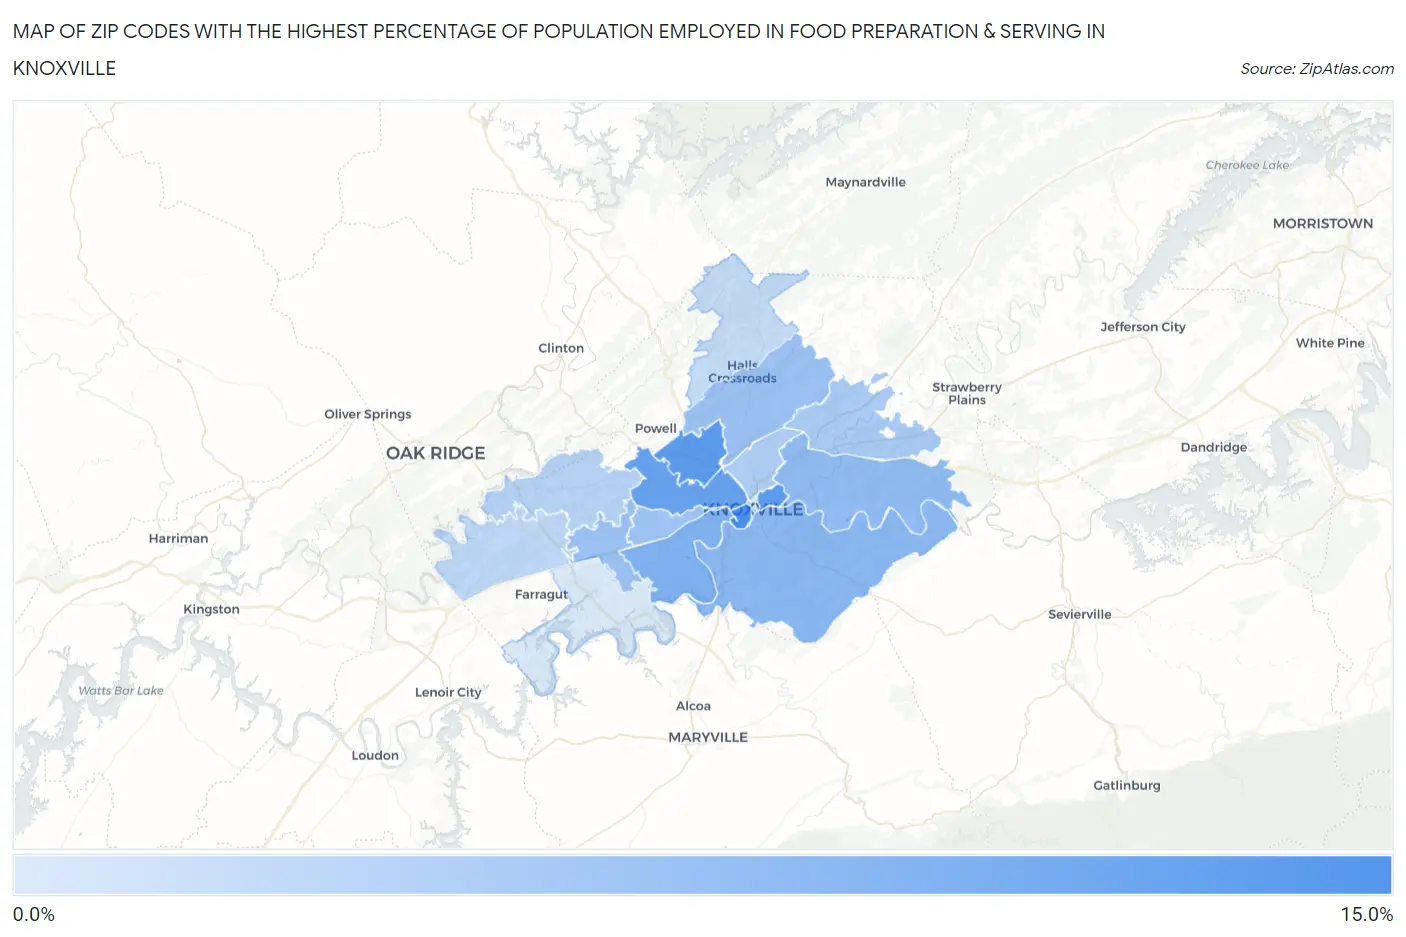
Map of Zip Codes with the Highest Percentage of Population Employed in Food Preparation & Serving in Knoxville
3.0%
11.8%
Zip Codes with the Highest Percentage of Population Employed in Food Preparation & Serving in Knoxville, TN
| Zip Code | % Employed | vs State | vs National | |
| 1. | 37916 | 11.8% | 5.4%(+6.38)#24 | 5.3%(+6.52)#1,735 |
| 2. | 37915 | 10.7% | 5.4%(+5.24)#36 | 5.3%(+5.37)#2,228 |
| 3. | 37912 | 10.6% | 5.4%(+5.15)#37 | 5.3%(+5.29)#2,291 |
| 4. | 37921 | 9.9% | 5.4%(+4.46)#48 | 5.3%(+4.59)#2,729 |
| 5. | 37919 | 8.3% | 5.4%(+2.90)#86 | 5.3%(+3.03)#4,295 |
| 6. | 37920 | 7.6% | 5.4%(+2.22)#116 | 5.3%(+2.35)#5,323 |
| 7. | 37914 | 7.4% | 5.4%(+2.00)#126 | 5.3%(+2.13)#5,714 |
| 8. | 37923 | 6.8% | 5.4%(+1.42)#146 | 5.3%(+1.56)#6,957 |
| 9. | 37918 | 6.8% | 5.4%(+1.34)#151 | 5.3%(+1.48)#7,170 |
| 10. | 37909 | 6.5% | 5.4%(+1.08)#162 | 5.3%(+1.22)#7,869 |
| 11. | 37924 | 5.9% | 5.4%(+0.501)#194 | 5.3%(+0.634)#9,608 |
| 12. | 37917 | 5.7% | 5.4%(+0.276)#212 | 5.3%(+0.409)#10,364 |
| 13. | 37931 | 5.1% | 5.4%(-0.355)#246 | 5.3%(-0.222)#12,671 |
| 14. | 37932 | 4.7% | 5.4%(-0.704)#280 | 5.3%(-0.571)#14,109 |
| 15. | 37938 | 4.3% | 5.4%(-1.07)#314 | 5.3%(-0.936)#15,643 |
| 16. | 37902 | 3.6% | 5.4%(-1.80)#378 | 5.3%(-1.67)#18,701 |
| 17. | 37922 | 3.0% | 5.4%(-2.40)#430 | 5.3%(-2.27)#21,189 |
1
Common Questions
What are the Top 10 Zip Codes with the Highest Percentage of Population Employed in Food Preparation & Serving in Knoxville, TN?
Top 10 Zip Codes with the Highest Percentage of Population Employed in Food Preparation & Serving in Knoxville, TN are:
What zip code has the Highest Percentage of Population Employed in Food Preparation & Serving in Knoxville, TN?
37916 has the Highest Percentage of Population Employed in Food Preparation & Serving in Knoxville, TN with 11.8%.
What is the Percentage of Population Employed in Food Preparation & Serving in Knoxville, TN?
Percentage of Population Employed in Food Preparation & Serving in Knoxville is 8.5%.
What is the Percentage of Population Employed in Food Preparation & Serving in Tennessee?
Percentage of Population Employed in Food Preparation & Serving in Tennessee is 5.4%.
What is the Percentage of Population Employed in Food Preparation & Serving in the United States?
Percentage of Population Employed in Food Preparation & Serving in the United States is 5.3%.