Zip Codes with the Highest Percentage of Population Employed in Food Preparation & Serving in Maryville, TN
RELATED REPORTS & OPTIONS
Food Preparation & Serving
Maryville
Compare Zip Codes
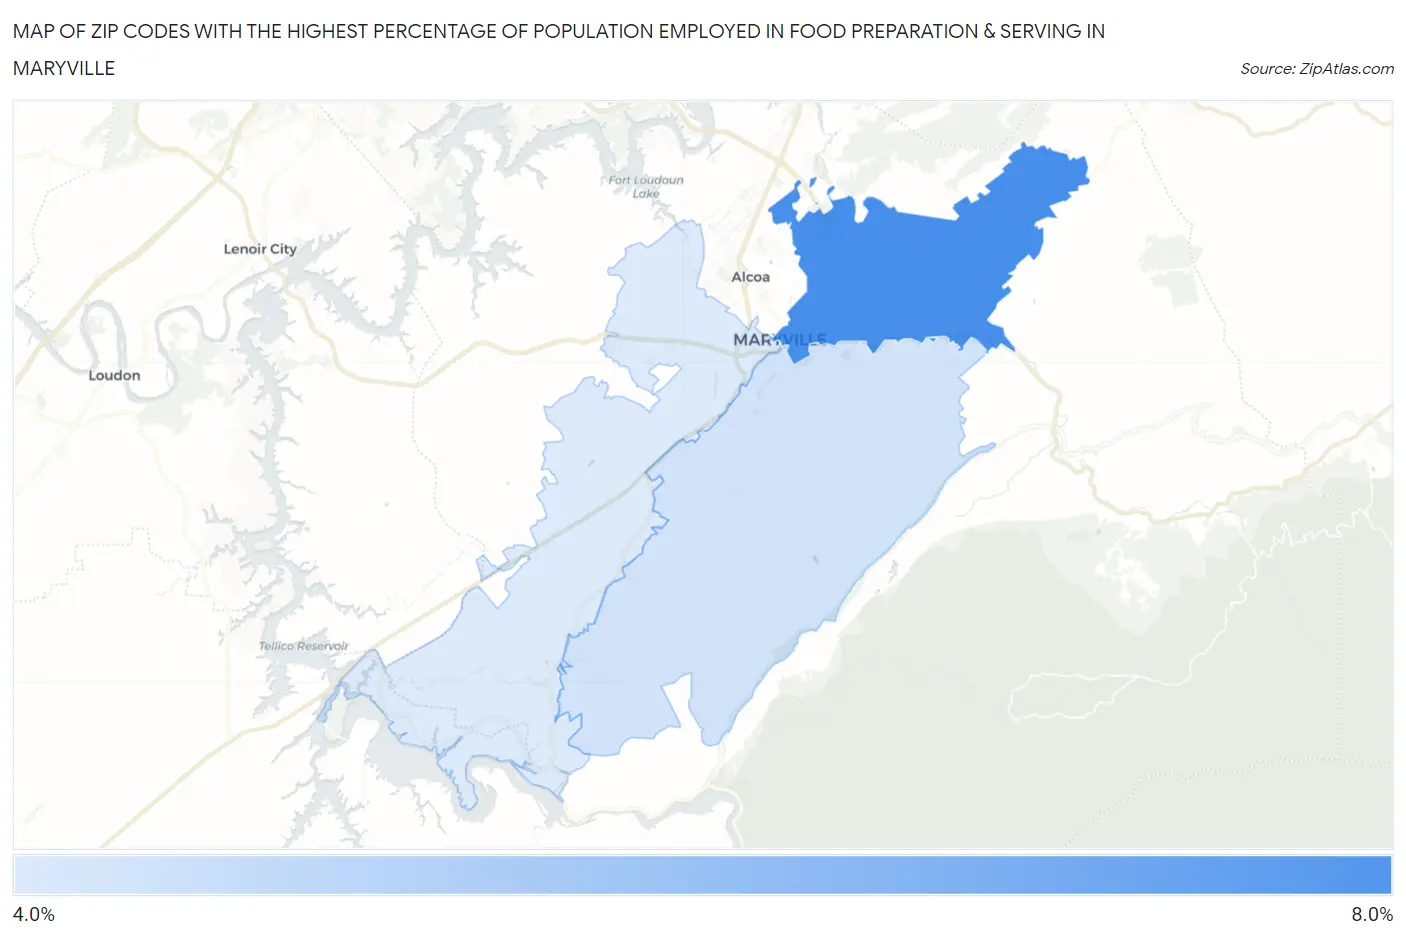
Map of Zip Codes with the Highest Percentage of Population Employed in Food Preparation & Serving in Maryville
4.6%
7.2%
Zip Codes with the Highest Percentage of Population Employed in Food Preparation & Serving in Maryville, TN
| Zip Code | % Employed | vs State | vs National | |
| 1. | 37804 | 7.2% | 5.4%(+1.80)#133 | 5.3%(+1.93)#6,089 |
| 2. | 37803 | 4.8% | 5.4%(-0.589)#271 | 5.3%(-0.456)#13,641 |
| 3. | 37801 | 4.6% | 5.4%(-0.803)#290 | 5.3%(-0.670)#14,518 |
1
Common Questions
What are the Top Zip Codes with the Highest Percentage of Population Employed in Food Preparation & Serving in Maryville, TN?
Top Zip Codes with the Highest Percentage of Population Employed in Food Preparation & Serving in Maryville, TN are:
What zip code has the Highest Percentage of Population Employed in Food Preparation & Serving in Maryville, TN?
37804 has the Highest Percentage of Population Employed in Food Preparation & Serving in Maryville, TN with 7.2%.
What is the Percentage of Population Employed in Food Preparation & Serving in Maryville, TN?
Percentage of Population Employed in Food Preparation & Serving in Maryville is 5.0%.
What is the Percentage of Population Employed in Food Preparation & Serving in Tennessee?
Percentage of Population Employed in Food Preparation & Serving in Tennessee is 5.4%.
What is the Percentage of Population Employed in Food Preparation & Serving in the United States?
Percentage of Population Employed in Food Preparation & Serving in the United States is 5.3%.