Sevierville, TN Map & Demographics
Sevierville Map
Sevierville Overview
$28,186
PER CAPITA INCOME
$62,582
AVG FAMILY INCOME
$49,449
AVG HOUSEHOLD INCOME
23.1%
WAGE / INCOME GAP [ % ]
76.9¢/ $1
WAGE / INCOME GAP [ $ ]
$6,010
FAMILY INCOME DEFICIT
0.45
INEQUALITY / GINI INDEX
17,986
TOTAL POPULATION
8,911
MALE POPULATION
9,075
FEMALE POPULATION
98.19
MALES / 100 FEMALES
101.84
FEMALES / 100 MALES
40.6
MEDIAN AGE
3.0
AVG FAMILY SIZE
2.4
AVG HOUSEHOLD SIZE
8,605
LABOR FORCE [ PEOPLE ]
57.8%
PERCENT IN LABOR FORCE
2.3%
UNEMPLOYMENT RATE
Sevierville Area Codes
Income in Sevierville
Income Overview in Sevierville
Per Capita Income in Sevierville is $28,186, while median incomes of families and households are $62,582 and $49,449 respectively.
| Characteristic | Number | Measure |
| Per Capita Income | 17,986 | $28,186 |
| Median Family Income | 4,584 | $62,582 |
| Mean Family Income | 4,584 | $84,455 |
| Median Household Income | 7,159 | $49,449 |
| Mean Household Income | 7,159 | $70,375 |
| Income Deficit | 4,584 | $6,010 |
| Wage / Income Gap (%) | 17,986 | 23.10% |
| Wage / Income Gap ($) | 17,986 | 76.90¢ per $1 |
| Gini / Inequality Index | 17,986 | 0.45 |
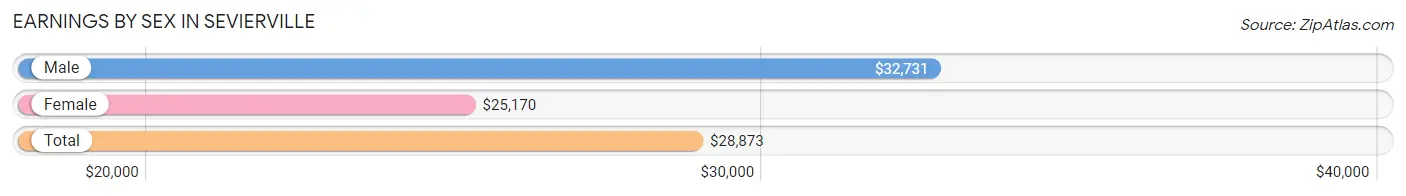
Earnings by Sex in Sevierville
Average Earnings in Sevierville are $28,873, $32,731 for men and $25,170 for women, a difference of 23.1%.
| Sex | Number | Average Earnings |
| Male | 4,976 (53.1%) | $32,731 |
| Female | 4,388 (46.9%) | $25,170 |
| Total | 9,364 (100.0%) | $28,873 |
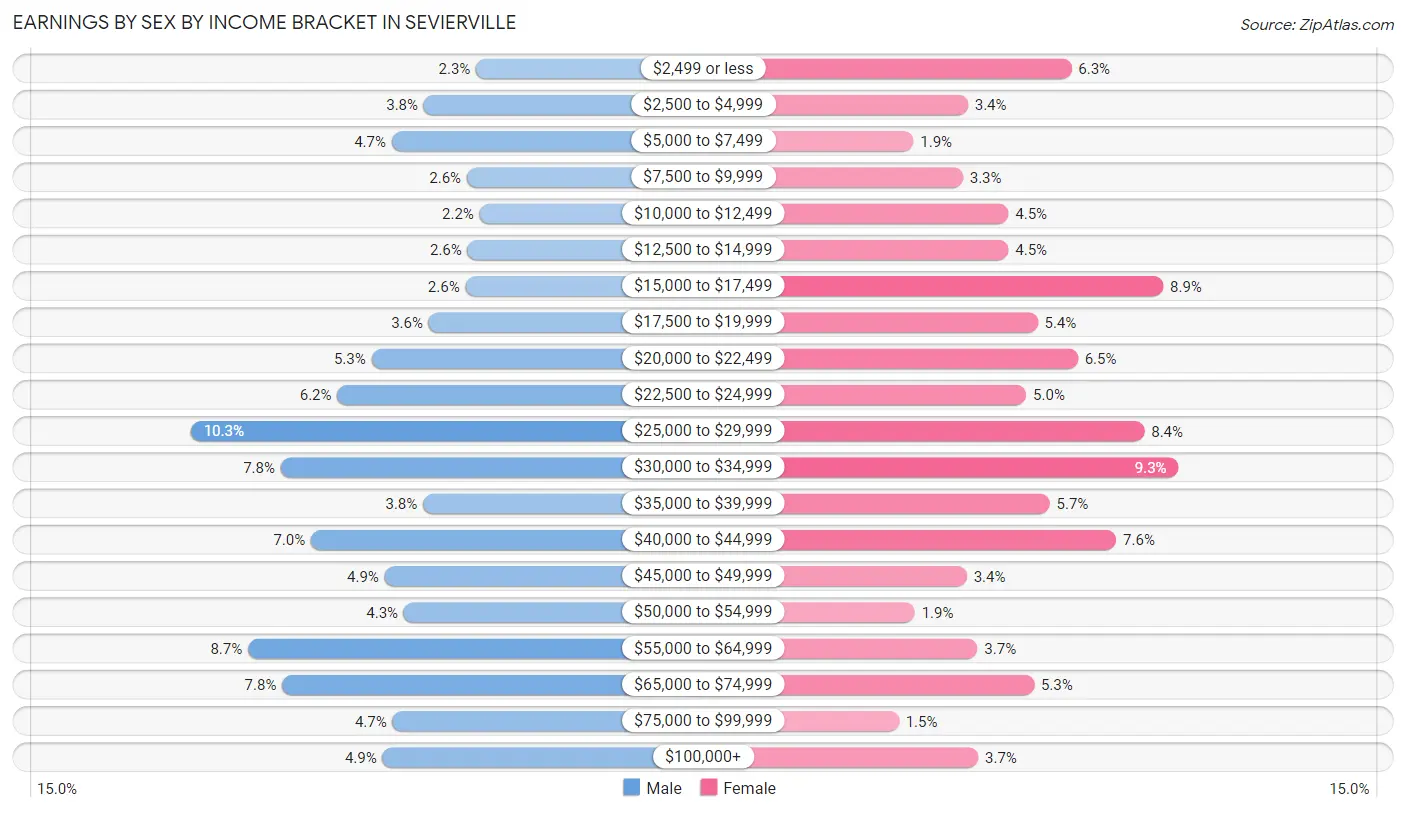
Earnings by Sex by Income Bracket in Sevierville
The most common earnings brackets in Sevierville are $25,000 to $29,999 for men (514 | 10.3%) and $30,000 to $34,999 for women (409 | 9.3%).
| Income | Male | Female |
| $2,499 or less | 115 (2.3%) | 277 (6.3%) |
| $2,500 to $4,999 | 188 (3.8%) | 149 (3.4%) |
| $5,000 to $7,499 | 233 (4.7%) | 82 (1.9%) |
| $7,500 to $9,999 | 128 (2.6%) | 143 (3.3%) |
| $10,000 to $12,499 | 110 (2.2%) | 199 (4.5%) |
| $12,500 to $14,999 | 127 (2.5%) | 199 (4.5%) |
| $15,000 to $17,499 | 130 (2.6%) | 390 (8.9%) |
| $17,500 to $19,999 | 181 (3.6%) | 235 (5.4%) |
| $20,000 to $22,499 | 261 (5.2%) | 285 (6.5%) |
| $22,500 to $24,999 | 309 (6.2%) | 221 (5.0%) |
| $25,000 to $29,999 | 514 (10.3%) | 367 (8.4%) |
| $30,000 to $34,999 | 388 (7.8%) | 409 (9.3%) |
| $35,000 to $39,999 | 189 (3.8%) | 250 (5.7%) |
| $40,000 to $44,999 | 346 (7.0%) | 332 (7.6%) |
| $45,000 to $49,999 | 243 (4.9%) | 148 (3.4%) |
| $50,000 to $54,999 | 216 (4.3%) | 84 (1.9%) |
| $55,000 to $64,999 | 434 (8.7%) | 161 (3.7%) |
| $65,000 to $74,999 | 386 (7.8%) | 231 (5.3%) |
| $75,000 to $99,999 | 232 (4.7%) | 64 (1.5%) |
| $100,000+ | 246 (4.9%) | 162 (3.7%) |
| Total | 4,976 (100.0%) | 4,388 (100.0%) |
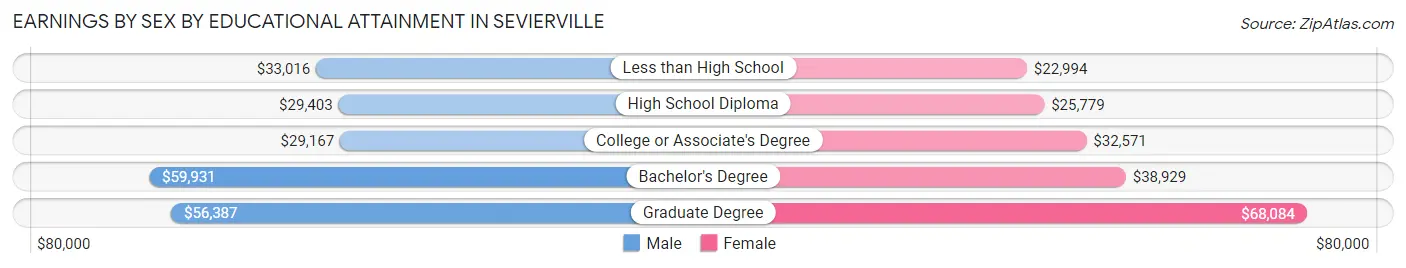
Earnings by Sex by Educational Attainment in Sevierville
Average earnings in Sevierville are $36,863 for men and $28,983 for women, a difference of 21.4%. Men with an educational attainment of bachelor's degree enjoy the highest average annual earnings of $59,931, while those with college or associate's degree education earn the least with $29,167. Women with an educational attainment of graduate degree earn the most with the average annual earnings of $68,084, while those with less than high school education have the smallest earnings of $22,994.
| Educational Attainment | Male Income | Female Income |
| Less than High School | $33,016 | $22,994 |
| High School Diploma | $29,403 | $25,779 |
| College or Associate's Degree | $29,167 | $32,571 |
| Bachelor's Degree | $59,931 | $38,929 |
| Graduate Degree | $56,387 | $68,084 |
| Total | $36,863 | $28,983 |
Family Income in Sevierville
Family Income Brackets in Sevierville
According to the Sevierville family income data, there are 949 families falling into the $50,000 to $74,999 income range, which is the most common income bracket and makes up 20.7% of all families. Conversely, the $10,000 to $14,999 income bracket is the least frequent group with only 50 families (1.1%) belonging to this category.
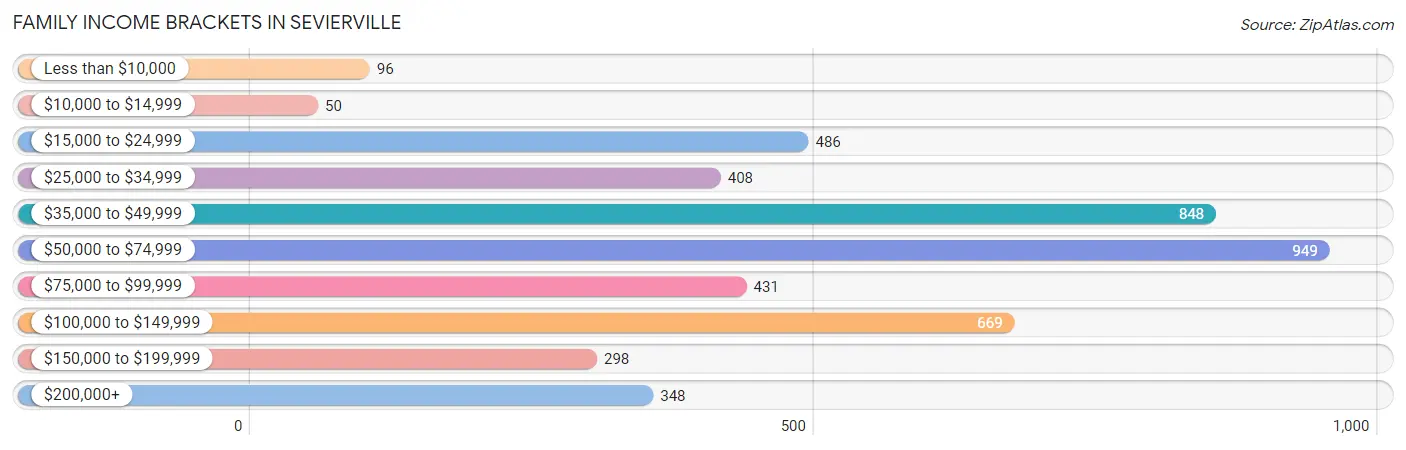
| Income Bracket | # Families | % Families |
| Less than $10,000 | 96 | 2.1% |
| $10,000 to $14,999 | 50 | 1.1% |
| $15,000 to $24,999 | 486 | 10.6% |
| $25,000 to $34,999 | 408 | 8.9% |
| $35,000 to $49,999 | 848 | 18.5% |
| $50,000 to $74,999 | 949 | 20.7% |
| $75,000 to $99,999 | 431 | 9.4% |
| $100,000 to $149,999 | 669 | 14.6% |
| $150,000 to $199,999 | 298 | 6.5% |
| $200,000+ | 348 | 7.6% |
Family Income by Famaliy Size in Sevierville
4-person families (686 | 15.0%) account for the highest median family income in Sevierville with $117,308 per family, while 4-person families (686 | 15.0%) have the highest median income of $29,327 per family member.
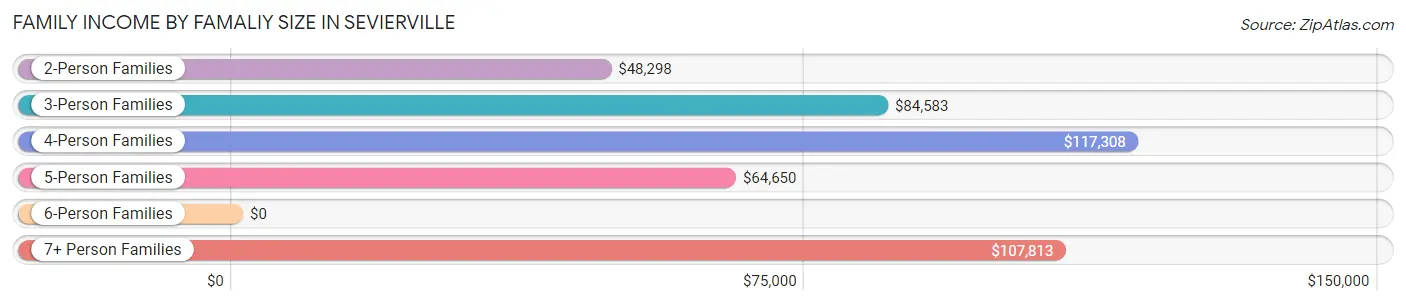
| Income Bracket | # Families | Median Income |
| 2-Person Families | 2,556 (55.8%) | $48,298 |
| 3-Person Families | 874 (19.1%) | $84,583 |
| 4-Person Families | 686 (15.0%) | $117,308 |
| 5-Person Families | 238 (5.2%) | $64,650 |
| 6-Person Families | 188 (4.1%) | $0 |
| 7+ Person Families | 42 (0.9%) | $107,813 |
| Total | 4,584 (100.0%) | $62,582 |
Family Income by Number of Earners in Sevierville
The median family income in Sevierville is $62,582, with families comprising 3+ earners (653) having the highest median family income of $138,984, while families with 1 earner (1,278) have the lowest median family income of $41,711, accounting for 14.2% and 27.9% of families, respectively.
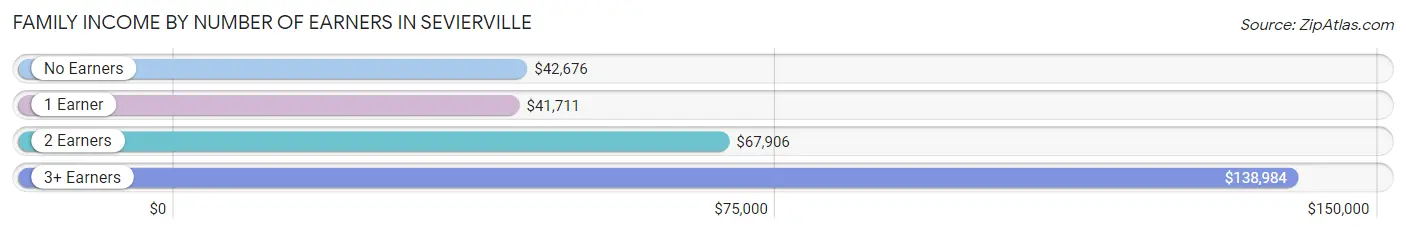
| Number of Earners | # Families | Median Income |
| No Earners | 1,065 (23.2%) | $42,676 |
| 1 Earner | 1,278 (27.9%) | $41,711 |
| 2 Earners | 1,588 (34.6%) | $67,906 |
| 3+ Earners | 653 (14.2%) | $138,984 |
| Total | 4,584 (100.0%) | $62,582 |
Household Income in Sevierville
Household Income Brackets in Sevierville
With 1,460 households falling in the category, the $50,000 to $74,999 income range is the most frequent in Sevierville, accounting for 20.4% of all households. In contrast, only 193 households (2.7%) fall into the less than $10,000 income bracket, making it the least populous group.
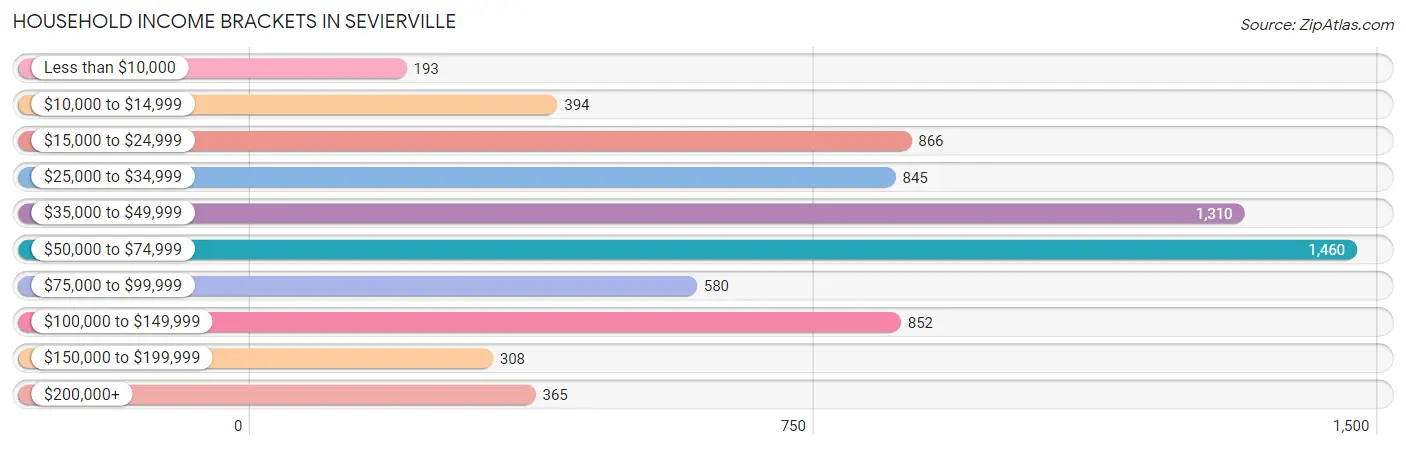
| Income Bracket | # Households | % Households |
| Less than $10,000 | 193 | 2.7% |
| $10,000 to $14,999 | 394 | 5.5% |
| $15,000 to $24,999 | 866 | 12.1% |
| $25,000 to $34,999 | 845 | 11.8% |
| $35,000 to $49,999 | 1,310 | 18.3% |
| $50,000 to $74,999 | 1,460 | 20.4% |
| $75,000 to $99,999 | 580 | 8.1% |
| $100,000 to $149,999 | 852 | 11.9% |
| $150,000 to $199,999 | 308 | 4.3% |
| $200,000+ | 365 | 5.1% |
Household Income by Householder Age in Sevierville
The median household income in Sevierville is $49,449, with the highest median household income of $53,750 found in the 45 to 64 years age bracket for the primary householder. A total of 2,153 households (30.1%) fall into this category. Meanwhile, the 15 to 24 years age bracket for the primary householder has the lowest median household income of $40,690, with 468 households (6.5%) in this group.
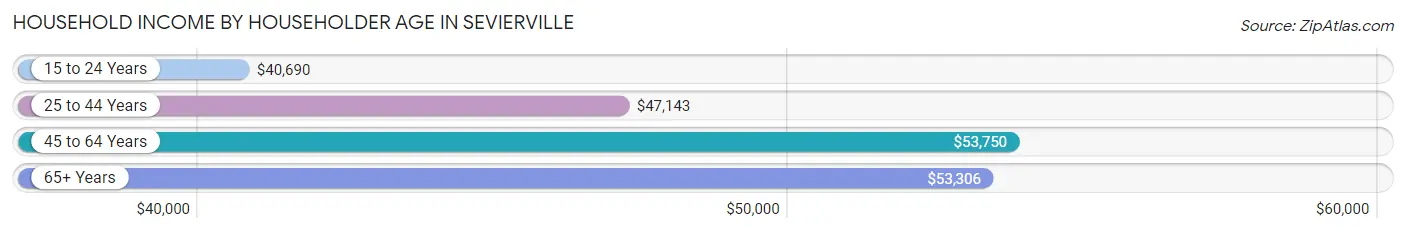
| Income Bracket | # Households | Median Income |
| 15 to 24 Years | 468 (6.5%) | $40,690 |
| 25 to 44 Years | 2,314 (32.3%) | $47,143 |
| 45 to 64 Years | 2,153 (30.1%) | $53,750 |
| 65+ Years | 2,224 (31.1%) | $53,306 |
| Total | 7,159 (100.0%) | $49,449 |
Poverty in Sevierville
Income Below Poverty by Sex and Age in Sevierville
With 13.3% poverty level for males and 17.5% for females among the residents of Sevierville, 5 year old males and 15 year old females are the most vulnerable to poverty, with 62 males (100.0%) and 72 females (50.3%) in their respective age groups living below the poverty level.
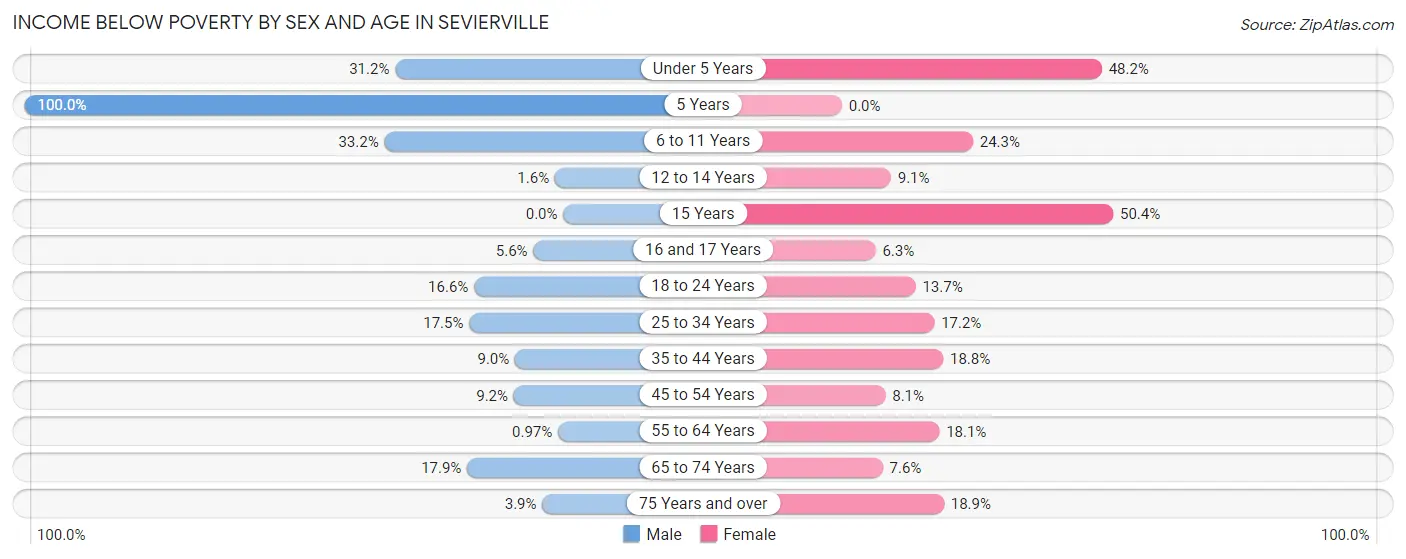
| Age Bracket | Male | Female |
| Under 5 Years | 156 (31.2%) | 247 (48.2%) |
| 5 Years | 62 (100.0%) | 0 (0.0%) |
| 6 to 11 Years | 166 (33.2%) | 132 (24.3%) |
| 12 to 14 Years | 7 (1.5%) | 17 (9.1%) |
| 15 Years | 0 (0.0%) | 72 (50.3%) |
| 16 and 17 Years | 9 (5.6%) | 10 (6.2%) |
| 18 to 24 Years | 126 (16.6%) | 110 (13.7%) |
| 25 to 34 Years | 179 (17.5%) | 194 (17.2%) |
| 35 to 44 Years | 127 (8.9%) | 224 (18.8%) |
| 45 to 54 Years | 77 (9.2%) | 84 (8.1%) |
| 55 to 64 Years | 10 (1.0%) | 217 (18.1%) |
| 65 to 74 Years | 171 (17.8%) | 84 (7.6%) |
| 75 Years and over | 25 (3.9%) | 149 (18.9%) |
| Total | 1,115 (13.3%) | 1,540 (17.5%) |
Income Above Poverty by Sex and Age in Sevierville
According to the poverty statistics in Sevierville, males aged 15 years and females aged 5 years are the age groups that are most secure financially, with 100.0% of males and 100.0% of females in these age groups living above the poverty line.
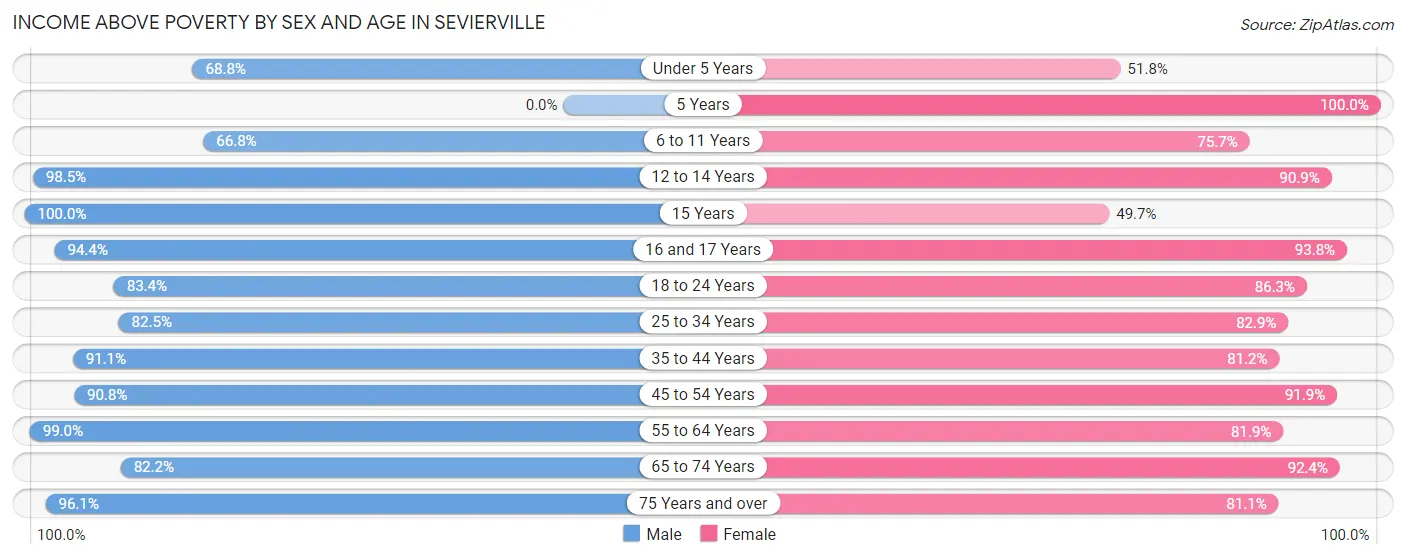
| Age Bracket | Male | Female |
| Under 5 Years | 344 (68.8%) | 265 (51.8%) |
| 5 Years | 0 (0.0%) | 3 (100.0%) |
| 6 to 11 Years | 334 (66.8%) | 411 (75.7%) |
| 12 to 14 Years | 445 (98.5%) | 170 (90.9%) |
| 15 Years | 56 (100.0%) | 71 (49.6%) |
| 16 and 17 Years | 153 (94.4%) | 150 (93.8%) |
| 18 to 24 Years | 635 (83.4%) | 694 (86.3%) |
| 25 to 34 Years | 846 (82.5%) | 937 (82.9%) |
| 35 to 44 Years | 1,292 (91.0%) | 968 (81.2%) |
| 45 to 54 Years | 762 (90.8%) | 957 (91.9%) |
| 55 to 64 Years | 1,023 (99.0%) | 983 (81.9%) |
| 65 to 74 Years | 787 (82.2%) | 1,025 (92.4%) |
| 75 Years and over | 617 (96.1%) | 638 (81.1%) |
| Total | 7,294 (86.7%) | 7,272 (82.5%) |
Income Below Poverty Among Married-Couple Families in Sevierville
The poverty statistics for married-couple families in Sevierville show that 6.8% or 214 of the total 3,142 families live below the poverty line. Families with 3 or 4 children have the highest poverty rate of 27.3%, comprising of 35 families. On the other hand, families with 1 or 2 children have the lowest poverty rate of 4.5%, which includes 38 families.
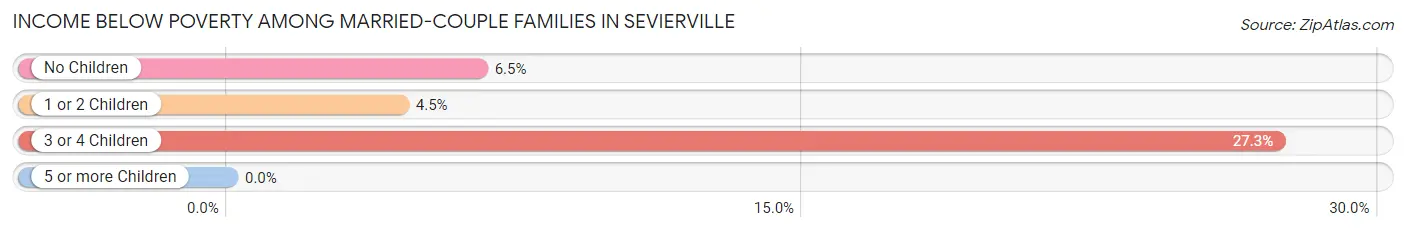
| Children | Above Poverty | Below Poverty |
| No Children | 2,021 (93.5%) | 141 (6.5%) |
| 1 or 2 Children | 814 (95.5%) | 38 (4.5%) |
| 3 or 4 Children | 93 (72.7%) | 35 (27.3%) |
| 5 or more Children | 0 (0.0%) | 0 (0.0%) |
| Total | 2,928 (93.2%) | 214 (6.8%) |
Income Below Poverty Among Single-Parent Households in Sevierville
According to the poverty data in Sevierville, 21.5% or 81 single-father households and 23.4% or 249 single-mother households are living below the poverty line. Among single-father households, those with 3 or 4 children have the highest poverty rate, with 53 households (100.0%) experiencing poverty. Likewise, among single-mother households, those with 1 or 2 children have the highest poverty rate, with 158 households (37.7%) falling below the poverty line.
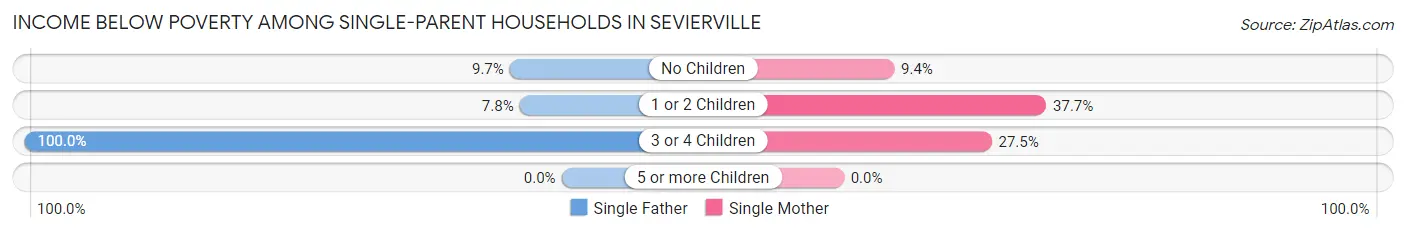
| Children | Single Father | Single Mother |
| No Children | 14 (9.7%) | 45 (9.4%) |
| 1 or 2 Children | 14 (7.8%) | 158 (37.7%) |
| 3 or 4 Children | 53 (100.0%) | 46 (27.5%) |
| 5 or more Children | 0 (0.0%) | 0 (0.0%) |
| Total | 81 (21.5%) | 249 (23.4%) |
Income Below Poverty Among Married-Couple vs Single-Parent Households in Sevierville
The poverty data for Sevierville shows that 214 of the married-couple family households (6.8%) and 330 of the single-parent households (22.9%) are living below the poverty level. Within the married-couple family households, those with 3 or 4 children have the highest poverty rate, with 35 households (27.3%) falling below the poverty line. Among the single-parent households, those with 3 or 4 children have the highest poverty rate, with 99 household (45.0%) living below poverty.
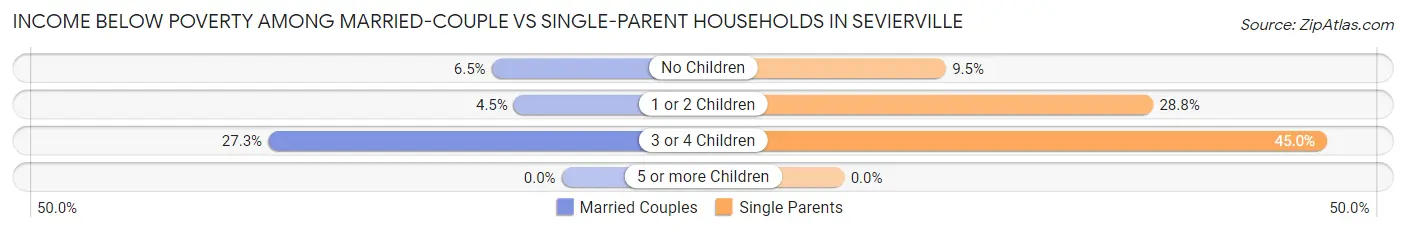
| Children | Married-Couple Families | Single-Parent Households |
| No Children | 141 (6.5%) | 59 (9.5%) |
| 1 or 2 Children | 38 (4.5%) | 172 (28.8%) |
| 3 or 4 Children | 35 (27.3%) | 99 (45.0%) |
| 5 or more Children | 0 (0.0%) | 0 (0.0%) |
| Total | 214 (6.8%) | 330 (22.9%) |
Race in Sevierville
The most populous races in Sevierville are White / Caucasian (14,504 | 80.6%), Hispanic or Latino (3,242 | 18.0%), and Some other Race (1,597 | 8.9%).
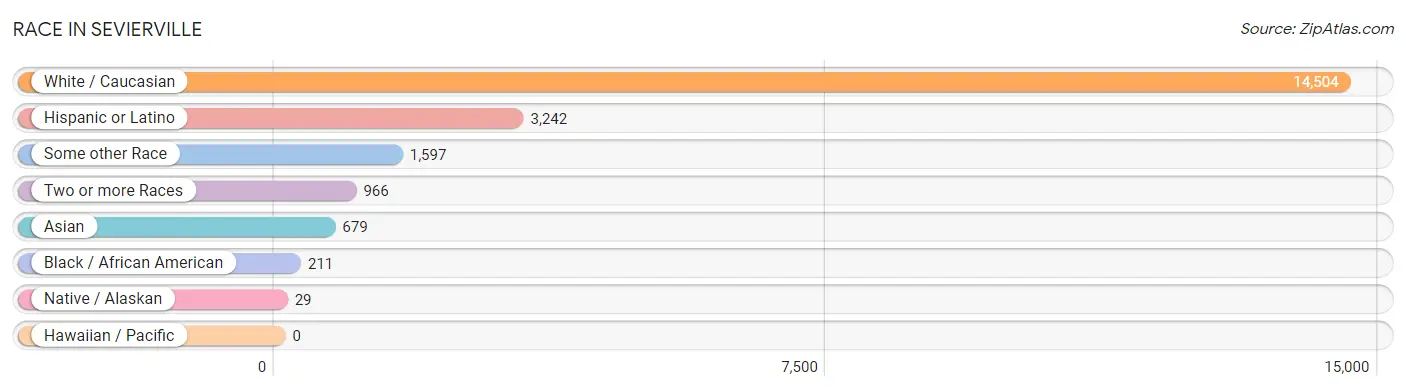
| Race | # Population | % Population |
| Asian | 679 | 3.8% |
| Black / African American | 211 | 1.2% |
| Hawaiian / Pacific | 0 | 0.0% |
| Hispanic or Latino | 3,242 | 18.0% |
| Native / Alaskan | 29 | 0.2% |
| White / Caucasian | 14,504 | 80.6% |
| Two or more Races | 966 | 5.4% |
| Some other Race | 1,597 | 8.9% |
| Total | 17,986 | 100.0% |
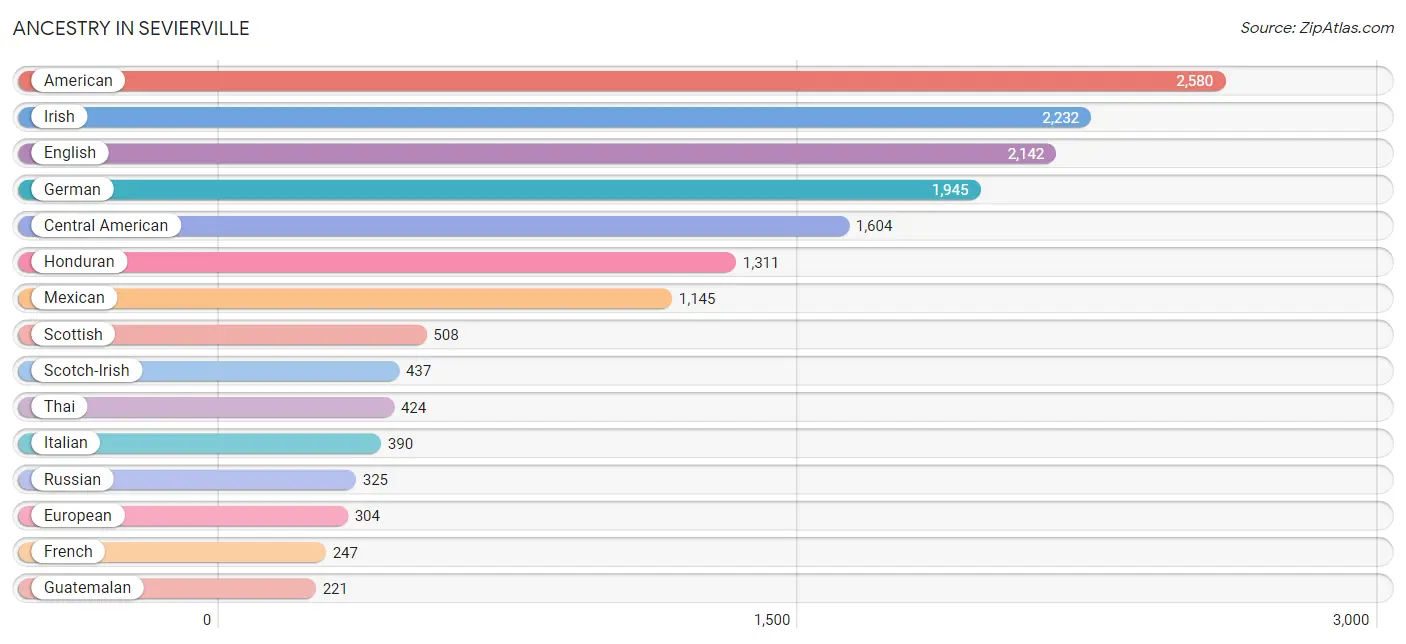
Ancestry in Sevierville
The most populous ancestries reported in Sevierville are American (2,580 | 14.3%), Irish (2,232 | 12.4%), English (2,142 | 11.9%), German (1,945 | 10.8%), and Central American (1,604 | 8.9%), together accounting for 58.4% of all Sevierville residents.
| Ancestry | # Population | % Population |
| American | 2,580 | 14.3% |
| Arab | 11 | 0.1% |
| Belgian | 19 | 0.1% |
| Bhutanese | 25 | 0.1% |
| British | 75 | 0.4% |
| Burmese | 13 | 0.1% |
| Central American | 1,604 | 8.9% |
| Cherokee | 49 | 0.3% |
| Colombian | 160 | 0.9% |
| Crow | 1 | 0.0% |
| Danish | 10 | 0.1% |
| Dominican | 26 | 0.1% |
| Dutch | 189 | 1.1% |
| English | 2,142 | 11.9% |
| European | 304 | 1.7% |
| Filipino | 52 | 0.3% |
| Finnish | 8 | 0.0% |
| French | 247 | 1.4% |
| French Canadian | 62 | 0.3% |
| German | 1,945 | 10.8% |
| Greek | 14 | 0.1% |
| Guatemalan | 221 | 1.2% |
| Honduran | 1,311 | 7.3% |
| Hungarian | 41 | 0.2% |
| Indian (Asian) | 28 | 0.2% |
| Irish | 2,232 | 12.4% |
| Italian | 390 | 2.2% |
| Korean | 15 | 0.1% |
| Lithuanian | 2 | 0.0% |
| Mexican | 1,145 | 6.4% |
| Norwegian | 65 | 0.4% |
| Peruvian | 29 | 0.2% |
| Polish | 49 | 0.3% |
| Portuguese | 101 | 0.6% |
| Puerto Rican | 193 | 1.1% |
| Russian | 325 | 1.8% |
| Salvadoran | 72 | 0.4% |
| Scotch-Irish | 437 | 2.4% |
| Scottish | 508 | 2.8% |
| South American | 189 | 1.1% |
| Swedish | 41 | 0.2% |
| Swiss | 7 | 0.0% |
| Syrian | 11 | 0.1% |
| Thai | 424 | 2.4% |
| Ukrainian | 154 | 0.9% |
| Welsh | 79 | 0.4% | View All 46 Rows |
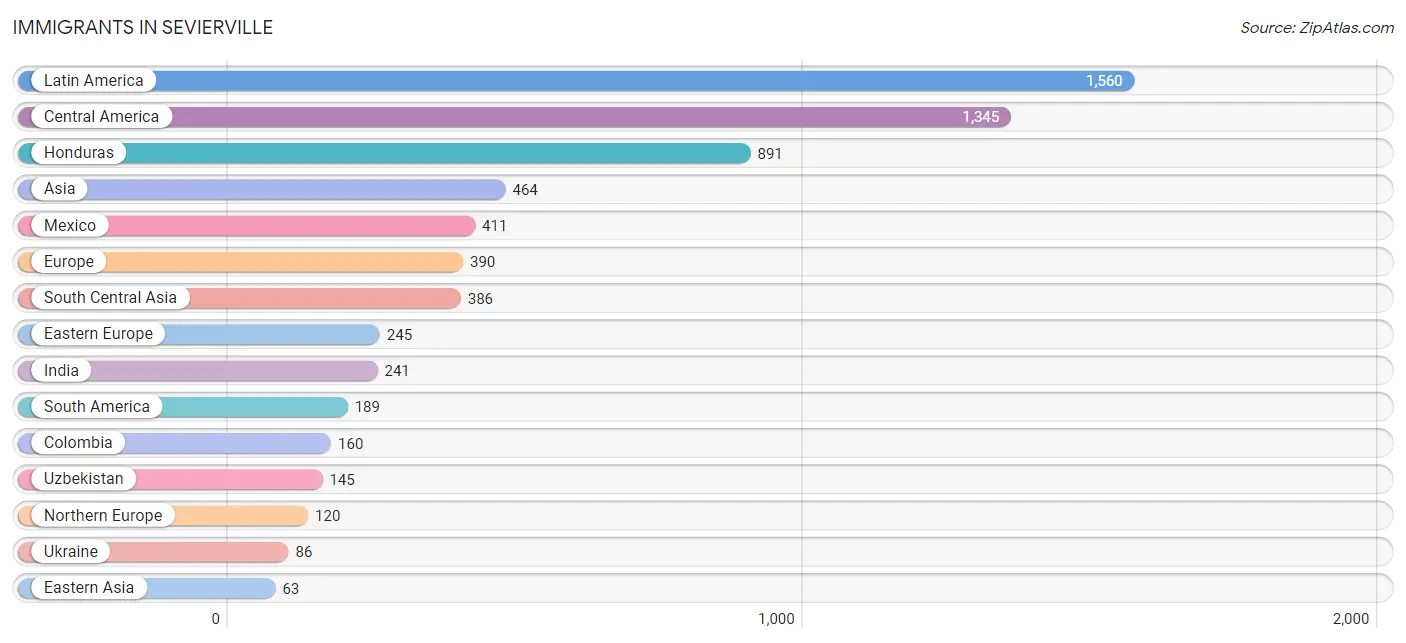
Immigrants in Sevierville
The most numerous immigrant groups reported in Sevierville came from Latin America (1,560 | 8.7%), Central America (1,345 | 7.5%), Honduras (891 | 5.0%), Asia (464 | 2.6%), and Mexico (411 | 2.3%), together accounting for 26.0% of all Sevierville residents.
| Immigration Origin | # Population | % Population |
| Asia | 464 | 2.6% |
| Canada | 14 | 0.1% |
| Caribbean | 26 | 0.1% |
| Central America | 1,345 | 7.5% |
| China | 42 | 0.2% |
| Colombia | 160 | 0.9% |
| Dominican Republic | 26 | 0.1% |
| Eastern Asia | 63 | 0.4% |
| Eastern Europe | 245 | 1.4% |
| El Salvador | 23 | 0.1% |
| England | 48 | 0.3% |
| Europe | 390 | 2.2% |
| Germany | 10 | 0.1% |
| Guatemala | 20 | 0.1% |
| Honduras | 891 | 5.0% |
| India | 241 | 1.3% |
| Japan | 21 | 0.1% |
| Latin America | 1,560 | 8.7% |
| Mexico | 411 | 2.3% |
| Netherlands | 15 | 0.1% |
| Northern Europe | 120 | 0.7% |
| Peru | 29 | 0.2% |
| Philippines | 15 | 0.1% |
| Russia | 7 | 0.0% |
| South America | 189 | 1.1% |
| South Central Asia | 386 | 2.1% |
| South Eastern Asia | 15 | 0.1% |
| Taiwan | 42 | 0.2% |
| Ukraine | 86 | 0.5% |
| Uzbekistan | 145 | 0.8% |
| Western Europe | 25 | 0.1% | View All 31 Rows |
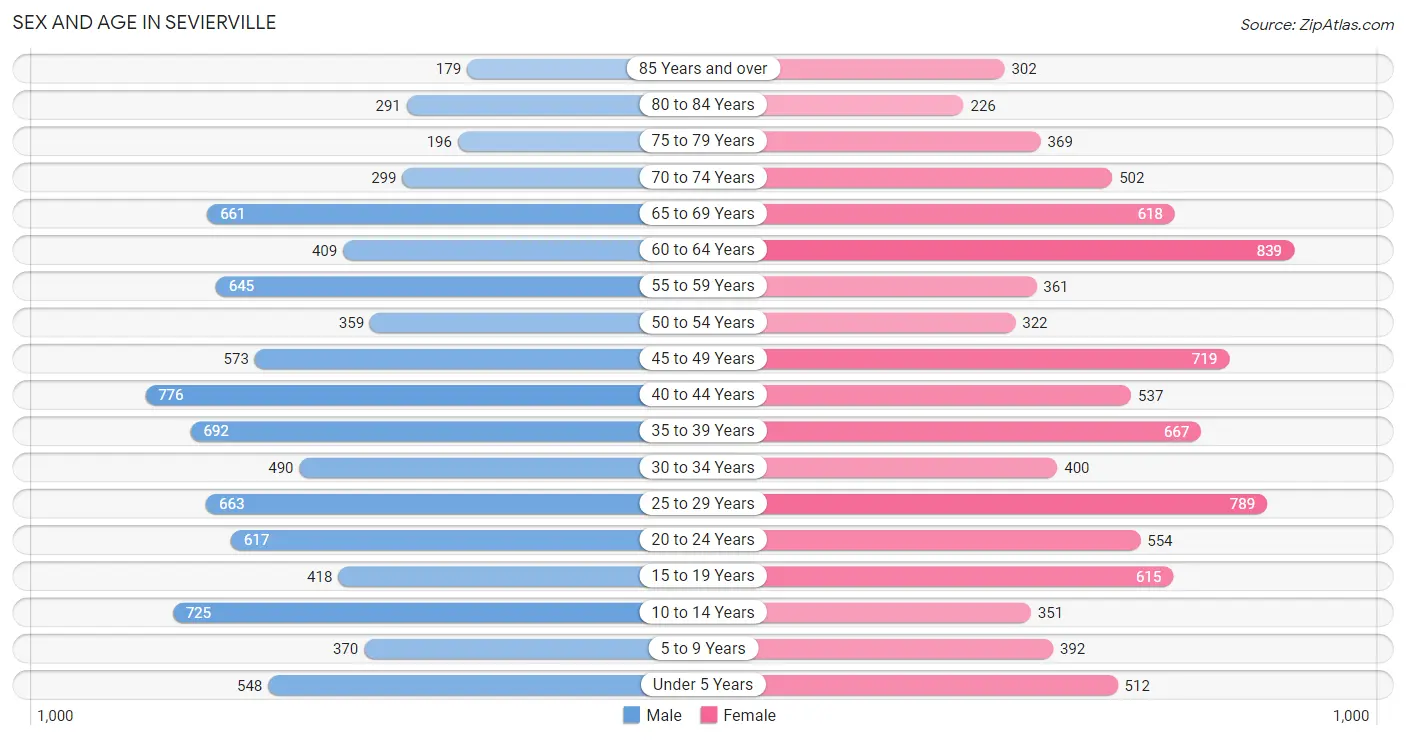
Sex and Age in Sevierville
Sex and Age in Sevierville
The most populous age groups in Sevierville are 40 to 44 Years (776 | 8.7%) for men and 60 to 64 Years (839 | 9.2%) for women.
| Age Bracket | Male | Female |
| Under 5 Years | 548 (6.1%) | 512 (5.6%) |
| 5 to 9 Years | 370 (4.2%) | 392 (4.3%) |
| 10 to 14 Years | 725 (8.1%) | 351 (3.9%) |
| 15 to 19 Years | 418 (4.7%) | 615 (6.8%) |
| 20 to 24 Years | 617 (6.9%) | 554 (6.1%) |
| 25 to 29 Years | 663 (7.4%) | 789 (8.7%) |
| 30 to 34 Years | 490 (5.5%) | 400 (4.4%) |
| 35 to 39 Years | 692 (7.8%) | 667 (7.3%) |
| 40 to 44 Years | 776 (8.7%) | 537 (5.9%) |
| 45 to 49 Years | 573 (6.4%) | 719 (7.9%) |
| 50 to 54 Years | 359 (4.0%) | 322 (3.5%) |
| 55 to 59 Years | 645 (7.2%) | 361 (4.0%) |
| 60 to 64 Years | 409 (4.6%) | 839 (9.2%) |
| 65 to 69 Years | 661 (7.4%) | 618 (6.8%) |
| 70 to 74 Years | 299 (3.4%) | 502 (5.5%) |
| 75 to 79 Years | 196 (2.2%) | 369 (4.1%) |
| 80 to 84 Years | 291 (3.3%) | 226 (2.5%) |
| 85 Years and over | 179 (2.0%) | 302 (3.3%) |
| Total | 8,911 (100.0%) | 9,075 (100.0%) |
Families and Households in Sevierville
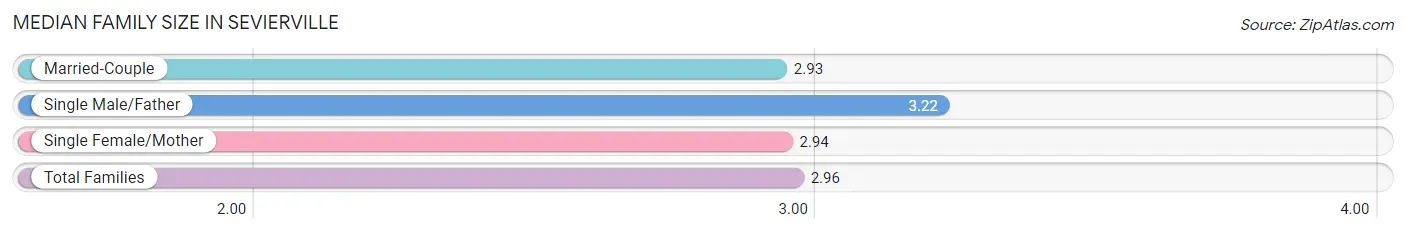
Median Family Size in Sevierville
The median family size in Sevierville is 2.96 persons per family, with single male/father families (377 | 8.2%) accounting for the largest median family size of 3.22 persons per family. On the other hand, married-couple families (3,142 | 68.5%) represent the smallest median family size with 2.93 persons per family.
| Family Type | # Families | Family Size |
| Married-Couple | 3,142 (68.5%) | 2.93 |
| Single Male/Father | 377 (8.2%) | 3.22 |
| Single Female/Mother | 1,065 (23.2%) | 2.94 |
| Total Families | 4,584 (100.0%) | 2.96 |
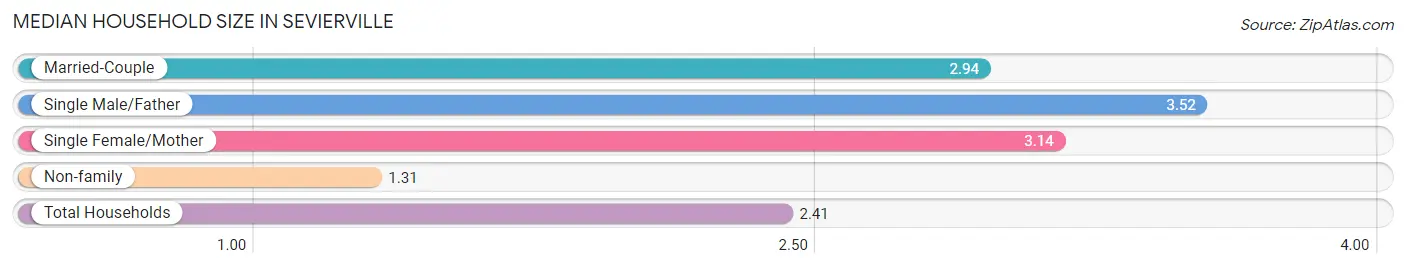
Median Household Size in Sevierville
The median household size in Sevierville is 2.41 persons per household, with single male/father households (377 | 5.3%) accounting for the largest median household size of 3.52 persons per household. non-family households (2,575 | 36.0%) represent the smallest median household size with 1.31 persons per household.
| Household Type | # Households | Household Size |
| Married-Couple | 3,142 (43.9%) | 2.94 |
| Single Male/Father | 377 (5.3%) | 3.52 |
| Single Female/Mother | 1,065 (14.9%) | 3.14 |
| Non-family | 2,575 (36.0%) | 1.31 |
| Total Households | 7,159 (100.0%) | 2.41 |
Household Size by Marriage Status in Sevierville
Out of a total of 7,159 households in Sevierville, 4,584 (64.0%) are family households, while 2,575 (36.0%) are nonfamily households. The most numerous type of family households are 2-person households, comprising 2,394, and the most common type of nonfamily households are 1-person households, comprising 2,001.
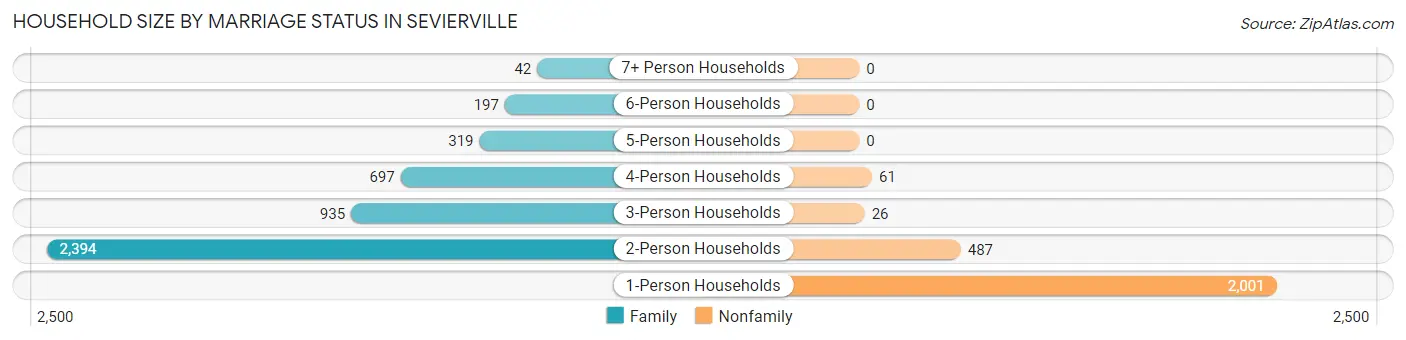
| Household Size | Family Households | Nonfamily Households |
| 1-Person Households | - | 2,001 (28.0%) |
| 2-Person Households | 2,394 (33.4%) | 487 (6.8%) |
| 3-Person Households | 935 (13.1%) | 26 (0.4%) |
| 4-Person Households | 697 (9.7%) | 61 (0.9%) |
| 5-Person Households | 319 (4.5%) | 0 (0.0%) |
| 6-Person Households | 197 (2.8%) | 0 (0.0%) |
| 7+ Person Households | 42 (0.6%) | 0 (0.0%) |
| Total | 4,584 (64.0%) | 2,575 (36.0%) |
Female Fertility in Sevierville
Fertility by Age in Sevierville
Average fertility rate in Sevierville is 85.0 births per 1,000 women. Women in the age bracket of 20 to 34 years have the highest fertility rate with 100.0 births per 1,000 women. Women in the age bracket of 35 to 50 years acount for 52.7% of all women with births.
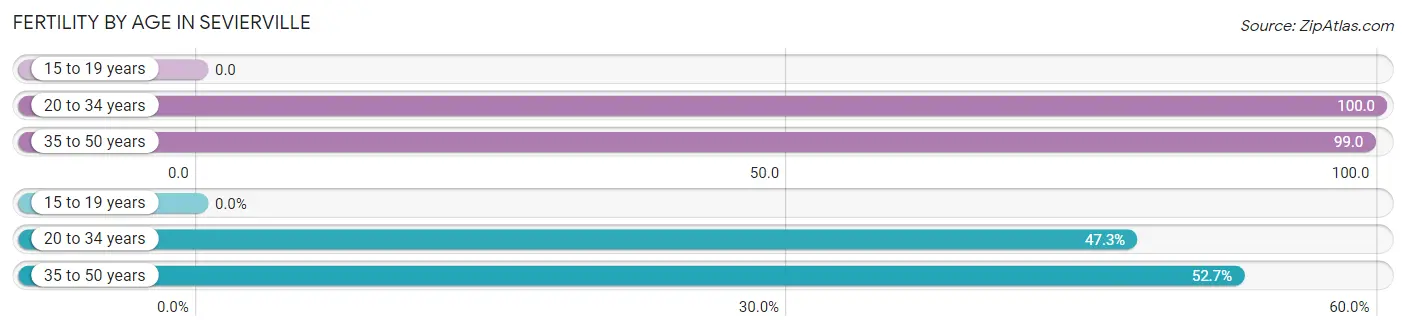
| Age Bracket | Women with Births | Births / 1,000 Women |
| 15 to 19 years | 0 (0.0%) | 0.0 |
| 20 to 34 years | 174 (47.3%) | 100.0 |
| 35 to 50 years | 194 (52.7%) | 99.0 |
| Total | 368 (100.0%) | 85.0 |
Fertility by Age by Marriage Status in Sevierville
50.3% of women with births (368) in Sevierville are married. The highest percentage of unmarried women with births falls into 35 to 50 years age bracket with 77.8% of them unmarried at the time of birth, while the lowest percentage of unmarried women with births belong to 20 to 34 years age bracket with 18.4% of them unmarried.
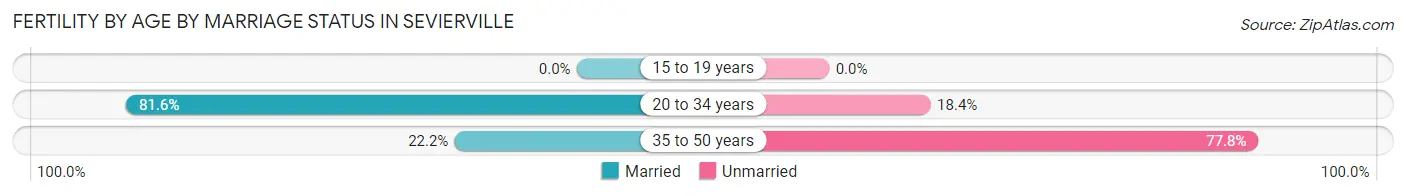
| Age Bracket | Married | Unmarried |
| 15 to 19 years | 0 (0.0%) | 0 (0.0%) |
| 20 to 34 years | 142 (81.6%) | 32 (18.4%) |
| 35 to 50 years | 43 (22.2%) | 151 (77.8%) |
| Total | 185 (50.3%) | 183 (49.7%) |
Fertility by Education in Sevierville
Average fertility rate in Sevierville is 85.0 births per 1,000 women. Women with the education attainment of high school diploma have the highest fertility rate of 136.0 births per 1,000 women, while women with the education attainment of less than high school have the lowest fertility at 19.0 births per 1,000 women. Women with the education attainment of high school diploma represent 60.1% of all women with births.
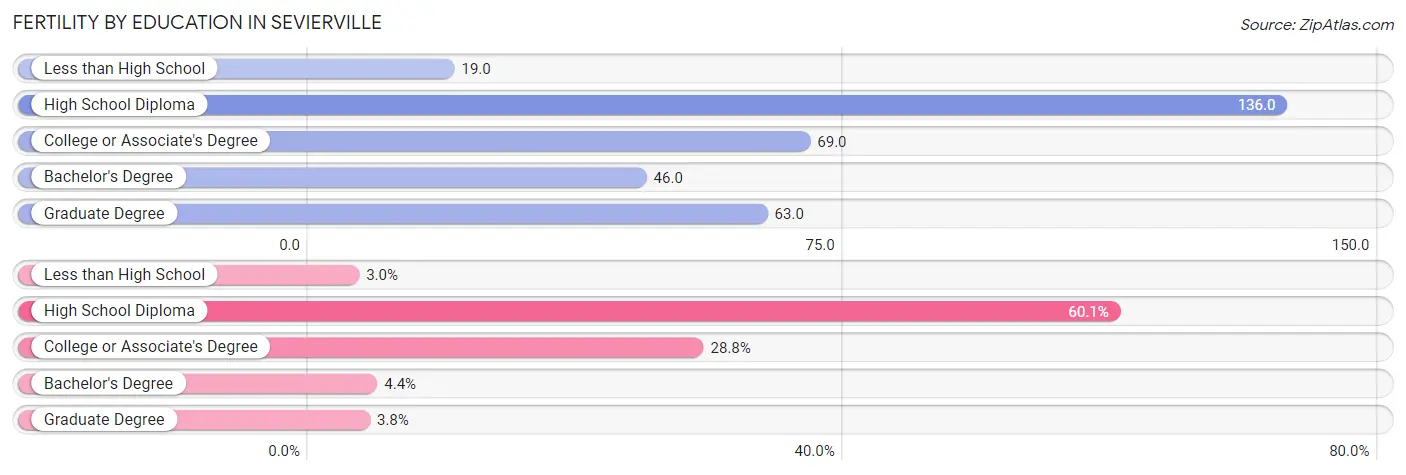
| Educational Attainment | Women with Births | Births / 1,000 Women |
| Less than High School | 11 (3.0%) | 19.0 |
| High School Diploma | 221 (60.1%) | 136.0 |
| College or Associate's Degree | 106 (28.8%) | 69.0 |
| Bachelor's Degree | 16 (4.3%) | 46.0 |
| Graduate Degree | 14 (3.8%) | 63.0 |
| Total | 368 (100.0%) | 85.0 |
Fertility by Education by Marriage Status in Sevierville
49.7% of women with births in Sevierville are unmarried. Women with the educational attainment of graduate degree are most likely to be married with 100.0% of them married at childbirth, while women with the educational attainment of less than high school are least likely to be married with 100.0% of them unmarried at childbirth.
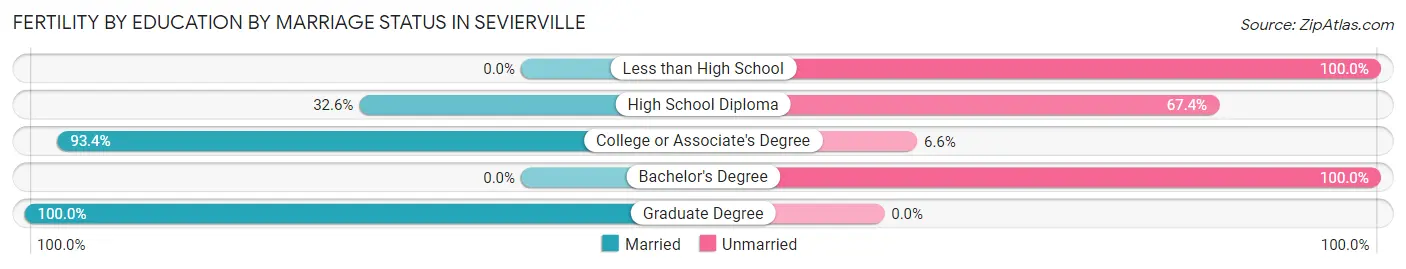
| Educational Attainment | Married | Unmarried |
| Less than High School | 0 (0.0%) | 11 (100.0%) |
| High School Diploma | 72 (32.6%) | 149 (67.4%) |
| College or Associate's Degree | 99 (93.4%) | 7 (6.6%) |
| Bachelor's Degree | 0 (0.0%) | 16 (100.0%) |
| Graduate Degree | 14 (100.0%) | 0 (0.0%) |
| Total | 185 (50.3%) | 183 (49.7%) |
Employment Characteristics in Sevierville
Employment by Class of Employer in Sevierville
Among the 8,226 employed individuals in Sevierville, private company employees (6,564 | 79.8%), self-employed (not incorporated) (503 | 6.1%), and local government employees (400 | 4.9%) make up the most common classes of employment.
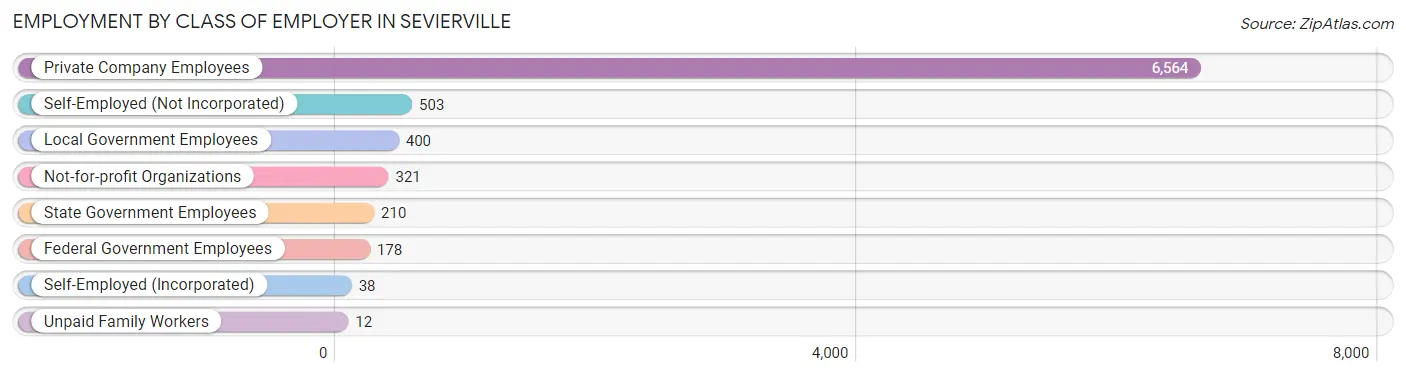
| Employer Class | # Employees | % Employees |
| Private Company Employees | 6,564 | 79.8% |
| Self-Employed (Incorporated) | 38 | 0.5% |
| Self-Employed (Not Incorporated) | 503 | 6.1% |
| Not-for-profit Organizations | 321 | 3.9% |
| Local Government Employees | 400 | 4.9% |
| State Government Employees | 210 | 2.5% |
| Federal Government Employees | 178 | 2.2% |
| Unpaid Family Workers | 12 | 0.2% |
| Total | 8,226 | 100.0% |
Employment Status by Age in Sevierville
According to the labor force statistics for Sevierville, out of the total population over 16 years of age (14,888), 57.8% or 8,605 individuals are in the labor force, with 2.3% or 198 of them unemployed. The age group with the highest labor force participation rate is 25 to 29 years, with 89.5% or 1,300 individuals in the labor force. Within the labor force, the 16 to 19 years age range has the highest percentage of unemployed individuals, with 16.5% or 67 of them being unemployed.
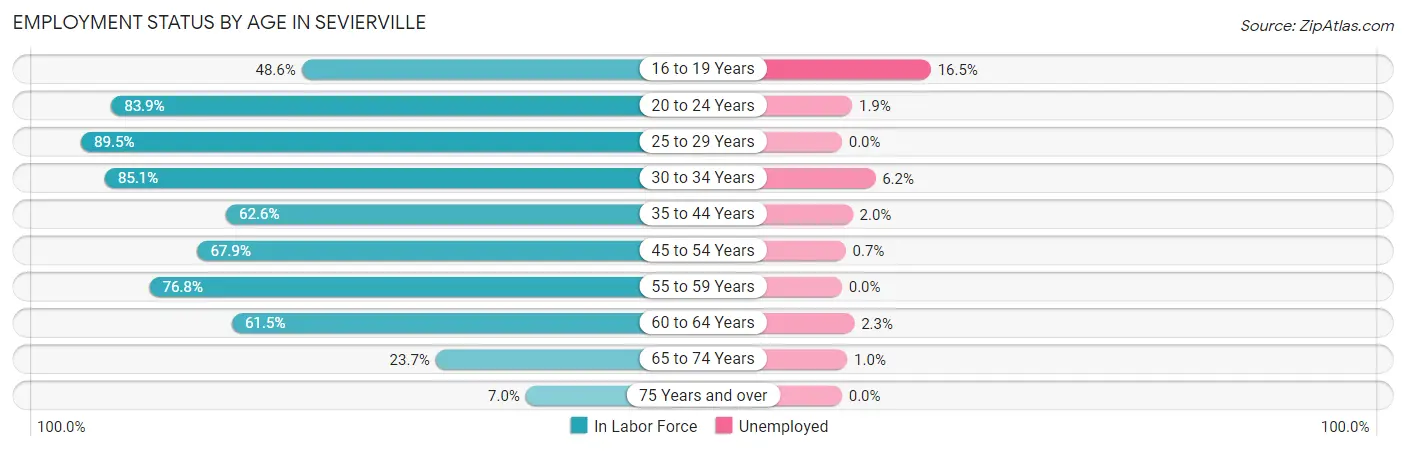
| Age Bracket | In Labor Force | Unemployed |
| 16 to 19 Years | 405 (48.6%) | 67 (16.5%) |
| 20 to 24 Years | 982 (83.9%) | 19 (1.9%) |
| 25 to 29 Years | 1,300 (89.5%) | 0 (0.0%) |
| 30 to 34 Years | 757 (85.1%) | 47 (6.2%) |
| 35 to 44 Years | 1,673 (62.6%) | 33 (2.0%) |
| 45 to 54 Years | 1,340 (67.9%) | 9 (0.7%) |
| 55 to 59 Years | 773 (76.8%) | 0 (0.0%) |
| 60 to 64 Years | 768 (61.5%) | 18 (2.3%) |
| 65 to 74 Years | 493 (23.7%) | 5 (1.0%) |
| 75 Years and over | 109 (7.0%) | 0 (0.0%) |
| Total | 8,605 (57.8%) | 198 (2.3%) |
Employment Status by Educational Attainment in Sevierville
According to labor force statistics for Sevierville, 71.5% of individuals (6,607) out of the total population between 25 and 64 years of age (9,241) are in the labor force, with 1.6% or 106 of them being unemployed. The group with the highest labor force participation rate are those with the educational attainment of bachelor's degree or higher, with 84.3% or 1,706 individuals in the labor force. Within the labor force, individuals with high school diploma education have the highest percentage of unemployment, with 3.3% or 75 of them being unemployed.
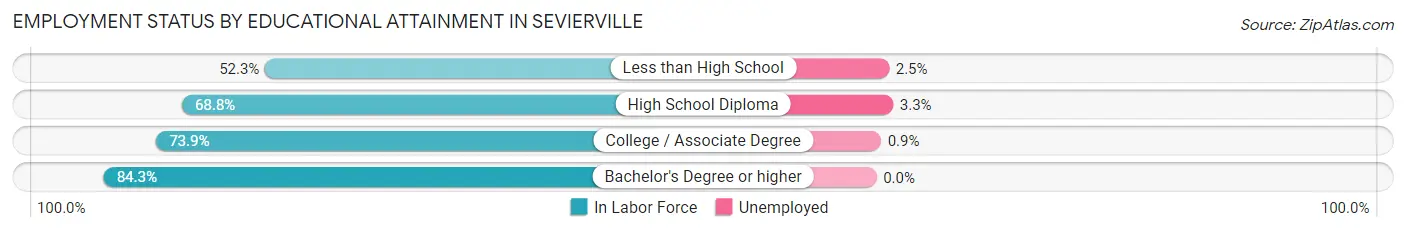
| Educational Attainment | In Labor Force | Unemployed |
| Less than High School | 636 (52.3%) | 30 (2.5%) |
| High School Diploma | 2,273 (68.8%) | 109 (3.3%) |
| College / Associate Degree | 1,992 (73.9%) | 24 (0.9%) |
| Bachelor's Degree or higher | 1,706 (84.3%) | 0 (0.0%) |
| Total | 6,607 (71.5%) | 148 (1.6%) |
Employment Occupations by Sex in Sevierville
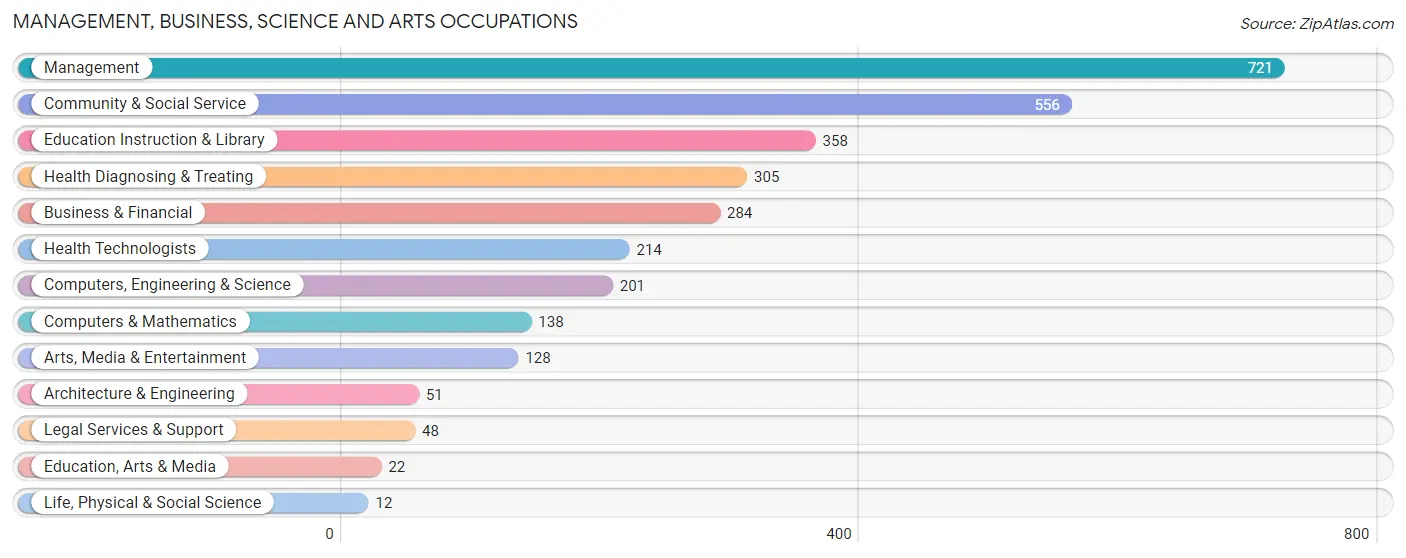
Management, Business, Science and Arts Occupations
The most common Management, Business, Science and Arts occupations in Sevierville are Management (721 | 8.8%), Community & Social Service (556 | 6.8%), Education Instruction & Library (358 | 4.3%), Health Diagnosing & Treating (305 | 3.7%), and Business & Financial (284 | 3.5%).
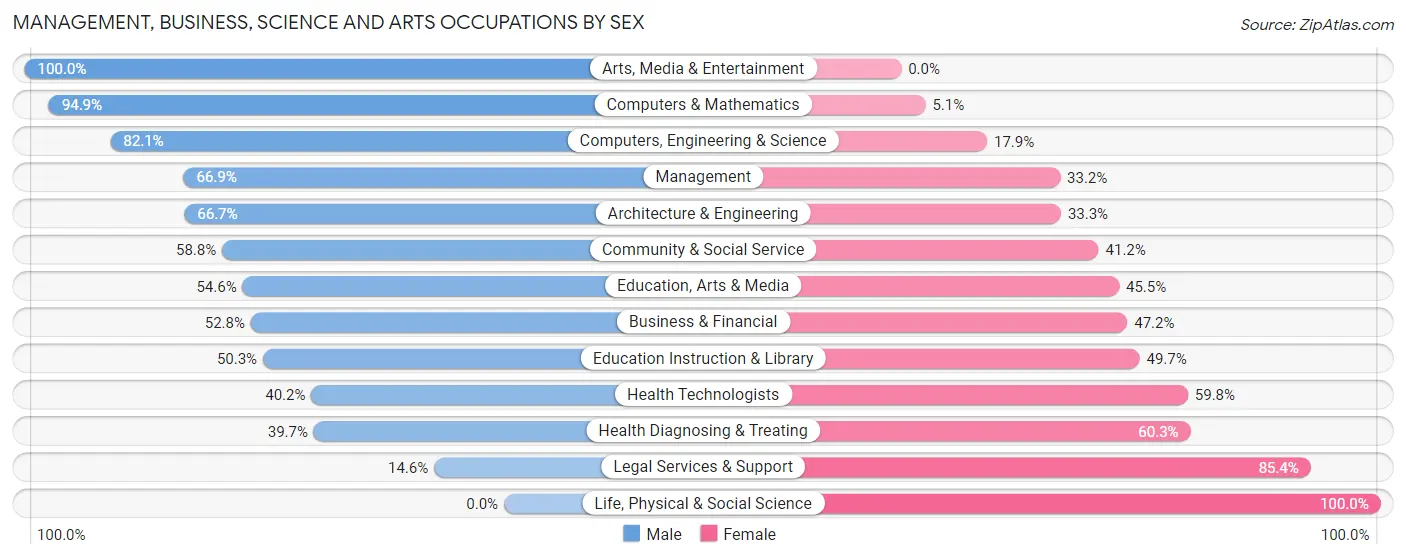
Management, Business, Science and Arts Occupations by Sex
Within the Management, Business, Science and Arts occupations in Sevierville, the most male-oriented occupations are Arts, Media & Entertainment (100.0%), Computers & Mathematics (94.9%), and Computers, Engineering & Science (82.1%), while the most female-oriented occupations are Life, Physical & Social Science (100.0%), Legal Services & Support (85.4%), and Health Diagnosing & Treating (60.3%).
| Occupation | Male | Female |
| Management | 482 (66.8%) | 239 (33.2%) |
| Business & Financial | 150 (52.8%) | 134 (47.2%) |
| Computers, Engineering & Science | 165 (82.1%) | 36 (17.9%) |
| Computers & Mathematics | 131 (94.9%) | 7 (5.1%) |
| Architecture & Engineering | 34 (66.7%) | 17 (33.3%) |
| Life, Physical & Social Science | 0 (0.0%) | 12 (100.0%) |
| Community & Social Service | 327 (58.8%) | 229 (41.2%) |
| Education, Arts & Media | 12 (54.5%) | 10 (45.5%) |
| Legal Services & Support | 7 (14.6%) | 41 (85.4%) |
| Education Instruction & Library | 180 (50.3%) | 178 (49.7%) |
| Arts, Media & Entertainment | 128 (100.0%) | 0 (0.0%) |
| Health Diagnosing & Treating | 121 (39.7%) | 184 (60.3%) |
| Health Technologists | 86 (40.2%) | 128 (59.8%) |
| Total (Category) | 1,245 (60.2%) | 822 (39.8%) |
| Total (Overall) | 4,361 (53.0%) | 3,868 (47.0%) |
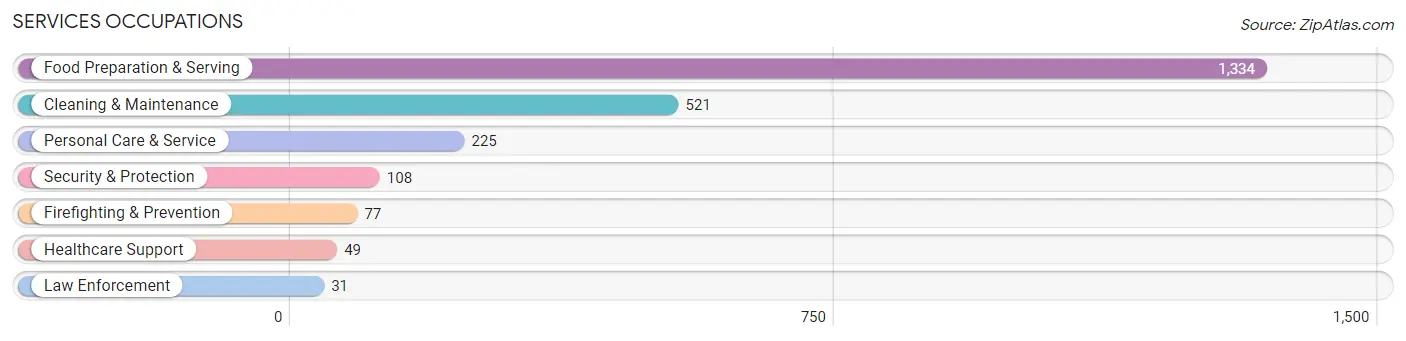
Services Occupations
The most common Services occupations in Sevierville are Food Preparation & Serving (1,334 | 16.2%), Cleaning & Maintenance (521 | 6.3%), Personal Care & Service (225 | 2.7%), Security & Protection (108 | 1.3%), and Firefighting & Prevention (77 | 0.9%).
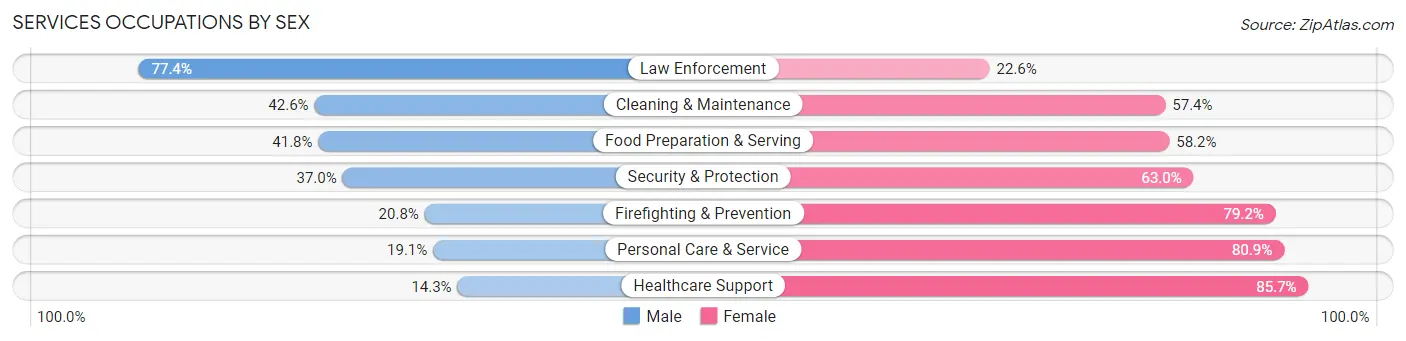
Services Occupations by Sex
Within the Services occupations in Sevierville, the most male-oriented occupations are Law Enforcement (77.4%), Cleaning & Maintenance (42.6%), and Food Preparation & Serving (41.8%), while the most female-oriented occupations are Healthcare Support (85.7%), Personal Care & Service (80.9%), and Firefighting & Prevention (79.2%).
| Occupation | Male | Female |
| Healthcare Support | 7 (14.3%) | 42 (85.7%) |
| Security & Protection | 40 (37.0%) | 68 (63.0%) |
| Firefighting & Prevention | 16 (20.8%) | 61 (79.2%) |
| Law Enforcement | 24 (77.4%) | 7 (22.6%) |
| Food Preparation & Serving | 558 (41.8%) | 776 (58.2%) |
| Cleaning & Maintenance | 222 (42.6%) | 299 (57.4%) |
| Personal Care & Service | 43 (19.1%) | 182 (80.9%) |
| Total (Category) | 870 (38.9%) | 1,367 (61.1%) |
| Total (Overall) | 4,361 (53.0%) | 3,868 (47.0%) |
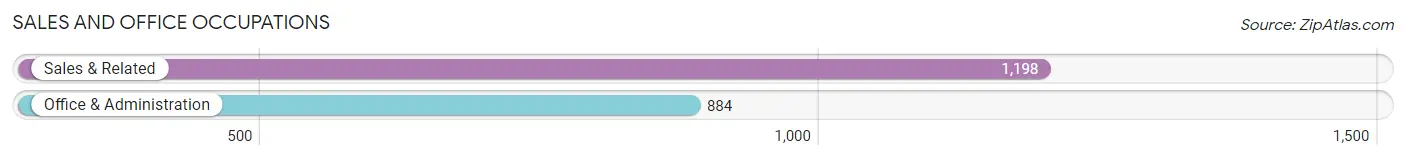
Sales and Office Occupations
The most common Sales and Office occupations in Sevierville are Sales & Related (1,198 | 14.6%), and Office & Administration (884 | 10.7%).
Sales and Office Occupations by Sex
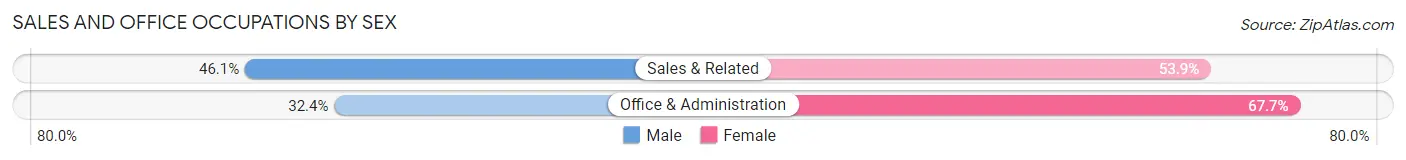
| Occupation | Male | Female |
| Sales & Related | 552 (46.1%) | 646 (53.9%) |
| Office & Administration | 286 (32.4%) | 598 (67.6%) |
| Total (Category) | 838 (40.3%) | 1,244 (59.8%) |
| Total (Overall) | 4,361 (53.0%) | 3,868 (47.0%) |
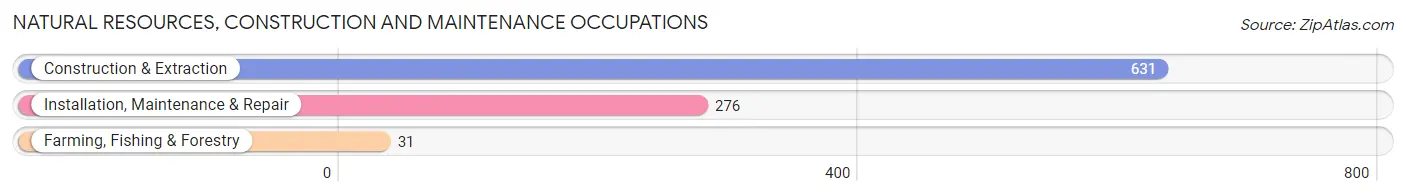
Natural Resources, Construction and Maintenance Occupations
The most common Natural Resources, Construction and Maintenance occupations in Sevierville are Construction & Extraction (631 | 7.7%), Installation, Maintenance & Repair (276 | 3.4%), and Farming, Fishing & Forestry (31 | 0.4%).
Natural Resources, Construction and Maintenance Occupations by Sex
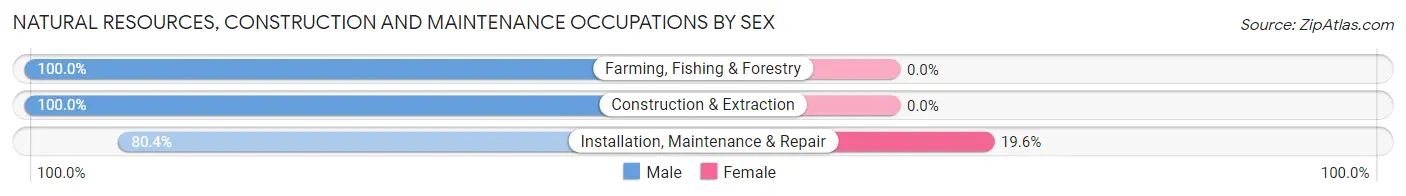
| Occupation | Male | Female |
| Farming, Fishing & Forestry | 31 (100.0%) | 0 (0.0%) |
| Construction & Extraction | 631 (100.0%) | 0 (0.0%) |
| Installation, Maintenance & Repair | 222 (80.4%) | 54 (19.6%) |
| Total (Category) | 884 (94.2%) | 54 (5.8%) |
| Total (Overall) | 4,361 (53.0%) | 3,868 (47.0%) |
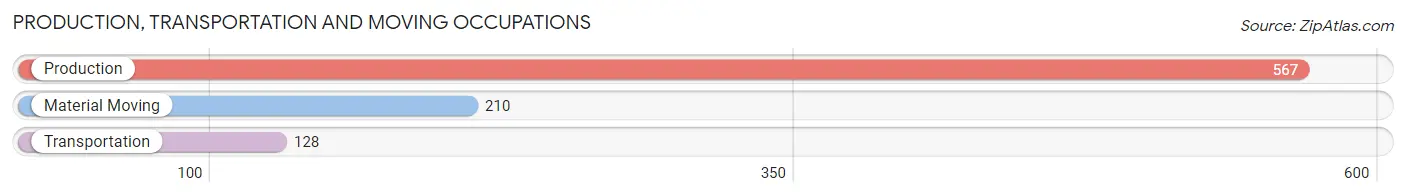
Production, Transportation and Moving Occupations
The most common Production, Transportation and Moving occupations in Sevierville are Production (567 | 6.9%), Material Moving (210 | 2.5%), and Transportation (128 | 1.6%).
Production, Transportation and Moving Occupations by Sex
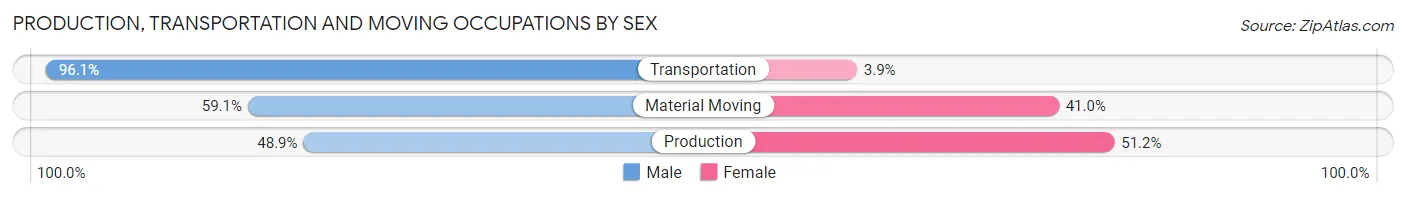
| Occupation | Male | Female |
| Production | 277 (48.8%) | 290 (51.1%) |
| Transportation | 123 (96.1%) | 5 (3.9%) |
| Material Moving | 124 (59.1%) | 86 (40.9%) |
| Total (Category) | 524 (57.9%) | 381 (42.1%) |
| Total (Overall) | 4,361 (53.0%) | 3,868 (47.0%) |
Employment Industries by Sex in Sevierville
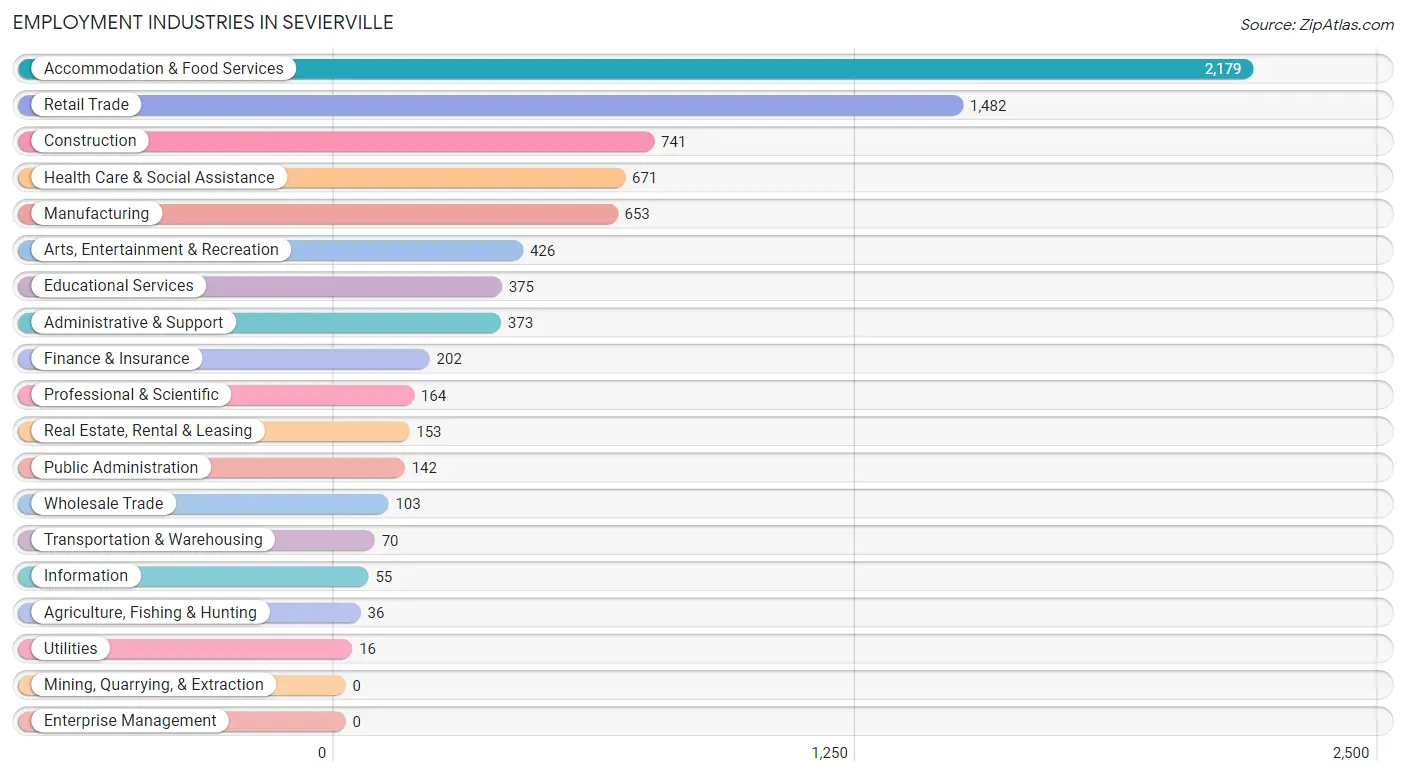
Employment Industries in Sevierville
The major employment industries in Sevierville include Accommodation & Food Services (2,179 | 26.5%), Retail Trade (1,482 | 18.0%), Construction (741 | 9.0%), Health Care & Social Assistance (671 | 8.2%), and Manufacturing (653 | 7.9%).
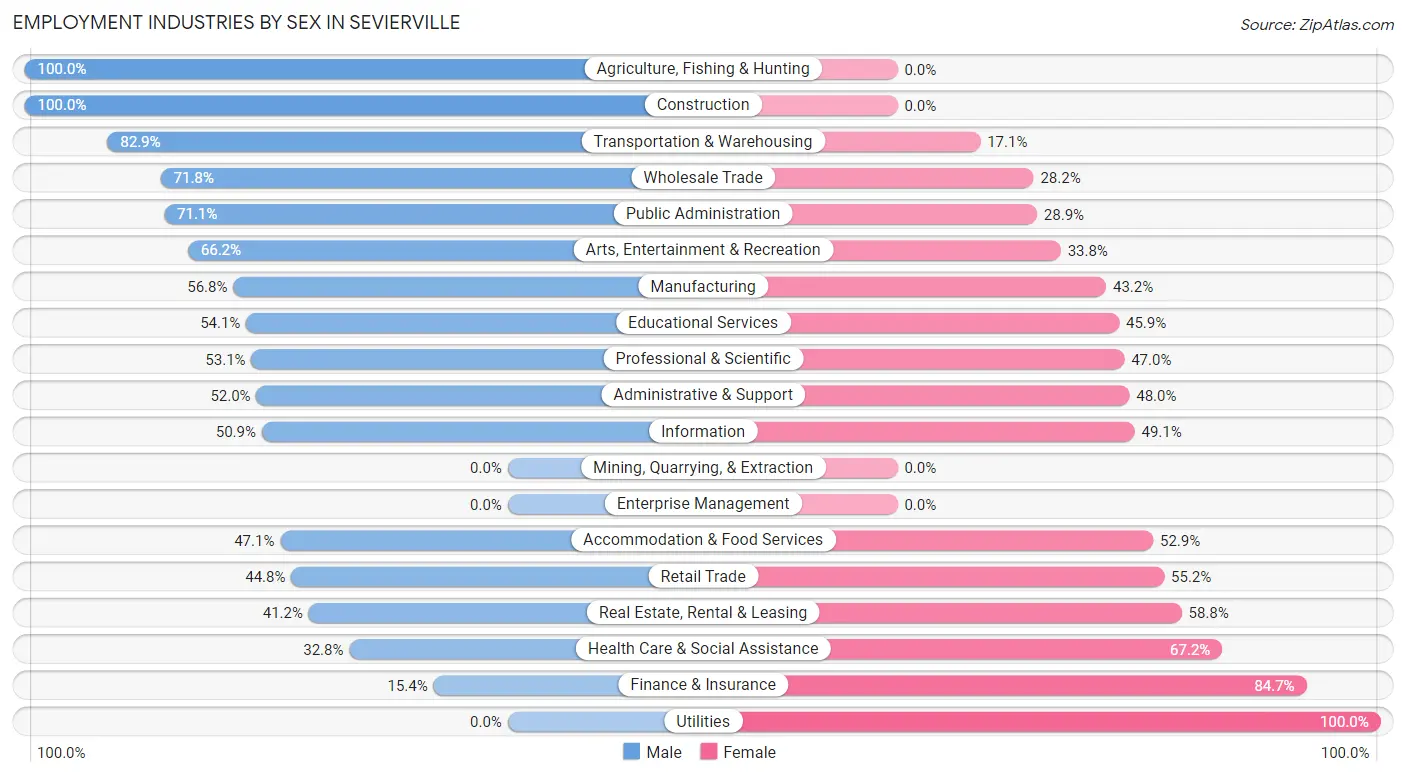
Employment Industries by Sex in Sevierville
The Sevierville industries that see more men than women are Agriculture, Fishing & Hunting (100.0%), Construction (100.0%), and Transportation & Warehousing (82.9%), whereas the industries that tend to have a higher number of women are Utilities (100.0%), Finance & Insurance (84.7%), and Health Care & Social Assistance (67.2%).
| Industry | Male | Female |
| Agriculture, Fishing & Hunting | 36 (100.0%) | 0 (0.0%) |
| Mining, Quarrying, & Extraction | 0 (0.0%) | 0 (0.0%) |
| Construction | 741 (100.0%) | 0 (0.0%) |
| Manufacturing | 371 (56.8%) | 282 (43.2%) |
| Wholesale Trade | 74 (71.8%) | 29 (28.2%) |
| Retail Trade | 664 (44.8%) | 818 (55.2%) |
| Transportation & Warehousing | 58 (82.9%) | 12 (17.1%) |
| Utilities | 0 (0.0%) | 16 (100.0%) |
| Information | 28 (50.9%) | 27 (49.1%) |
| Finance & Insurance | 31 (15.3%) | 171 (84.7%) |
| Real Estate, Rental & Leasing | 63 (41.2%) | 90 (58.8%) |
| Professional & Scientific | 87 (53.0%) | 77 (46.9%) |
| Enterprise Management | 0 (0.0%) | 0 (0.0%) |
| Administrative & Support | 194 (52.0%) | 179 (48.0%) |
| Educational Services | 203 (54.1%) | 172 (45.9%) |
| Health Care & Social Assistance | 220 (32.8%) | 451 (67.2%) |
| Arts, Entertainment & Recreation | 282 (66.2%) | 144 (33.8%) |
| Accommodation & Food Services | 1,026 (47.1%) | 1,153 (52.9%) |
| Public Administration | 101 (71.1%) | 41 (28.9%) |
| Total | 4,361 (53.0%) | 3,868 (47.0%) |
Education in Sevierville
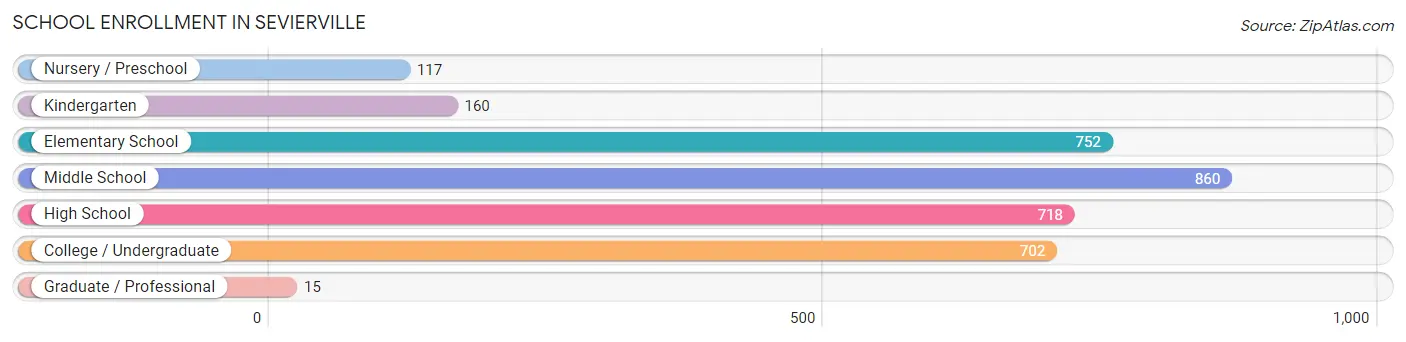
School Enrollment in Sevierville
The most common levels of schooling among the 3,324 students in Sevierville are middle school (860 | 25.9%), elementary school (752 | 22.6%), and high school (718 | 21.6%).
| School Level | # Students | % Students |
| Nursery / Preschool | 117 | 3.5% |
| Kindergarten | 160 | 4.8% |
| Elementary School | 752 | 22.6% |
| Middle School | 860 | 25.9% |
| High School | 718 | 21.6% |
| College / Undergraduate | 702 | 21.1% |
| Graduate / Professional | 15 | 0.4% |
| Total | 3,324 | 100.0% |
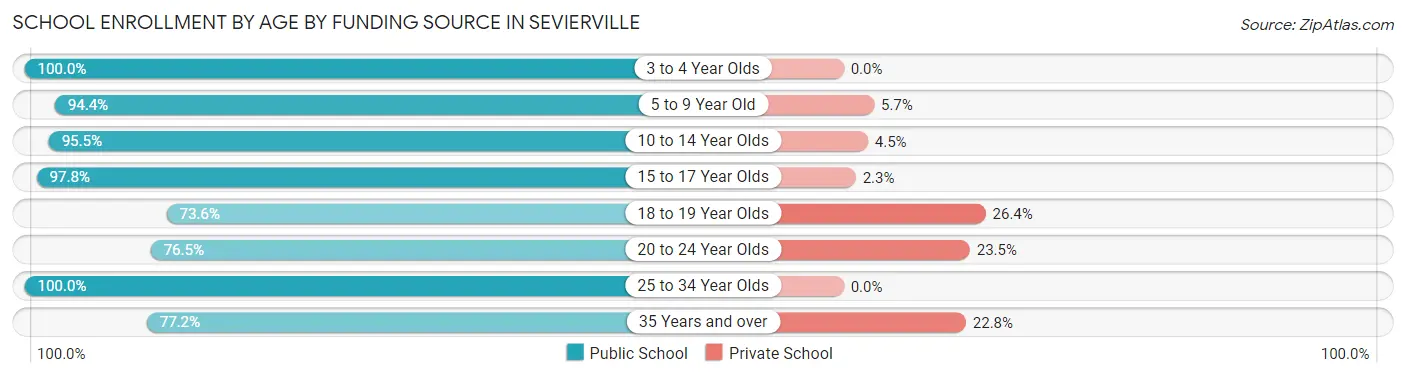
School Enrollment by Age by Funding Source in Sevierville
Out of a total of 3,324 students who are enrolled in schools in Sevierville, 269 (8.1%) attend a private institution, while the remaining 3,055 (91.9%) are enrolled in public schools. The age group of 18 to 19 year olds has the highest likelihood of being enrolled in private schools, with 92 (26.4% in the age bracket) enrolled. Conversely, the age group of 3 to 4 year olds has the lowest likelihood of being enrolled in a private school, with 163 (100.0% in the age bracket) attending a public institution.
| Age Bracket | Public School | Private School |
| 3 to 4 Year Olds | 163 (100.0%) | 0 (0.0%) |
| 5 to 9 Year Old | 702 (94.4%) | 42 (5.7%) |
| 10 to 14 Year Olds | 1,018 (95.5%) | 48 (4.5%) |
| 15 to 17 Year Olds | 521 (97.8%) | 12 (2.2%) |
| 18 to 19 Year Olds | 256 (73.6%) | 92 (26.4%) |
| 20 to 24 Year Olds | 140 (76.5%) | 43 (23.5%) |
| 25 to 34 Year Olds | 142 (100.0%) | 0 (0.0%) |
| 35 Years and over | 112 (77.2%) | 33 (22.8%) |
| Total | 3,055 (91.9%) | 269 (8.1%) |
Educational Attainment by Field of Study in Sevierville
Business (844 | 29.1%), education (512 | 17.6%), bio, nature & agricultural (274 | 9.4%), science & technology (270 | 9.3%), and arts & humanities (226 | 7.8%) are the most common fields of study among 2,904 individuals in Sevierville who have obtained a bachelor's degree or higher.
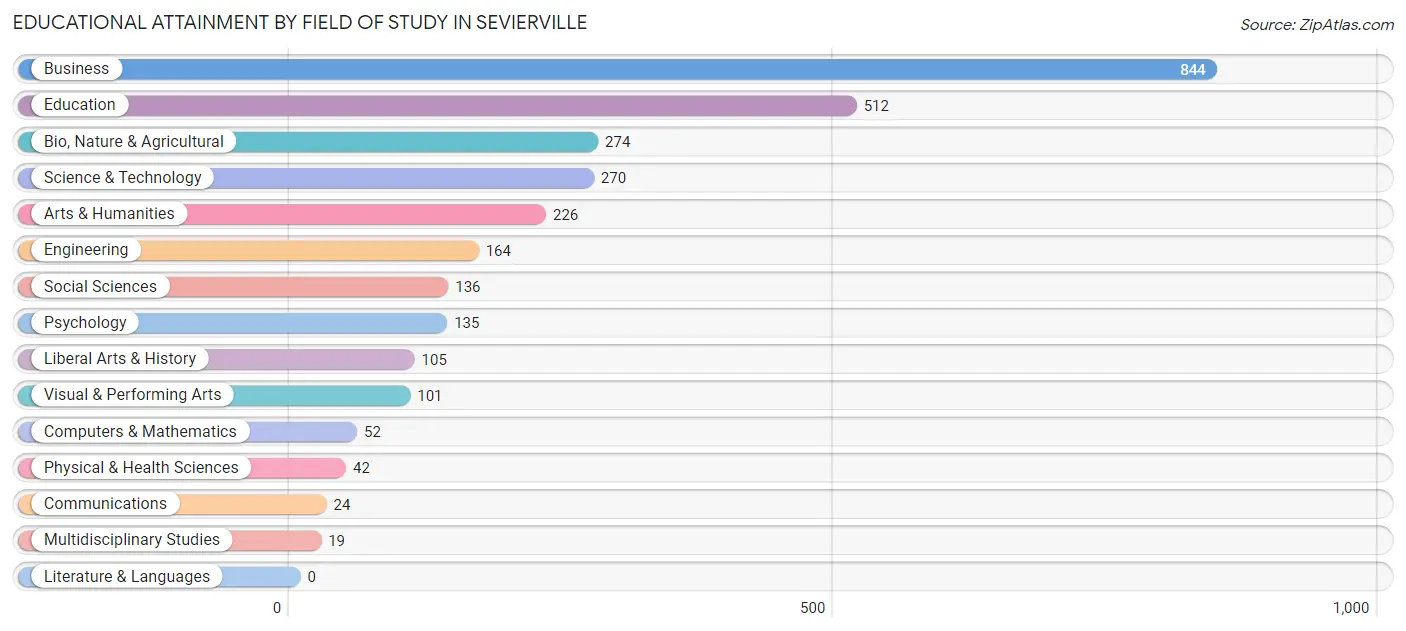
| Field of Study | # Graduates | % Graduates |
| Computers & Mathematics | 52 | 1.8% |
| Bio, Nature & Agricultural | 274 | 9.4% |
| Physical & Health Sciences | 42 | 1.5% |
| Psychology | 135 | 4.6% |
| Social Sciences | 136 | 4.7% |
| Engineering | 164 | 5.7% |
| Multidisciplinary Studies | 19 | 0.6% |
| Science & Technology | 270 | 9.3% |
| Business | 844 | 29.1% |
| Education | 512 | 17.6% |
| Literature & Languages | 0 | 0.0% |
| Liberal Arts & History | 105 | 3.6% |
| Visual & Performing Arts | 101 | 3.5% |
| Communications | 24 | 0.8% |
| Arts & Humanities | 226 | 7.8% |
| Total | 2,904 | 100.0% |
Transportation & Commute in Sevierville
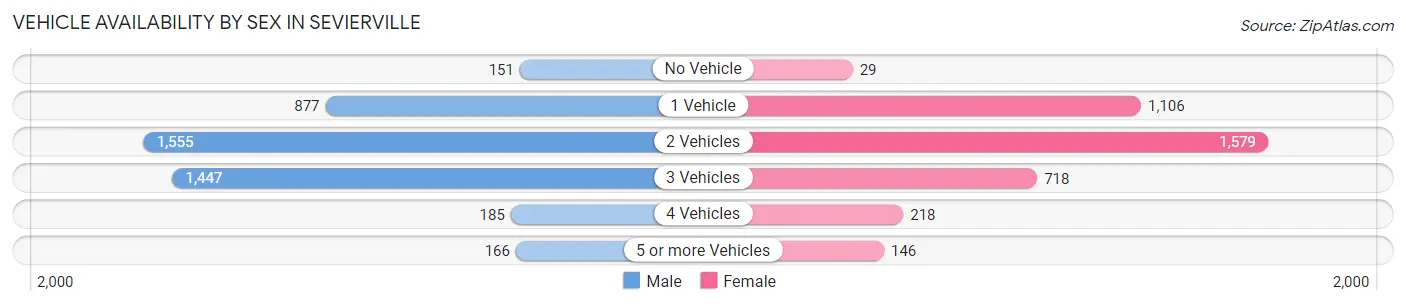
Vehicle Availability by Sex in Sevierville
The most prevalent vehicle ownership categories in Sevierville are males with 2 vehicles (1,555, accounting for 35.5%) and females with 2 vehicles (1,579, making up 41.0%).
| Vehicles Available | Male | Female |
| No Vehicle | 151 (3.5%) | 29 (0.8%) |
| 1 Vehicle | 877 (20.0%) | 1,106 (29.1%) |
| 2 Vehicles | 1,555 (35.5%) | 1,579 (41.6%) |
| 3 Vehicles | 1,447 (33.0%) | 718 (18.9%) |
| 4 Vehicles | 185 (4.2%) | 218 (5.7%) |
| 5 or more Vehicles | 166 (3.8%) | 146 (3.8%) |
| Total | 4,381 (100.0%) | 3,796 (100.0%) |
Commute Time in Sevierville
The most frequently occuring commute durations in Sevierville are 15 to 19 minutes (1,670 commuters, 21.1%), 10 to 14 minutes (1,440 commuters, 18.2%), and 20 to 24 minutes (1,172 commuters, 14.8%).
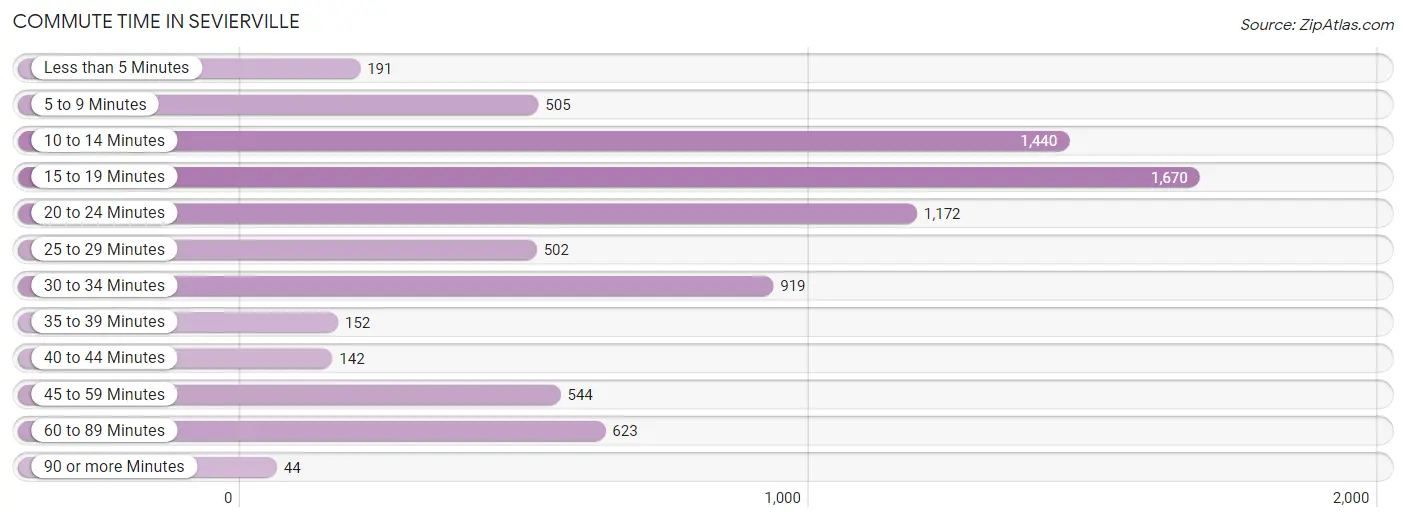
| Commute Time | # Commuters | % Commuters |
| Less than 5 Minutes | 191 | 2.4% |
| 5 to 9 Minutes | 505 | 6.4% |
| 10 to 14 Minutes | 1,440 | 18.2% |
| 15 to 19 Minutes | 1,670 | 21.1% |
| 20 to 24 Minutes | 1,172 | 14.8% |
| 25 to 29 Minutes | 502 | 6.4% |
| 30 to 34 Minutes | 919 | 11.6% |
| 35 to 39 Minutes | 152 | 1.9% |
| 40 to 44 Minutes | 142 | 1.8% |
| 45 to 59 Minutes | 544 | 6.9% |
| 60 to 89 Minutes | 623 | 7.9% |
| 90 or more Minutes | 44 | 0.6% |
Commute Time by Sex in Sevierville
The most common commute times in Sevierville are 15 to 19 minutes (823 commuters, 19.1%) for males and 15 to 19 minutes (847 commuters, 23.5%) for females.
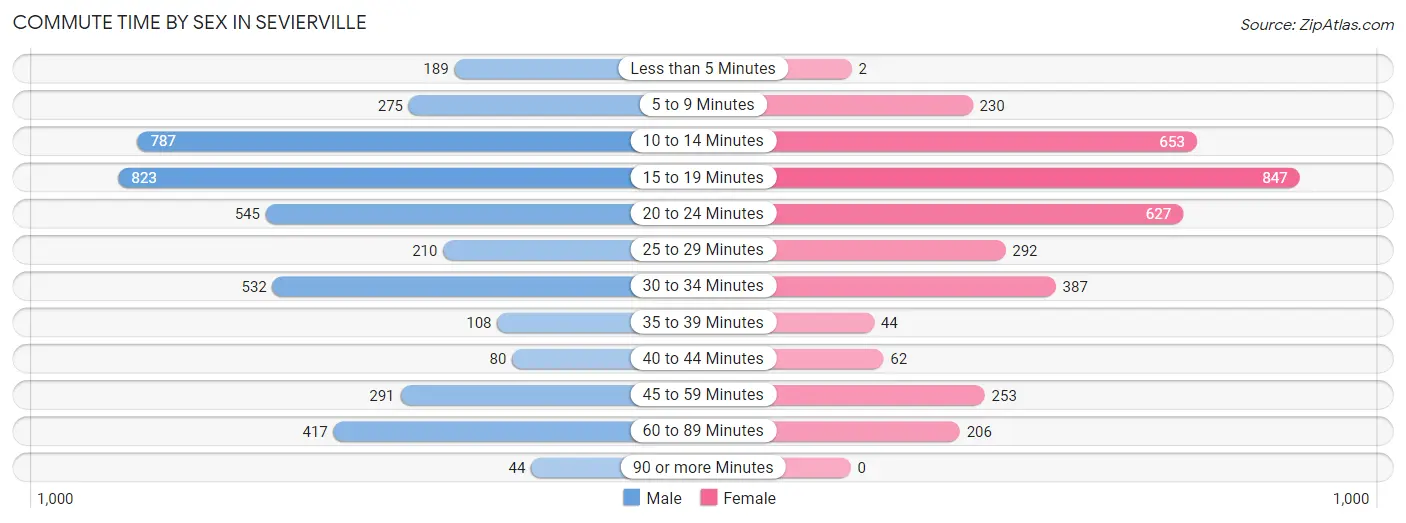
| Commute Time | Male | Female |
| Less than 5 Minutes | 189 (4.4%) | 2 (0.1%) |
| 5 to 9 Minutes | 275 (6.4%) | 230 (6.4%) |
| 10 to 14 Minutes | 787 (18.3%) | 653 (18.1%) |
| 15 to 19 Minutes | 823 (19.1%) | 847 (23.5%) |
| 20 to 24 Minutes | 545 (12.7%) | 627 (17.4%) |
| 25 to 29 Minutes | 210 (4.9%) | 292 (8.1%) |
| 30 to 34 Minutes | 532 (12.4%) | 387 (10.7%) |
| 35 to 39 Minutes | 108 (2.5%) | 44 (1.2%) |
| 40 to 44 Minutes | 80 (1.9%) | 62 (1.7%) |
| 45 to 59 Minutes | 291 (6.8%) | 253 (7.0%) |
| 60 to 89 Minutes | 417 (9.7%) | 206 (5.7%) |
| 90 or more Minutes | 44 (1.0%) | 0 (0.0%) |
Time of Departure to Work by Sex in Sevierville
The most frequent times of departure to work in Sevierville are 7:30 AM to 7:59 AM (783, 18.2%) for males and 7:00 AM to 7:29 AM (542, 15.0%) for females.
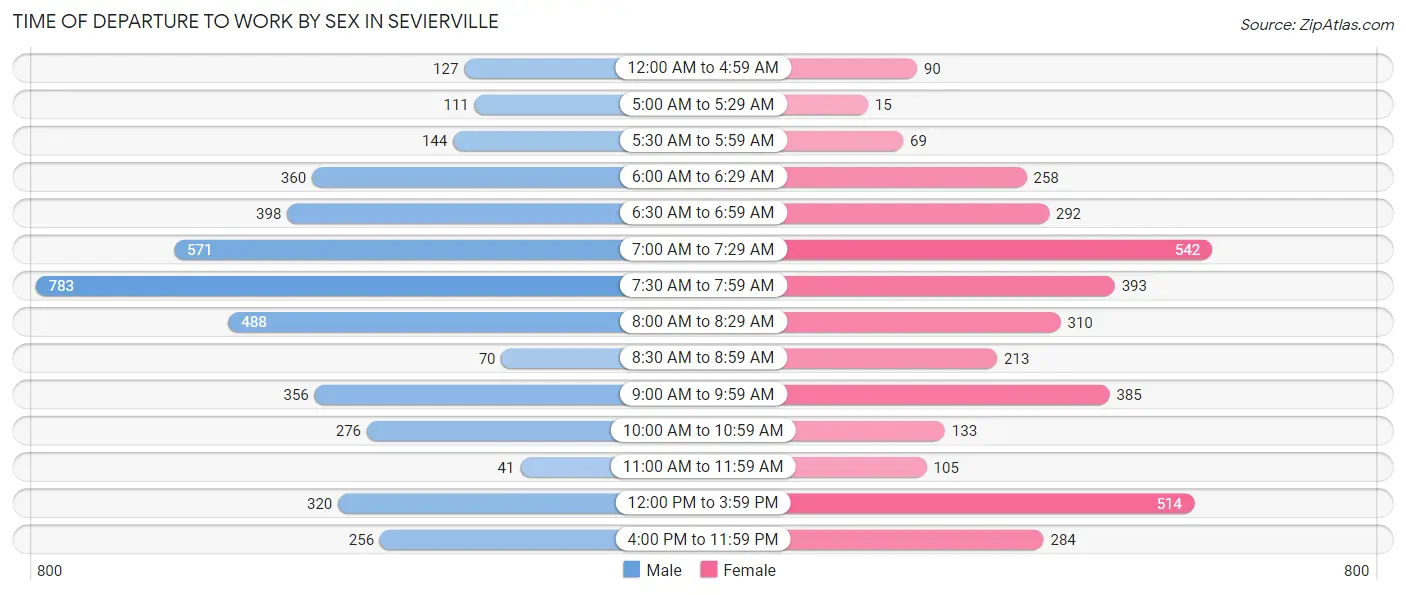
| Time of Departure | Male | Female |
| 12:00 AM to 4:59 AM | 127 (2.9%) | 90 (2.5%) |
| 5:00 AM to 5:29 AM | 111 (2.6%) | 15 (0.4%) |
| 5:30 AM to 5:59 AM | 144 (3.4%) | 69 (1.9%) |
| 6:00 AM to 6:29 AM | 360 (8.4%) | 258 (7.2%) |
| 6:30 AM to 6:59 AM | 398 (9.2%) | 292 (8.1%) |
| 7:00 AM to 7:29 AM | 571 (13.3%) | 542 (15.0%) |
| 7:30 AM to 7:59 AM | 783 (18.2%) | 393 (10.9%) |
| 8:00 AM to 8:29 AM | 488 (11.4%) | 310 (8.6%) |
| 8:30 AM to 8:59 AM | 70 (1.6%) | 213 (5.9%) |
| 9:00 AM to 9:59 AM | 356 (8.3%) | 385 (10.7%) |
| 10:00 AM to 10:59 AM | 276 (6.4%) | 133 (3.7%) |
| 11:00 AM to 11:59 AM | 41 (0.9%) | 105 (2.9%) |
| 12:00 PM to 3:59 PM | 320 (7.4%) | 514 (14.3%) |
| 4:00 PM to 11:59 PM | 256 (5.9%) | 284 (7.9%) |
| Total | 4,301 (100.0%) | 3,603 (100.0%) |
Housing Occupancy in Sevierville
Occupancy by Ownership in Sevierville
Of the total 7,159 dwellings in Sevierville, owner-occupied units account for 3,819 (53.3%), while renter-occupied units make up 3,340 (46.7%).
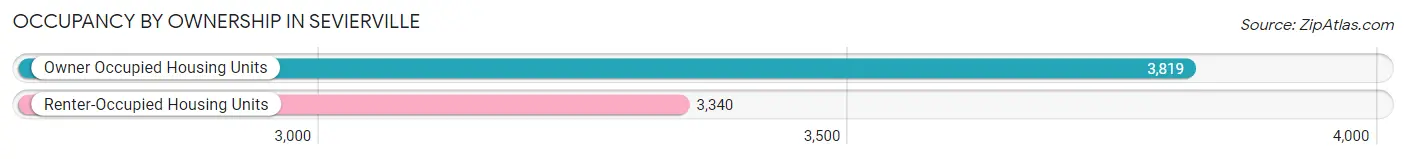
| Occupancy | # Housing Units | % Housing Units |
| Owner Occupied Housing Units | 3,819 | 53.3% |
| Renter-Occupied Housing Units | 3,340 | 46.7% |
| Total Occupied Housing Units | 7,159 | 100.0% |
Occupancy by Household Size in Sevierville
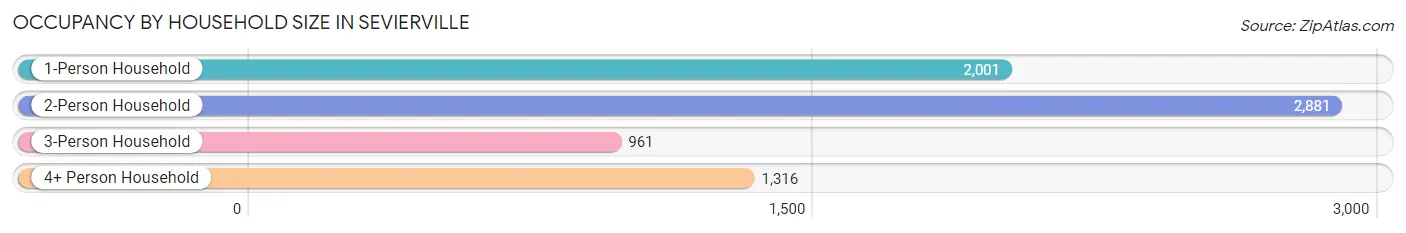
| Household Size | # Housing Units | % Housing Units |
| 1-Person Household | 2,001 | 28.0% |
| 2-Person Household | 2,881 | 40.2% |
| 3-Person Household | 961 | 13.4% |
| 4+ Person Household | 1,316 | 18.4% |
| Total Housing Units | 7,159 | 100.0% |
Occupancy by Ownership by Household Size in Sevierville
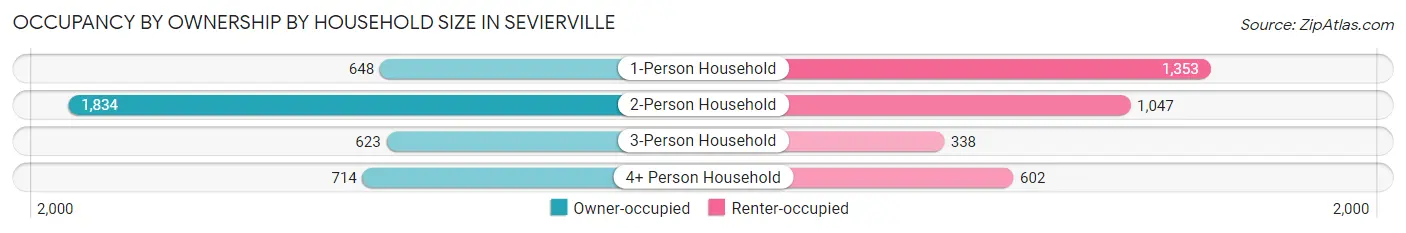
| Household Size | Owner-occupied | Renter-occupied |
| 1-Person Household | 648 (32.4%) | 1,353 (67.6%) |
| 2-Person Household | 1,834 (63.7%) | 1,047 (36.3%) |
| 3-Person Household | 623 (64.8%) | 338 (35.2%) |
| 4+ Person Household | 714 (54.3%) | 602 (45.7%) |
| Total Housing Units | 3,819 (53.3%) | 3,340 (46.7%) |
Occupancy by Educational Attainment in Sevierville
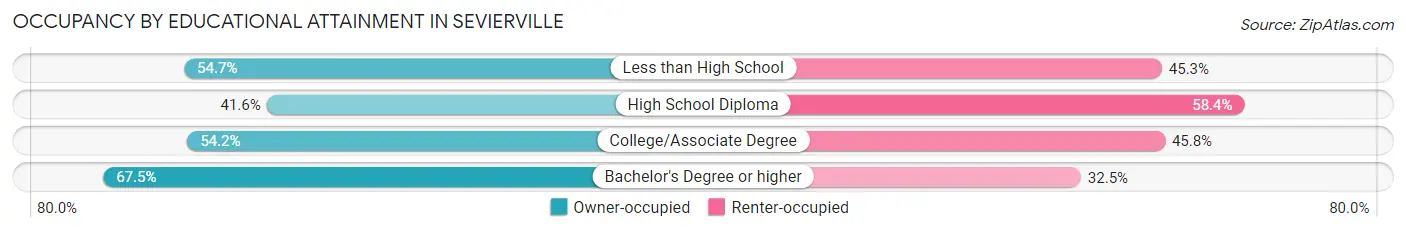
| Household Size | Owner-occupied | Renter-occupied |
| Less than High School | 356 (54.7%) | 295 (45.3%) |
| High School Diploma | 1,010 (41.6%) | 1,417 (58.4%) |
| College/Associate Degree | 1,232 (54.2%) | 1,041 (45.8%) |
| Bachelor's Degree or higher | 1,221 (67.5%) | 587 (32.5%) |
Occupancy by Age of Householder in Sevierville
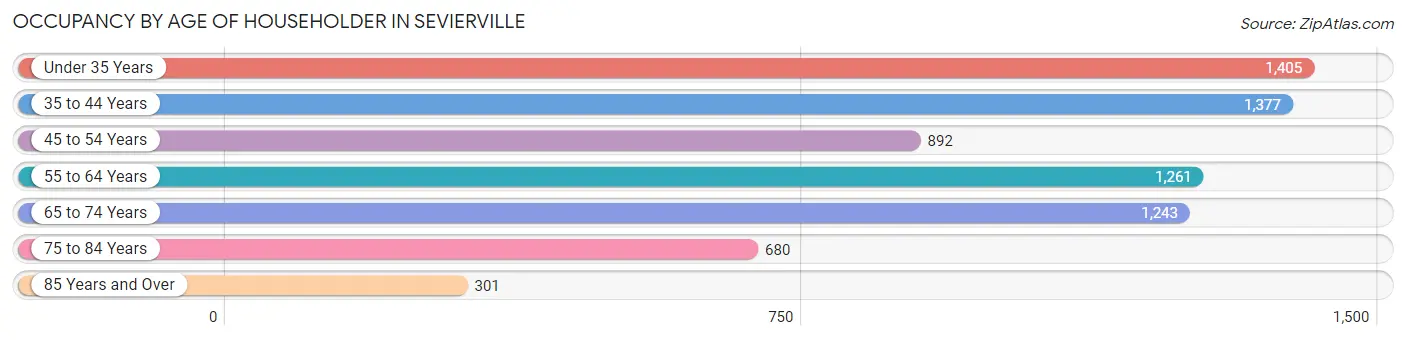
| Age Bracket | # Households | % Households |
| Under 35 Years | 1,405 | 19.6% |
| 35 to 44 Years | 1,377 | 19.2% |
| 45 to 54 Years | 892 | 12.5% |
| 55 to 64 Years | 1,261 | 17.6% |
| 65 to 74 Years | 1,243 | 17.4% |
| 75 to 84 Years | 680 | 9.5% |
| 85 Years and Over | 301 | 4.2% |
| Total | 7,159 | 100.0% |
Housing Finances in Sevierville
Median Income by Occupancy in Sevierville
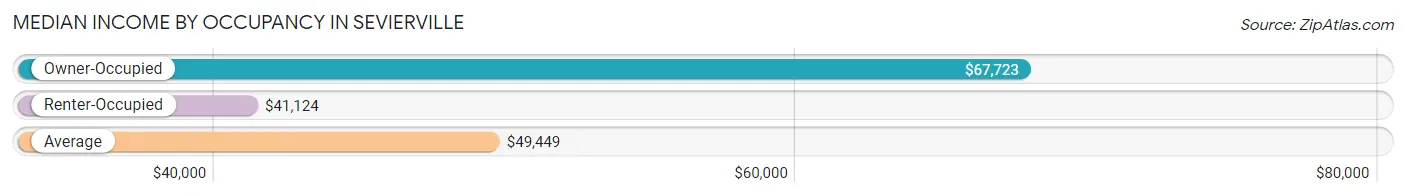
| Occupancy Type | # Households | Median Income |
| Owner-Occupied | 3,819 (53.3%) | $67,723 |
| Renter-Occupied | 3,340 (46.7%) | $41,124 |
| Average | 7,159 (100.0%) | $49,449 |
Occupancy by Householder Income Bracket in Sevierville
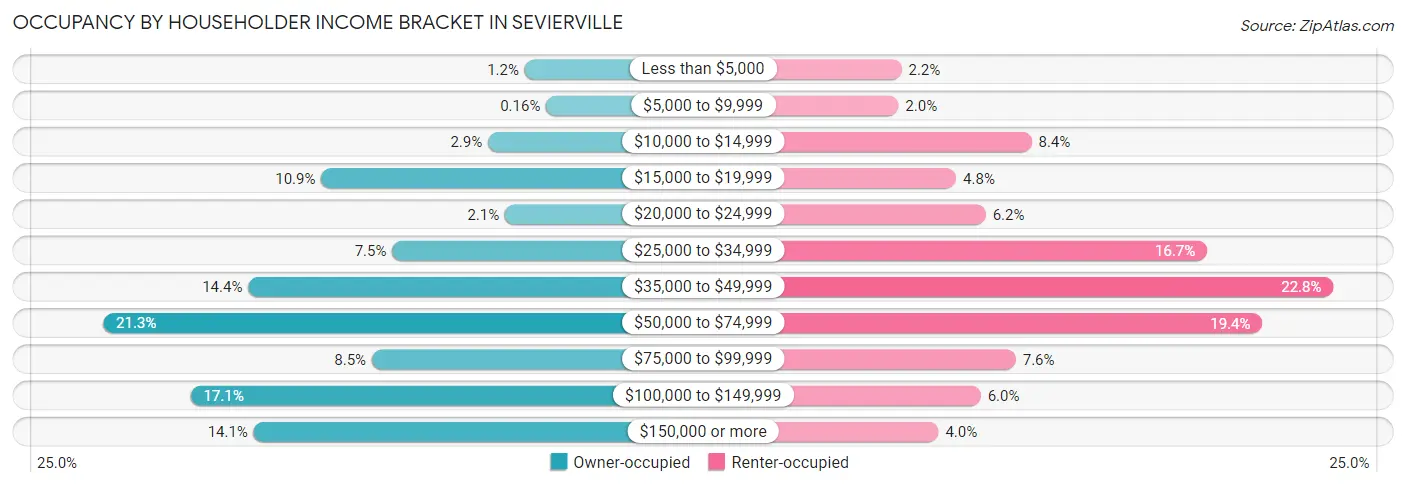
| Income Bracket | Owner-occupied | Renter-occupied |
| Less than $5,000 | 45 (1.2%) | 73 (2.2%) |
| $5,000 to $9,999 | 6 (0.2%) | 68 (2.0%) |
| $10,000 to $14,999 | 112 (2.9%) | 280 (8.4%) |
| $15,000 to $19,999 | 415 (10.9%) | 160 (4.8%) |
| $20,000 to $24,999 | 81 (2.1%) | 207 (6.2%) |
| $25,000 to $34,999 | 286 (7.5%) | 559 (16.7%) |
| $35,000 to $49,999 | 548 (14.3%) | 760 (22.8%) |
| $50,000 to $74,999 | 812 (21.3%) | 647 (19.4%) |
| $75,000 to $99,999 | 323 (8.5%) | 255 (7.6%) |
| $100,000 to $149,999 | 653 (17.1%) | 199 (6.0%) |
| $150,000 or more | 538 (14.1%) | 132 (4.0%) |
| Total | 3,819 (100.0%) | 3,340 (100.0%) |
Monthly Housing Cost Tiers in Sevierville
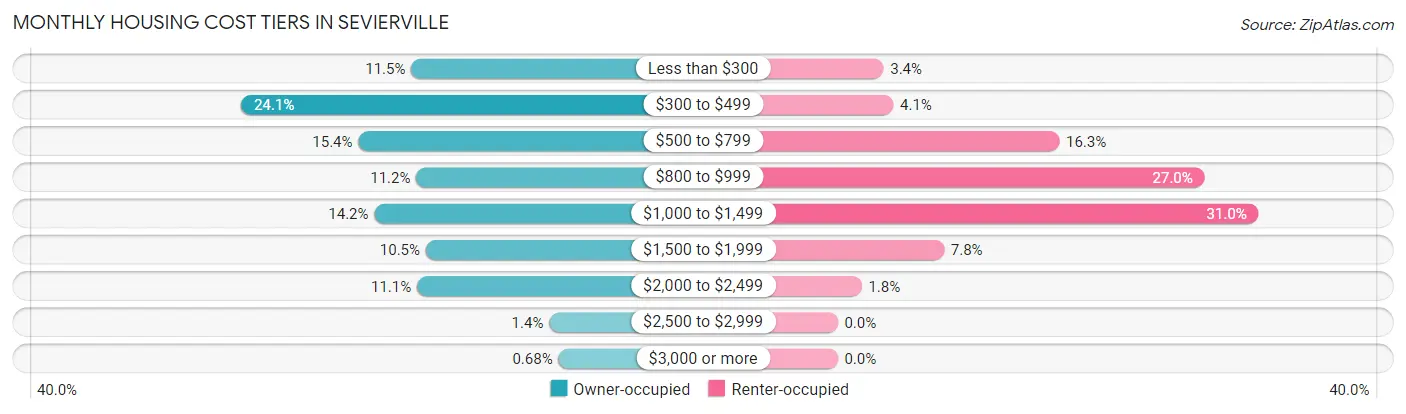
| Monthly Cost | Owner-occupied | Renter-occupied |
| Less than $300 | 440 (11.5%) | 113 (3.4%) |
| $300 to $499 | 919 (24.1%) | 137 (4.1%) |
| $500 to $799 | 589 (15.4%) | 545 (16.3%) |
| $800 to $999 | 426 (11.2%) | 903 (27.0%) |
| $1,000 to $1,499 | 544 (14.2%) | 1,036 (31.0%) |
| $1,500 to $1,999 | 399 (10.4%) | 262 (7.8%) |
| $2,000 to $2,499 | 424 (11.1%) | 59 (1.8%) |
| $2,500 to $2,999 | 52 (1.4%) | 0 (0.0%) |
| $3,000 or more | 26 (0.7%) | 0 (0.0%) |
| Total | 3,819 (100.0%) | 3,340 (100.0%) |
Physical Housing Characteristics in Sevierville
Housing Structures in Sevierville
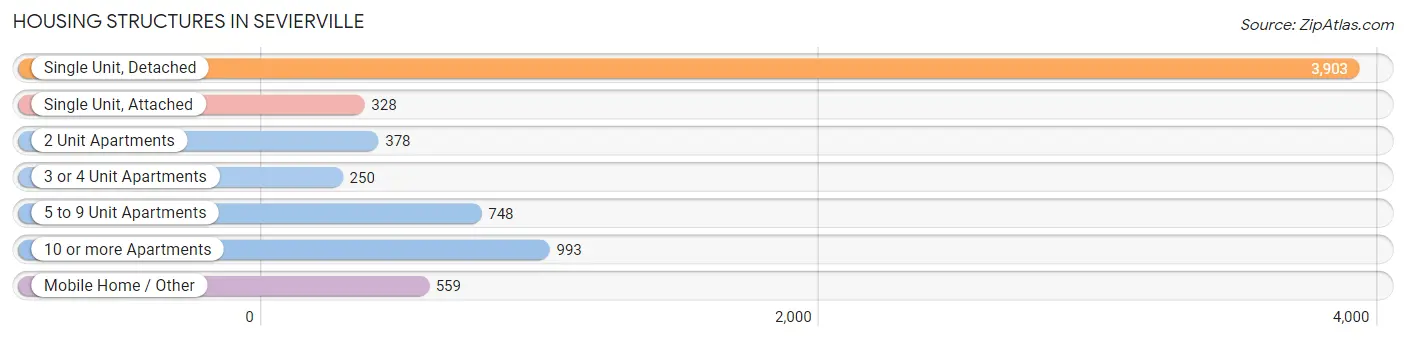
| Structure Type | # Housing Units | % Housing Units |
| Single Unit, Detached | 3,903 | 54.5% |
| Single Unit, Attached | 328 | 4.6% |
| 2 Unit Apartments | 378 | 5.3% |
| 3 or 4 Unit Apartments | 250 | 3.5% |
| 5 to 9 Unit Apartments | 748 | 10.4% |
| 10 or more Apartments | 993 | 13.9% |
| Mobile Home / Other | 559 | 7.8% |
| Total | 7,159 | 100.0% |
Housing Structures by Occupancy in Sevierville
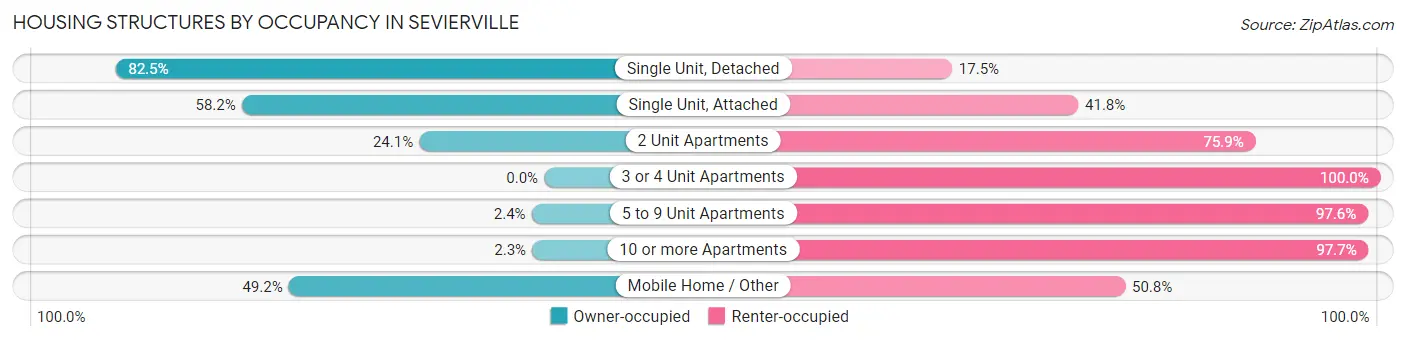
| Structure Type | Owner-occupied | Renter-occupied |
| Single Unit, Detached | 3,221 (82.5%) | 682 (17.5%) |
| Single Unit, Attached | 191 (58.2%) | 137 (41.8%) |
| 2 Unit Apartments | 91 (24.1%) | 287 (75.9%) |
| 3 or 4 Unit Apartments | 0 (0.0%) | 250 (100.0%) |
| 5 to 9 Unit Apartments | 18 (2.4%) | 730 (97.6%) |
| 10 or more Apartments | 23 (2.3%) | 970 (97.7%) |
| Mobile Home / Other | 275 (49.2%) | 284 (50.8%) |
| Total | 3,819 (53.3%) | 3,340 (46.7%) |
Housing Structures by Number of Rooms in Sevierville
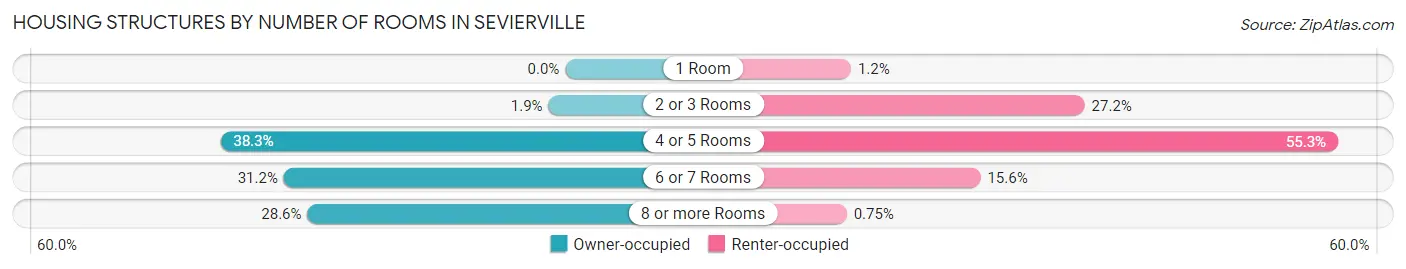
| Number of Rooms | Owner-occupied | Renter-occupied |
| 1 Room | 0 (0.0%) | 41 (1.2%) |
| 2 or 3 Rooms | 71 (1.9%) | 907 (27.2%) |
| 4 or 5 Rooms | 1,462 (38.3%) | 1,846 (55.3%) |
| 6 or 7 Rooms | 1,193 (31.2%) | 521 (15.6%) |
| 8 or more Rooms | 1,093 (28.6%) | 25 (0.7%) |
| Total | 3,819 (100.0%) | 3,340 (100.0%) |
Housing Structure by Heating Type in Sevierville
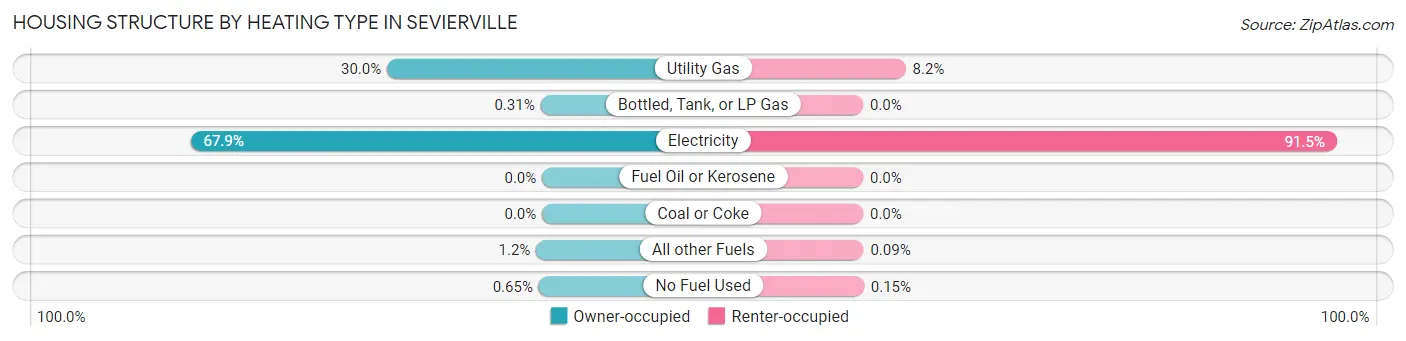
| Heating Type | Owner-occupied | Renter-occupied |
| Utility Gas | 1,144 (30.0%) | 275 (8.2%) |
| Bottled, Tank, or LP Gas | 12 (0.3%) | 0 (0.0%) |
| Electricity | 2,594 (67.9%) | 3,057 (91.5%) |
| Fuel Oil or Kerosene | 0 (0.0%) | 0 (0.0%) |
| Coal or Coke | 0 (0.0%) | 0 (0.0%) |
| All other Fuels | 44 (1.1%) | 3 (0.1%) |
| No Fuel Used | 25 (0.6%) | 5 (0.2%) |
| Total | 3,819 (100.0%) | 3,340 (100.0%) |
Household Vehicle Usage in Sevierville
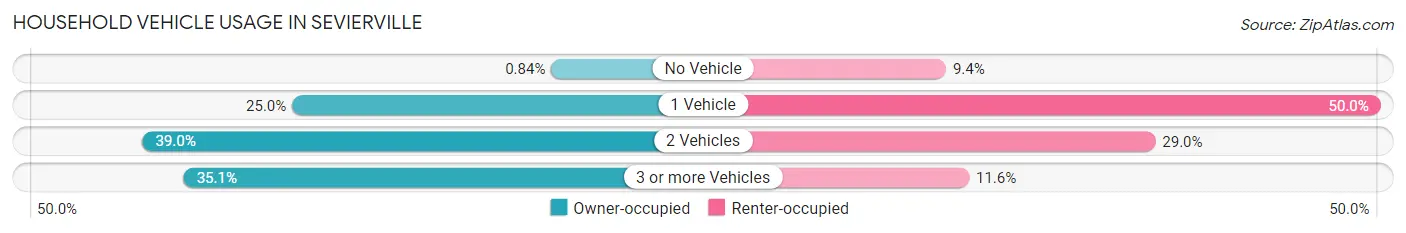
| Vehicles per Household | Owner-occupied | Renter-occupied |
| No Vehicle | 32 (0.8%) | 315 (9.4%) |
| 1 Vehicle | 956 (25.0%) | 1,670 (50.0%) |
| 2 Vehicles | 1,489 (39.0%) | 968 (29.0%) |
| 3 or more Vehicles | 1,342 (35.1%) | 387 (11.6%) |
| Total | 3,819 (100.0%) | 3,340 (100.0%) |
Real Estate & Mortgages in Sevierville
Real Estate and Mortgage Overview in Sevierville
| Characteristic | Without Mortgage | With Mortgage |
| Housing Units | 1,803 | 2,016 |
| Median Property Value | $213,400 | $277,300 |
| Median Household Income | $62,984 | $277 |
| Monthly Housing Costs | $424 | $26 |
| Real Estate Taxes | $917 | $54 |
Property Value by Mortgage Status in Sevierville
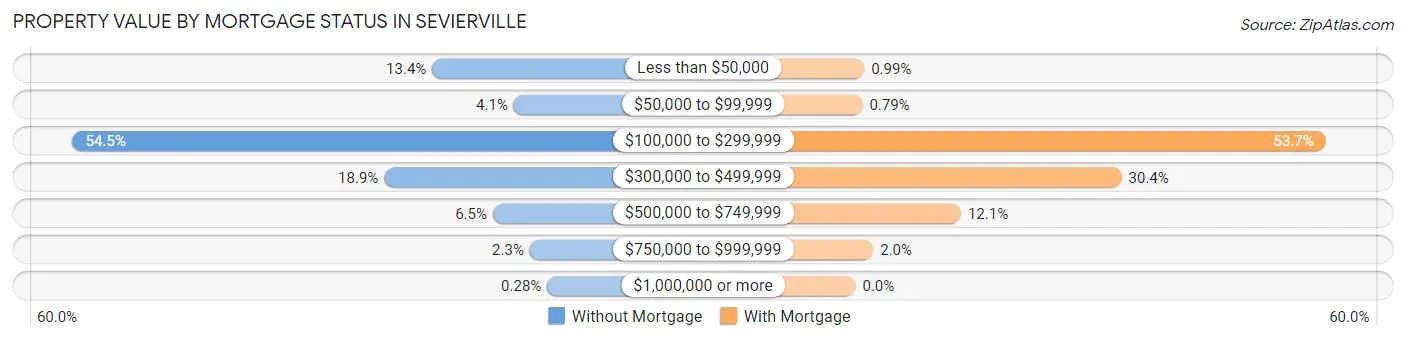
| Property Value | Without Mortgage | With Mortgage |
| Less than $50,000 | 242 (13.4%) | 20 (1.0%) |
| $50,000 to $99,999 | 74 (4.1%) | 16 (0.8%) |
| $100,000 to $299,999 | 983 (54.5%) | 1,083 (53.7%) |
| $300,000 to $499,999 | 341 (18.9%) | 613 (30.4%) |
| $500,000 to $749,999 | 117 (6.5%) | 243 (12.0%) |
| $750,000 to $999,999 | 41 (2.3%) | 41 (2.0%) |
| $1,000,000 or more | 5 (0.3%) | 0 (0.0%) |
| Total | 1,803 (100.0%) | 2,016 (100.0%) |
Household Income by Mortgage Status in Sevierville
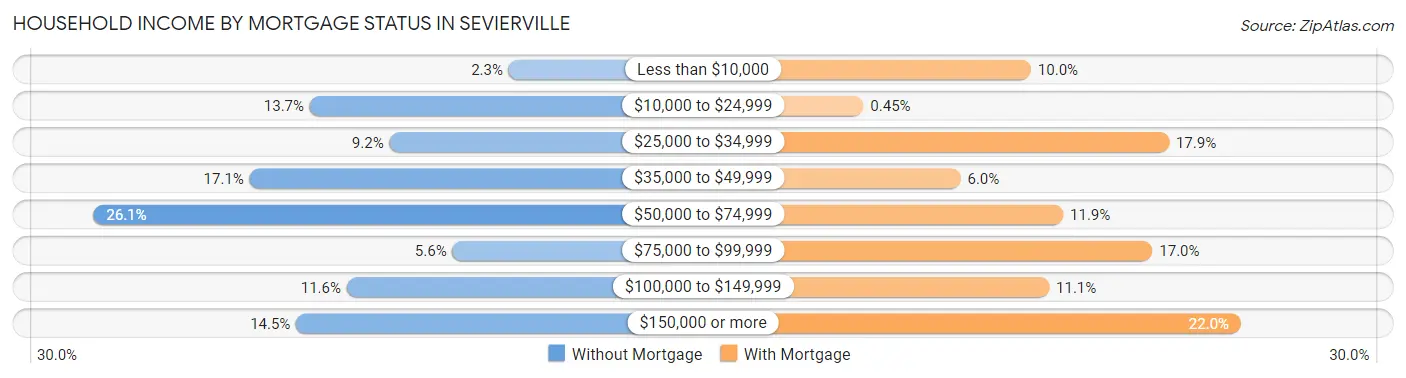
| Household Income | Without Mortgage | With Mortgage |
| Less than $10,000 | 42 (2.3%) | 202 (10.0%) |
| $10,000 to $24,999 | 247 (13.7%) | 9 (0.4%) |
| $25,000 to $34,999 | 165 (9.1%) | 361 (17.9%) |
| $35,000 to $49,999 | 309 (17.1%) | 121 (6.0%) |
| $50,000 to $74,999 | 470 (26.1%) | 239 (11.9%) |
| $75,000 to $99,999 | 100 (5.6%) | 342 (17.0%) |
| $100,000 to $149,999 | 209 (11.6%) | 223 (11.1%) |
| $150,000 or more | 261 (14.5%) | 444 (22.0%) |
| Total | 1,803 (100.0%) | 2,016 (100.0%) |
Property Value to Household Income Ratio in Sevierville
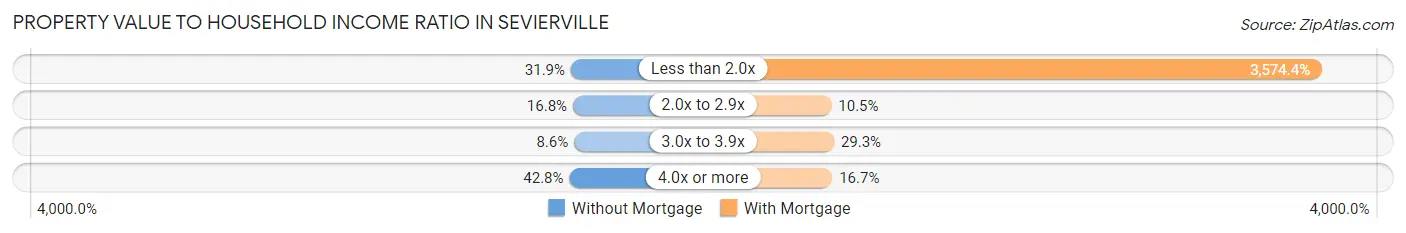
| Value-to-Income Ratio | Without Mortgage | With Mortgage |
| Less than 2.0x | 575 (31.9%) | 72,059 (3,574.4%) |
| 2.0x to 2.9x | 302 (16.8%) | 212 (10.5%) |
| 3.0x to 3.9x | 155 (8.6%) | 590 (29.3%) |
| 4.0x or more | 771 (42.8%) | 336 (16.7%) |
| Total | 1,803 (100.0%) | 2,016 (100.0%) |
Real Estate Taxes by Mortgage Status in Sevierville
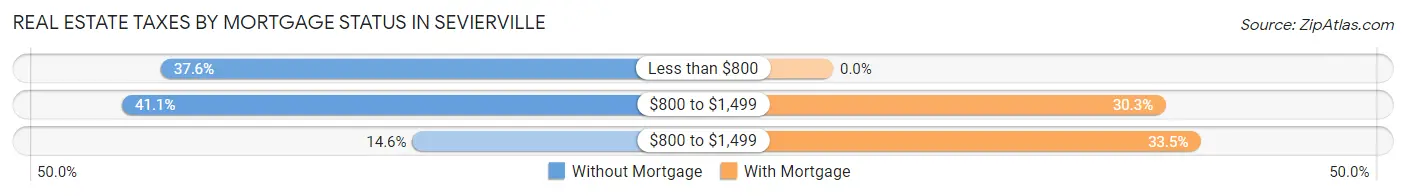
| Property Taxes | Without Mortgage | With Mortgage |
| Less than $800 | 677 (37.6%) | 0 (0.0%) |
| $800 to $1,499 | 741 (41.1%) | 611 (30.3%) |
| $800 to $1,499 | 263 (14.6%) | 676 (33.5%) |
| Total | 1,803 (100.0%) | 2,016 (100.0%) |
Health & Disability in Sevierville
Health Insurance Coverage by Age in Sevierville
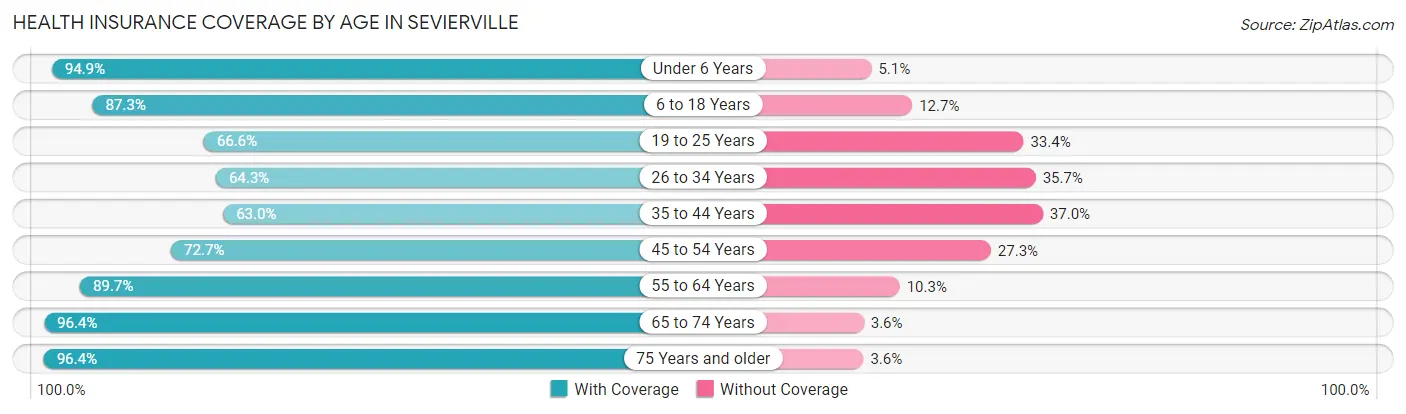
| Age Bracket | With Coverage | Without Coverage |
| Under 6 Years | 1,068 (94.9%) | 57 (5.1%) |
| 6 to 18 Years | 2,199 (87.3%) | 319 (12.7%) |
| 19 to 25 Years | 1,046 (66.6%) | 525 (33.4%) |
| 26 to 34 Years | 1,121 (64.3%) | 622 (35.7%) |
| 35 to 44 Years | 1,644 (63.0%) | 967 (37.0%) |
| 45 to 54 Years | 1,366 (72.7%) | 514 (27.3%) |
| 55 to 64 Years | 2,002 (89.7%) | 231 (10.3%) |
| 65 to 74 Years | 1,992 (96.4%) | 75 (3.6%) |
| 75 Years and older | 1,378 (96.4%) | 51 (3.6%) |
| Total | 13,816 (80.4%) | 3,361 (19.6%) |
Health Insurance Coverage by Citizenship Status in Sevierville
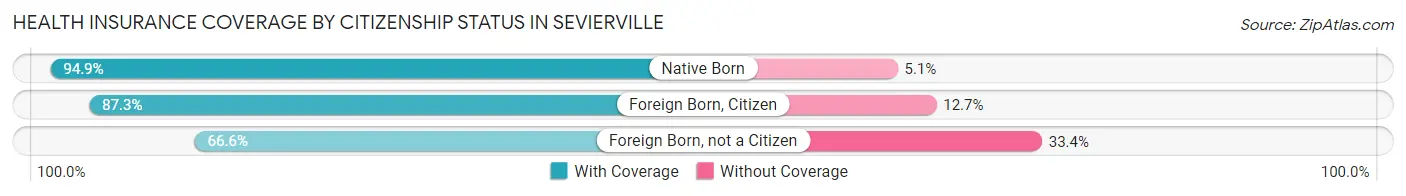
| Citizenship Status | With Coverage | Without Coverage |
| Native Born | 1,068 (94.9%) | 57 (5.1%) |
| Foreign Born, Citizen | 2,199 (87.3%) | 319 (12.7%) |
| Foreign Born, not a Citizen | 1,046 (66.6%) | 525 (33.4%) |
Health Insurance Coverage by Household Income in Sevierville
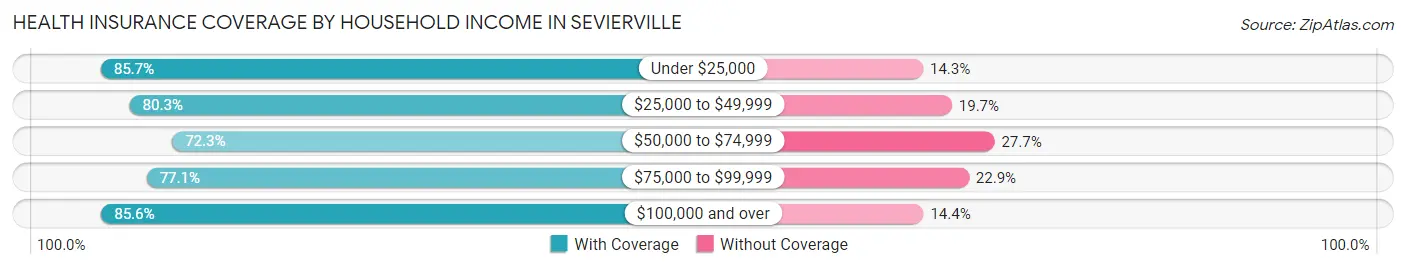
| Household Income | With Coverage | Without Coverage |
| Under $25,000 | 2,251 (85.7%) | 375 (14.3%) |
| $25,000 to $49,999 | 3,521 (80.3%) | 863 (19.7%) |
| $50,000 to $74,999 | 2,721 (72.3%) | 1,041 (27.7%) |
| $75,000 to $99,999 | 1,264 (77.1%) | 375 (22.9%) |
| $100,000 and over | 4,027 (85.6%) | 676 (14.4%) |
Public vs Private Health Insurance Coverage by Age in Sevierville
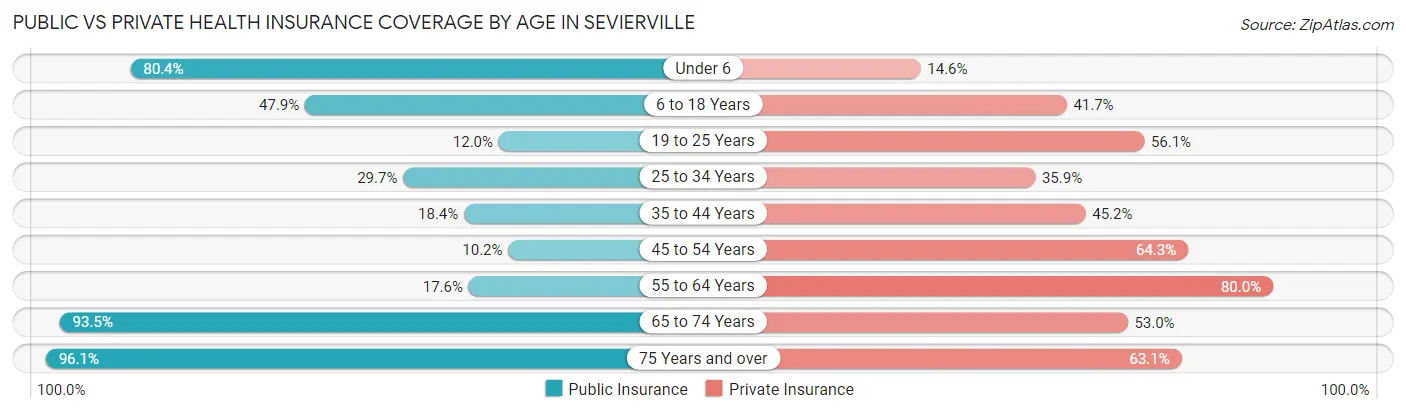
| Age Bracket | Public Insurance | Private Insurance |
| Under 6 | 904 (80.4%) | 164 (14.6%) |
| 6 to 18 Years | 1,207 (47.9%) | 1,050 (41.7%) |
| 19 to 25 Years | 188 (12.0%) | 881 (56.1%) |
| 25 to 34 Years | 518 (29.7%) | 625 (35.9%) |
| 35 to 44 Years | 481 (18.4%) | 1,180 (45.2%) |
| 45 to 54 Years | 192 (10.2%) | 1,208 (64.3%) |
| 55 to 64 Years | 392 (17.5%) | 1,787 (80.0%) |
| 65 to 74 Years | 1,933 (93.5%) | 1,096 (53.0%) |
| 75 Years and over | 1,373 (96.1%) | 901 (63.0%) |
| Total | 7,188 (41.8%) | 8,892 (51.8%) |
Disability Status by Sex by Age in Sevierville
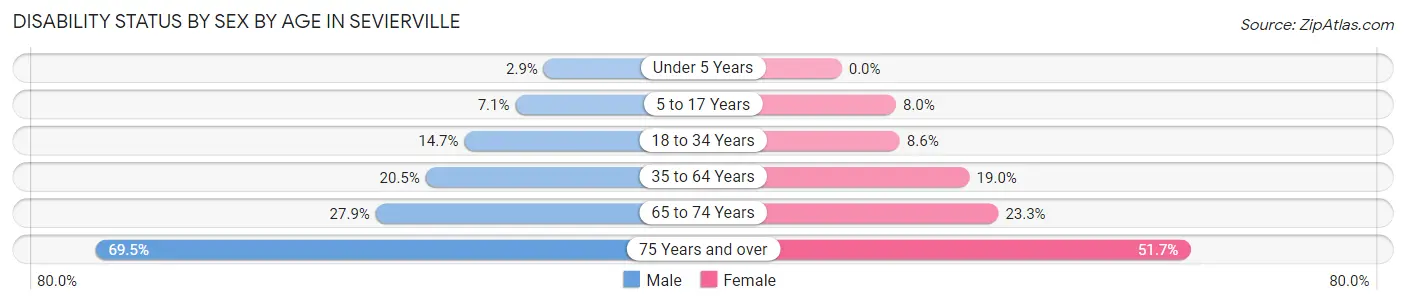
| Age Bracket | Male | Female |
| Under 5 Years | 16 (2.9%) | 0 (0.0%) |
| 5 to 17 Years | 93 (7.1%) | 84 (8.0%) |
| 18 to 34 Years | 237 (14.7%) | 167 (8.6%) |
| 35 to 64 Years | 673 (20.4%) | 652 (19.0%) |
| 65 to 74 Years | 267 (27.9%) | 258 (23.3%) |
| 75 Years and over | 446 (69.5%) | 407 (51.7%) |
Disability Class by Sex by Age in Sevierville
Disability Class: Hearing Difficulty
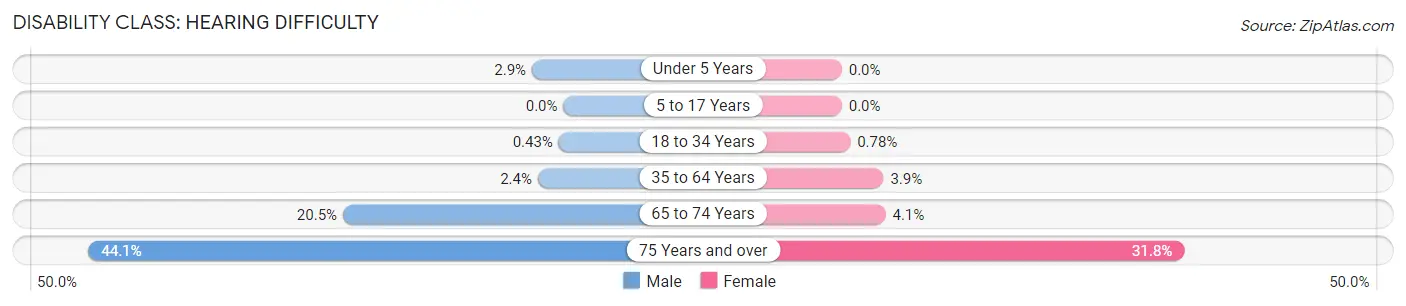
| Age Bracket | Male | Female |
| Under 5 Years | 16 (2.9%) | 0 (0.0%) |
| 5 to 17 Years | 0 (0.0%) | 0 (0.0%) |
| 18 to 34 Years | 7 (0.4%) | 15 (0.8%) |
| 35 to 64 Years | 78 (2.4%) | 133 (3.9%) |
| 65 to 74 Years | 196 (20.5%) | 45 (4.1%) |
| 75 Years and over | 283 (44.1%) | 250 (31.8%) |
Disability Class: Vision Difficulty
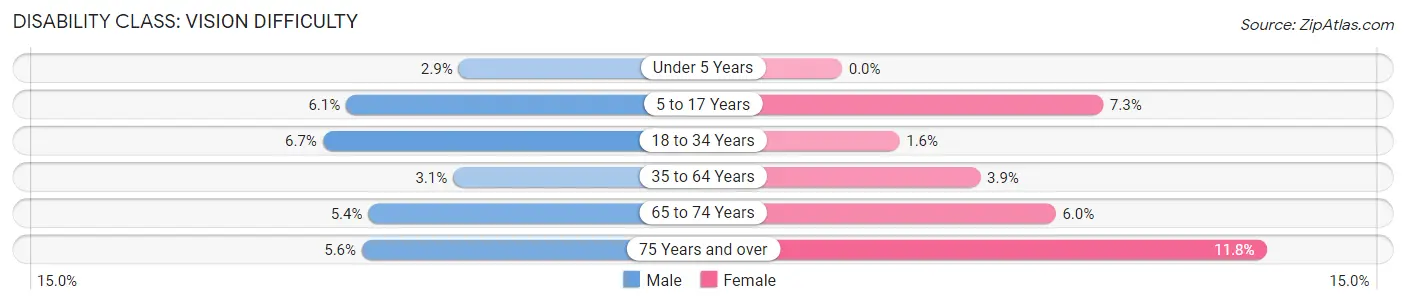
| Age Bracket | Male | Female |
| Under 5 Years | 16 (2.9%) | 0 (0.0%) |
| 5 to 17 Years | 79 (6.0%) | 76 (7.3%) |
| 18 to 34 Years | 108 (6.7%) | 31 (1.6%) |
| 35 to 64 Years | 101 (3.1%) | 132 (3.8%) |
| 65 to 74 Years | 52 (5.4%) | 66 (5.9%) |
| 75 Years and over | 36 (5.6%) | 93 (11.8%) |
Disability Class: Cognitive Difficulty
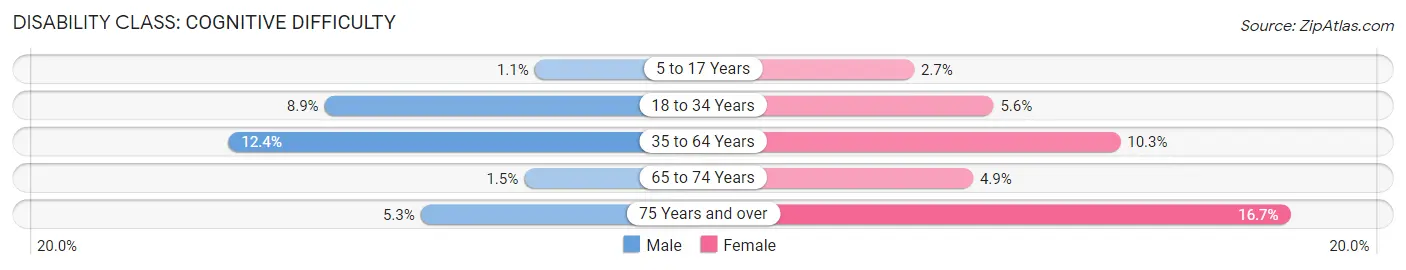
| Age Bracket | Male | Female |
| 5 to 17 Years | 14 (1.1%) | 28 (2.7%) |
| 18 to 34 Years | 143 (8.9%) | 109 (5.6%) |
| 35 to 64 Years | 409 (12.4%) | 355 (10.3%) |
| 65 to 74 Years | 14 (1.5%) | 54 (4.9%) |
| 75 Years and over | 34 (5.3%) | 131 (16.7%) |
Disability Class: Ambulatory Difficulty
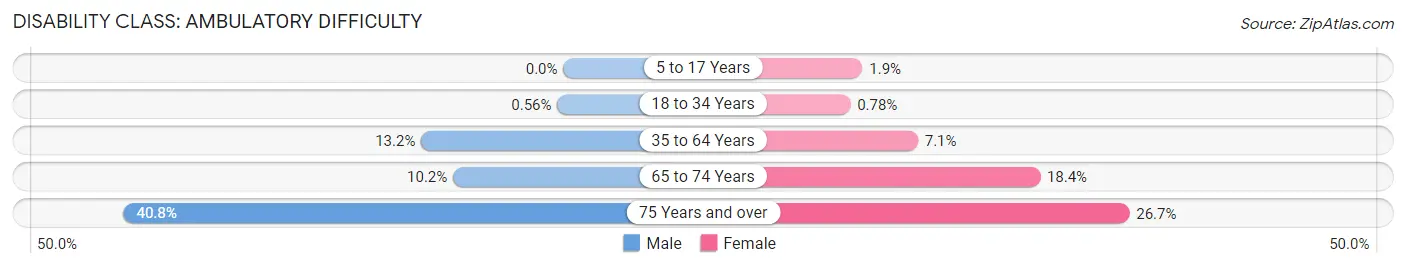
| Age Bracket | Male | Female |
| 5 to 17 Years | 0 (0.0%) | 20 (1.9%) |
| 18 to 34 Years | 9 (0.6%) | 15 (0.8%) |
| 35 to 64 Years | 434 (13.2%) | 242 (7.0%) |
| 65 to 74 Years | 98 (10.2%) | 204 (18.4%) |
| 75 Years and over | 262 (40.8%) | 210 (26.7%) |
Disability Class: Self-Care Difficulty
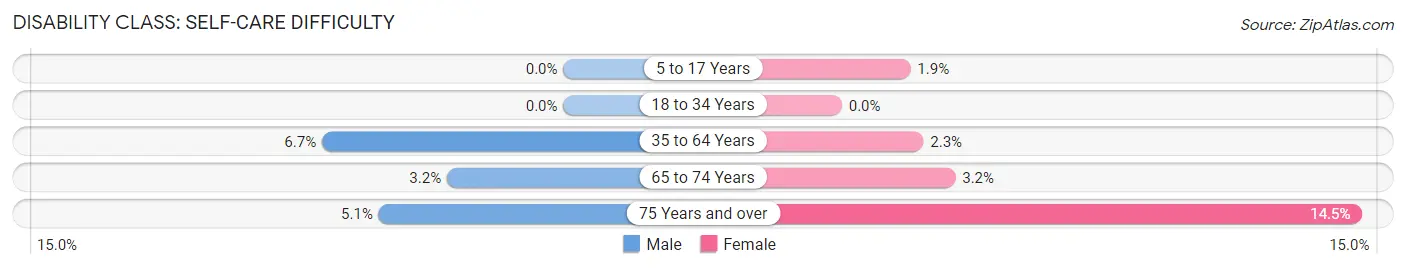
| Age Bracket | Male | Female |
| 5 to 17 Years | 0 (0.0%) | 20 (1.9%) |
| 18 to 34 Years | 0 (0.0%) | 0 (0.0%) |
| 35 to 64 Years | 221 (6.7%) | 78 (2.3%) |
| 65 to 74 Years | 31 (3.2%) | 35 (3.2%) |
| 75 Years and over | 33 (5.1%) | 114 (14.5%) |
Technology Access in Sevierville
Computing Device Access in Sevierville
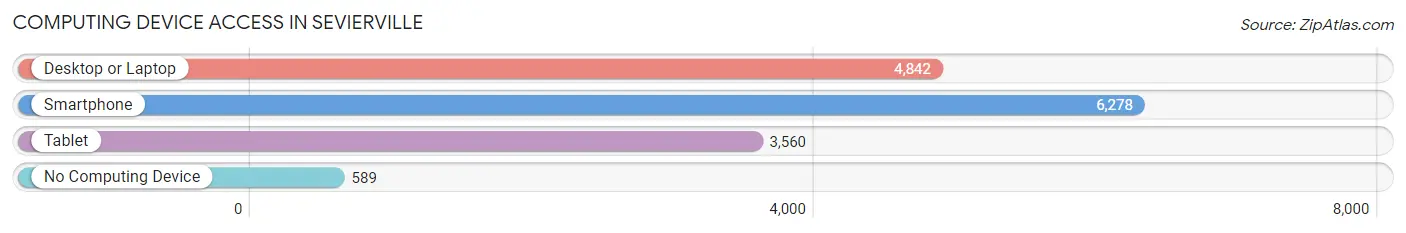
| Device Type | # Households | % Households |
| Desktop or Laptop | 4,842 | 67.6% |
| Smartphone | 6,278 | 87.7% |
| Tablet | 3,560 | 49.7% |
| No Computing Device | 589 | 8.2% |
| Total | 7,159 | 100.0% |
Internet Access in Sevierville
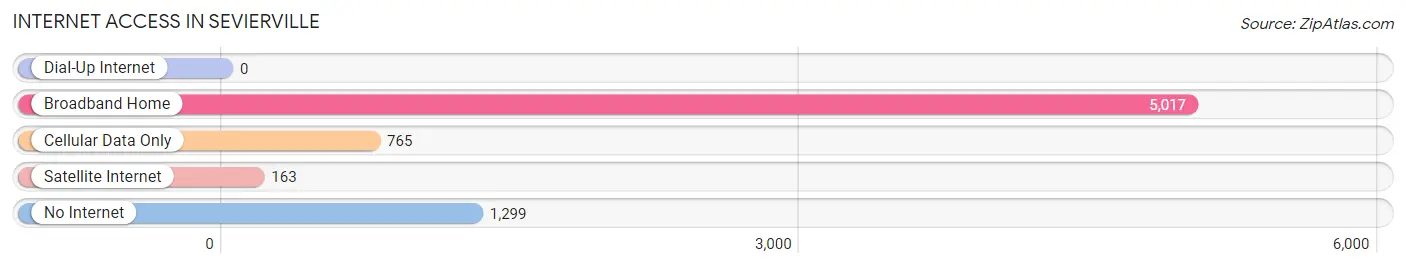
| Internet Type | # Households | % Households |
| Dial-Up Internet | 0 | 0.0% |
| Broadband Home | 5,017 | 70.1% |
| Cellular Data Only | 765 | 10.7% |
| Satellite Internet | 163 | 2.3% |
| No Internet | 1,299 | 18.1% |
| Total | 7,159 | 100.0% |
Sevierville Summary
Sevierville, Tennessee is a small city located in the foothills of the Great Smoky Mountains in eastern Tennessee. It is the county seat of Sevier County and is part of the Knoxville Metropolitan Statistical Area. The city has a population of approximately 16,000 people and is known for its outdoor recreation, historic sites, and vibrant downtown.
History
Sevierville was founded in 1795 by John Sevier, a Revolutionary War hero and the first governor of Tennessee. The city was named after him and was originally part of North Carolina. In 1796, Sevier County was created and Sevierville became the county seat. The city was incorporated in 1827 and has since grown to become the largest city in the county.
The city has a rich history and was an important stop on the Great Stage Road, which connected Knoxville to Asheville, North Carolina. During the Civil War, the city was occupied by Union forces and was the site of several skirmishes. After the war, the city experienced a period of growth and prosperity, with the establishment of several businesses and industries.
Geography
Sevierville is located in eastern Tennessee in the foothills of the Great Smoky Mountains. The city is situated along the French Broad River and is surrounded by the Great Smoky Mountains National Park. The city has a total area of 16.2 square miles, with 15.7 square miles of land and 0.5 square miles of water.
The city has a humid subtropical climate, with hot, humid summers and mild winters. The average annual temperature is 57.2 degrees Fahrenheit, with an average high of 79.2 degrees Fahrenheit in July and an average low of 35.2 degrees Fahrenheit in January.
Economy
Sevierville’s economy is largely based on tourism, with the city being a popular destination for outdoor recreation and historic sites. The city is home to several attractions, including Dollywood, the Titanic Museum, and the Great Smoky Mountains National Park. The city is also home to several manufacturing companies, including Denso Manufacturing Tennessee, Inc., and the Sevierville Industrial Park.
Demographics
As of the 2010 census, the population of Sevierville was 14,807, with a population density of 910.7 people per square mile. The median age of the population was 41.2 years, with a gender ratio of 49.7% male and 50.3% female. The median household income was $37,845, with a poverty rate of 17.3%.
The racial makeup of the city was 92.2% White, 4.2% African American, 0.4% Native American, 0.7% Asian, 0.1% Pacific Islander, 1.2% from other races, and 1.2% from two or more races. The largest ancestry groups in the city were English (25.2%), Irish (17.2%), German (14.2%), and Scots-Irish (10.2%).
Conclusion
Sevierville, Tennessee is a small city located in the foothills of the Great Smoky Mountains in eastern Tennessee. It is the county seat of Sevier County and is part of the Knoxville Metropolitan Statistical Area. The city has a population of approximately 16,000 people and is known for its outdoor recreation, historic sites, and vibrant downtown. The city’s economy is largely based on tourism, with the city being a popular destination for outdoor recreation and historic sites. The city has a humid subtropical climate, with hot, humid summers and mild winters. The racial makeup of the city was 92.2% White, 4.2% African American, 0.4% Native American, 0.7% Asian, 0.1% Pacific Islander, 1.2% from other races, and 1.2% from two or more races.
Common Questions
What is Per Capita Income in Sevierville?
Per Capita income in Sevierville is $28,186.
What is the Median Family Income in Sevierville?
Median Family Income in Sevierville is $62,582.
What is the Median Household income in Sevierville?
Median Household Income in Sevierville is $49,449.
What is Income or Wage Gap in Sevierville?
Income or Wage Gap in Sevierville is 23.1%.
Women in Sevierville earn 76.9 cents for every dollar earned by a man.
What is Family Income Deficit in Sevierville?
Family Income Deficit in Sevierville is $6,010.
Families that are below poverty line in Sevierville earn $6,010 less on average than the poverty threshold level.
What is Inequality or Gini Index in Sevierville?
Inequality or Gini Index in Sevierville is 0.45.
What is the Total Population of Sevierville?
Total Population of Sevierville is 17,986.
What is the Total Male Population of Sevierville?
Total Male Population of Sevierville is 8,911.
What is the Total Female Population of Sevierville?
Total Female Population of Sevierville is 9,075.
What is the Ratio of Males per 100 Females in Sevierville?
There are 98.19 Males per 100 Females in Sevierville.
What is the Ratio of Females per 100 Males in Sevierville?
There are 101.84 Females per 100 Males in Sevierville.
What is the Median Population Age in Sevierville?
Median Population Age in Sevierville is 40.6 Years.
What is the Average Family Size in Sevierville
Average Family Size in Sevierville is 3.0 People.
What is the Average Household Size in Sevierville
Average Household Size in Sevierville is 2.4 People.
How Large is the Labor Force in Sevierville?
There are 8,605 People in the Labor Forcein in Sevierville.
What is the Percentage of People in the Labor Force in Sevierville?
57.8% of People are in the Labor Force in Sevierville.
What is the Unemployment Rate in Sevierville?
Unemployment Rate in Sevierville is 2.3%.