Christiana, TN Map & Demographics
Christiana Map
Christiana Overview
$34,887
PER CAPITA INCOME
$107,596
AVG FAMILY INCOME
$87,826
AVG HOUSEHOLD INCOME
28.2%
WAGE / INCOME GAP [ % ]
71.8¢/ $1
WAGE / INCOME GAP [ $ ]
0.29
INEQUALITY / GINI INDEX
4,759
TOTAL POPULATION
2,179
MALE POPULATION
2,580
FEMALE POPULATION
84.46
MALES / 100 FEMALES
118.40
FEMALES / 100 MALES
41.7
MEDIAN AGE
3.1
AVG FAMILY SIZE
2.7
AVG HOUSEHOLD SIZE
2,892
LABOR FORCE [ PEOPLE ]
72.7%
PERCENT IN LABOR FORCE
2.2%
UNEMPLOYMENT RATE
Christiana Zip Codes
Income in Christiana
Income Overview in Christiana
Per Capita Income in Christiana is $34,887, while median incomes of families and households are $107,596 and $87,826 respectively.
| Characteristic | Number | Measure |
| Per Capita Income | 4,759 | $34,887 |
| Median Family Income | 1,370 | $107,596 |
| Mean Family Income | 1,370 | $100,804 |
| Median Household Income | 1,786 | $87,826 |
| Mean Household Income | 1,786 | $88,962 |
| Income Deficit | 1,370 | $0 |
| Wage / Income Gap (%) | 4,759 | 28.23% |
| Wage / Income Gap ($) | 4,759 | 71.77¢ per $1 |
| Gini / Inequality Index | 4,759 | 0.29 |
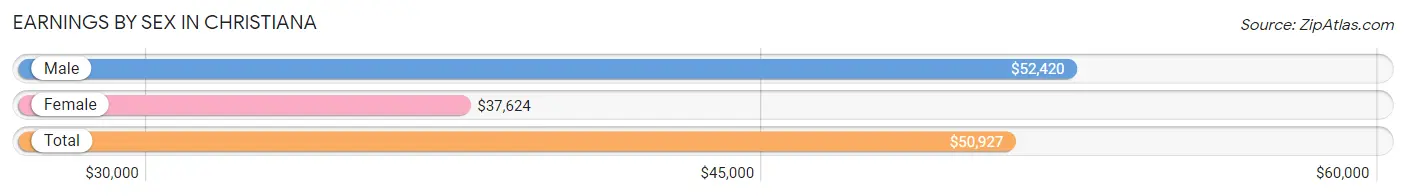
Earnings by Sex in Christiana
Average Earnings in Christiana are $50,927, $52,420 for men and $37,624 for women, a difference of 28.2%.
| Sex | Number | Average Earnings |
| Male | 1,371 (46.6%) | $52,420 |
| Female | 1,571 (53.4%) | $37,624 |
| Total | 2,942 (100.0%) | $50,927 |
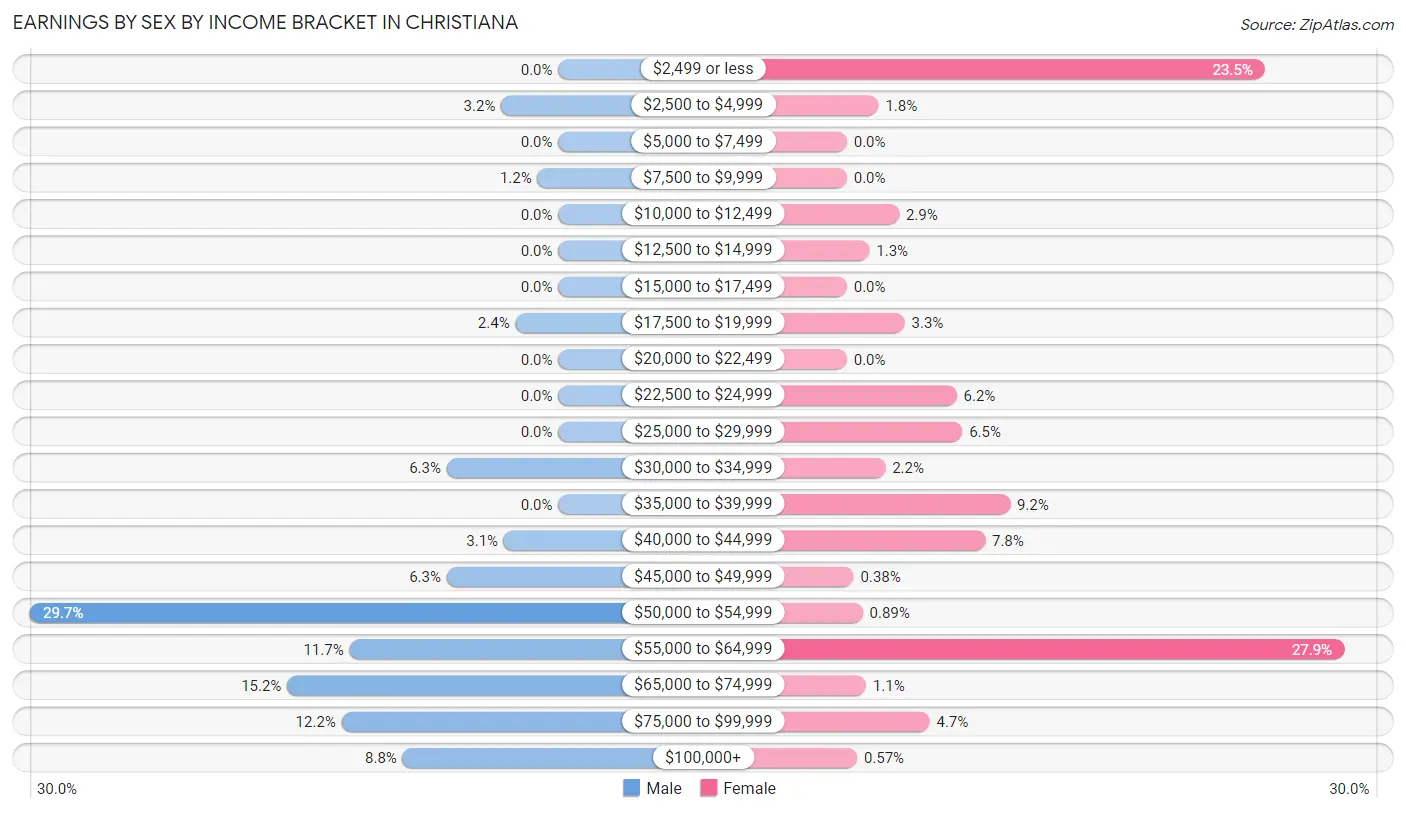
Earnings by Sex by Income Bracket in Christiana
The most common earnings brackets in Christiana are $50,000 to $54,999 for men (407 | 29.7%) and $55,000 to $64,999 for women (439 | 27.9%).
| Income | Male | Female |
| $2,499 or less | 0 (0.0%) | 369 (23.5%) |
| $2,500 to $4,999 | 44 (3.2%) | 28 (1.8%) |
| $5,000 to $7,499 | 0 (0.0%) | 0 (0.0%) |
| $7,500 to $9,999 | 16 (1.2%) | 0 (0.0%) |
| $10,000 to $12,499 | 0 (0.0%) | 46 (2.9%) |
| $12,500 to $14,999 | 0 (0.0%) | 20 (1.3%) |
| $15,000 to $17,499 | 0 (0.0%) | 0 (0.0%) |
| $17,500 to $19,999 | 33 (2.4%) | 51 (3.3%) |
| $20,000 to $22,499 | 0 (0.0%) | 0 (0.0%) |
| $22,500 to $24,999 | 0 (0.0%) | 97 (6.2%) |
| $25,000 to $29,999 | 0 (0.0%) | 102 (6.5%) |
| $30,000 to $34,999 | 86 (6.3%) | 34 (2.2%) |
| $35,000 to $39,999 | 0 (0.0%) | 144 (9.2%) |
| $40,000 to $44,999 | 42 (3.1%) | 122 (7.8%) |
| $45,000 to $49,999 | 86 (6.3%) | 6 (0.4%) |
| $50,000 to $54,999 | 407 (29.7%) | 14 (0.9%) |
| $55,000 to $64,999 | 161 (11.7%) | 439 (27.9%) |
| $65,000 to $74,999 | 209 (15.2%) | 17 (1.1%) |
| $75,000 to $99,999 | 167 (12.2%) | 73 (4.6%) |
| $100,000+ | 120 (8.7%) | 9 (0.6%) |
| Total | 1,371 (100.0%) | 1,571 (100.0%) |
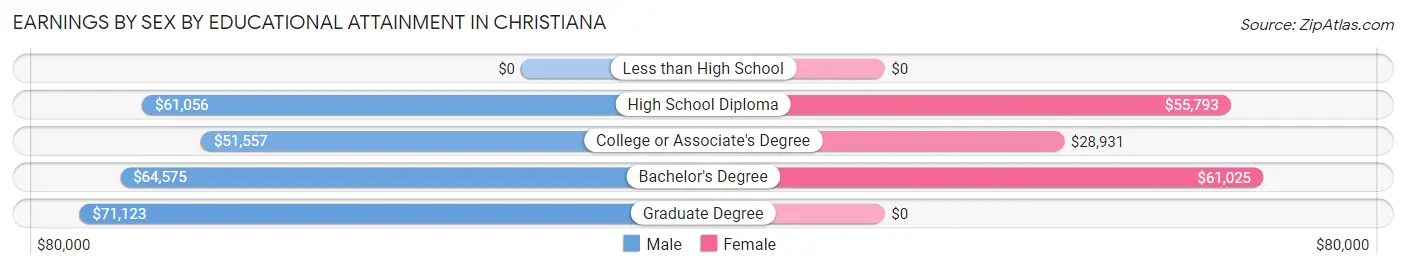
Earnings by Sex by Educational Attainment in Christiana
Average earnings in Christiana are $53,203 for men and $44,938 for women, a difference of 15.5%. Men with an educational attainment of graduate degree enjoy the highest average annual earnings of $71,123, while those with college or associate's degree education earn the least with $51,557. Women with an educational attainment of bachelor's degree earn the most with the average annual earnings of $61,025, while those with college or associate's degree education have the smallest earnings of $28,931.
| Educational Attainment | Male Income | Female Income |
| Less than High School | - | - |
| High School Diploma | $61,056 | $55,793 |
| College or Associate's Degree | $51,557 | $28,931 |
| Bachelor's Degree | $64,575 | $61,025 |
| Graduate Degree | $71,123 | $0 |
| Total | $53,203 | $44,938 |
Family Income in Christiana
Family Income Brackets in Christiana
According to the Christiana family income data, there are 597 families falling into the $100,000 to $149,999 income range, which is the most common income bracket and makes up 43.6% of all families.
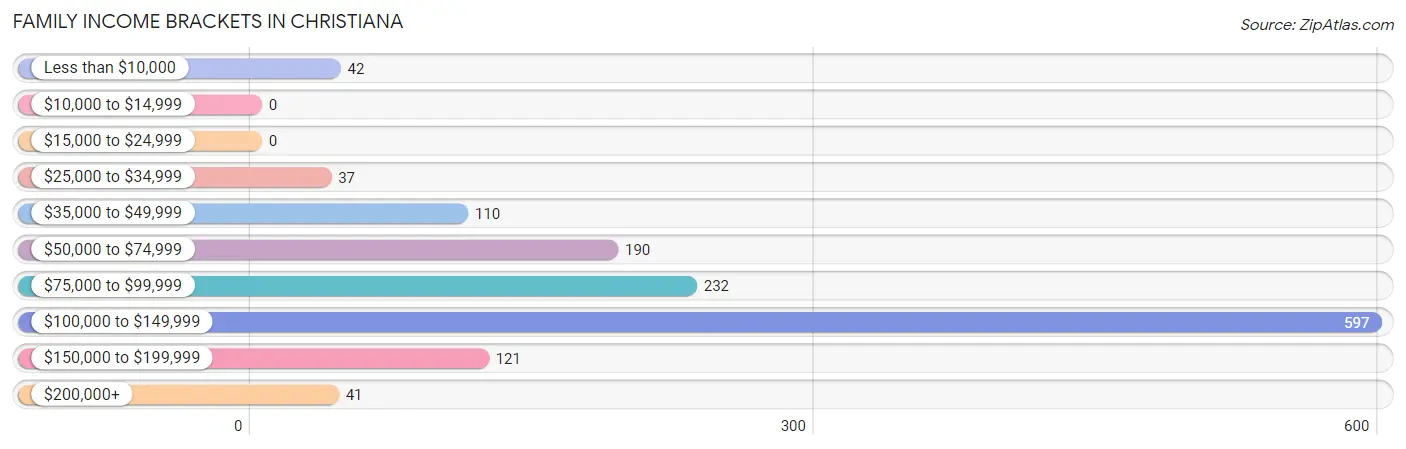
| Income Bracket | # Families | % Families |
| Less than $10,000 | 42 | 3.1% |
| $10,000 to $14,999 | 0 | 0.0% |
| $15,000 to $24,999 | 0 | 0.0% |
| $25,000 to $34,999 | 37 | 2.7% |
| $35,000 to $49,999 | 110 | 8.0% |
| $50,000 to $74,999 | 190 | 13.9% |
| $75,000 to $99,999 | 232 | 16.9% |
| $100,000 to $149,999 | 597 | 43.6% |
| $150,000 to $199,999 | 121 | 8.8% |
| $200,000+ | 41 | 3.0% |
Family Income by Famaliy Size in Christiana
4-person families (301 | 22.0%) account for the highest median family income in Christiana with $131,484 per family, while 3-person families (483 | 35.3%) have the highest median income of $36,121 per family member.
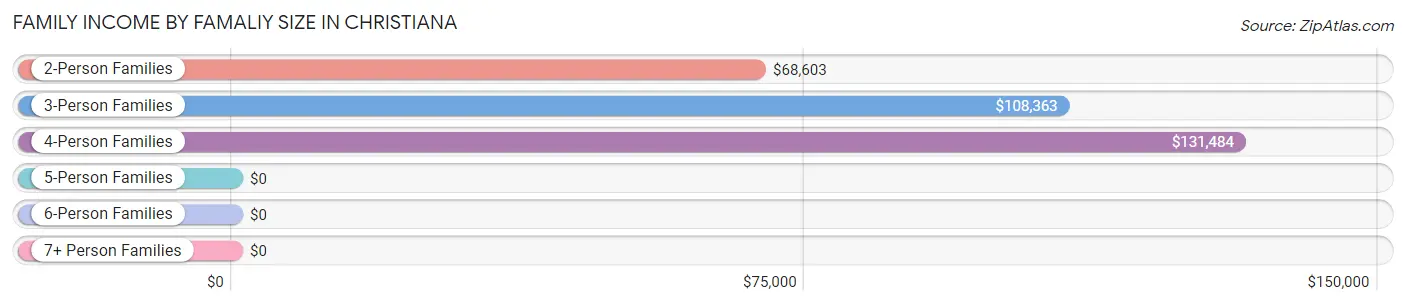
| Income Bracket | # Families | Median Income |
| 2-Person Families | 531 (38.8%) | $68,603 |
| 3-Person Families | 483 (35.3%) | $108,363 |
| 4-Person Families | 301 (22.0%) | $131,484 |
| 5-Person Families | 32 (2.3%) | $0 |
| 6-Person Families | 23 (1.7%) | $0 |
| 7+ Person Families | 0 (0.0%) | $0 |
| Total | 1,370 (100.0%) | $107,596 |
Family Income by Number of Earners in Christiana
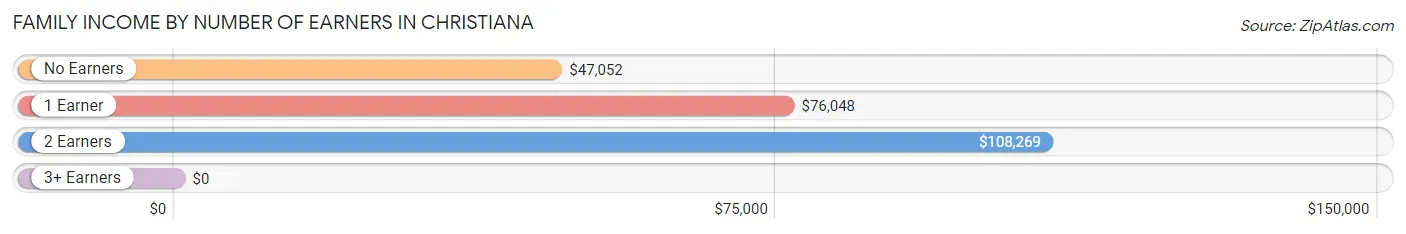
| Number of Earners | # Families | Median Income |
| No Earners | 224 (16.4%) | $47,052 |
| 1 Earner | 260 (19.0%) | $76,048 |
| 2 Earners | 586 (42.8%) | $108,269 |
| 3+ Earners | 300 (21.9%) | $0 |
| Total | 1,370 (100.0%) | $107,596 |
Household Income in Christiana
Household Income Brackets in Christiana
With 597 households falling in the category, the $100,000 to $149,999 income range is the most frequent in Christiana, accounting for 33.4% of all households.
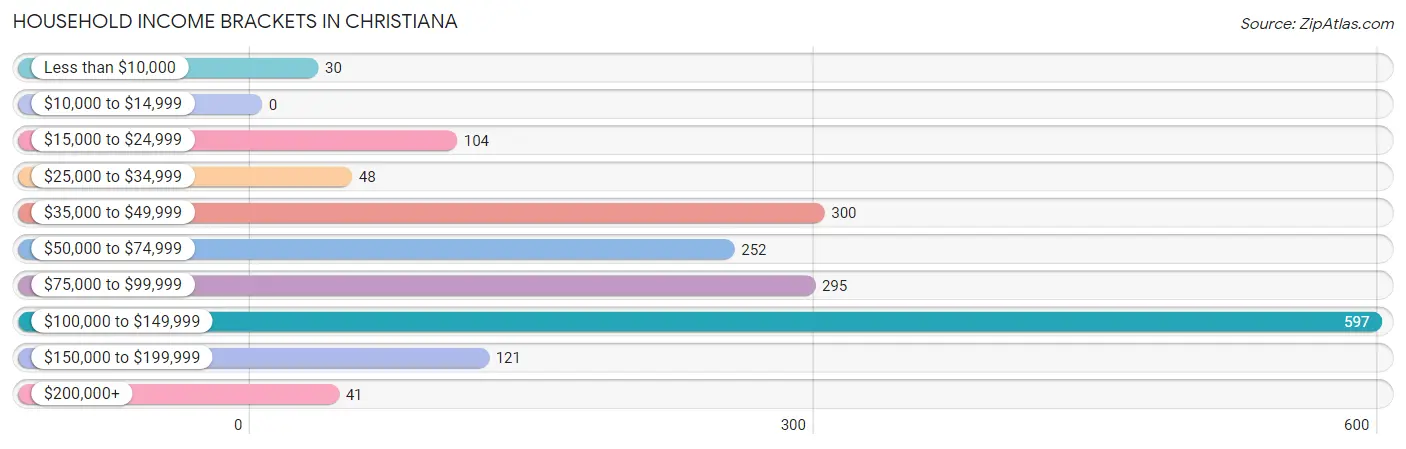
| Income Bracket | # Households | % Households |
| Less than $10,000 | 30 | 1.7% |
| $10,000 to $14,999 | 0 | 0.0% |
| $15,000 to $24,999 | 104 | 5.8% |
| $25,000 to $34,999 | 48 | 2.7% |
| $35,000 to $49,999 | 300 | 16.8% |
| $50,000 to $74,999 | 252 | 14.1% |
| $75,000 to $99,999 | 295 | 16.5% |
| $100,000 to $149,999 | 597 | 33.4% |
| $150,000 to $199,999 | 121 | 6.8% |
| $200,000+ | 41 | 2.3% |
Household Income by Householder Age in Christiana
The median household income in Christiana is $87,826, with the highest median household income of $108,127 found in the 45 to 64 years age bracket for the primary householder. A total of 632 households (35.4%) fall into this category. Meanwhile, the 15 to 24 years age bracket for the primary householder has the lowest median household income of $0, with 14 households (0.8%) in this group.
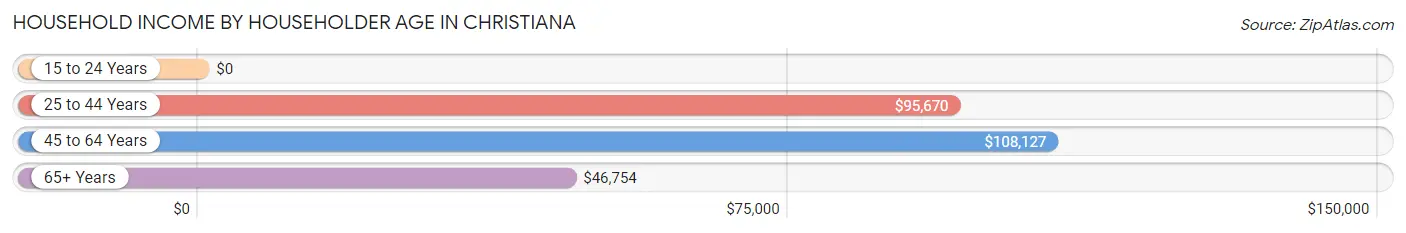
| Income Bracket | # Households | Median Income |
| 15 to 24 Years | 14 (0.8%) | $0 |
| 25 to 44 Years | 779 (43.6%) | $95,670 |
| 45 to 64 Years | 632 (35.4%) | $108,127 |
| 65+ Years | 361 (20.2%) | $46,754 |
| Total | 1,786 (100.0%) | $87,826 |
Poverty in Christiana
Income Below Poverty by Sex and Age in Christiana
With 2.3% poverty level for males and 3.6% for females among the residents of Christiana, 65 to 74 year old males and 75 year old and over females are the most vulnerable to poverty, with 37 males (14.1%) and 16 females (22.5%) in their respective age groups living below the poverty level.
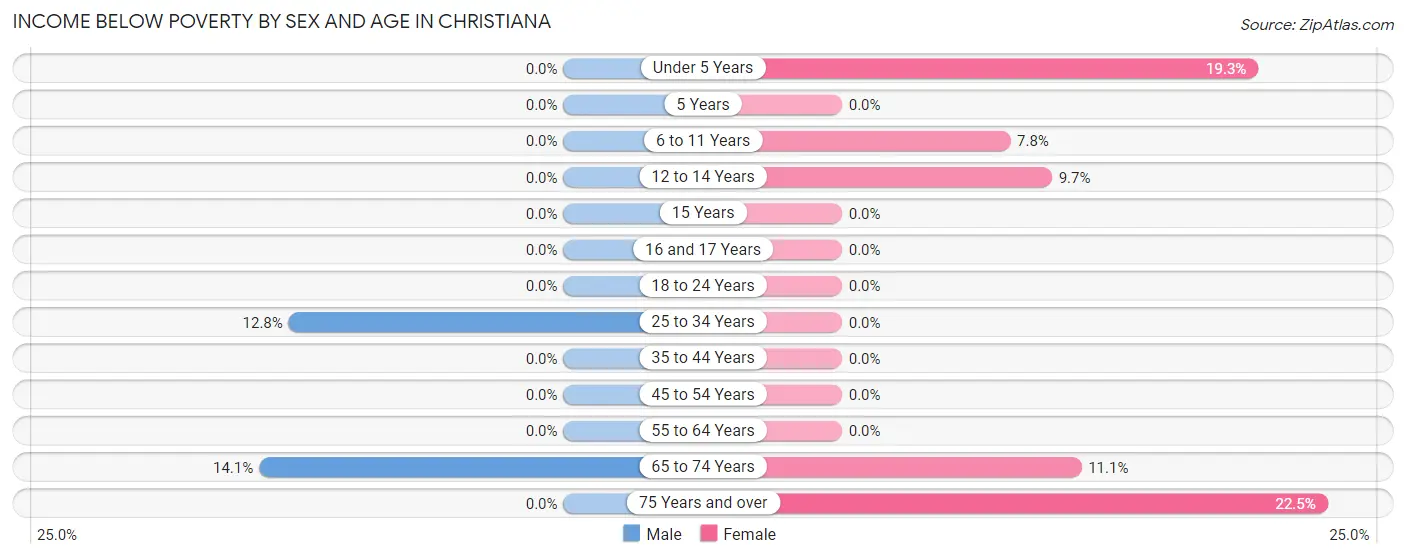
| Age Bracket | Male | Female |
| Under 5 Years | 0 (0.0%) | 17 (19.3%) |
| 5 Years | 0 (0.0%) | 0 (0.0%) |
| 6 to 11 Years | 0 (0.0%) | 15 (7.8%) |
| 12 to 14 Years | 0 (0.0%) | 15 (9.7%) |
| 15 Years | 0 (0.0%) | 0 (0.0%) |
| 16 and 17 Years | 0 (0.0%) | 0 (0.0%) |
| 18 to 24 Years | 0 (0.0%) | 0 (0.0%) |
| 25 to 34 Years | 13 (12.8%) | 0 (0.0%) |
| 35 to 44 Years | 0 (0.0%) | 0 (0.0%) |
| 45 to 54 Years | 0 (0.0%) | 0 (0.0%) |
| 55 to 64 Years | 0 (0.0%) | 0 (0.0%) |
| 65 to 74 Years | 37 (14.1%) | 30 (11.1%) |
| 75 Years and over | 0 (0.0%) | 16 (22.5%) |
| Total | 50 (2.3%) | 93 (3.6%) |
Income Above Poverty by Sex and Age in Christiana
According to the poverty statistics in Christiana, males aged under 5 years and females aged 5 years are the age groups that are most secure financially, with 100.0% of males and 100.0% of females in these age groups living above the poverty line.
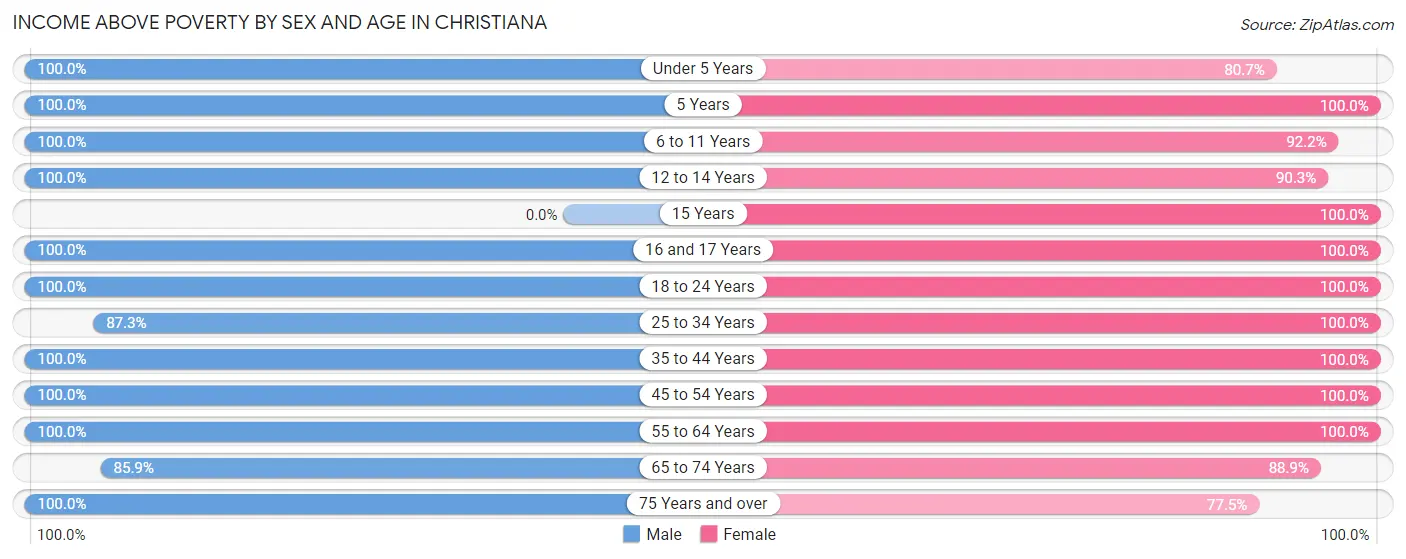
| Age Bracket | Male | Female |
| Under 5 Years | 56 (100.0%) | 71 (80.7%) |
| 5 Years | 17 (100.0%) | 7 (100.0%) |
| 6 to 11 Years | 182 (100.0%) | 177 (92.2%) |
| 12 to 14 Years | 72 (100.0%) | 139 (90.3%) |
| 15 Years | 0 (0.0%) | 13 (100.0%) |
| 16 and 17 Years | 130 (100.0%) | 428 (100.0%) |
| 18 to 24 Years | 34 (100.0%) | 56 (100.0%) |
| 25 to 34 Years | 89 (87.3%) | 169 (100.0%) |
| 35 to 44 Years | 484 (100.0%) | 582 (100.0%) |
| 45 to 54 Years | 565 (100.0%) | 376 (100.0%) |
| 55 to 64 Years | 175 (100.0%) | 174 (100.0%) |
| 65 to 74 Years | 225 (85.9%) | 240 (88.9%) |
| 75 Years and over | 100 (100.0%) | 55 (77.5%) |
| Total | 2,129 (97.7%) | 2,487 (96.4%) |
Income Below Poverty Among Married-Couple Families in Christiana
The poverty statistics for married-couple families in Christiana show that 1.0% or 13 of the total 1,260 families live below the poverty line. Families with 1 or 2 children have the highest poverty rate of 1.8%, comprising of 13 families. On the other hand, families with no children have the lowest poverty rate of 0.0%, which includes 0 families.
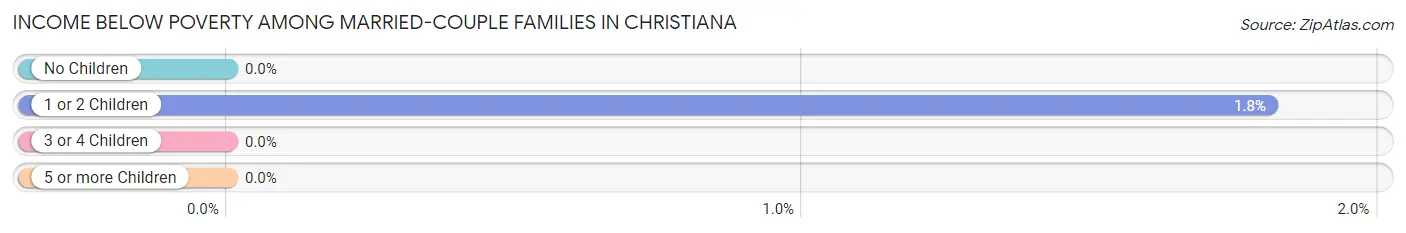
| Children | Above Poverty | Below Poverty |
| No Children | 513 (100.0%) | 0 (0.0%) |
| 1 or 2 Children | 704 (98.2%) | 13 (1.8%) |
| 3 or 4 Children | 30 (100.0%) | 0 (0.0%) |
| 5 or more Children | 0 (0.0%) | 0 (0.0%) |
| Total | 1,247 (99.0%) | 13 (1.0%) |
Income Below Poverty Among Single-Parent Households in Christiana
According to the poverty data in Christiana, 54.2% or 13 single-father households and 19.8% or 17 single-mother households are living below the poverty line. Among single-father households, those with 1 or 2 children have the highest poverty rate, with 13 households (54.2%) experiencing poverty. Likewise, among single-mother households, those with no children have the highest poverty rate, with 17 households (37.8%) falling below the poverty line.
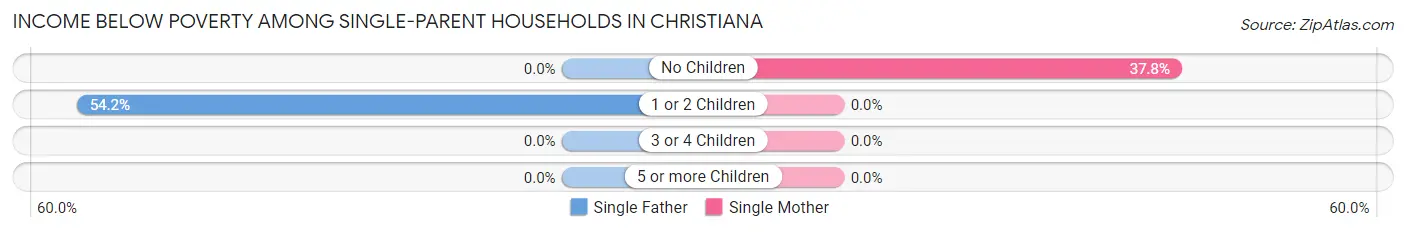
| Children | Single Father | Single Mother |
| No Children | 0 (0.0%) | 17 (37.8%) |
| 1 or 2 Children | 13 (54.2%) | 0 (0.0%) |
| 3 or 4 Children | 0 (0.0%) | 0 (0.0%) |
| 5 or more Children | 0 (0.0%) | 0 (0.0%) |
| Total | 13 (54.2%) | 17 (19.8%) |
Income Below Poverty Among Married-Couple vs Single-Parent Households in Christiana
The poverty data for Christiana shows that 13 of the married-couple family households (1.0%) and 30 of the single-parent households (27.3%) are living below the poverty level. Within the married-couple family households, those with 1 or 2 children have the highest poverty rate, with 13 households (1.8%) falling below the poverty line. Among the single-parent households, those with no children have the highest poverty rate, with 17 household (37.8%) living below poverty.
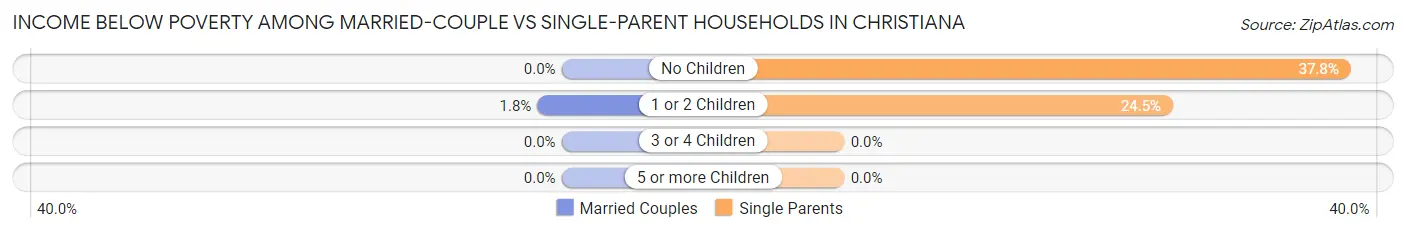
| Children | Married-Couple Families | Single-Parent Households |
| No Children | 0 (0.0%) | 17 (37.8%) |
| 1 or 2 Children | 13 (1.8%) | 13 (24.5%) |
| 3 or 4 Children | 0 (0.0%) | 0 (0.0%) |
| 5 or more Children | 0 (0.0%) | 0 (0.0%) |
| Total | 13 (1.0%) | 30 (27.3%) |
Race in Christiana
The most populous races in Christiana are White / Caucasian (4,473 | 94.0%), Two or more Races (146 | 3.1%), and Black / African American (125 | 2.6%).
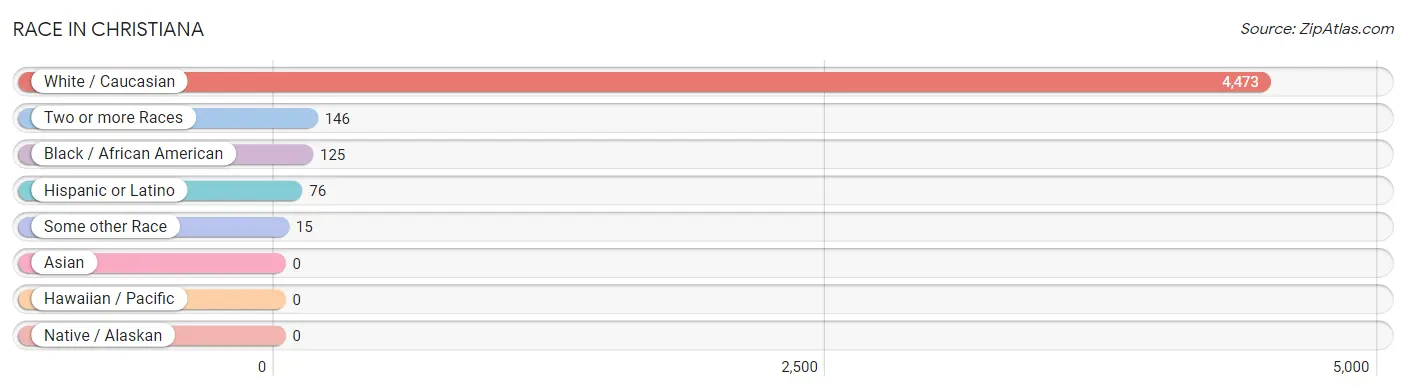
| Race | # Population | % Population |
| Asian | 0 | 0.0% |
| Black / African American | 125 | 2.6% |
| Hawaiian / Pacific | 0 | 0.0% |
| Hispanic or Latino | 76 | 1.6% |
| Native / Alaskan | 0 | 0.0% |
| White / Caucasian | 4,473 | 94.0% |
| Two or more Races | 146 | 3.1% |
| Some other Race | 15 | 0.3% |
| Total | 4,759 | 100.0% |
Ancestry in Christiana
The most populous ancestries reported in Christiana are English (1,692 | 35.5%), American (456 | 9.6%), Irish (406 | 8.5%), Italian (370 | 7.8%), and German (331 | 7.0%), together accounting for 68.4% of all Christiana residents.
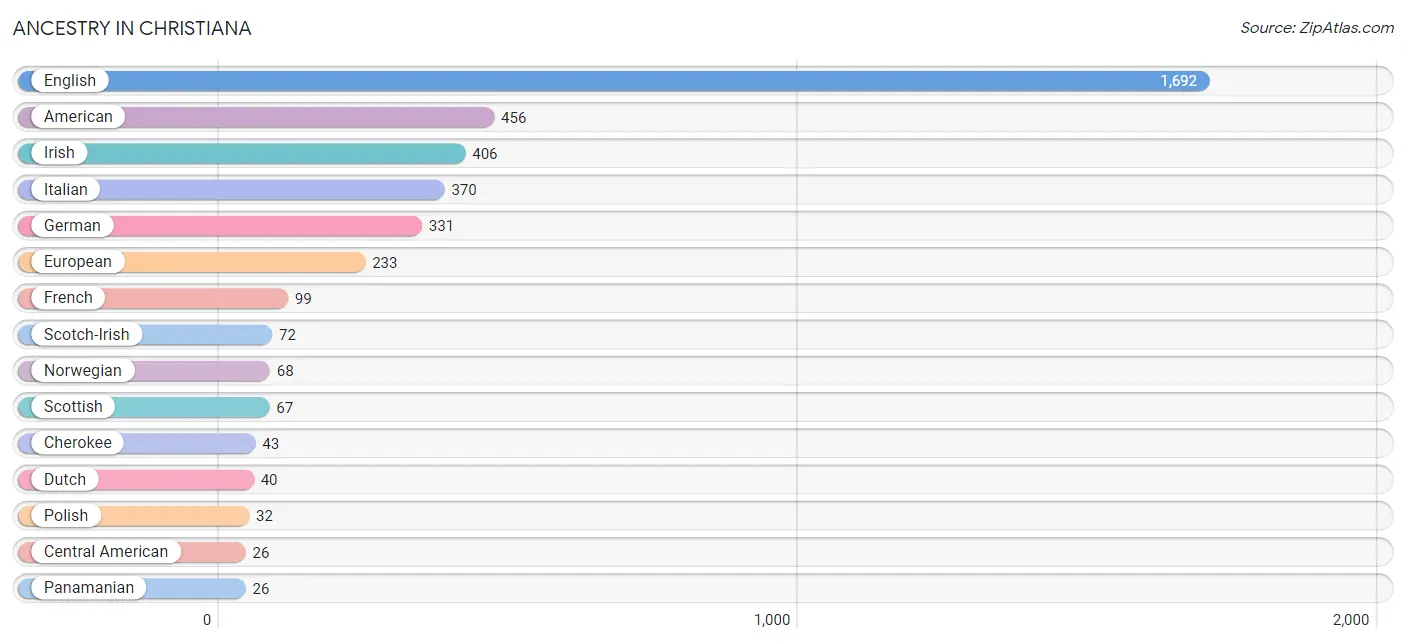
| Ancestry | # Population | % Population |
| American | 456 | 9.6% |
| Apache | 20 | 0.4% |
| Central American | 26 | 0.5% |
| Cherokee | 43 | 0.9% |
| Colombian | 15 | 0.3% |
| Cuban | 23 | 0.5% |
| Czechoslovakian | 24 | 0.5% |
| Dutch | 40 | 0.8% |
| English | 1,692 | 35.5% |
| European | 233 | 4.9% |
| French | 99 | 2.1% |
| German | 331 | 7.0% |
| Irish | 406 | 8.5% |
| Italian | 370 | 7.8% |
| Mexican | 12 | 0.3% |
| Norwegian | 68 | 1.4% |
| Panamanian | 26 | 0.5% |
| Polish | 32 | 0.7% |
| Scotch-Irish | 72 | 1.5% |
| Scottish | 67 | 1.4% |
| South American | 15 | 0.3% |
| Swedish | 15 | 0.3% |
| Swiss | 15 | 0.3% | View All 23 Rows |
Immigrants in Christiana
The most numerous immigrant groups reported in Christiana came from Colombia (15 | 0.3%), Latin America (15 | 0.3%), South America (15 | 0.3%), Australia (13 | 0.3%), and Oceania (13 | 0.3%), together accounting for 1.5% of all Christiana residents.
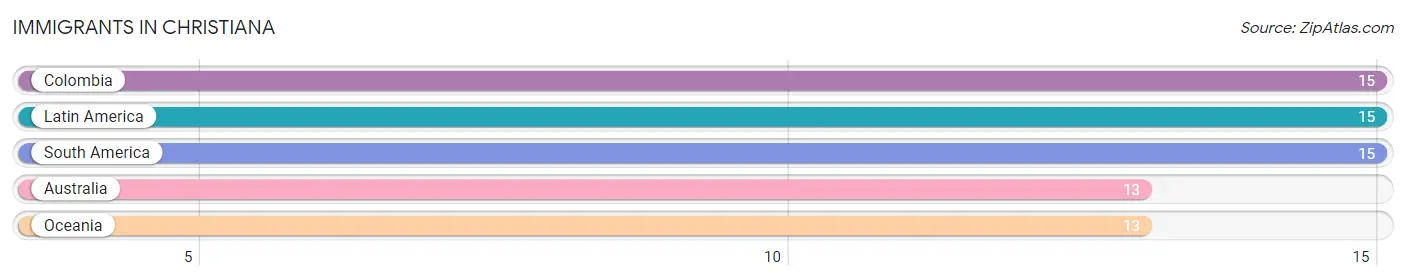
| Immigration Origin | # Population | % Population |
| Australia | 13 | 0.3% |
| Colombia | 15 | 0.3% |
| Latin America | 15 | 0.3% |
| Oceania | 13 | 0.3% |
| South America | 15 | 0.3% | View All 5 Rows |
Sex and Age in Christiana
Sex and Age in Christiana
The most populous age groups in Christiana are 45 to 49 Years (512 | 23.5%) for men and 15 to 19 Years (441 | 17.1%) for women.
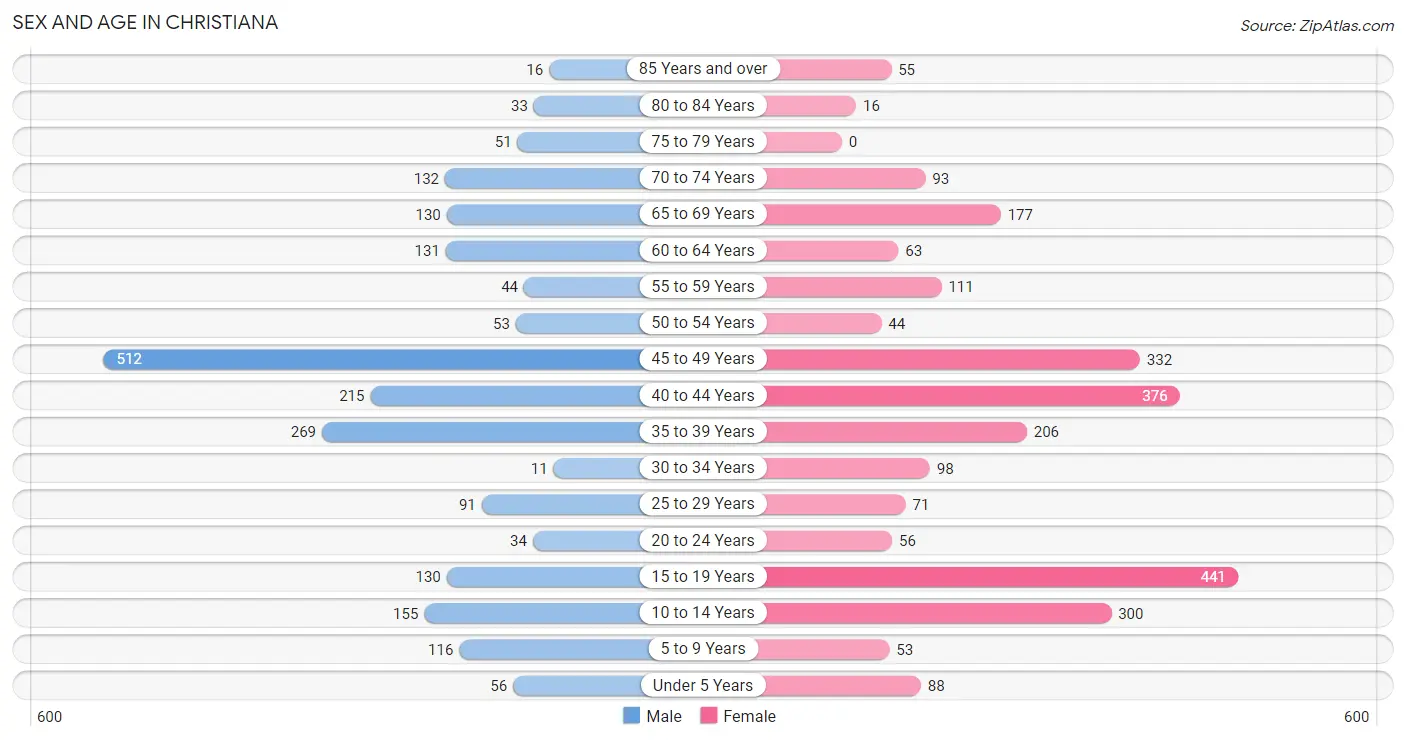
| Age Bracket | Male | Female |
| Under 5 Years | 56 (2.6%) | 88 (3.4%) |
| 5 to 9 Years | 116 (5.3%) | 53 (2.1%) |
| 10 to 14 Years | 155 (7.1%) | 300 (11.6%) |
| 15 to 19 Years | 130 (6.0%) | 441 (17.1%) |
| 20 to 24 Years | 34 (1.6%) | 56 (2.2%) |
| 25 to 29 Years | 91 (4.2%) | 71 (2.8%) |
| 30 to 34 Years | 11 (0.5%) | 98 (3.8%) |
| 35 to 39 Years | 269 (12.3%) | 206 (8.0%) |
| 40 to 44 Years | 215 (9.9%) | 376 (14.6%) |
| 45 to 49 Years | 512 (23.5%) | 332 (12.9%) |
| 50 to 54 Years | 53 (2.4%) | 44 (1.7%) |
| 55 to 59 Years | 44 (2.0%) | 111 (4.3%) |
| 60 to 64 Years | 131 (6.0%) | 63 (2.4%) |
| 65 to 69 Years | 130 (6.0%) | 177 (6.9%) |
| 70 to 74 Years | 132 (6.1%) | 93 (3.6%) |
| 75 to 79 Years | 51 (2.3%) | 0 (0.0%) |
| 80 to 84 Years | 33 (1.5%) | 16 (0.6%) |
| 85 Years and over | 16 (0.7%) | 55 (2.1%) |
| Total | 2,179 (100.0%) | 2,580 (100.0%) |
Families and Households in Christiana
Median Family Size in Christiana
The median family size in Christiana is 3.12 persons per family, with single female/mother families (86 | 6.3%) accounting for the largest median family size of 3.19 persons per family. On the other hand, single male/father families (24 | 1.8%) represent the smallest median family size with 2.63 persons per family.
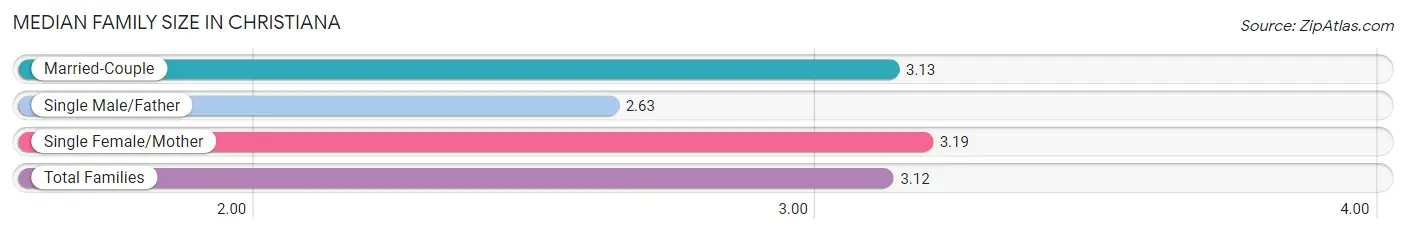
| Family Type | # Families | Family Size |
| Married-Couple | 1,260 (92.0%) | 3.13 |
| Single Male/Father | 24 (1.8%) | 2.63 |
| Single Female/Mother | 86 (6.3%) | 3.19 |
| Total Families | 1,370 (100.0%) | 3.12 |
Median Household Size in Christiana
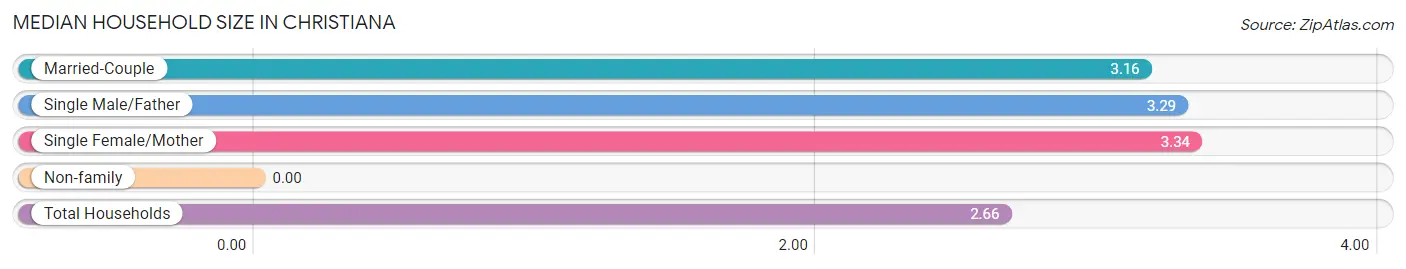
| Household Type | # Households | Household Size |
| Married-Couple | 1,260 (70.6%) | 3.16 |
| Single Male/Father | 24 (1.3%) | 3.29 |
| Single Female/Mother | 86 (4.8%) | 3.34 |
| Non-family | 416 (23.3%) | - |
| Total Households | 1,786 (100.0%) | 2.66 |
Household Size by Marriage Status in Christiana
Out of a total of 1,786 households in Christiana, 1,370 (76.7%) are family households, while 416 (23.3%) are nonfamily households. The most numerous type of family households are 2-person households, comprising 504, and the most common type of nonfamily households are 1-person households, comprising 416.

| Household Size | Family Households | Nonfamily Households |
| 1-Person Households | - | 416 (23.3%) |
| 2-Person Households | 504 (28.2%) | 0 (0.0%) |
| 3-Person Households | 496 (27.8%) | 0 (0.0%) |
| 4-Person Households | 315 (17.6%) | 0 (0.0%) |
| 5-Person Households | 20 (1.1%) | 0 (0.0%) |
| 6-Person Households | 35 (2.0%) | 0 (0.0%) |
| 7+ Person Households | 0 (0.0%) | 0 (0.0%) |
| Total | 1,370 (76.7%) | 416 (23.3%) |
Female Fertility in Christiana
Fertility by Age in Christiana
| Age Bracket | Women with Births | Births / 1,000 Women |
| 15 to 19 years | 0 (0.0%) | 0.0 |
| 20 to 34 years | 0 (0.0%) | 0.0 |
| 35 to 50 years | 0 (0.0%) | 0.0 |
| Total | 0 (0.0%) | 0.0 |
Fertility by Age by Marriage Status in Christiana
| Age Bracket | Married | Unmarried |
| 15 to 19 years | 0 (0.0%) | 0 (0.0%) |
| 20 to 34 years | 0 (0.0%) | 0 (0.0%) |
| 35 to 50 years | 0 (0.0%) | 0 (0.0%) |
| Total | 0 (0.0%) | 0 (0.0%) |
Fertility by Education in Christiana
| Educational Attainment | Women with Births | Births / 1,000 Women |
| Less than High School | 0 (0.0%) | 0.0 |
| High School Diploma | 0 (0.0%) | 0.0 |
| College or Associate's Degree | 0 (0.0%) | 0.0 |
| Bachelor's Degree | 0 (0.0%) | 0.0 |
| Graduate Degree | 0 (0.0%) | 0.0 |
| Total | 0 (0.0%) | 0.0 |
Fertility by Education by Marriage Status in Christiana
| Educational Attainment | Married | Unmarried |
| Less than High School | 0 (0.0%) | 0 (0.0%) |
| High School Diploma | 0 (0.0%) | 0 (0.0%) |
| College or Associate's Degree | 0 (0.0%) | 0 (0.0%) |
| Bachelor's Degree | 0 (0.0%) | 0 (0.0%) |
| Graduate Degree | 0 (0.0%) | 0 (0.0%) |
| Total | 0 (0.0%) | 0 (0.0%) |
Employment Characteristics in Christiana
Employment by Class of Employer in Christiana
Among the 2,703 employed individuals in Christiana, private company employees (2,108 | 78.0%), local government employees (194 | 7.2%), and self-employed (not incorporated) (168 | 6.2%) make up the most common classes of employment.
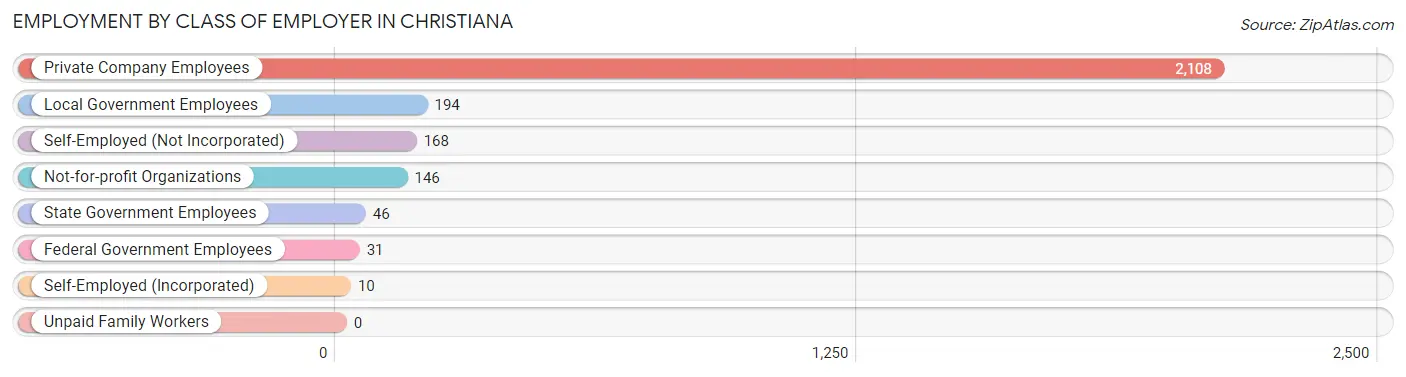
| Employer Class | # Employees | % Employees |
| Private Company Employees | 2,108 | 78.0% |
| Self-Employed (Incorporated) | 10 | 0.4% |
| Self-Employed (Not Incorporated) | 168 | 6.2% |
| Not-for-profit Organizations | 146 | 5.4% |
| Local Government Employees | 194 | 7.2% |
| State Government Employees | 46 | 1.7% |
| Federal Government Employees | 31 | 1.1% |
| Unpaid Family Workers | 0 | 0.0% |
| Total | 2,703 | 100.0% |
Employment Status by Age in Christiana
According to the labor force statistics for Christiana, out of the total population over 16 years of age (3,978), 72.7% or 2,892 individuals are in the labor force, with 2.2% or 64 of them unemployed. The age group with the highest labor force participation rate is 20 to 24 years, with 100.0% or 90 individuals in the labor force. Within the labor force, the 20 to 24 years age range has the highest percentage of unemployed individuals, with 22.2% or 20 of them being unemployed.
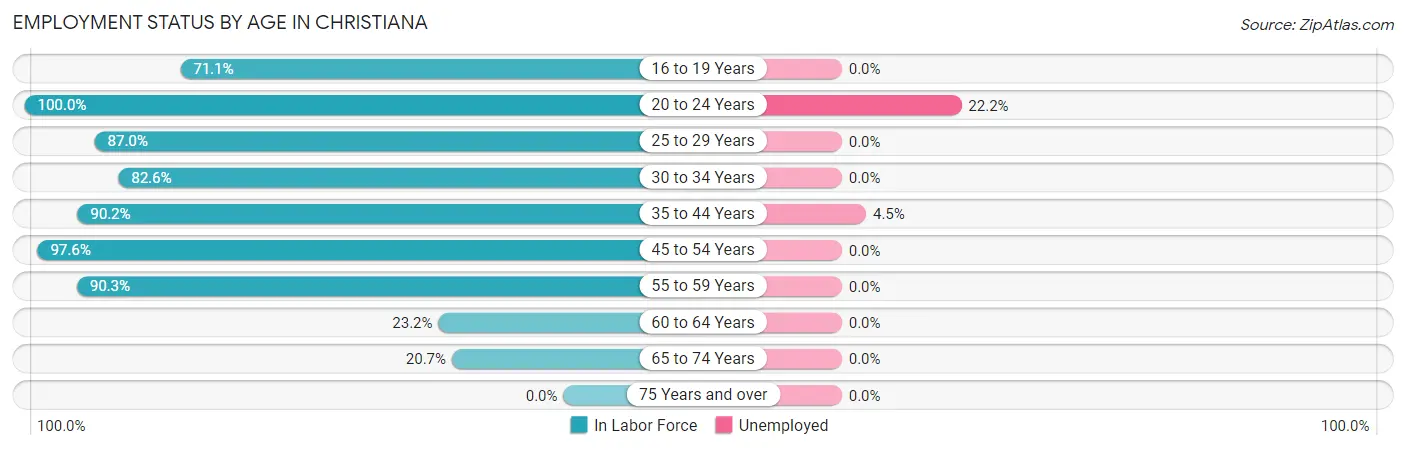
| Age Bracket | In Labor Force | Unemployed |
| 16 to 19 Years | 397 (71.1%) | 0 (0.0%) |
| 20 to 24 Years | 90 (100.0%) | 20 (22.2%) |
| 25 to 29 Years | 141 (87.0%) | 0 (0.0%) |
| 30 to 34 Years | 90 (82.6%) | 0 (0.0%) |
| 35 to 44 Years | 962 (90.2%) | 43 (4.5%) |
| 45 to 54 Years | 918 (97.6%) | 0 (0.0%) |
| 55 to 59 Years | 140 (90.3%) | 0 (0.0%) |
| 60 to 64 Years | 45 (23.2%) | 0 (0.0%) |
| 65 to 74 Years | 110 (20.7%) | 0 (0.0%) |
| 75 Years and over | 0 (0.0%) | 0 (0.0%) |
| Total | 2,892 (72.7%) | 64 (2.2%) |
Employment Status by Educational Attainment in Christiana
According to labor force statistics for Christiana, 87.4% of individuals (2,296) out of the total population between 25 and 64 years of age (2,627) are in the labor force, with 1.9% or 44 of them being unemployed. The group with the highest labor force participation rate are those with the educational attainment of college / associate degree, with 99.1% or 878 individuals in the labor force. Within the labor force, individuals with high school diploma education have the highest percentage of unemployment, with 6.6% or 43 of them being unemployed.
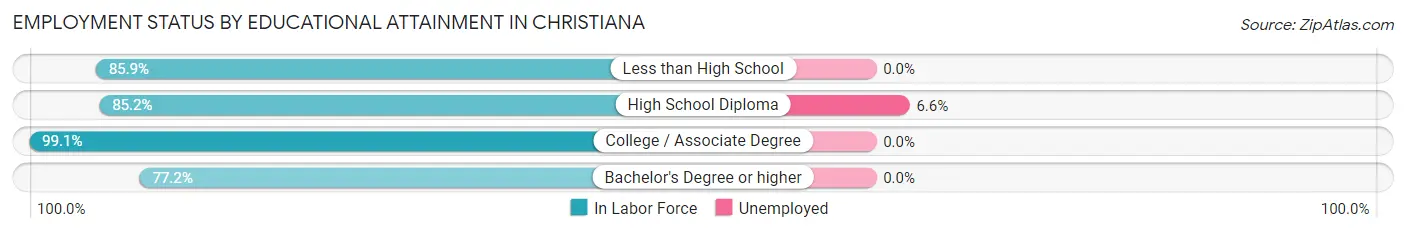
| Educational Attainment | In Labor Force | Unemployed |
| Less than High School | 116 (85.9%) | 0 (0.0%) |
| High School Diploma | 654 (85.2%) | 51 (6.6%) |
| College / Associate Degree | 878 (99.1%) | 0 (0.0%) |
| Bachelor's Degree or higher | 647 (77.2%) | 0 (0.0%) |
| Total | 2,296 (87.4%) | 50 (1.9%) |
Employment Occupations by Sex in Christiana
Management, Business, Science and Arts Occupations
The most common Management, Business, Science and Arts occupations in Christiana are Community & Social Service (327 | 11.6%), Education Instruction & Library (184 | 6.5%), Computers, Engineering & Science (163 | 5.8%), Management (150 | 5.3%), and Architecture & Engineering (130 | 4.6%).
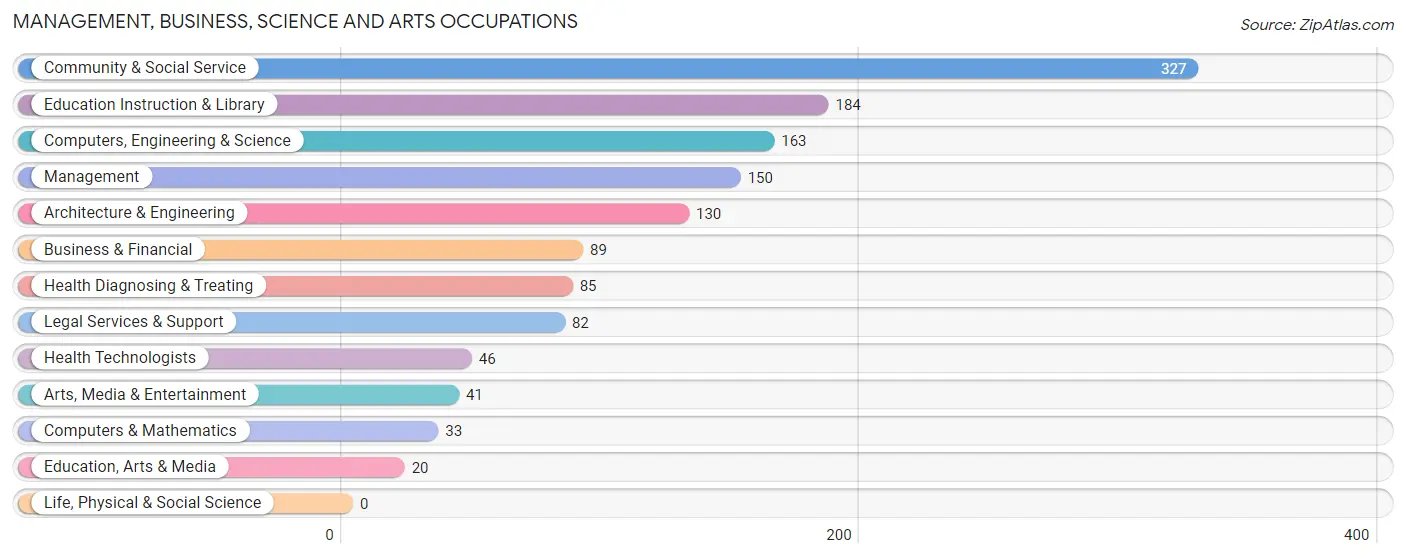
Management, Business, Science and Arts Occupations by Sex
Within the Management, Business, Science and Arts occupations in Christiana, the most male-oriented occupations are Architecture & Engineering (91.5%), Computers, Engineering & Science (78.5%), and Business & Financial (56.2%), while the most female-oriented occupations are Education, Arts & Media (100.0%), Legal Services & Support (100.0%), and Arts, Media & Entertainment (100.0%).
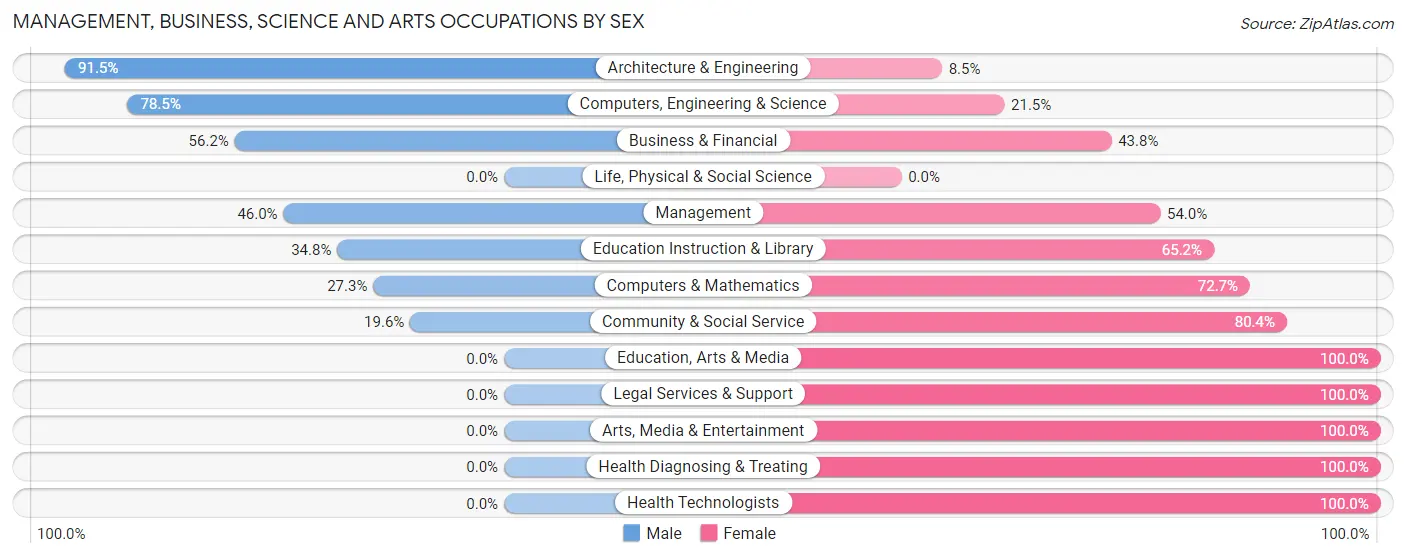
| Occupation | Male | Female |
| Management | 69 (46.0%) | 81 (54.0%) |
| Business & Financial | 50 (56.2%) | 39 (43.8%) |
| Computers, Engineering & Science | 128 (78.5%) | 35 (21.5%) |
| Computers & Mathematics | 9 (27.3%) | 24 (72.7%) |
| Architecture & Engineering | 119 (91.5%) | 11 (8.5%) |
| Life, Physical & Social Science | 0 (0.0%) | 0 (0.0%) |
| Community & Social Service | 64 (19.6%) | 263 (80.4%) |
| Education, Arts & Media | 0 (0.0%) | 20 (100.0%) |
| Legal Services & Support | 0 (0.0%) | 82 (100.0%) |
| Education Instruction & Library | 64 (34.8%) | 120 (65.2%) |
| Arts, Media & Entertainment | 0 (0.0%) | 41 (100.0%) |
| Health Diagnosing & Treating | 0 (0.0%) | 85 (100.0%) |
| Health Technologists | 0 (0.0%) | 46 (100.0%) |
| Total (Category) | 311 (38.2%) | 503 (61.8%) |
| Total (Overall) | 1,258 (44.5%) | 1,571 (55.5%) |
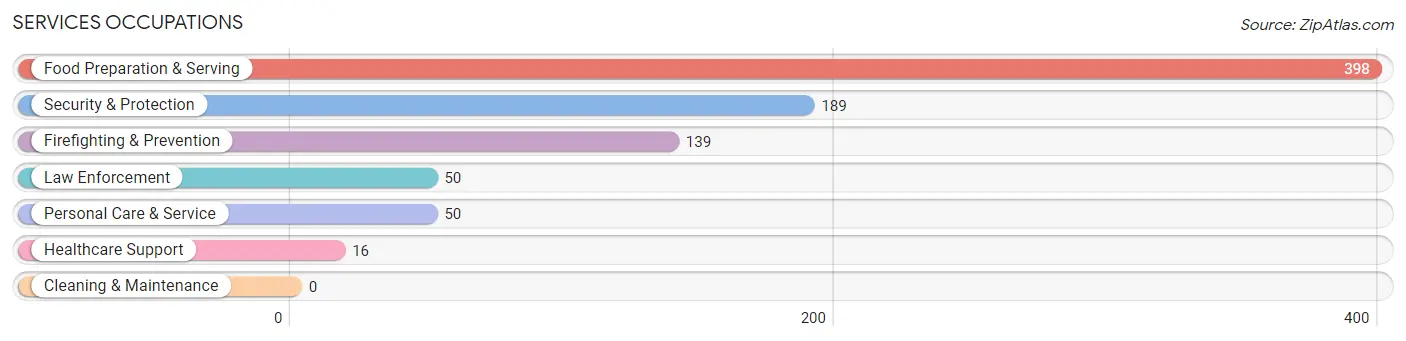
Services Occupations
The most common Services occupations in Christiana are Food Preparation & Serving (398 | 14.1%), Security & Protection (189 | 6.7%), Firefighting & Prevention (139 | 4.9%), Law Enforcement (50 | 1.8%), and Personal Care & Service (50 | 1.8%).
Services Occupations by Sex
Within the Services occupations in Christiana, the most male-oriented occupations are Law Enforcement (100.0%), Security & Protection (49.7%), and Firefighting & Prevention (31.7%), while the most female-oriented occupations are Healthcare Support (100.0%), Food Preparation & Serving (100.0%), and Personal Care & Service (100.0%).
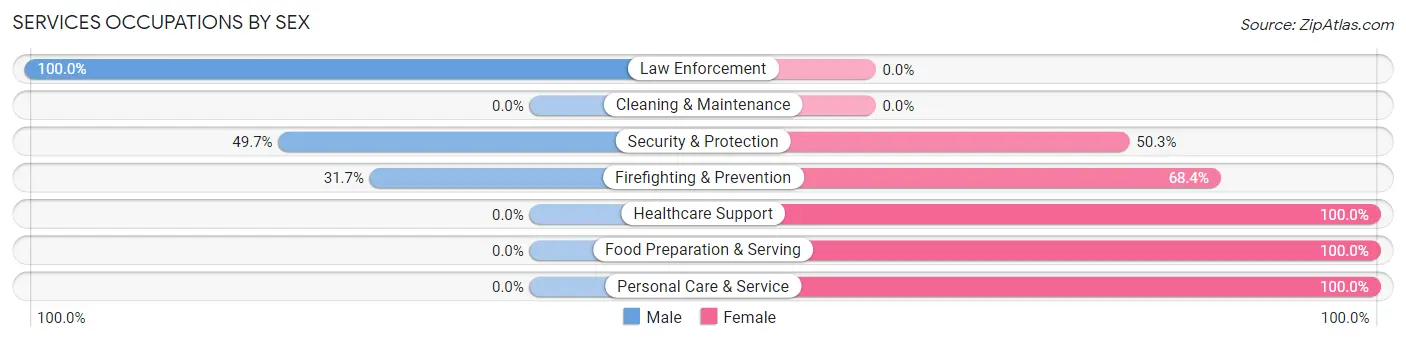
| Occupation | Male | Female |
| Healthcare Support | 0 (0.0%) | 16 (100.0%) |
| Security & Protection | 94 (49.7%) | 95 (50.3%) |
| Firefighting & Prevention | 44 (31.7%) | 95 (68.3%) |
| Law Enforcement | 50 (100.0%) | 0 (0.0%) |
| Food Preparation & Serving | 0 (0.0%) | 398 (100.0%) |
| Cleaning & Maintenance | 0 (0.0%) | 0 (0.0%) |
| Personal Care & Service | 0 (0.0%) | 50 (100.0%) |
| Total (Category) | 94 (14.4%) | 559 (85.6%) |
| Total (Overall) | 1,258 (44.5%) | 1,571 (55.5%) |
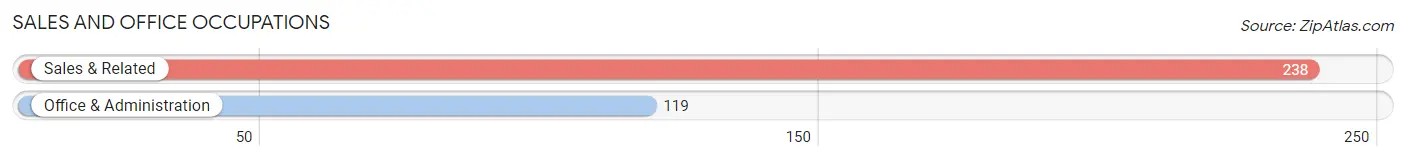
Sales and Office Occupations
The most common Sales and Office occupations in Christiana are Sales & Related (238 | 8.4%), and Office & Administration (119 | 4.2%).
Sales and Office Occupations by Sex
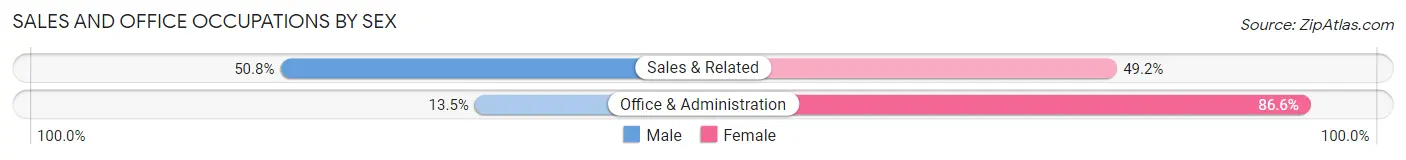
| Occupation | Male | Female |
| Sales & Related | 121 (50.8%) | 117 (49.2%) |
| Office & Administration | 16 (13.5%) | 103 (86.6%) |
| Total (Category) | 137 (38.4%) | 220 (61.6%) |
| Total (Overall) | 1,258 (44.5%) | 1,571 (55.5%) |
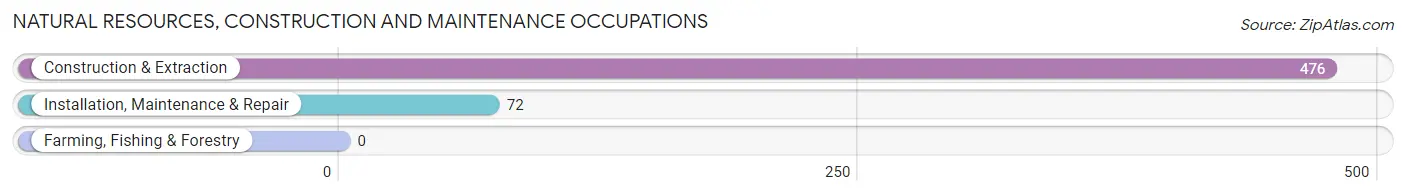
Natural Resources, Construction and Maintenance Occupations
The most common Natural Resources, Construction and Maintenance occupations in Christiana are Construction & Extraction (476 | 16.8%), and Installation, Maintenance & Repair (72 | 2.5%).
Natural Resources, Construction and Maintenance Occupations by Sex
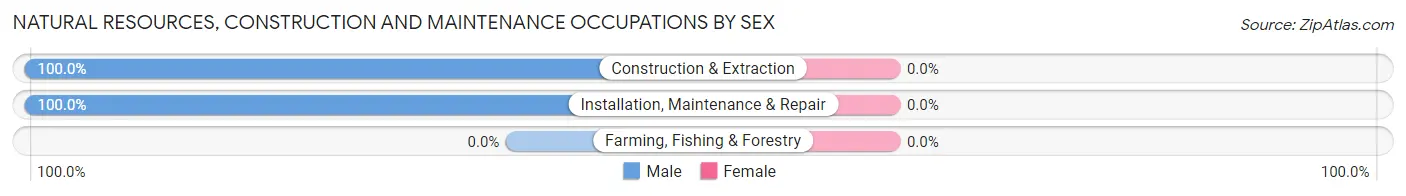
| Occupation | Male | Female |
| Farming, Fishing & Forestry | 0 (0.0%) | 0 (0.0%) |
| Construction & Extraction | 476 (100.0%) | 0 (0.0%) |
| Installation, Maintenance & Repair | 72 (100.0%) | 0 (0.0%) |
| Total (Category) | 548 (100.0%) | 0 (0.0%) |
| Total (Overall) | 1,258 (44.5%) | 1,571 (55.5%) |
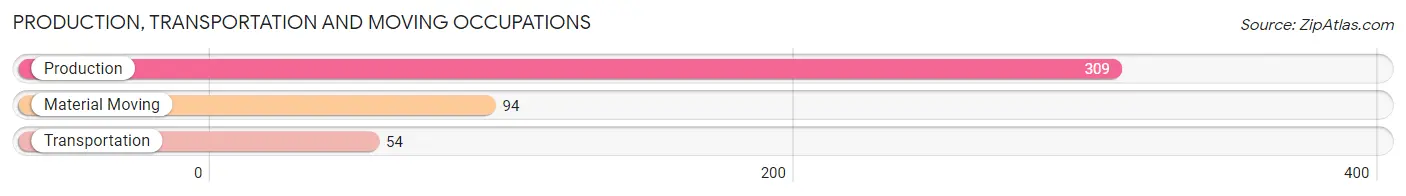
Production, Transportation and Moving Occupations
The most common Production, Transportation and Moving occupations in Christiana are Production (309 | 10.9%), Material Moving (94 | 3.3%), and Transportation (54 | 1.9%).
Production, Transportation and Moving Occupations by Sex
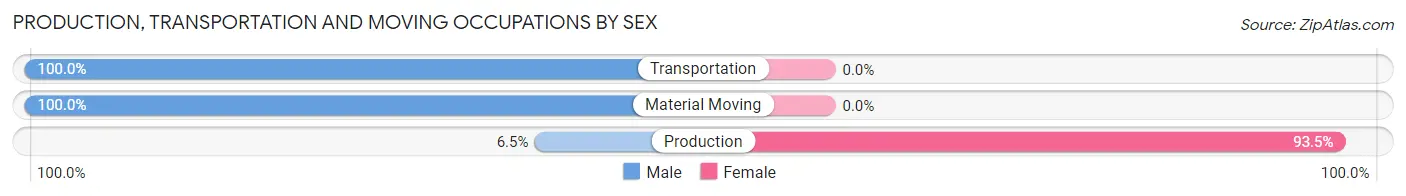
| Occupation | Male | Female |
| Production | 20 (6.5%) | 289 (93.5%) |
| Transportation | 54 (100.0%) | 0 (0.0%) |
| Material Moving | 94 (100.0%) | 0 (0.0%) |
| Total (Category) | 168 (36.8%) | 289 (63.2%) |
| Total (Overall) | 1,258 (44.5%) | 1,571 (55.5%) |
Employment Industries by Sex in Christiana
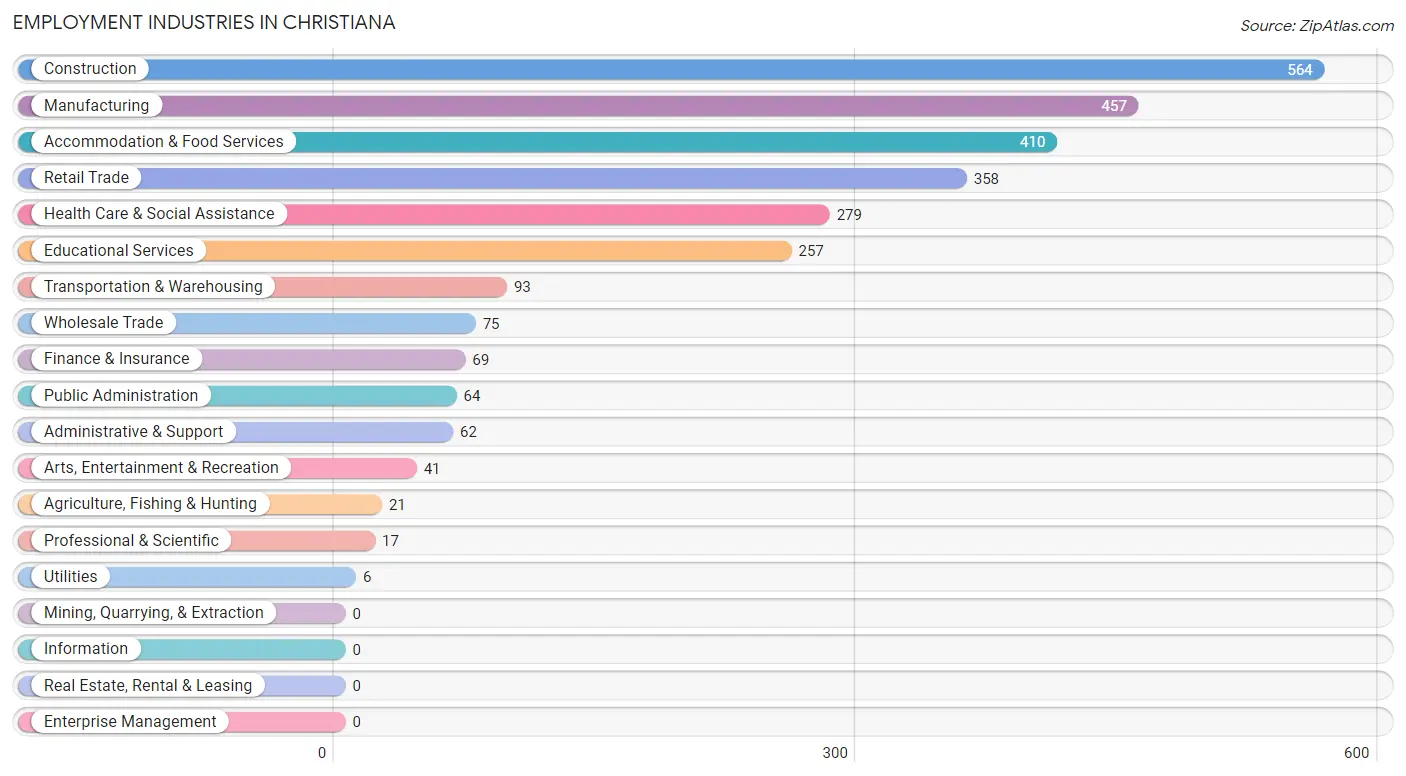
Employment Industries in Christiana
The major employment industries in Christiana include Construction (564 | 19.9%), Manufacturing (457 | 16.2%), Accommodation & Food Services (410 | 14.5%), Retail Trade (358 | 12.7%), and Health Care & Social Assistance (279 | 9.9%).
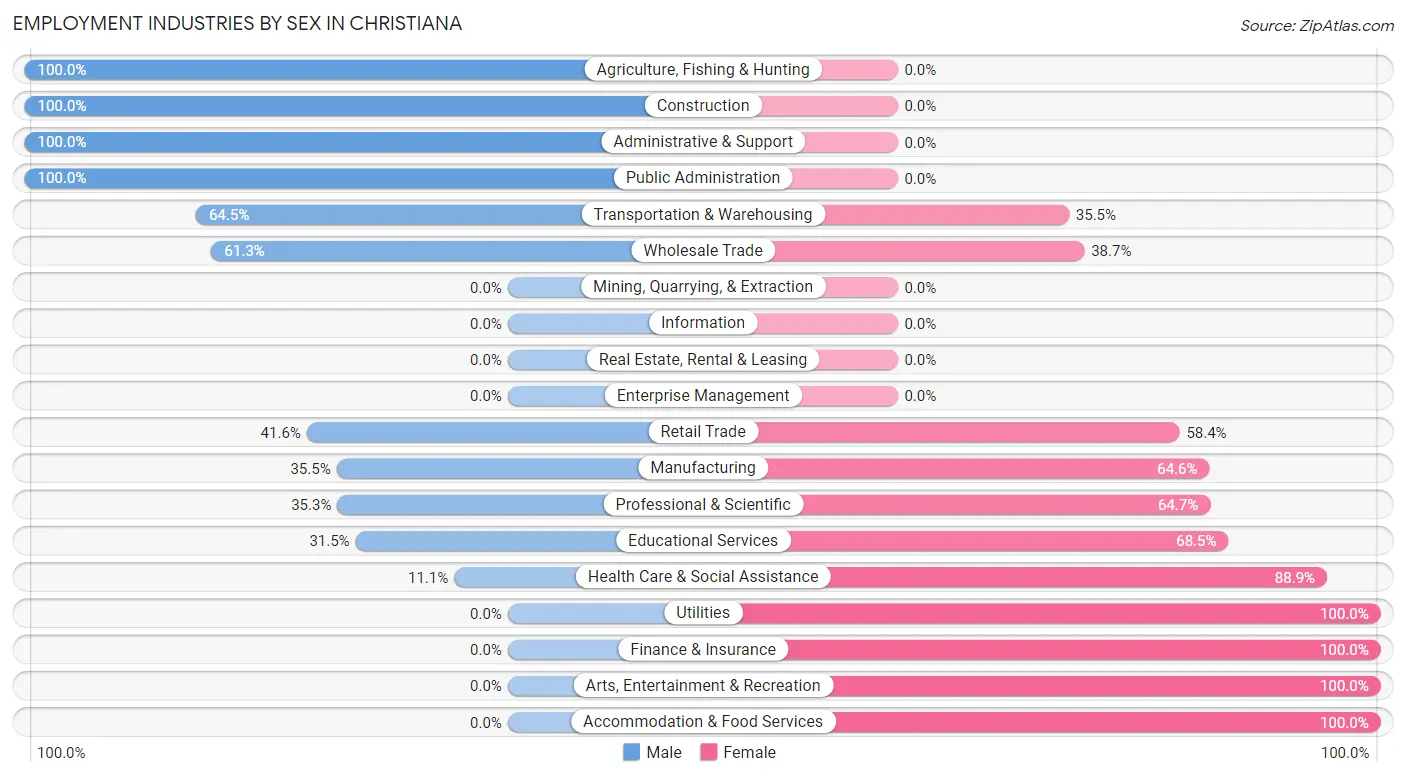
Employment Industries by Sex in Christiana
The Christiana industries that see more men than women are Agriculture, Fishing & Hunting (100.0%), Construction (100.0%), and Administrative & Support (100.0%), whereas the industries that tend to have a higher number of women are Utilities (100.0%), Finance & Insurance (100.0%), and Arts, Entertainment & Recreation (100.0%).
| Industry | Male | Female |
| Agriculture, Fishing & Hunting | 21 (100.0%) | 0 (0.0%) |
| Mining, Quarrying, & Extraction | 0 (0.0%) | 0 (0.0%) |
| Construction | 564 (100.0%) | 0 (0.0%) |
| Manufacturing | 162 (35.4%) | 295 (64.5%) |
| Wholesale Trade | 46 (61.3%) | 29 (38.7%) |
| Retail Trade | 149 (41.6%) | 209 (58.4%) |
| Transportation & Warehousing | 60 (64.5%) | 33 (35.5%) |
| Utilities | 0 (0.0%) | 6 (100.0%) |
| Information | 0 (0.0%) | 0 (0.0%) |
| Finance & Insurance | 0 (0.0%) | 69 (100.0%) |
| Real Estate, Rental & Leasing | 0 (0.0%) | 0 (0.0%) |
| Professional & Scientific | 6 (35.3%) | 11 (64.7%) |
| Enterprise Management | 0 (0.0%) | 0 (0.0%) |
| Administrative & Support | 62 (100.0%) | 0 (0.0%) |
| Educational Services | 81 (31.5%) | 176 (68.5%) |
| Health Care & Social Assistance | 31 (11.1%) | 248 (88.9%) |
| Arts, Entertainment & Recreation | 0 (0.0%) | 41 (100.0%) |
| Accommodation & Food Services | 0 (0.0%) | 410 (100.0%) |
| Public Administration | 64 (100.0%) | 0 (0.0%) |
| Total | 1,258 (44.5%) | 1,571 (55.5%) |
Education in Christiana
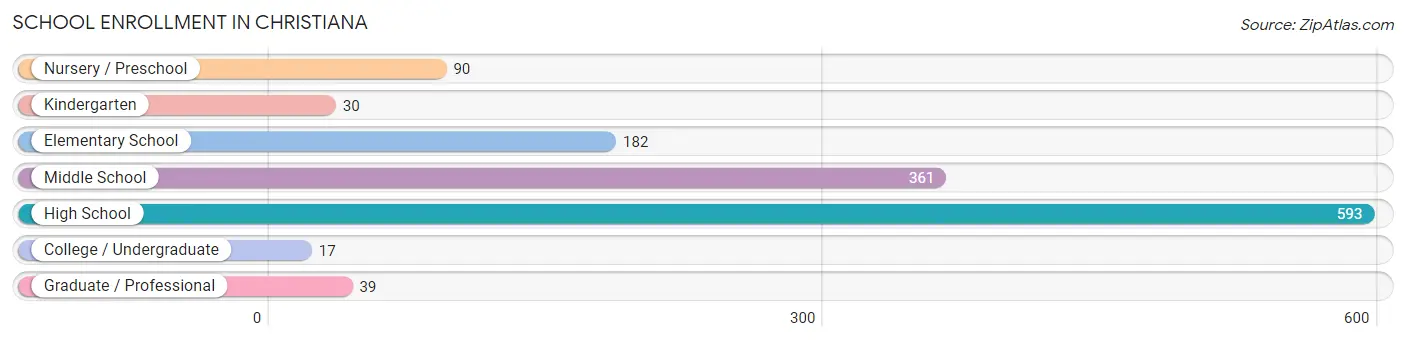
School Enrollment in Christiana
The most common levels of schooling among the 1,312 students in Christiana are high school (593 | 45.2%), middle school (361 | 27.5%), and elementary school (182 | 13.9%).
| School Level | # Students | % Students |
| Nursery / Preschool | 90 | 6.9% |
| Kindergarten | 30 | 2.3% |
| Elementary School | 182 | 13.9% |
| Middle School | 361 | 27.5% |
| High School | 593 | 45.2% |
| College / Undergraduate | 17 | 1.3% |
| Graduate / Professional | 39 | 3.0% |
| Total | 1,312 | 100.0% |
School Enrollment by Age by Funding Source in Christiana
Out of a total of 1,312 students who are enrolled in schools in Christiana, 232 (17.7%) attend a private institution, while the remaining 1,080 (82.3%) are enrolled in public schools. The age group of 3 to 4 year olds has the highest likelihood of being enrolled in private schools, with 32 (47.1% in the age bracket) enrolled. Conversely, the age group of 20 to 24 year olds has the lowest likelihood of being enrolled in a private school, with 14 (100.0% in the age bracket) attending a public institution.
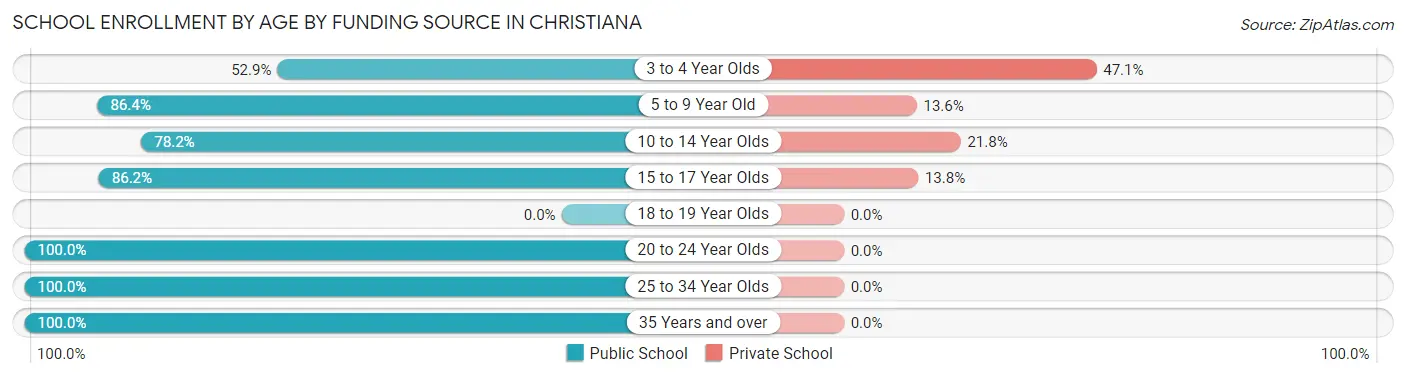
| Age Bracket | Public School | Private School |
| 3 to 4 Year Olds | 36 (52.9%) | 32 (47.1%) |
| 5 to 9 Year Old | 140 (86.4%) | 22 (13.6%) |
| 10 to 14 Year Olds | 356 (78.2%) | 99 (21.8%) |
| 15 to 17 Year Olds | 492 (86.2%) | 79 (13.8%) |
| 18 to 19 Year Olds | 0 (0.0%) | 0 (0.0%) |
| 20 to 24 Year Olds | 14 (100.0%) | 0 (0.0%) |
| 25 to 34 Year Olds | 25 (100.0%) | 0 (0.0%) |
| 35 Years and over | 17 (100.0%) | 0 (0.0%) |
| Total | 1,080 (82.3%) | 232 (17.7%) |
Educational Attainment by Field of Study in Christiana
Business (191 | 17.3%), arts & humanities (183 | 16.6%), education (178 | 16.1%), science & technology (115 | 10.4%), and computers & mathematics (102 | 9.2%) are the most common fields of study among 1,106 individuals in Christiana who have obtained a bachelor's degree or higher.
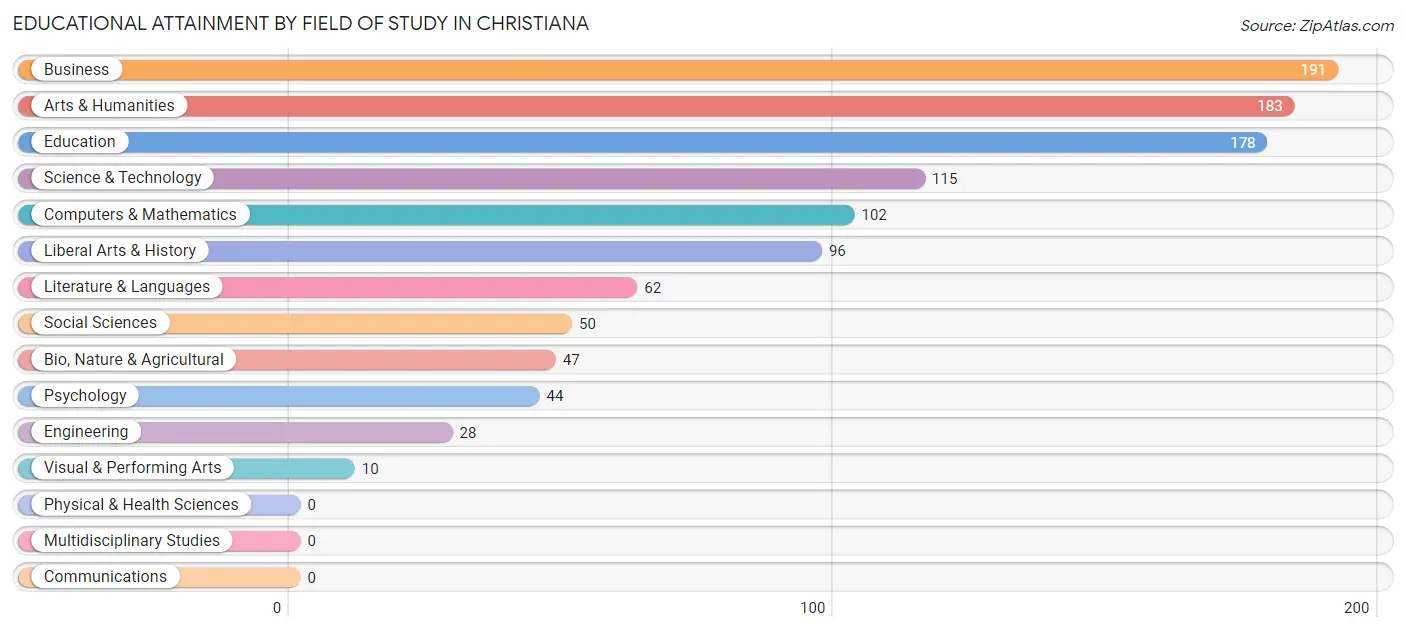
| Field of Study | # Graduates | % Graduates |
| Computers & Mathematics | 102 | 9.2% |
| Bio, Nature & Agricultural | 47 | 4.3% |
| Physical & Health Sciences | 0 | 0.0% |
| Psychology | 44 | 4.0% |
| Social Sciences | 50 | 4.5% |
| Engineering | 28 | 2.5% |
| Multidisciplinary Studies | 0 | 0.0% |
| Science & Technology | 115 | 10.4% |
| Business | 191 | 17.3% |
| Education | 178 | 16.1% |
| Literature & Languages | 62 | 5.6% |
| Liberal Arts & History | 96 | 8.7% |
| Visual & Performing Arts | 10 | 0.9% |
| Communications | 0 | 0.0% |
| Arts & Humanities | 183 | 16.6% |
| Total | 1,106 | 100.0% |
Transportation & Commute in Christiana
Vehicle Availability by Sex in Christiana
The most prevalent vehicle ownership categories in Christiana are males with 4 vehicles (437, accounting for 34.7%) and females with 4 vehicles (666, making up 30.2%).
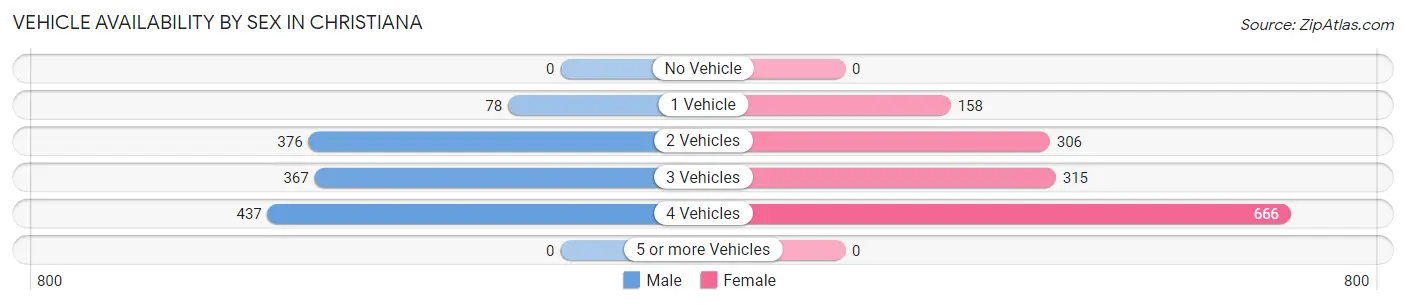
| Vehicles Available | Male | Female |
| No Vehicle | 0 (0.0%) | 0 (0.0%) |
| 1 Vehicle | 78 (6.2%) | 158 (10.9%) |
| 2 Vehicles | 376 (29.9%) | 306 (21.2%) |
| 3 Vehicles | 367 (29.2%) | 315 (21.8%) |
| 4 Vehicles | 437 (34.7%) | 666 (46.1%) |
| 5 or more Vehicles | 0 (0.0%) | 0 (0.0%) |
| Total | 1,258 (100.0%) | 1,445 (100.0%) |
Commute Time in Christiana
The most frequently occuring commute durations in Christiana are 15 to 19 minutes (818 commuters, 30.9%), 20 to 24 minutes (437 commuters, 16.5%), and 25 to 29 minutes (361 commuters, 13.6%).
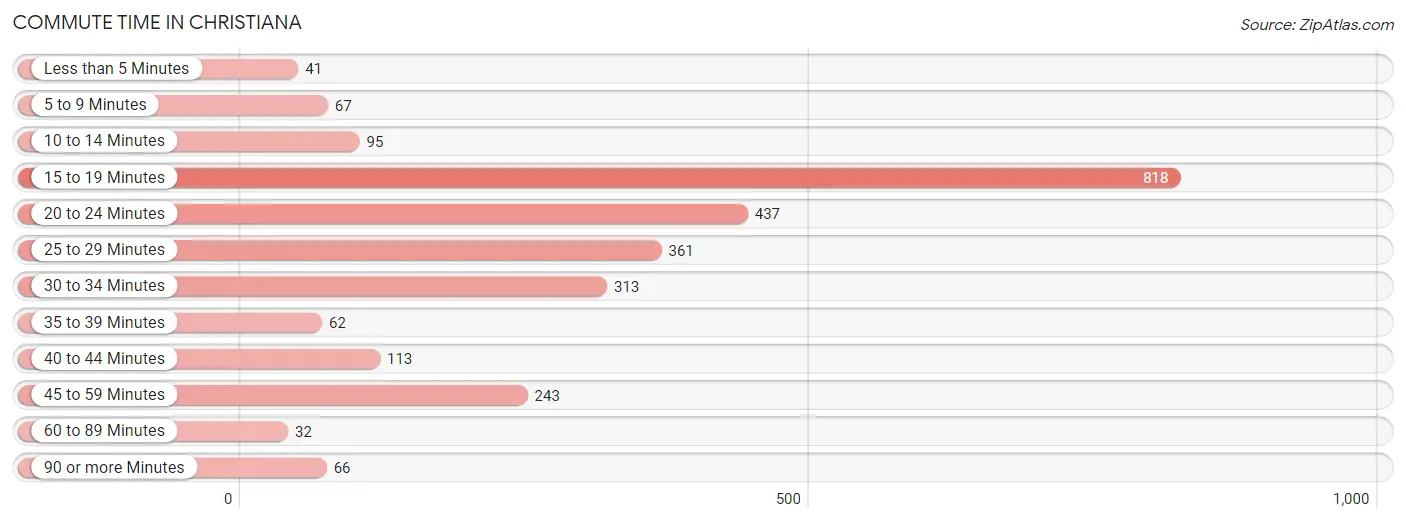
| Commute Time | # Commuters | % Commuters |
| Less than 5 Minutes | 41 | 1.5% |
| 5 to 9 Minutes | 67 | 2.5% |
| 10 to 14 Minutes | 95 | 3.6% |
| 15 to 19 Minutes | 818 | 30.9% |
| 20 to 24 Minutes | 437 | 16.5% |
| 25 to 29 Minutes | 361 | 13.6% |
| 30 to 34 Minutes | 313 | 11.8% |
| 35 to 39 Minutes | 62 | 2.3% |
| 40 to 44 Minutes | 113 | 4.3% |
| 45 to 59 Minutes | 243 | 9.2% |
| 60 to 89 Minutes | 32 | 1.2% |
| 90 or more Minutes | 66 | 2.5% |
Commute Time by Sex in Christiana
The most common commute times in Christiana are 15 to 19 minutes (449 commuters, 35.9%) for males and 15 to 19 minutes (369 commuters, 26.4%) for females.
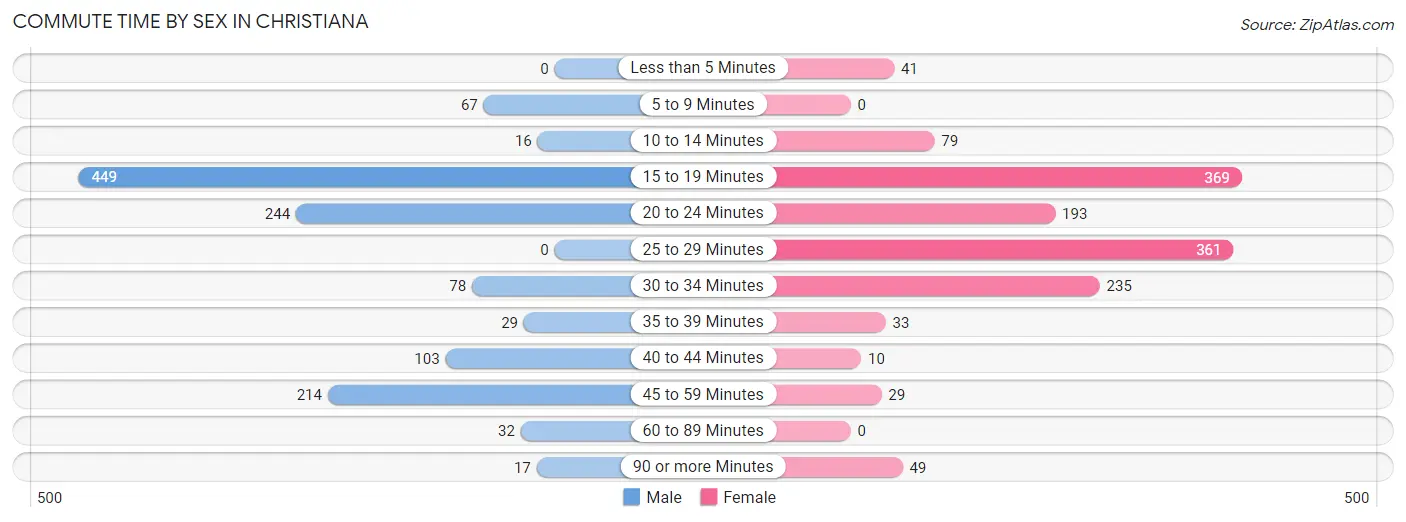
| Commute Time | Male | Female |
| Less than 5 Minutes | 0 (0.0%) | 41 (2.9%) |
| 5 to 9 Minutes | 67 (5.4%) | 0 (0.0%) |
| 10 to 14 Minutes | 16 (1.3%) | 79 (5.7%) |
| 15 to 19 Minutes | 449 (35.9%) | 369 (26.4%) |
| 20 to 24 Minutes | 244 (19.5%) | 193 (13.8%) |
| 25 to 29 Minutes | 0 (0.0%) | 361 (25.8%) |
| 30 to 34 Minutes | 78 (6.2%) | 235 (16.8%) |
| 35 to 39 Minutes | 29 (2.3%) | 33 (2.4%) |
| 40 to 44 Minutes | 103 (8.3%) | 10 (0.7%) |
| 45 to 59 Minutes | 214 (17.1%) | 29 (2.1%) |
| 60 to 89 Minutes | 32 (2.6%) | 0 (0.0%) |
| 90 or more Minutes | 17 (1.4%) | 49 (3.5%) |
Time of Departure to Work by Sex in Christiana
The most frequent times of departure to work in Christiana are 5:00 AM to 5:29 AM (391, 31.3%) for males and 4:00 PM to 11:59 PM (681, 48.7%) for females.
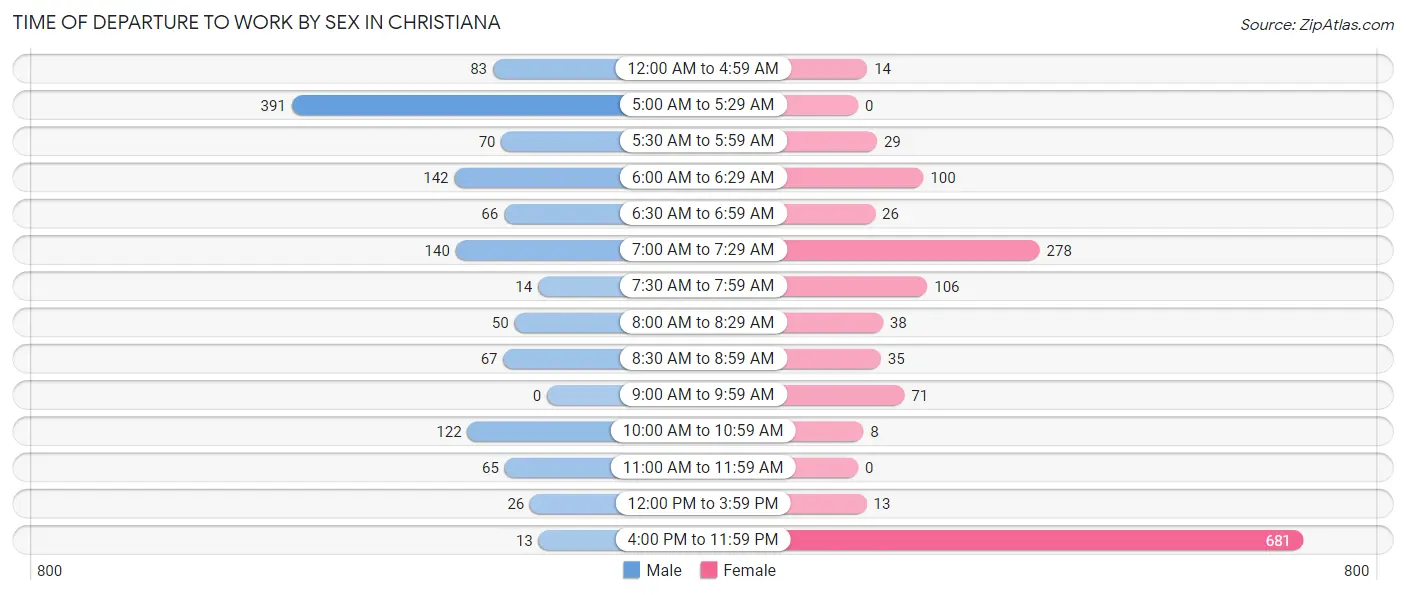
| Time of Departure | Male | Female |
| 12:00 AM to 4:59 AM | 83 (6.7%) | 14 (1.0%) |
| 5:00 AM to 5:29 AM | 391 (31.3%) | 0 (0.0%) |
| 5:30 AM to 5:59 AM | 70 (5.6%) | 29 (2.1%) |
| 6:00 AM to 6:29 AM | 142 (11.4%) | 100 (7.1%) |
| 6:30 AM to 6:59 AM | 66 (5.3%) | 26 (1.9%) |
| 7:00 AM to 7:29 AM | 140 (11.2%) | 278 (19.9%) |
| 7:30 AM to 7:59 AM | 14 (1.1%) | 106 (7.6%) |
| 8:00 AM to 8:29 AM | 50 (4.0%) | 38 (2.7%) |
| 8:30 AM to 8:59 AM | 67 (5.4%) | 35 (2.5%) |
| 9:00 AM to 9:59 AM | 0 (0.0%) | 71 (5.1%) |
| 10:00 AM to 10:59 AM | 122 (9.8%) | 8 (0.6%) |
| 11:00 AM to 11:59 AM | 65 (5.2%) | 0 (0.0%) |
| 12:00 PM to 3:59 PM | 26 (2.1%) | 13 (0.9%) |
| 4:00 PM to 11:59 PM | 13 (1.0%) | 681 (48.7%) |
| Total | 1,249 (100.0%) | 1,399 (100.0%) |
Housing Occupancy in Christiana
Occupancy by Ownership in Christiana
Of the total 1,786 dwellings in Christiana, owner-occupied units account for 1,625 (91.0%), while renter-occupied units make up 161 (9.0%).
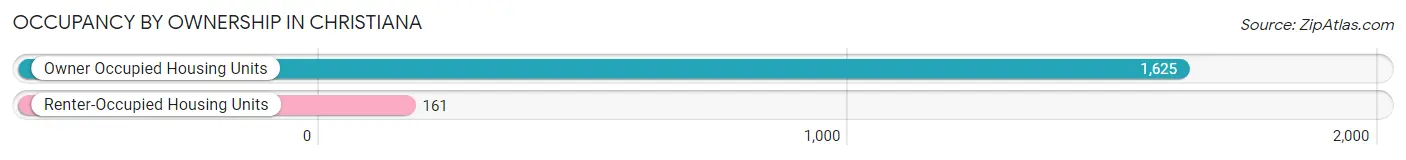
| Occupancy | # Housing Units | % Housing Units |
| Owner Occupied Housing Units | 1,625 | 91.0% |
| Renter-Occupied Housing Units | 161 | 9.0% |
| Total Occupied Housing Units | 1,786 | 100.0% |
Occupancy by Household Size in Christiana
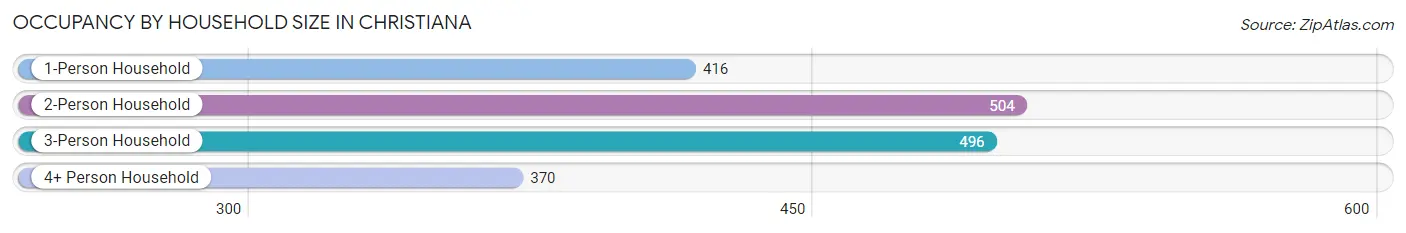
| Household Size | # Housing Units | % Housing Units |
| 1-Person Household | 416 | 23.3% |
| 2-Person Household | 504 | 28.2% |
| 3-Person Household | 496 | 27.8% |
| 4+ Person Household | 370 | 20.7% |
| Total Housing Units | 1,786 | 100.0% |
Occupancy by Ownership by Household Size in Christiana
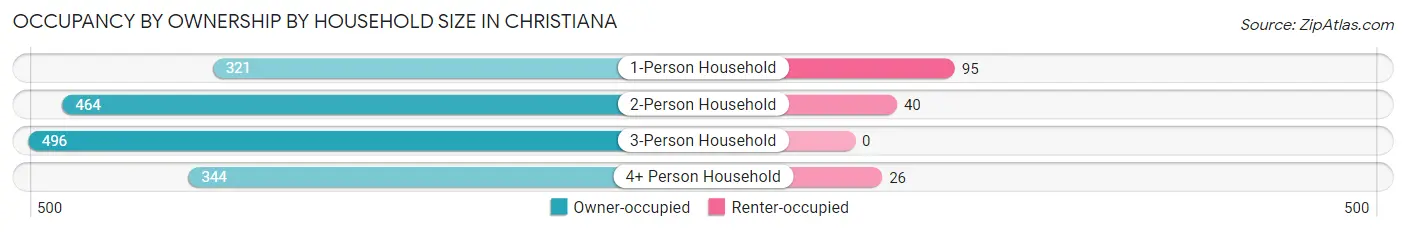
| Household Size | Owner-occupied | Renter-occupied |
| 1-Person Household | 321 (77.2%) | 95 (22.8%) |
| 2-Person Household | 464 (92.1%) | 40 (7.9%) |
| 3-Person Household | 496 (100.0%) | 0 (0.0%) |
| 4+ Person Household | 344 (93.0%) | 26 (7.0%) |
| Total Housing Units | 1,625 (91.0%) | 161 (9.0%) |
Occupancy by Educational Attainment in Christiana
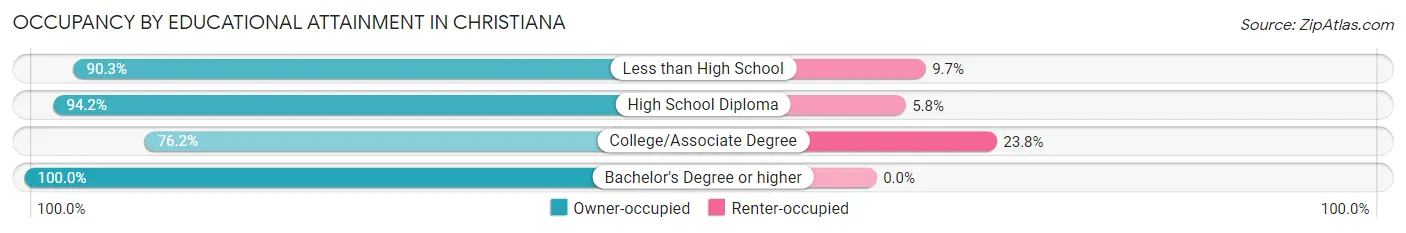
| Household Size | Owner-occupied | Renter-occupied |
| Less than High School | 130 (90.3%) | 14 (9.7%) |
| High School Diploma | 654 (94.2%) | 40 (5.8%) |
| College/Associate Degree | 342 (76.2%) | 107 (23.8%) |
| Bachelor's Degree or higher | 499 (100.0%) | 0 (0.0%) |
Occupancy by Age of Householder in Christiana
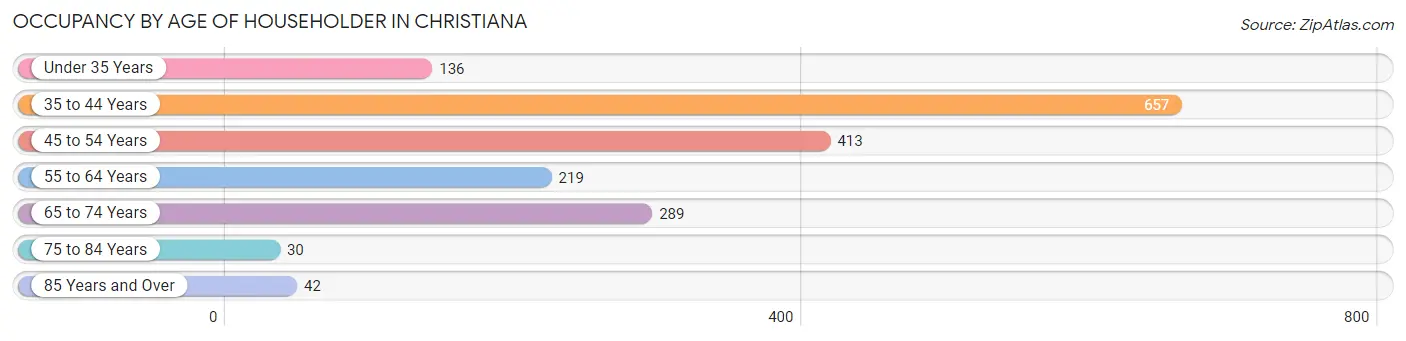
| Age Bracket | # Households | % Households |
| Under 35 Years | 136 | 7.6% |
| 35 to 44 Years | 657 | 36.8% |
| 45 to 54 Years | 413 | 23.1% |
| 55 to 64 Years | 219 | 12.3% |
| 65 to 74 Years | 289 | 16.2% |
| 75 to 84 Years | 30 | 1.7% |
| 85 Years and Over | 42 | 2.4% |
| Total | 1,786 | 100.0% |
Housing Finances in Christiana
Median Income by Occupancy in Christiana
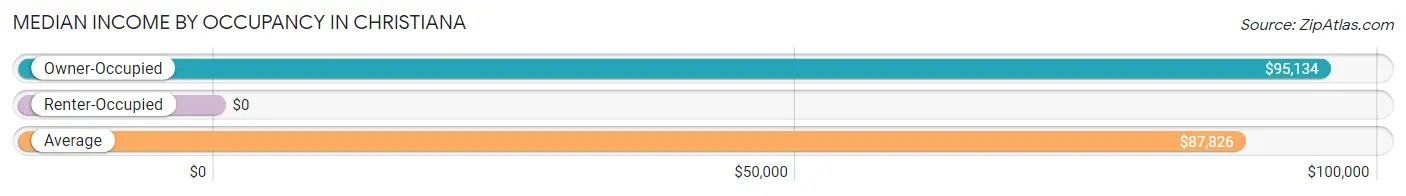
| Occupancy Type | # Households | Median Income |
| Owner-Occupied | 1,625 (91.0%) | $95,134 |
| Renter-Occupied | 161 (9.0%) | $0 |
| Average | 1,786 (100.0%) | $87,826 |
Occupancy by Householder Income Bracket in Christiana
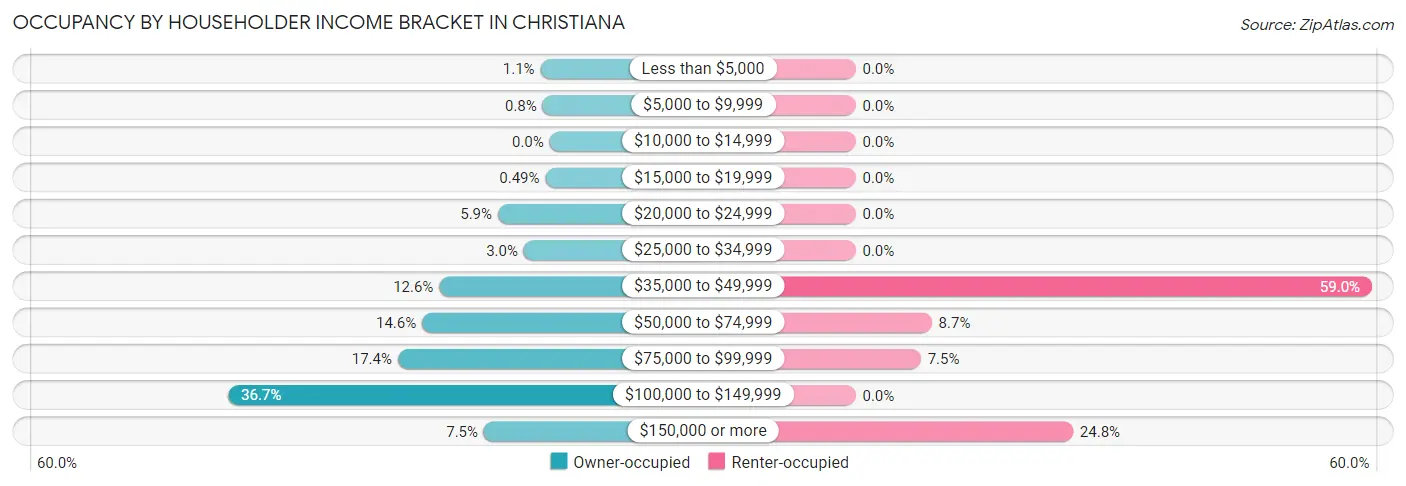
| Income Bracket | Owner-occupied | Renter-occupied |
| Less than $5,000 | 17 (1.1%) | 0 (0.0%) |
| $5,000 to $9,999 | 13 (0.8%) | 0 (0.0%) |
| $10,000 to $14,999 | 0 (0.0%) | 0 (0.0%) |
| $15,000 to $19,999 | 8 (0.5%) | 0 (0.0%) |
| $20,000 to $24,999 | 96 (5.9%) | 0 (0.0%) |
| $25,000 to $34,999 | 48 (2.9%) | 0 (0.0%) |
| $35,000 to $49,999 | 205 (12.6%) | 95 (59.0%) |
| $50,000 to $74,999 | 237 (14.6%) | 14 (8.7%) |
| $75,000 to $99,999 | 282 (17.3%) | 12 (7.4%) |
| $100,000 to $149,999 | 597 (36.7%) | 0 (0.0%) |
| $150,000 or more | 122 (7.5%) | 40 (24.8%) |
| Total | 1,625 (100.0%) | 161 (100.0%) |
Monthly Housing Cost Tiers in Christiana
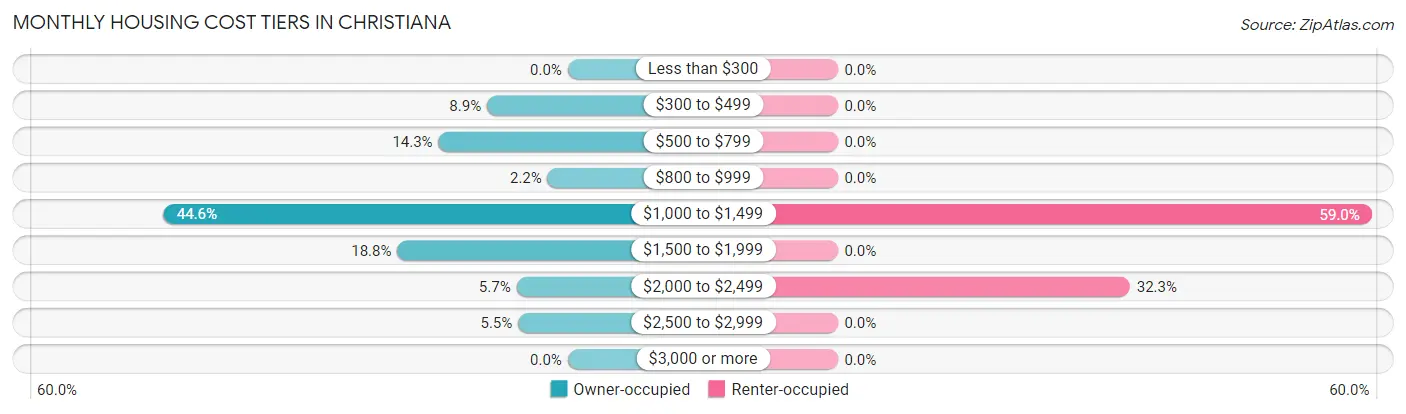
| Monthly Cost | Owner-occupied | Renter-occupied |
| Less than $300 | 0 (0.0%) | 0 (0.0%) |
| $300 to $499 | 145 (8.9%) | 0 (0.0%) |
| $500 to $799 | 232 (14.3%) | 0 (0.0%) |
| $800 to $999 | 36 (2.2%) | 0 (0.0%) |
| $1,000 to $1,499 | 725 (44.6%) | 95 (59.0%) |
| $1,500 to $1,999 | 306 (18.8%) | 0 (0.0%) |
| $2,000 to $2,499 | 92 (5.7%) | 52 (32.3%) |
| $2,500 to $2,999 | 89 (5.5%) | 0 (0.0%) |
| $3,000 or more | 0 (0.0%) | 0 (0.0%) |
| Total | 1,625 (100.0%) | 161 (100.0%) |
Physical Housing Characteristics in Christiana
Housing Structures in Christiana
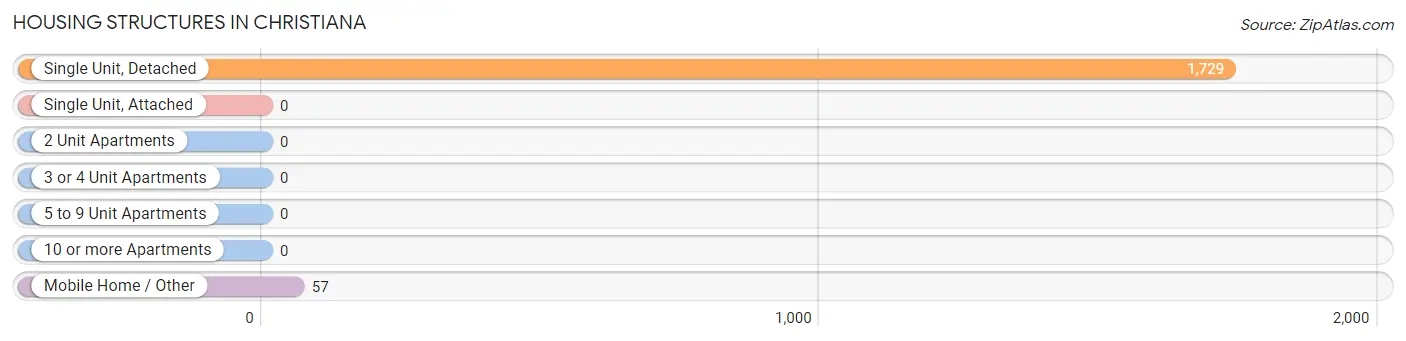
| Structure Type | # Housing Units | % Housing Units |
| Single Unit, Detached | 1,729 | 96.8% |
| Single Unit, Attached | 0 | 0.0% |
| 2 Unit Apartments | 0 | 0.0% |
| 3 or 4 Unit Apartments | 0 | 0.0% |
| 5 to 9 Unit Apartments | 0 | 0.0% |
| 10 or more Apartments | 0 | 0.0% |
| Mobile Home / Other | 57 | 3.2% |
| Total | 1,786 | 100.0% |
Housing Structures by Occupancy in Christiana
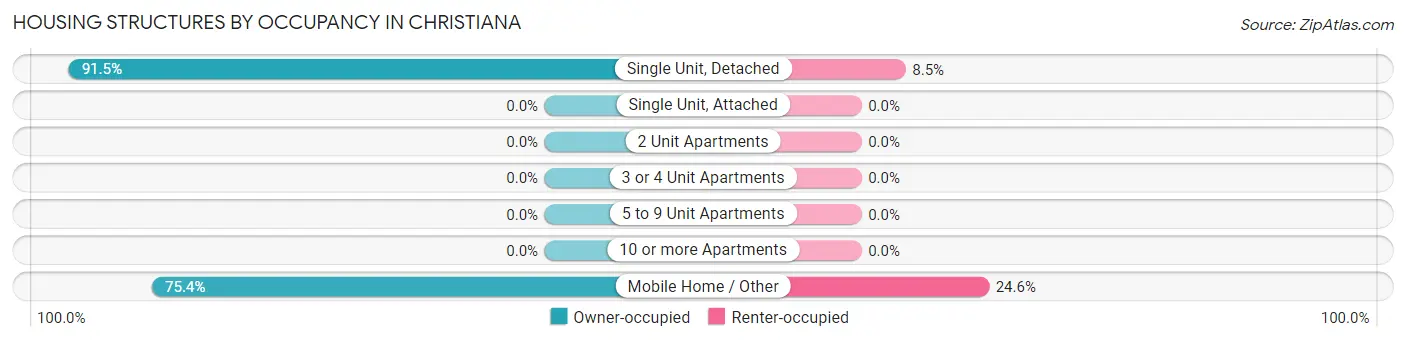
| Structure Type | Owner-occupied | Renter-occupied |
| Single Unit, Detached | 1,582 (91.5%) | 147 (8.5%) |
| Single Unit, Attached | 0 (0.0%) | 0 (0.0%) |
| 2 Unit Apartments | 0 (0.0%) | 0 (0.0%) |
| 3 or 4 Unit Apartments | 0 (0.0%) | 0 (0.0%) |
| 5 to 9 Unit Apartments | 0 (0.0%) | 0 (0.0%) |
| 10 or more Apartments | 0 (0.0%) | 0 (0.0%) |
| Mobile Home / Other | 43 (75.4%) | 14 (24.6%) |
| Total | 1,625 (91.0%) | 161 (9.0%) |
Housing Structures by Number of Rooms in Christiana
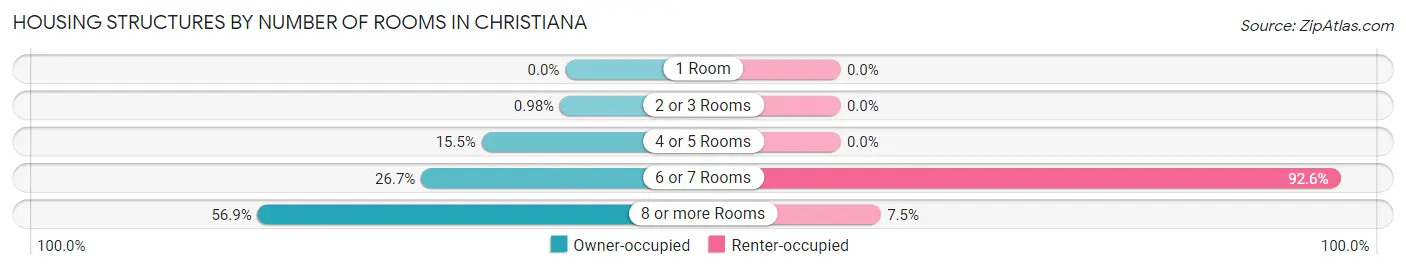
| Number of Rooms | Owner-occupied | Renter-occupied |
| 1 Room | 0 (0.0%) | 0 (0.0%) |
| 2 or 3 Rooms | 16 (1.0%) | 0 (0.0%) |
| 4 or 5 Rooms | 251 (15.4%) | 0 (0.0%) |
| 6 or 7 Rooms | 433 (26.7%) | 149 (92.5%) |
| 8 or more Rooms | 925 (56.9%) | 12 (7.4%) |
| Total | 1,625 (100.0%) | 161 (100.0%) |
Housing Structure by Heating Type in Christiana
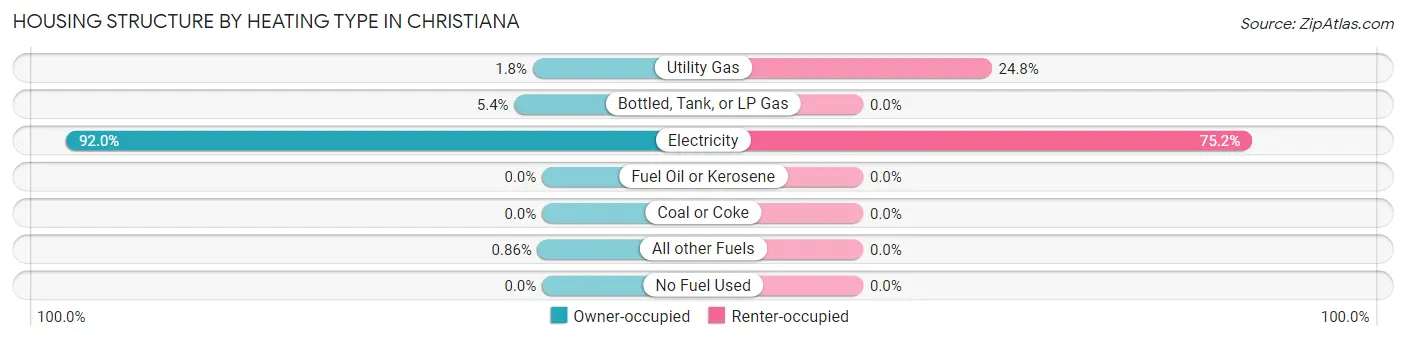
| Heating Type | Owner-occupied | Renter-occupied |
| Utility Gas | 29 (1.8%) | 40 (24.8%) |
| Bottled, Tank, or LP Gas | 87 (5.3%) | 0 (0.0%) |
| Electricity | 1,495 (92.0%) | 121 (75.2%) |
| Fuel Oil or Kerosene | 0 (0.0%) | 0 (0.0%) |
| Coal or Coke | 0 (0.0%) | 0 (0.0%) |
| All other Fuels | 14 (0.9%) | 0 (0.0%) |
| No Fuel Used | 0 (0.0%) | 0 (0.0%) |
| Total | 1,625 (100.0%) | 161 (100.0%) |
Household Vehicle Usage in Christiana
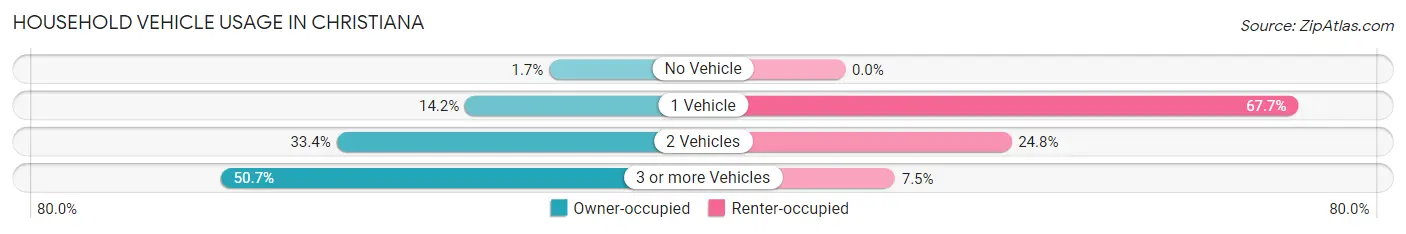
| Vehicles per Household | Owner-occupied | Renter-occupied |
| No Vehicle | 27 (1.7%) | 0 (0.0%) |
| 1 Vehicle | 231 (14.2%) | 109 (67.7%) |
| 2 Vehicles | 543 (33.4%) | 40 (24.8%) |
| 3 or more Vehicles | 824 (50.7%) | 12 (7.4%) |
| Total | 1,625 (100.0%) | 161 (100.0%) |
Real Estate & Mortgages in Christiana
Real Estate and Mortgage Overview in Christiana
| Characteristic | Without Mortgage | With Mortgage |
| Housing Units | 375 | 1,250 |
| Median Property Value | $416,800 | $294,300 |
| Median Household Income | $46,646 | $98 |
| Monthly Housing Costs | $531 | $0 |
| Real Estate Taxes | $1,875 | $324 |
Property Value by Mortgage Status in Christiana
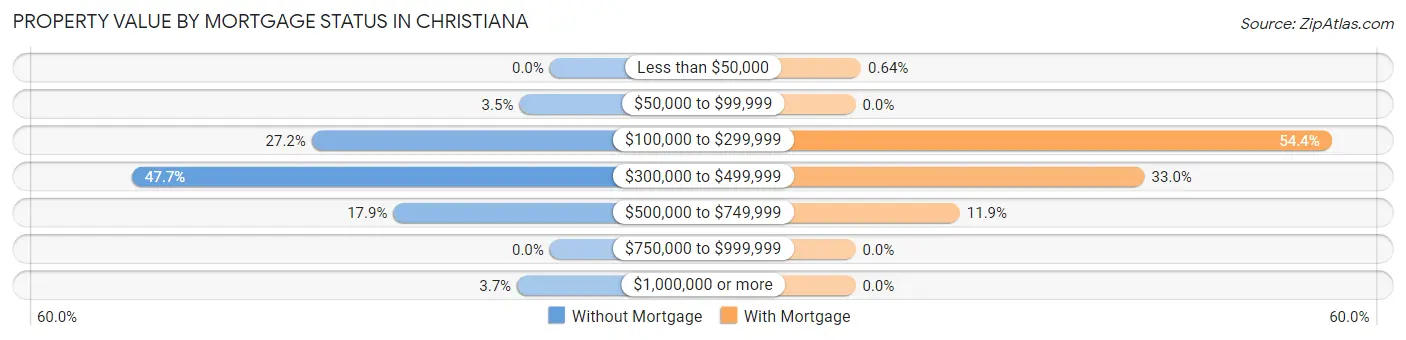
| Property Value | Without Mortgage | With Mortgage |
| Less than $50,000 | 0 (0.0%) | 8 (0.6%) |
| $50,000 to $99,999 | 13 (3.5%) | 0 (0.0%) |
| $100,000 to $299,999 | 102 (27.2%) | 680 (54.4%) |
| $300,000 to $499,999 | 179 (47.7%) | 413 (33.0%) |
| $500,000 to $749,999 | 67 (17.9%) | 149 (11.9%) |
| $750,000 to $999,999 | 0 (0.0%) | 0 (0.0%) |
| $1,000,000 or more | 14 (3.7%) | 0 (0.0%) |
| Total | 375 (100.0%) | 1,250 (100.0%) |
Household Income by Mortgage Status in Christiana
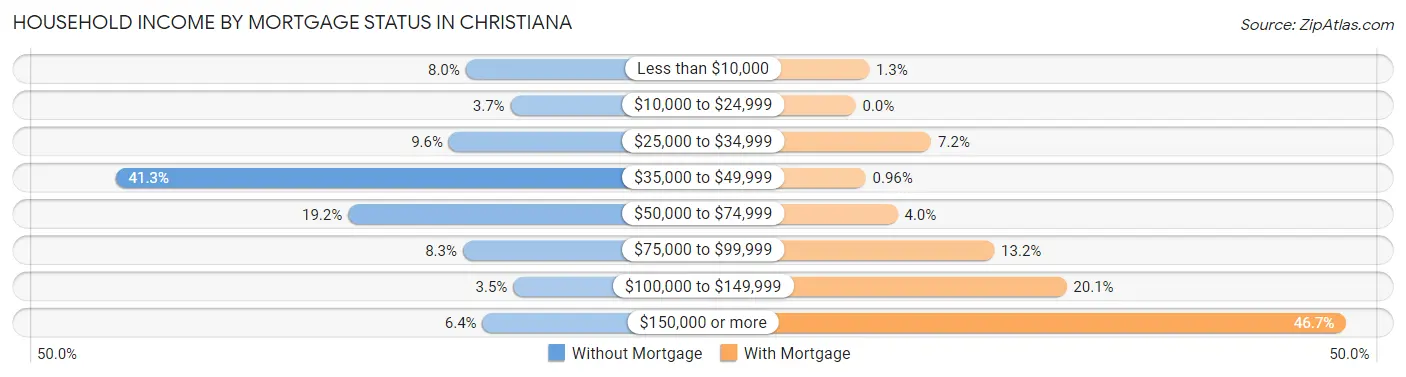
| Household Income | Without Mortgage | With Mortgage |
| Less than $10,000 | 30 (8.0%) | 16 (1.3%) |
| $10,000 to $24,999 | 14 (3.7%) | 0 (0.0%) |
| $25,000 to $34,999 | 36 (9.6%) | 90 (7.2%) |
| $35,000 to $49,999 | 155 (41.3%) | 12 (1.0%) |
| $50,000 to $74,999 | 72 (19.2%) | 50 (4.0%) |
| $75,000 to $99,999 | 31 (8.3%) | 165 (13.2%) |
| $100,000 to $149,999 | 13 (3.5%) | 251 (20.1%) |
| $150,000 or more | 24 (6.4%) | 584 (46.7%) |
| Total | 375 (100.0%) | 1,250 (100.0%) |
Property Value to Household Income Ratio in Christiana
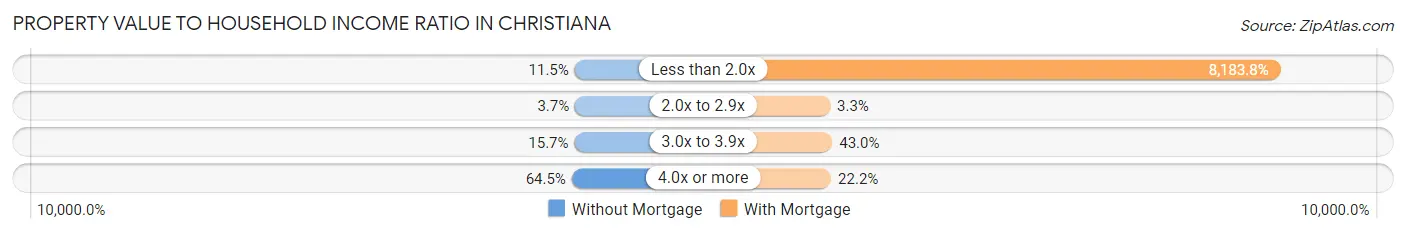
| Value-to-Income Ratio | Without Mortgage | With Mortgage |
| Less than 2.0x | 43 (11.5%) | 102,298 (8,183.8%) |
| 2.0x to 2.9x | 14 (3.7%) | 41 (3.3%) |
| 3.0x to 3.9x | 59 (15.7%) | 538 (43.0%) |
| 4.0x or more | 242 (64.5%) | 278 (22.2%) |
| Total | 375 (100.0%) | 1,250 (100.0%) |
Real Estate Taxes by Mortgage Status in Christiana
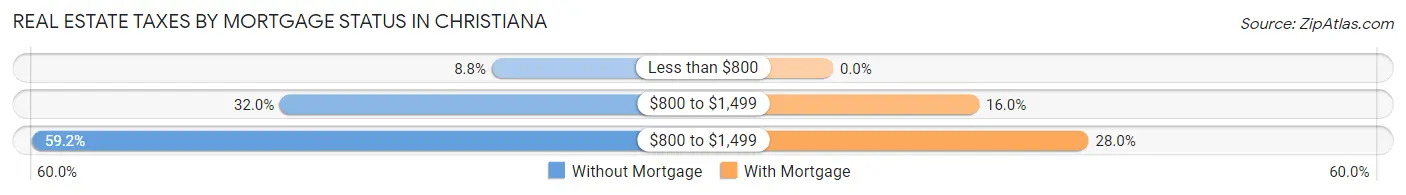
| Property Taxes | Without Mortgage | With Mortgage |
| Less than $800 | 33 (8.8%) | 0 (0.0%) |
| $800 to $1,499 | 120 (32.0%) | 200 (16.0%) |
| $800 to $1,499 | 222 (59.2%) | 350 (28.0%) |
| Total | 375 (100.0%) | 1,250 (100.0%) |
Health & Disability in Christiana
Health Insurance Coverage by Age in Christiana
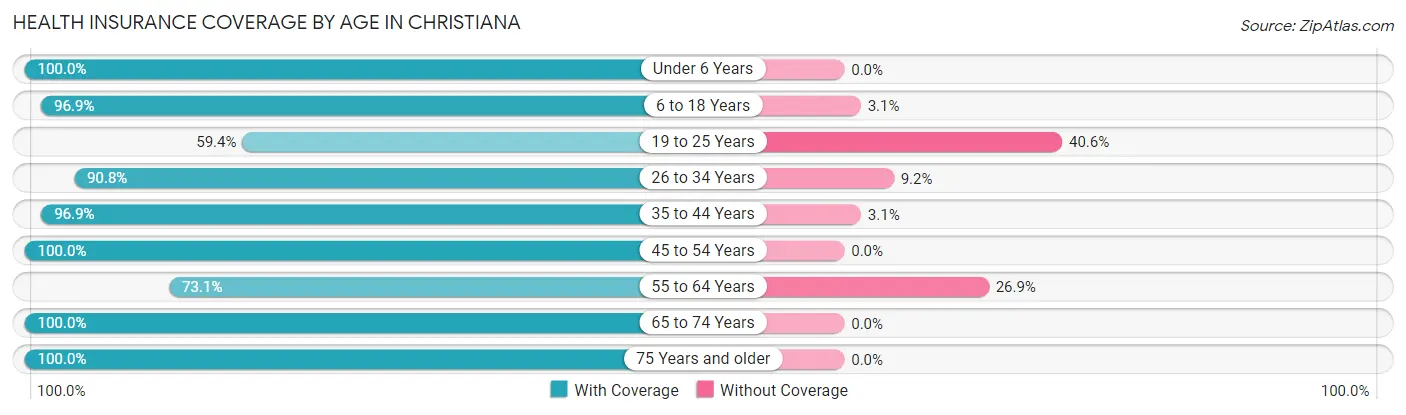
| Age Bracket | With Coverage | Without Coverage |
| Under 6 Years | 168 (100.0%) | 0 (0.0%) |
| 6 to 18 Years | 1,135 (96.9%) | 36 (3.1%) |
| 19 to 25 Years | 79 (59.4%) | 54 (40.6%) |
| 26 to 34 Years | 207 (90.8%) | 21 (9.2%) |
| 35 to 44 Years | 1,033 (96.9%) | 33 (3.1%) |
| 45 to 54 Years | 941 (100.0%) | 0 (0.0%) |
| 55 to 64 Years | 255 (73.1%) | 94 (26.9%) |
| 65 to 74 Years | 532 (100.0%) | 0 (0.0%) |
| 75 Years and older | 171 (100.0%) | 0 (0.0%) |
| Total | 4,521 (95.0%) | 238 (5.0%) |
Health Insurance Coverage by Citizenship Status in Christiana
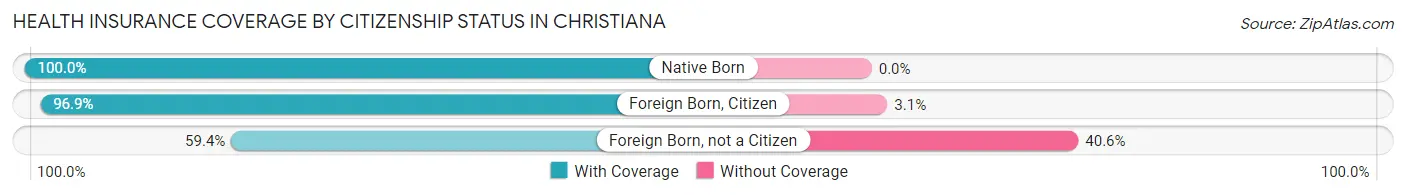
| Citizenship Status | With Coverage | Without Coverage |
| Native Born | 168 (100.0%) | 0 (0.0%) |
| Foreign Born, Citizen | 1,135 (96.9%) | 36 (3.1%) |
| Foreign Born, not a Citizen | 79 (59.4%) | 54 (40.6%) |
Health Insurance Coverage by Household Income in Christiana
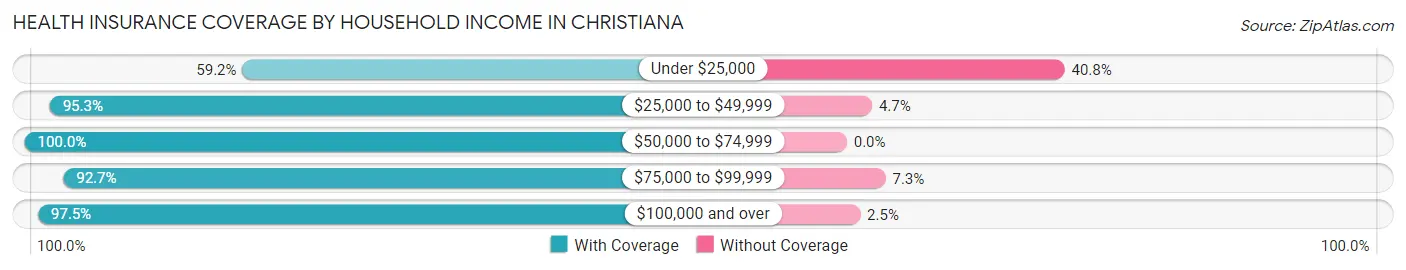
| Household Income | With Coverage | Without Coverage |
| Under $25,000 | 119 (59.2%) | 82 (40.8%) |
| $25,000 to $49,999 | 505 (95.3%) | 25 (4.7%) |
| $50,000 to $74,999 | 595 (100.0%) | 0 (0.0%) |
| $75,000 to $99,999 | 882 (92.7%) | 69 (7.3%) |
| $100,000 and over | 2,419 (97.5%) | 62 (2.5%) |
Public vs Private Health Insurance Coverage by Age in Christiana
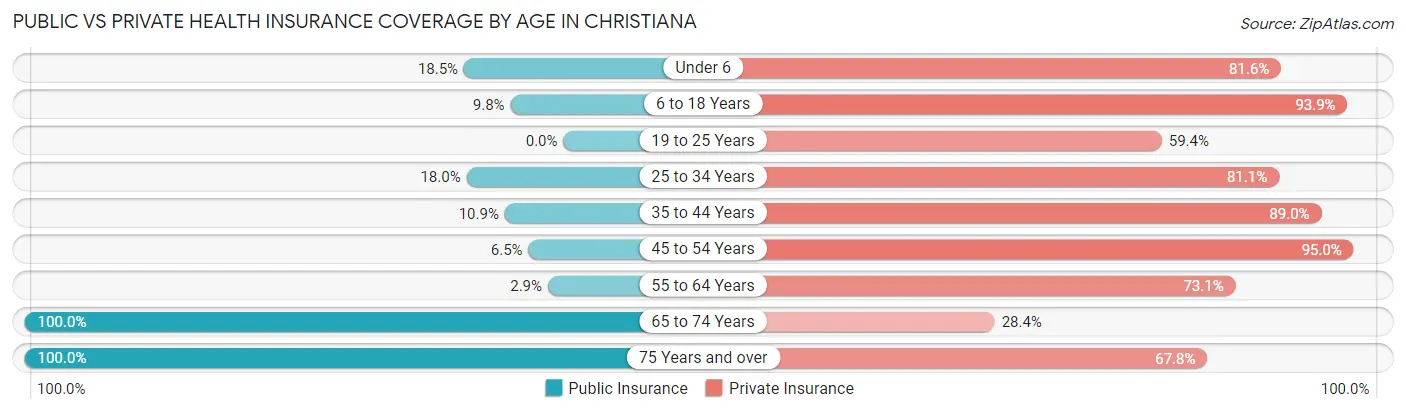
| Age Bracket | Public Insurance | Private Insurance |
| Under 6 | 31 (18.4%) | 137 (81.6%) |
| 6 to 18 Years | 115 (9.8%) | 1,099 (93.9%) |
| 19 to 25 Years | 0 (0.0%) | 79 (59.4%) |
| 25 to 34 Years | 41 (18.0%) | 185 (81.1%) |
| 35 to 44 Years | 116 (10.9%) | 949 (89.0%) |
| 45 to 54 Years | 61 (6.5%) | 894 (95.0%) |
| 55 to 64 Years | 10 (2.9%) | 255 (73.1%) |
| 65 to 74 Years | 532 (100.0%) | 151 (28.4%) |
| 75 Years and over | 171 (100.0%) | 116 (67.8%) |
| Total | 1,077 (22.6%) | 3,865 (81.2%) |
Disability Status by Sex by Age in Christiana
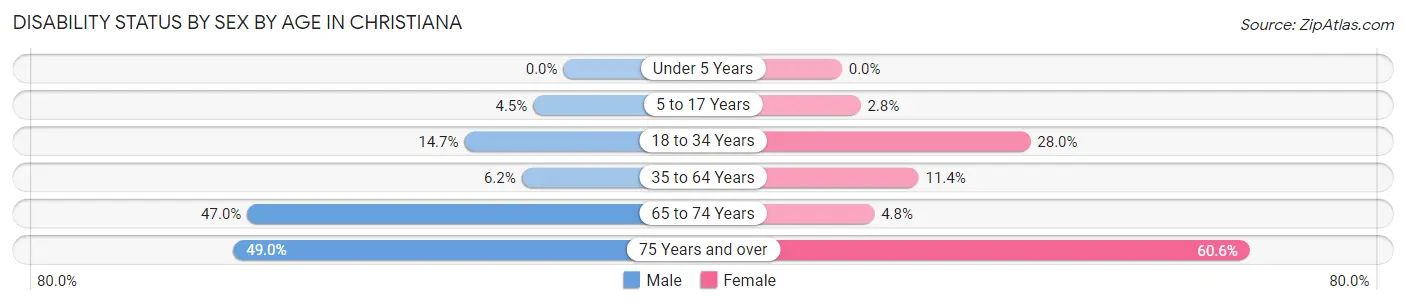
| Age Bracket | Male | Female |
| Under 5 Years | 0 (0.0%) | 0 (0.0%) |
| 5 to 17 Years | 18 (4.5%) | 22 (2.8%) |
| 18 to 34 Years | 20 (14.7%) | 63 (28.0%) |
| 35 to 64 Years | 76 (6.2%) | 129 (11.4%) |
| 65 to 74 Years | 123 (46.9%) | 13 (4.8%) |
| 75 Years and over | 49 (49.0%) | 43 (60.6%) |
Disability Class by Sex by Age in Christiana
Disability Class: Hearing Difficulty
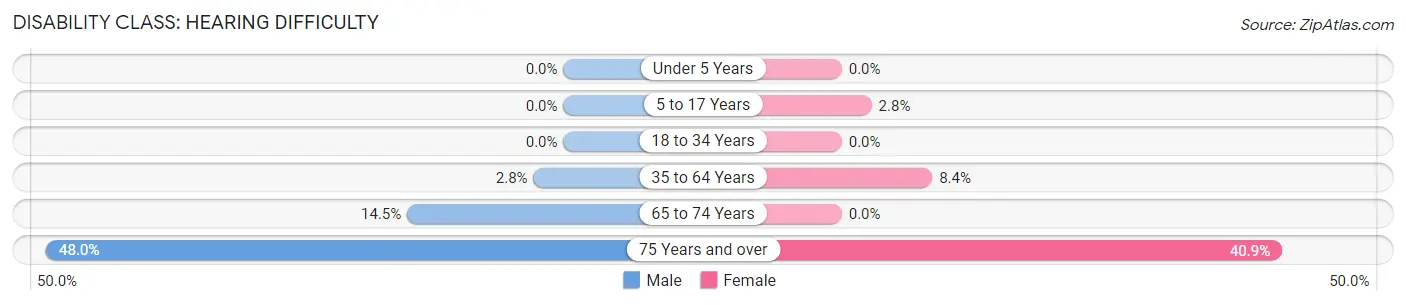
| Age Bracket | Male | Female |
| Under 5 Years | 0 (0.0%) | 0 (0.0%) |
| 5 to 17 Years | 0 (0.0%) | 22 (2.8%) |
| 18 to 34 Years | 0 (0.0%) | 0 (0.0%) |
| 35 to 64 Years | 34 (2.8%) | 95 (8.4%) |
| 65 to 74 Years | 38 (14.5%) | 0 (0.0%) |
| 75 Years and over | 48 (48.0%) | 29 (40.8%) |
Disability Class: Vision Difficulty
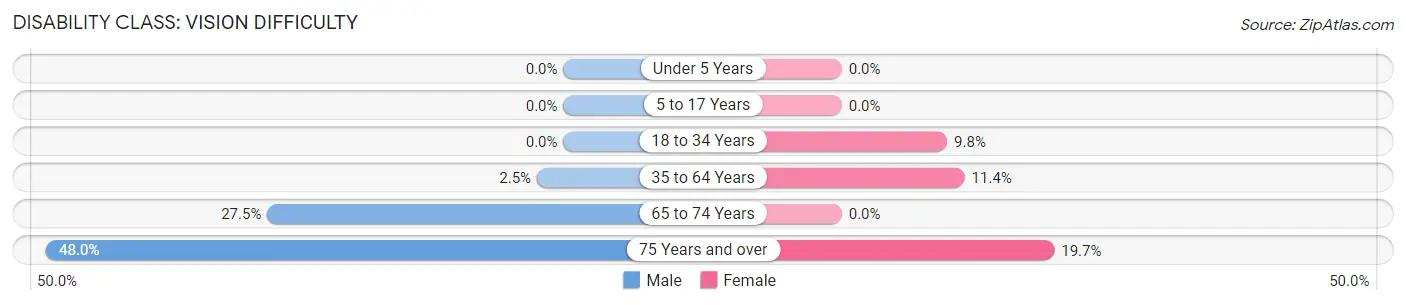
| Age Bracket | Male | Female |
| Under 5 Years | 0 (0.0%) | 0 (0.0%) |
| 5 to 17 Years | 0 (0.0%) | 0 (0.0%) |
| 18 to 34 Years | 0 (0.0%) | 22 (9.8%) |
| 35 to 64 Years | 30 (2.5%) | 129 (11.4%) |
| 65 to 74 Years | 72 (27.5%) | 0 (0.0%) |
| 75 Years and over | 48 (48.0%) | 14 (19.7%) |
Disability Class: Cognitive Difficulty
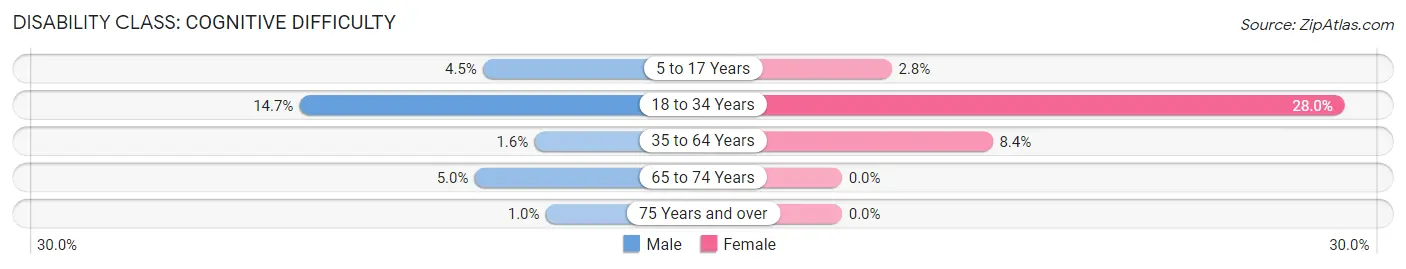
| Age Bracket | Male | Female |
| 5 to 17 Years | 18 (4.5%) | 22 (2.8%) |
| 18 to 34 Years | 20 (14.7%) | 63 (28.0%) |
| 35 to 64 Years | 20 (1.6%) | 95 (8.4%) |
| 65 to 74 Years | 13 (5.0%) | 0 (0.0%) |
| 75 Years and over | 1 (1.0%) | 0 (0.0%) |
Disability Class: Ambulatory Difficulty
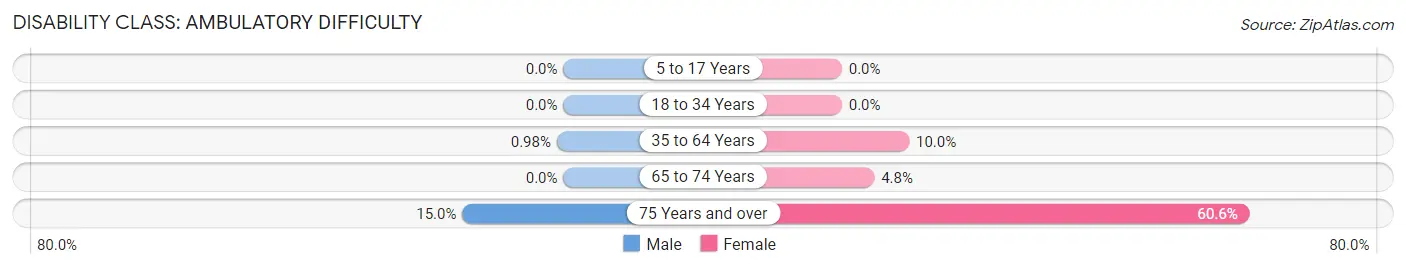
| Age Bracket | Male | Female |
| 5 to 17 Years | 0 (0.0%) | 0 (0.0%) |
| 18 to 34 Years | 0 (0.0%) | 0 (0.0%) |
| 35 to 64 Years | 12 (1.0%) | 113 (10.0%) |
| 65 to 74 Years | 0 (0.0%) | 13 (4.8%) |
| 75 Years and over | 15 (15.0%) | 43 (60.6%) |
Disability Class: Self-Care Difficulty
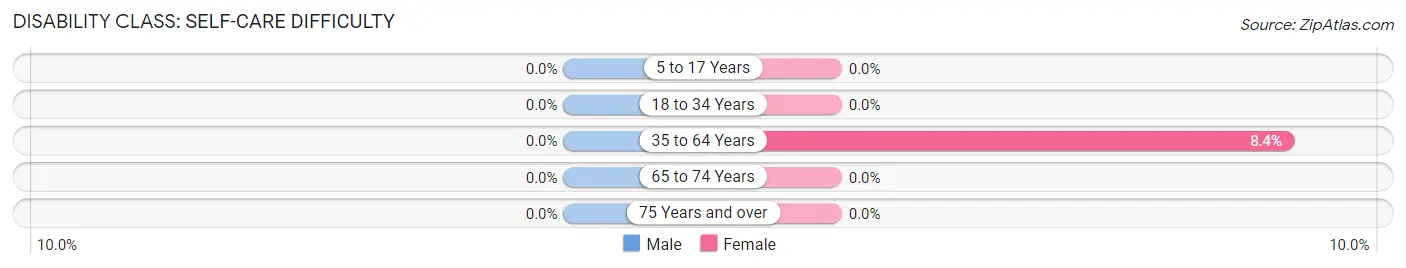
| Age Bracket | Male | Female |
| 5 to 17 Years | 0 (0.0%) | 0 (0.0%) |
| 18 to 34 Years | 0 (0.0%) | 0 (0.0%) |
| 35 to 64 Years | 0 (0.0%) | 95 (8.4%) |
| 65 to 74 Years | 0 (0.0%) | 0 (0.0%) |
| 75 Years and over | 0 (0.0%) | 0 (0.0%) |
Technology Access in Christiana
Computing Device Access in Christiana
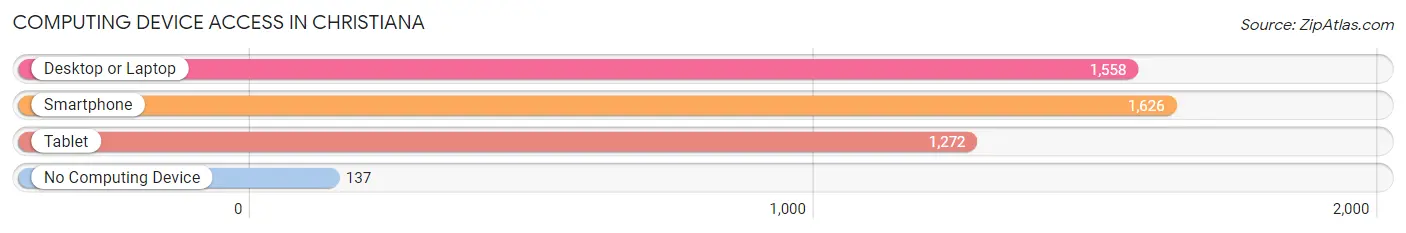
| Device Type | # Households | % Households |
| Desktop or Laptop | 1,558 | 87.2% |
| Smartphone | 1,626 | 91.0% |
| Tablet | 1,272 | 71.2% |
| No Computing Device | 137 | 7.7% |
| Total | 1,786 | 100.0% |
Internet Access in Christiana
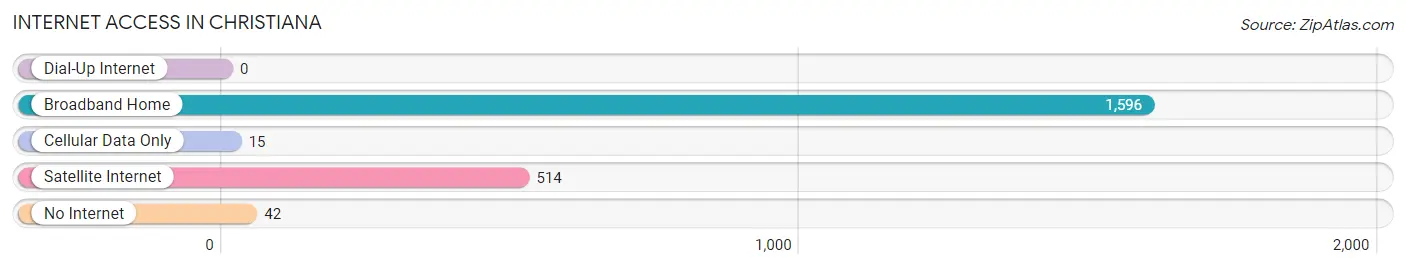
| Internet Type | # Households | % Households |
| Dial-Up Internet | 0 | 0.0% |
| Broadband Home | 1,596 | 89.4% |
| Cellular Data Only | 15 | 0.8% |
| Satellite Internet | 514 | 28.8% |
| No Internet | 42 | 2.4% |
| Total | 1,786 | 100.0% |
Christiana Summary
Christiana is a small town located in Rutherford County, Tennessee. It is situated about 25 miles southeast of Nashville and is part of the greater Nashville metropolitan area. The town has a population of approximately 1,500 people and is known for its rural charm and small-town atmosphere.
History
Christiana was founded in 1810 by a group of settlers from North Carolina. The town was named after a local creek, which was named after a local Native American chief. The town was originally a farming community, but it soon developed into a small trading center. In the late 19th century, the town was home to several mills, including a cotton mill, a grist mill, and a sawmill.
In the early 20th century, the town experienced a period of growth and development. The railroad arrived in the town in the 1920s, and the town was incorporated in 1927. The town continued to grow throughout the 20th century, and today it is a thriving community with a variety of businesses and services.
Geography
Christiana is located in the central part of Rutherford County, Tennessee. The town is situated on the banks of the Stones River, which flows through the town. The town is surrounded by rolling hills and farmland, and it is located about 25 miles southeast of Nashville.
The climate in Christiana is humid subtropical, with hot summers and mild winters. The average annual temperature is around 60 degrees Fahrenheit, and the average annual precipitation is around 45 inches.
Economy
The economy of Christiana is largely based on agriculture and manufacturing. The town is home to several farms, and the surrounding area is known for its production of corn, soybeans, and other crops. The town is also home to several manufacturing companies, including a furniture factory and a plastics factory.
In addition to agriculture and manufacturing, Christiana is home to several small businesses, including restaurants, shops, and other services. The town is also home to several churches, and it is a popular destination for tourists and outdoor enthusiasts.
Demographics
As of the 2010 census, the population of Christiana was 1,500. The racial makeup of the town was 95.3% White, 1.7% African American, 0.3% Native American, 0.7% Asian, and 1.7% from other races. The median household income was $41,250, and the median family income was $50,000.
The town is home to several churches, including Baptist, Methodist, and Presbyterian churches. The town is also home to several schools, including a public elementary school and a private Christian school.
Conclusion
Christiana is a small town located in Rutherford County, Tennessee. It is situated about 25 miles southeast of Nashville and is part of the greater Nashville metropolitan area. The town has a population of approximately 1,500 people and is known for its rural charm and small-town atmosphere. The economy of Christiana is largely based on agriculture and manufacturing, and the town is home to several small businesses, churches, and schools. The town is also a popular destination for tourists and outdoor enthusiasts.
Common Questions
What is Per Capita Income in Christiana?
Per Capita income in Christiana is $34,887.
What is the Median Family Income in Christiana?
Median Family Income in Christiana is $107,596.
What is the Median Household income in Christiana?
Median Household Income in Christiana is $87,826.
What is Income or Wage Gap in Christiana?
Income or Wage Gap in Christiana is 28.2%.
Women in Christiana earn 71.8 cents for every dollar earned by a man.
What is Inequality or Gini Index in Christiana?
Inequality or Gini Index in Christiana is 0.29.
What is the Total Population of Christiana?
Total Population of Christiana is 4,759.
What is the Total Male Population of Christiana?
Total Male Population of Christiana is 2,179.
What is the Total Female Population of Christiana?
Total Female Population of Christiana is 2,580.
What is the Ratio of Males per 100 Females in Christiana?
There are 84.46 Males per 100 Females in Christiana.
What is the Ratio of Females per 100 Males in Christiana?
There are 118.40 Females per 100 Males in Christiana.
What is the Median Population Age in Christiana?
Median Population Age in Christiana is 41.7 Years.
What is the Average Family Size in Christiana
Average Family Size in Christiana is 3.1 People.
What is the Average Household Size in Christiana
Average Household Size in Christiana is 2.7 People.
How Large is the Labor Force in Christiana?
There are 2,892 People in the Labor Forcein in Christiana.
What is the Percentage of People in the Labor Force in Christiana?
72.7% of People are in the Labor Force in Christiana.
What is the Unemployment Rate in Christiana?
Unemployment Rate in Christiana is 2.2%.