Gatlinburg, TN Map & Demographics
Gatlinburg Map
Gatlinburg Overview
$27,682
PER CAPITA INCOME
$63,295
AVG FAMILY INCOME
$50,483
AVG HOUSEHOLD INCOME
9.2%
WAGE / INCOME GAP [ % ]
90.8¢/ $1
WAGE / INCOME GAP [ $ ]
0.43
INEQUALITY / GINI INDEX
3,636
TOTAL POPULATION
1,918
MALE POPULATION
1,718
FEMALE POPULATION
111.64
MALES / 100 FEMALES
89.57
FEMALES / 100 MALES
44.2
MEDIAN AGE
3.2
AVG FAMILY SIZE
2.5
AVG HOUSEHOLD SIZE
1,762
LABOR FORCE [ PEOPLE ]
60.9%
PERCENT IN LABOR FORCE
5.0%
UNEMPLOYMENT RATE
Gatlinburg Zip Codes
Gatlinburg Area Codes
Income in Gatlinburg
Income Overview in Gatlinburg
Per Capita Income in Gatlinburg is $27,682, while median incomes of families and households are $63,295 and $50,483 respectively.
| Characteristic | Number | Measure |
| Per Capita Income | 3,636 | $27,682 |
| Median Family Income | 831 | $63,295 |
| Mean Family Income | 831 | $85,866 |
| Median Household Income | 1,383 | $50,483 |
| Mean Household Income | 1,383 | $70,095 |
| Income Deficit | 831 | $0 |
| Wage / Income Gap (%) | 3,636 | 9.23% |
| Wage / Income Gap ($) | 3,636 | 90.77¢ per $1 |
| Gini / Inequality Index | 3,636 | 0.43 |
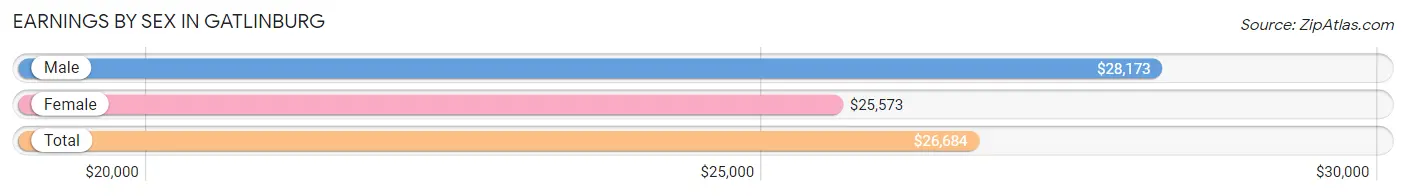
Earnings by Sex in Gatlinburg
Average Earnings in Gatlinburg are $26,684, $28,173 for men and $25,573 for women, a difference of 9.2%.
| Sex | Number | Average Earnings |
| Male | 987 (53.4%) | $28,173 |
| Female | 862 (46.6%) | $25,573 |
| Total | 1,849 (100.0%) | $26,684 |
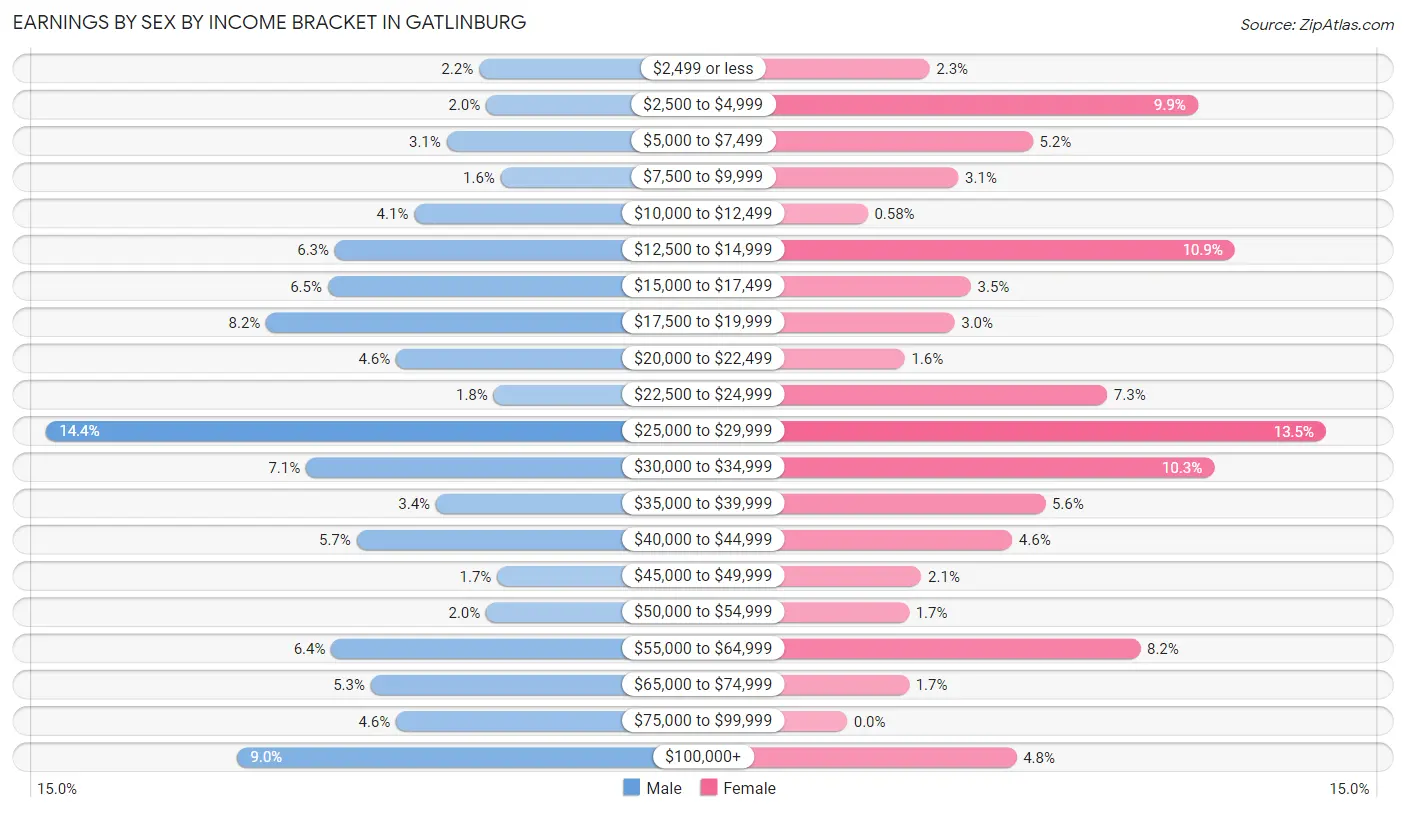
Earnings by Sex by Income Bracket in Gatlinburg
The most common earnings brackets in Gatlinburg are $25,000 to $29,999 for men (142 | 14.4%) and $25,000 to $29,999 for women (116 | 13.5%).
| Income | Male | Female |
| $2,499 or less | 22 (2.2%) | 20 (2.3%) |
| $2,500 to $4,999 | 20 (2.0%) | 85 (9.9%) |
| $5,000 to $7,499 | 31 (3.1%) | 45 (5.2%) |
| $7,500 to $9,999 | 16 (1.6%) | 27 (3.1%) |
| $10,000 to $12,499 | 40 (4.1%) | 5 (0.6%) |
| $12,500 to $14,999 | 62 (6.3%) | 94 (10.9%) |
| $15,000 to $17,499 | 64 (6.5%) | 30 (3.5%) |
| $17,500 to $19,999 | 81 (8.2%) | 26 (3.0%) |
| $20,000 to $22,499 | 45 (4.6%) | 14 (1.6%) |
| $22,500 to $24,999 | 18 (1.8%) | 63 (7.3%) |
| $25,000 to $29,999 | 142 (14.4%) | 116 (13.5%) |
| $30,000 to $34,999 | 70 (7.1%) | 89 (10.3%) |
| $35,000 to $39,999 | 34 (3.4%) | 48 (5.6%) |
| $40,000 to $44,999 | 56 (5.7%) | 40 (4.6%) |
| $45,000 to $49,999 | 17 (1.7%) | 18 (2.1%) |
| $50,000 to $54,999 | 20 (2.0%) | 15 (1.7%) |
| $55,000 to $64,999 | 63 (6.4%) | 71 (8.2%) |
| $65,000 to $74,999 | 52 (5.3%) | 15 (1.7%) |
| $75,000 to $99,999 | 45 (4.6%) | 0 (0.0%) |
| $100,000+ | 89 (9.0%) | 41 (4.8%) |
| Total | 987 (100.0%) | 862 (100.0%) |
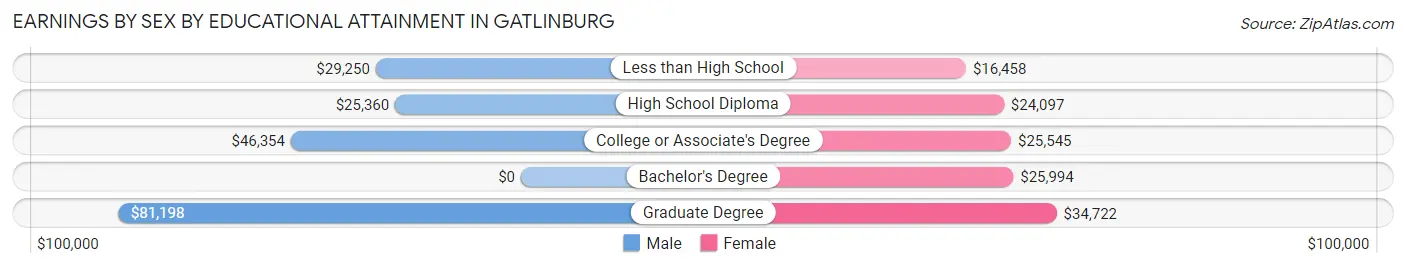
Earnings by Sex by Educational Attainment in Gatlinburg
Average earnings in Gatlinburg are $29,598 for men and $26,380 for women, a difference of 10.9%. Men with an educational attainment of graduate degree enjoy the highest average annual earnings of $81,198, while those with high school diploma education earn the least with $25,360. Women with an educational attainment of graduate degree earn the most with the average annual earnings of $34,722, while those with less than high school education have the smallest earnings of $16,458.
| Educational Attainment | Male Income | Female Income |
| Less than High School | $29,250 | $16,458 |
| High School Diploma | $25,360 | $24,097 |
| College or Associate's Degree | $46,354 | $25,545 |
| Bachelor's Degree | - | - |
| Graduate Degree | $81,198 | $34,722 |
| Total | $29,598 | $26,380 |
Family Income in Gatlinburg
Family Income Brackets in Gatlinburg
According to the Gatlinburg family income data, there are 155 families falling into the $100,000 to $149,999 income range, which is the most common income bracket and makes up 18.6% of all families. Conversely, the $10,000 to $14,999 income bracket is the least frequent group with only 5 families (0.6%) belonging to this category.
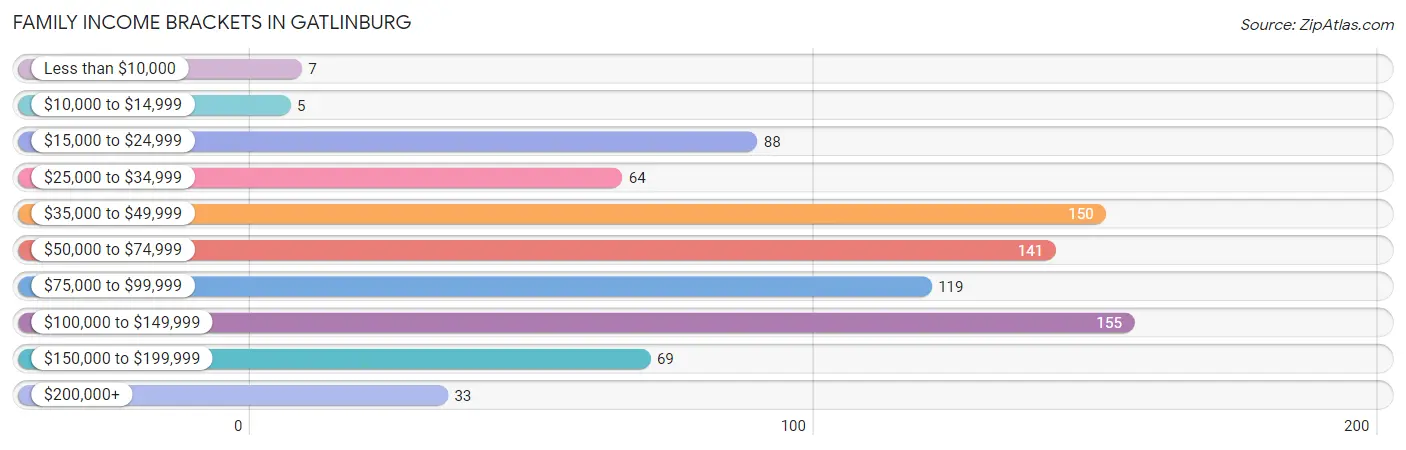
| Income Bracket | # Families | % Families |
| Less than $10,000 | 7 | 0.8% |
| $10,000 to $14,999 | 5 | 0.6% |
| $15,000 to $24,999 | 88 | 10.6% |
| $25,000 to $34,999 | 64 | 7.7% |
| $35,000 to $49,999 | 150 | 18.1% |
| $50,000 to $74,999 | 141 | 17.0% |
| $75,000 to $99,999 | 119 | 14.3% |
| $100,000 to $149,999 | 155 | 18.7% |
| $150,000 to $199,999 | 69 | 8.3% |
| $200,000+ | 33 | 4.0% |
Family Income by Famaliy Size in Gatlinburg
5-person families (33 | 4.0%) account for the highest median family income in Gatlinburg with $135,795 per family, while 2-person families (472 | 56.8%) have the highest median income of $28,125 per family member.
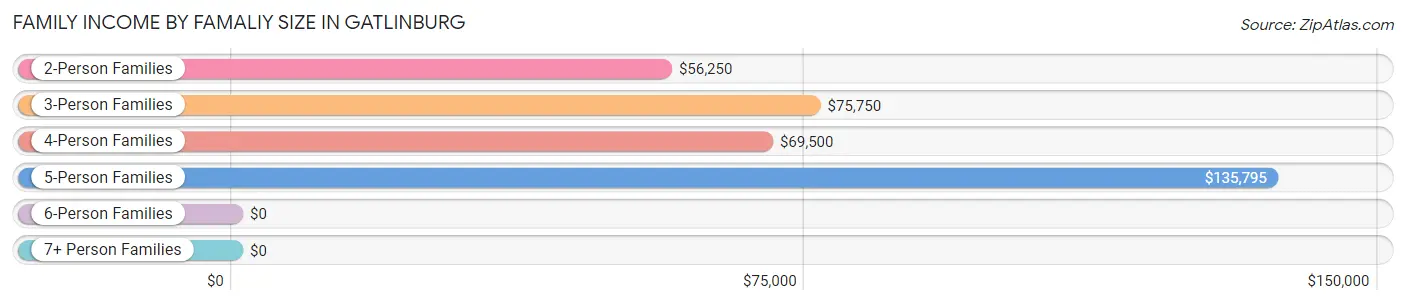
| Income Bracket | # Families | Median Income |
| 2-Person Families | 472 (56.8%) | $56,250 |
| 3-Person Families | 222 (26.7%) | $75,750 |
| 4-Person Families | 90 (10.8%) | $69,500 |
| 5-Person Families | 33 (4.0%) | $135,795 |
| 6-Person Families | 7 (0.8%) | $0 |
| 7+ Person Families | 7 (0.8%) | $0 |
| Total | 831 (100.0%) | $63,295 |
Family Income by Number of Earners in Gatlinburg
The median family income in Gatlinburg is $63,295, with families comprising 3+ earners (97) having the highest median family income of $135,341, while families with no earners (207) have the lowest median family income of $43,750, accounting for 11.7% and 24.9% of families, respectively.
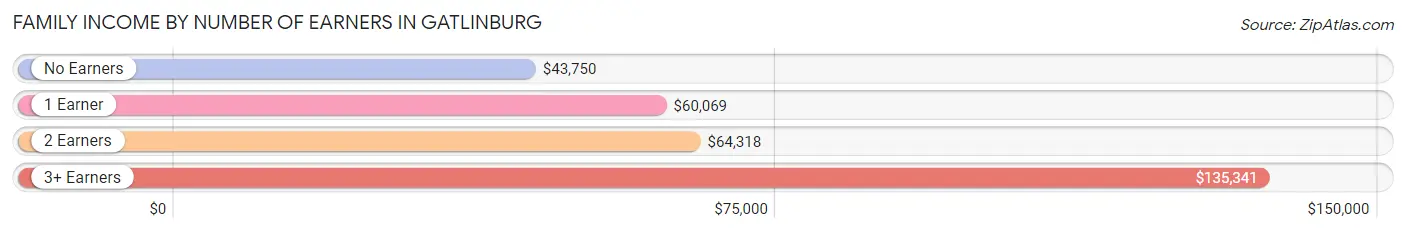
| Number of Earners | # Families | Median Income |
| No Earners | 207 (24.9%) | $43,750 |
| 1 Earner | 327 (39.4%) | $60,069 |
| 2 Earners | 200 (24.1%) | $64,318 |
| 3+ Earners | 97 (11.7%) | $135,341 |
| Total | 831 (100.0%) | $63,295 |
Household Income in Gatlinburg
Household Income Brackets in Gatlinburg
With 216 households falling in the category, the $25,000 to $34,999 income range is the most frequent in Gatlinburg, accounting for 15.6% of all households. In contrast, only 33 households (2.4%) fall into the $200,000+ income bracket, making it the least populous group.
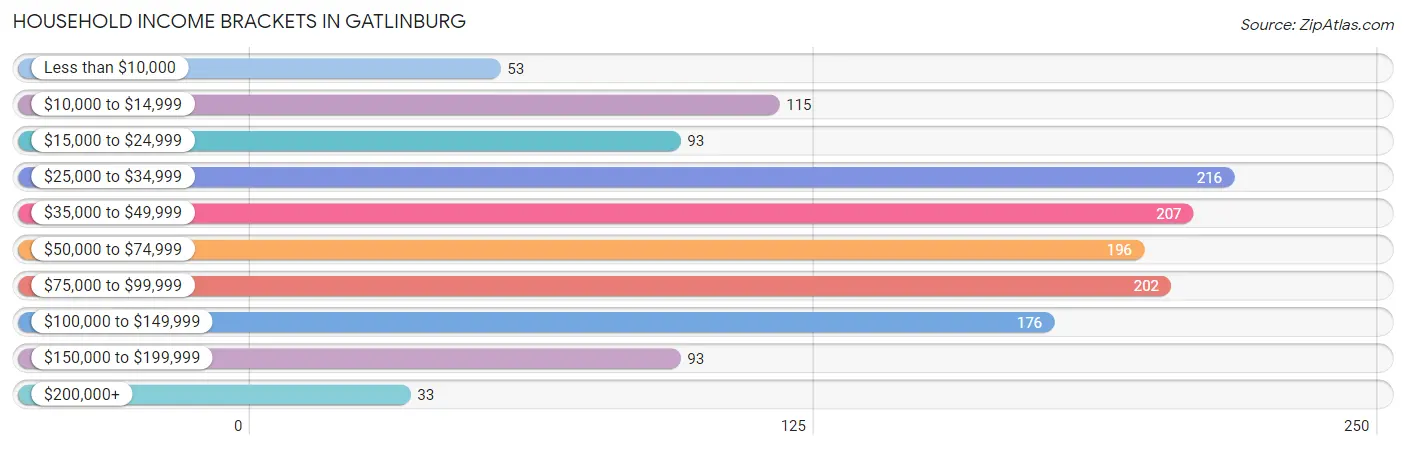
| Income Bracket | # Households | % Households |
| Less than $10,000 | 53 | 3.8% |
| $10,000 to $14,999 | 115 | 8.3% |
| $15,000 to $24,999 | 93 | 6.7% |
| $25,000 to $34,999 | 216 | 15.6% |
| $35,000 to $49,999 | 207 | 15.0% |
| $50,000 to $74,999 | 196 | 14.2% |
| $75,000 to $99,999 | 202 | 14.6% |
| $100,000 to $149,999 | 176 | 12.7% |
| $150,000 to $199,999 | 93 | 6.7% |
| $200,000+ | 33 | 2.4% |
Household Income by Householder Age in Gatlinburg
The median household income in Gatlinburg is $50,483, with the highest median household income of $69,500 found in the 45 to 64 years age bracket for the primary householder. A total of 552 households (39.9%) fall into this category. Meanwhile, the 15 to 24 years age bracket for the primary householder has the lowest median household income of $0, with 8 households (0.6%) in this group.
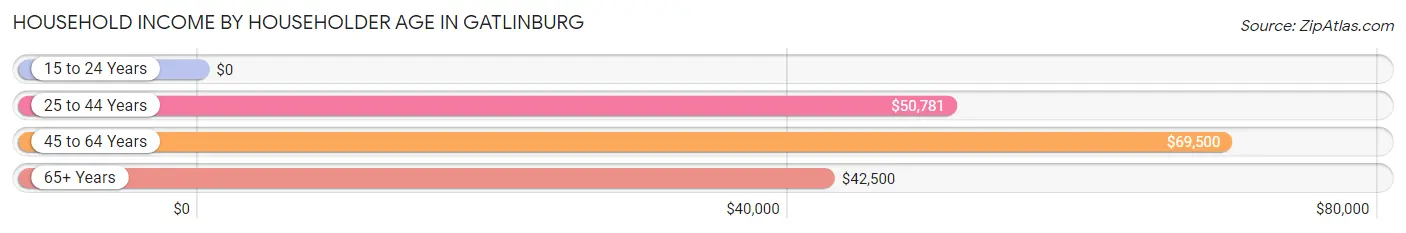
| Income Bracket | # Households | Median Income |
| 15 to 24 Years | 8 (0.6%) | $0 |
| 25 to 44 Years | 321 (23.2%) | $50,781 |
| 45 to 64 Years | 552 (39.9%) | $69,500 |
| 65+ Years | 502 (36.3%) | $42,500 |
| Total | 1,383 (100.0%) | $50,483 |
Poverty in Gatlinburg
Income Below Poverty by Sex and Age in Gatlinburg
With 10.2% poverty level for males and 17.4% for females among the residents of Gatlinburg, 18 to 24 year old males and 16 and 17 year old females are the most vulnerable to poverty, with 37 males (36.3%) and 18 females (47.4%) in their respective age groups living below the poverty level.
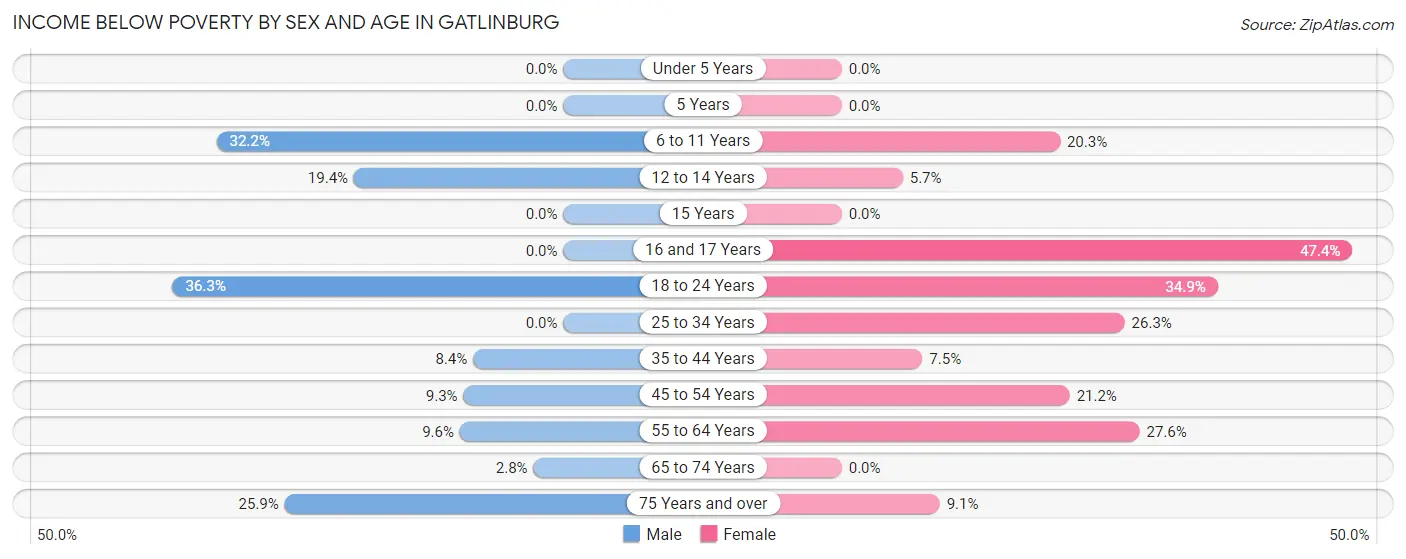
| Age Bracket | Male | Female |
| Under 5 Years | 0 (0.0%) | 0 (0.0%) |
| 5 Years | 0 (0.0%) | 0 (0.0%) |
| 6 to 11 Years | 28 (32.2%) | 16 (20.3%) |
| 12 to 14 Years | 14 (19.4%) | 3 (5.7%) |
| 15 Years | 0 (0.0%) | 0 (0.0%) |
| 16 and 17 Years | 0 (0.0%) | 18 (47.4%) |
| 18 to 24 Years | 37 (36.3%) | 30 (34.9%) |
| 25 to 34 Years | 0 (0.0%) | 79 (26.3%) |
| 35 to 44 Years | 16 (8.4%) | 8 (7.5%) |
| 45 to 54 Years | 19 (9.3%) | 55 (21.1%) |
| 55 to 64 Years | 22 (9.6%) | 76 (27.6%) |
| 65 to 74 Years | 6 (2.8%) | 0 (0.0%) |
| 75 Years and over | 52 (25.9%) | 14 (9.1%) |
| Total | 194 (10.2%) | 299 (17.4%) |
Income Above Poverty by Sex and Age in Gatlinburg
According to the poverty statistics in Gatlinburg, males aged under 5 years and females aged under 5 years are the age groups that are most secure financially, with 100.0% of males and 100.0% of females in these age groups living above the poverty line.
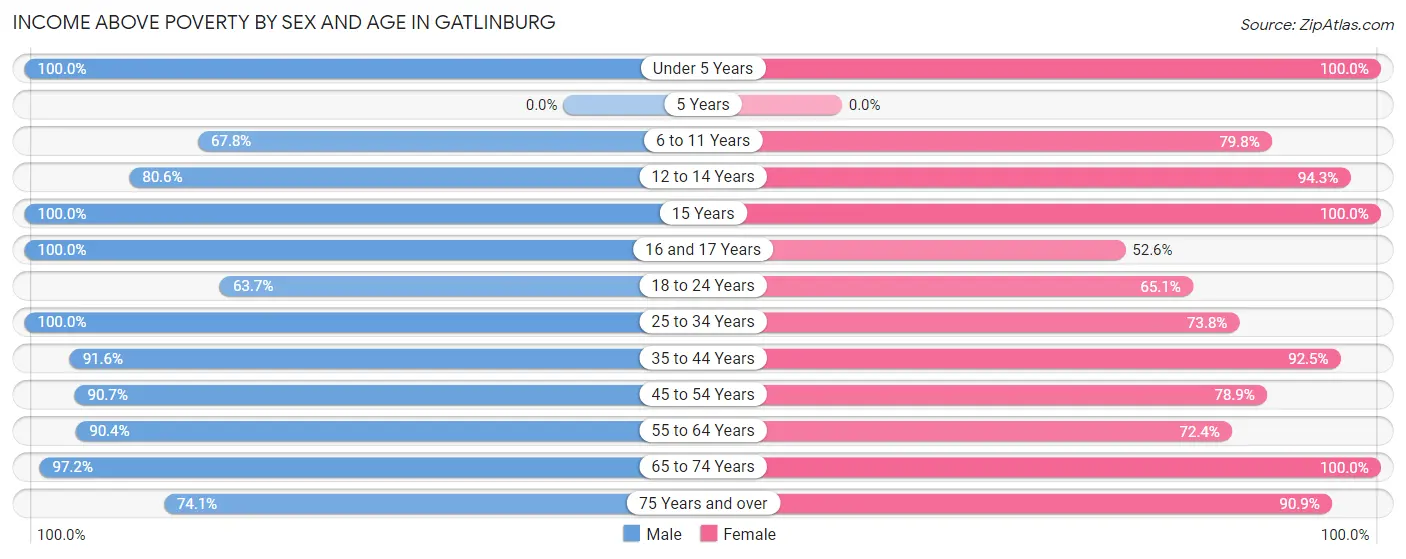
| Age Bracket | Male | Female |
| Under 5 Years | 17 (100.0%) | 115 (100.0%) |
| 5 Years | 0 (0.0%) | 0 (0.0%) |
| 6 to 11 Years | 59 (67.8%) | 63 (79.7%) |
| 12 to 14 Years | 58 (80.6%) | 50 (94.3%) |
| 15 Years | 311 (100.0%) | 2 (100.0%) |
| 16 and 17 Years | 6 (100.0%) | 20 (52.6%) |
| 18 to 24 Years | 65 (63.7%) | 56 (65.1%) |
| 25 to 34 Years | 261 (100.0%) | 222 (73.8%) |
| 35 to 44 Years | 175 (91.6%) | 99 (92.5%) |
| 45 to 54 Years | 186 (90.7%) | 205 (78.8%) |
| 55 to 64 Years | 207 (90.4%) | 199 (72.4%) |
| 65 to 74 Years | 210 (97.2%) | 243 (100.0%) |
| 75 Years and over | 149 (74.1%) | 140 (90.9%) |
| Total | 1,704 (89.8%) | 1,414 (82.6%) |
Income Below Poverty Among Married-Couple Families in Gatlinburg
The poverty statistics for married-couple families in Gatlinburg show that 1.4% or 10 of the total 694 families live below the poverty line. Families with no children have the highest poverty rate of 2.0%, comprising of 10 families. On the other hand, families with 1 or 2 children have the lowest poverty rate of 0.0%, which includes 0 families.
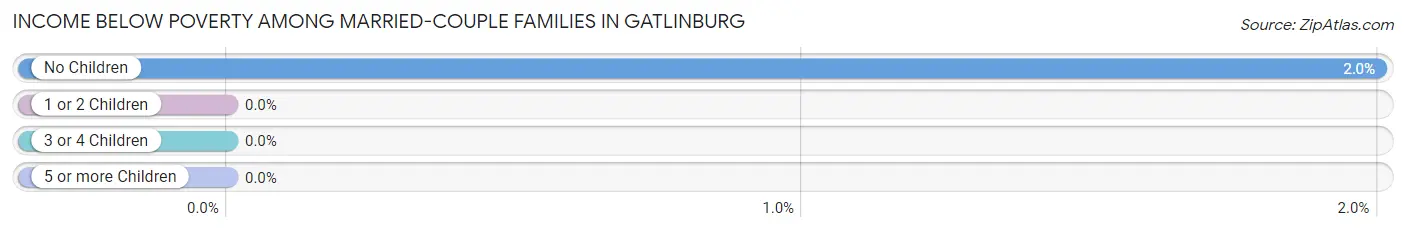
| Children | Above Poverty | Below Poverty |
| No Children | 489 (98.0%) | 10 (2.0%) |
| 1 or 2 Children | 181 (100.0%) | 0 (0.0%) |
| 3 or 4 Children | 7 (100.0%) | 0 (0.0%) |
| 5 or more Children | 7 (100.0%) | 0 (0.0%) |
| Total | 684 (98.6%) | 10 (1.4%) |
Income Below Poverty Among Single-Parent Households in Gatlinburg
According to the poverty data in Gatlinburg, 12.5% or 13 single-father households and 72.7% or 24 single-mother households are living below the poverty line. Among single-father households, those with 1 or 2 children have the highest poverty rate, with 13 households (19.7%) experiencing poverty. Likewise, among single-mother households, those with 1 or 2 children have the highest poverty rate, with 15 households (100.0%) falling below the poverty line.
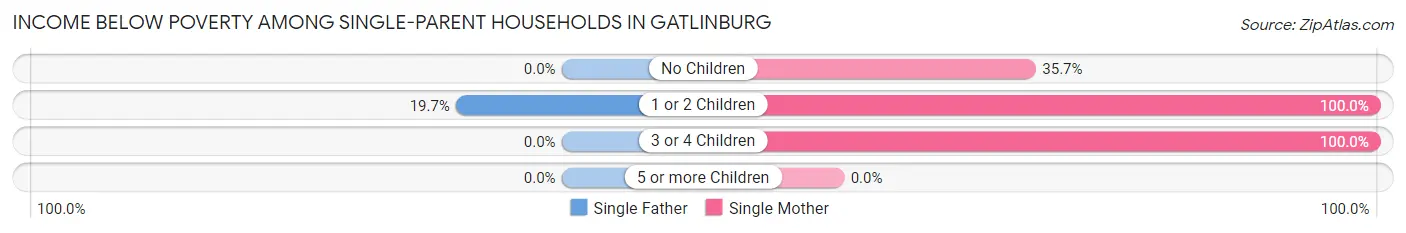
| Children | Single Father | Single Mother |
| No Children | 0 (0.0%) | 5 (35.7%) |
| 1 or 2 Children | 13 (19.7%) | 15 (100.0%) |
| 3 or 4 Children | 0 (0.0%) | 4 (100.0%) |
| 5 or more Children | 0 (0.0%) | 0 (0.0%) |
| Total | 13 (12.5%) | 24 (72.7%) |
Income Below Poverty Among Married-Couple vs Single-Parent Households in Gatlinburg
The poverty data for Gatlinburg shows that 10 of the married-couple family households (1.4%) and 37 of the single-parent households (27.0%) are living below the poverty level. Within the married-couple family households, those with no children have the highest poverty rate, with 10 households (2.0%) falling below the poverty line. Among the single-parent households, those with 3 or 4 children have the highest poverty rate, with 4 household (100.0%) living below poverty.
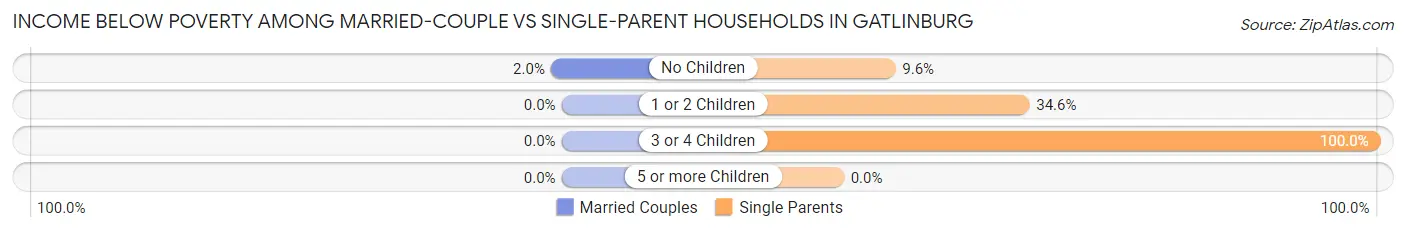
| Children | Married-Couple Families | Single-Parent Households |
| No Children | 10 (2.0%) | 5 (9.6%) |
| 1 or 2 Children | 0 (0.0%) | 28 (34.6%) |
| 3 or 4 Children | 0 (0.0%) | 4 (100.0%) |
| 5 or more Children | 0 (0.0%) | 0 (0.0%) |
| Total | 10 (1.4%) | 37 (27.0%) |
Race in Gatlinburg
The most populous races in Gatlinburg are White / Caucasian (2,881 | 79.2%), Hispanic or Latino (469 | 12.9%), and Some other Race (246 | 6.8%).
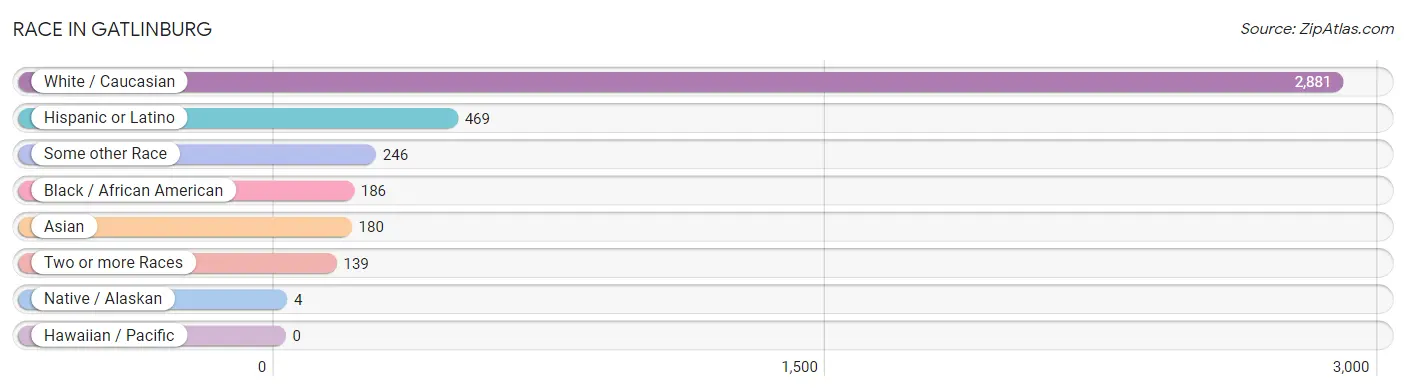
| Race | # Population | % Population |
| Asian | 180 | 5.0% |
| Black / African American | 186 | 5.1% |
| Hawaiian / Pacific | 0 | 0.0% |
| Hispanic or Latino | 469 | 12.9% |
| Native / Alaskan | 4 | 0.1% |
| White / Caucasian | 2,881 | 79.2% |
| Two or more Races | 139 | 3.8% |
| Some other Race | 246 | 6.8% |
| Total | 3,636 | 100.0% |
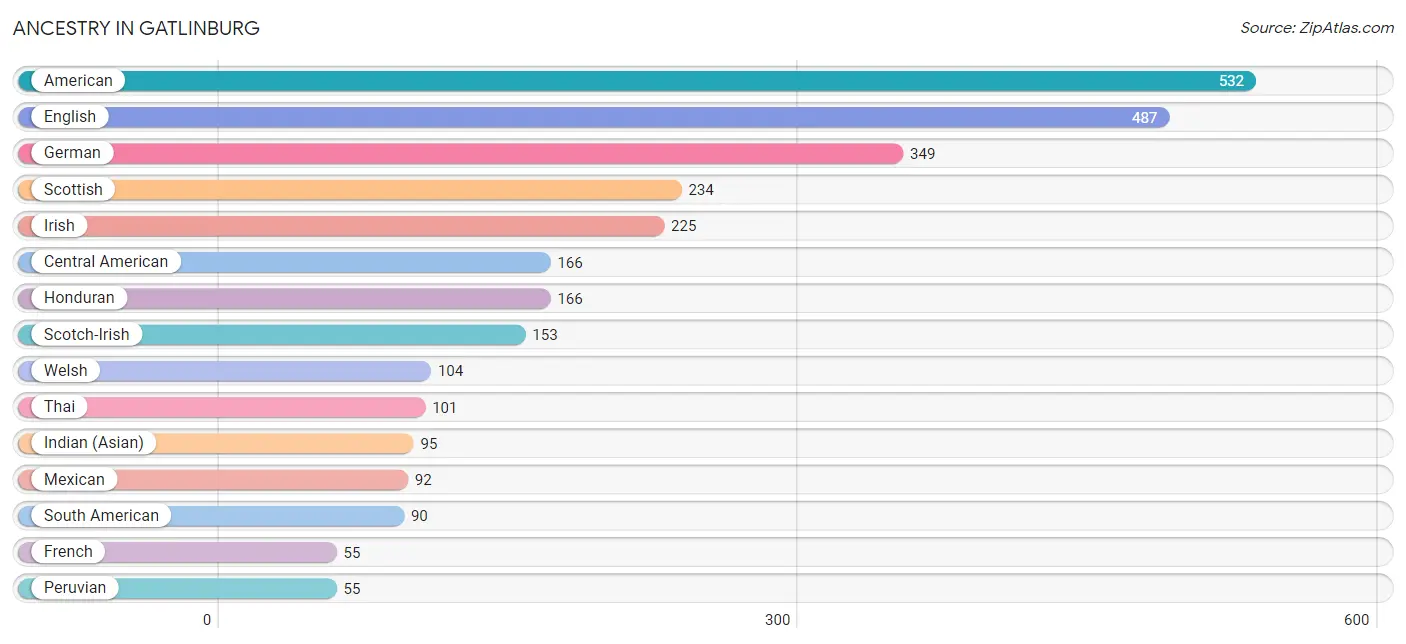
Ancestry in Gatlinburg
The most populous ancestries reported in Gatlinburg are American (532 | 14.6%), English (487 | 13.4%), German (349 | 9.6%), Scottish (234 | 6.4%), and Irish (225 | 6.2%), together accounting for 50.2% of all Gatlinburg residents.
| Ancestry | # Population | % Population |
| American | 532 | 14.6% |
| Arab | 31 | 0.9% |
| Austrian | 5 | 0.1% |
| Belgian | 7 | 0.2% |
| British | 22 | 0.6% |
| Canadian | 17 | 0.5% |
| Central American | 166 | 4.6% |
| Cherokee | 7 | 0.2% |
| Cree | 4 | 0.1% |
| Croatian | 5 | 0.1% |
| Cuban | 1 | 0.0% |
| Czech | 5 | 0.1% |
| Danish | 17 | 0.5% |
| Dominican | 37 | 1.0% |
| Dutch | 33 | 0.9% |
| English | 487 | 13.4% |
| European | 36 | 1.0% |
| Filipino | 4 | 0.1% |
| French | 55 | 1.5% |
| French Canadian | 7 | 0.2% |
| German | 349 | 9.6% |
| Honduran | 166 | 4.6% |
| Hungarian | 11 | 0.3% |
| Indian (Asian) | 95 | 2.6% |
| Irish | 225 | 6.2% |
| Italian | 42 | 1.2% |
| Korean | 28 | 0.8% |
| Latvian | 7 | 0.2% |
| Lebanese | 24 | 0.7% |
| Mexican | 92 | 2.5% |
| Native Hawaiian | 19 | 0.5% |
| Norwegian | 4 | 0.1% |
| Peruvian | 55 | 1.5% |
| Polish | 35 | 1.0% |
| Portuguese | 5 | 0.1% |
| Puerto Rican | 9 | 0.3% |
| Russian | 7 | 0.2% |
| Scotch-Irish | 153 | 4.2% |
| Scottish | 234 | 6.4% |
| South American | 90 | 2.5% |
| South American Indian | 2 | 0.1% |
| Spanish | 10 | 0.3% |
| Swiss | 8 | 0.2% |
| Syrian | 7 | 0.2% |
| Thai | 101 | 2.8% |
| Venezuelan | 35 | 1.0% |
| Welsh | 104 | 2.9% | View All 47 Rows |
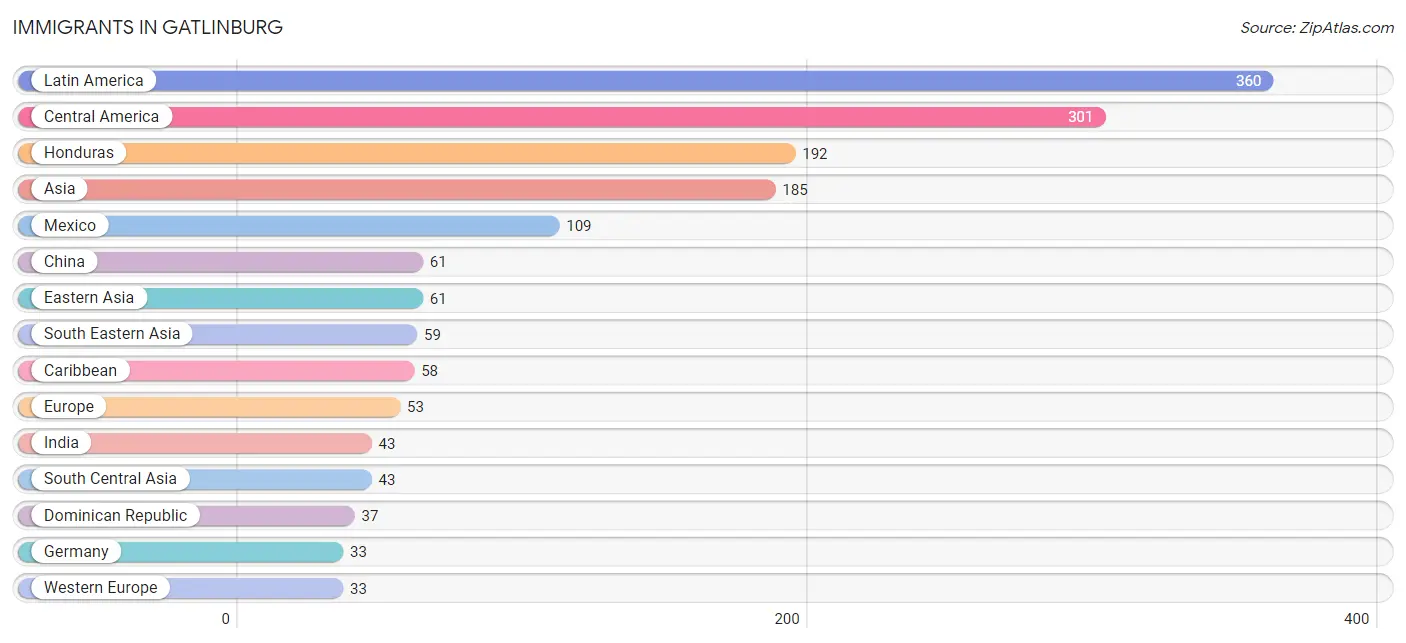
Immigrants in Gatlinburg
The most numerous immigrant groups reported in Gatlinburg came from Latin America (360 | 9.9%), Central America (301 | 8.3%), Honduras (192 | 5.3%), Asia (185 | 5.1%), and Mexico (109 | 3.0%), together accounting for 31.6% of all Gatlinburg residents.
| Immigration Origin | # Population | % Population |
| Asia | 185 | 5.1% |
| Canada | 26 | 0.7% |
| Caribbean | 58 | 1.6% |
| Central America | 301 | 8.3% |
| China | 61 | 1.7% |
| Dominican Republic | 37 | 1.0% |
| Eastern Asia | 61 | 1.7% |
| Eastern Europe | 15 | 0.4% |
| Europe | 53 | 1.5% |
| Germany | 33 | 0.9% |
| Honduras | 192 | 5.3% |
| India | 43 | 1.2% |
| Ireland | 1 | 0.0% |
| Jamaica | 21 | 0.6% |
| Latin America | 360 | 9.9% |
| Latvia | 7 | 0.2% |
| Malaysia | 19 | 0.5% |
| Mexico | 109 | 3.0% |
| Northern Europe | 5 | 0.1% |
| Norway | 4 | 0.1% |
| Peru | 1 | 0.0% |
| Philippines | 31 | 0.9% |
| South America | 1 | 0.0% |
| South Central Asia | 43 | 1.2% |
| South Eastern Asia | 59 | 1.6% |
| Taiwan | 4 | 0.1% |
| Thailand | 9 | 0.3% |
| Turkey | 22 | 0.6% |
| Ukraine | 8 | 0.2% |
| Western Asia | 22 | 0.6% |
| Western Europe | 33 | 0.9% | View All 31 Rows |
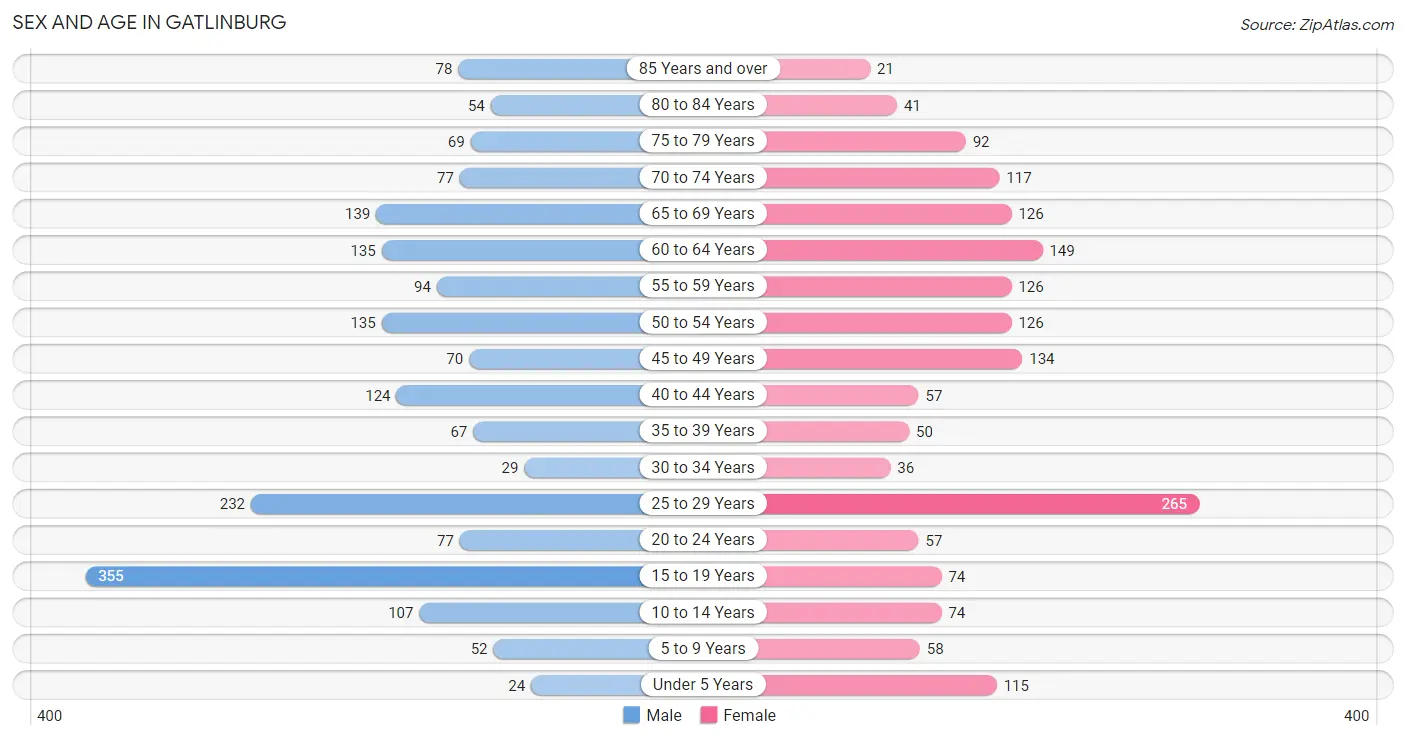
Sex and Age in Gatlinburg
Sex and Age in Gatlinburg
The most populous age groups in Gatlinburg are 15 to 19 Years (355 | 18.5%) for men and 25 to 29 Years (265 | 15.4%) for women.
| Age Bracket | Male | Female |
| Under 5 Years | 24 (1.3%) | 115 (6.7%) |
| 5 to 9 Years | 52 (2.7%) | 58 (3.4%) |
| 10 to 14 Years | 107 (5.6%) | 74 (4.3%) |
| 15 to 19 Years | 355 (18.5%) | 74 (4.3%) |
| 20 to 24 Years | 77 (4.0%) | 57 (3.3%) |
| 25 to 29 Years | 232 (12.1%) | 265 (15.4%) |
| 30 to 34 Years | 29 (1.5%) | 36 (2.1%) |
| 35 to 39 Years | 67 (3.5%) | 50 (2.9%) |
| 40 to 44 Years | 124 (6.5%) | 57 (3.3%) |
| 45 to 49 Years | 70 (3.6%) | 134 (7.8%) |
| 50 to 54 Years | 135 (7.0%) | 126 (7.3%) |
| 55 to 59 Years | 94 (4.9%) | 126 (7.3%) |
| 60 to 64 Years | 135 (7.0%) | 149 (8.7%) |
| 65 to 69 Years | 139 (7.2%) | 126 (7.3%) |
| 70 to 74 Years | 77 (4.0%) | 117 (6.8%) |
| 75 to 79 Years | 69 (3.6%) | 92 (5.4%) |
| 80 to 84 Years | 54 (2.8%) | 41 (2.4%) |
| 85 Years and over | 78 (4.1%) | 21 (1.2%) |
| Total | 1,918 (100.0%) | 1,718 (100.0%) |
Families and Households in Gatlinburg
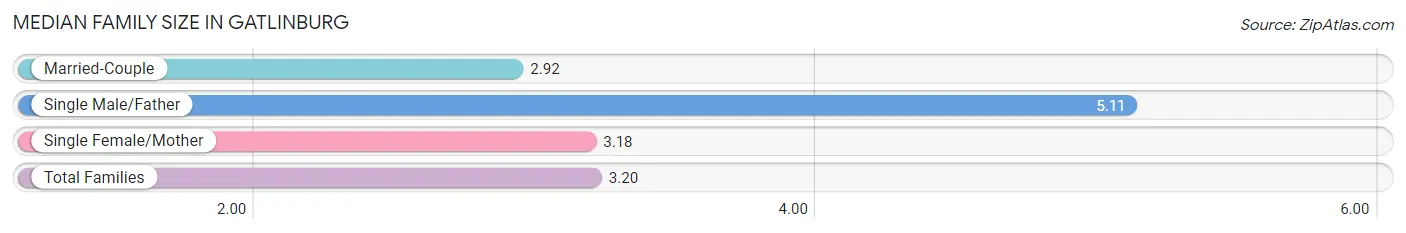
Median Family Size in Gatlinburg
The median family size in Gatlinburg is 3.20 persons per family, with single male/father families (104 | 12.5%) accounting for the largest median family size of 5.11 persons per family. On the other hand, married-couple families (694 | 83.5%) represent the smallest median family size with 2.92 persons per family.
| Family Type | # Families | Family Size |
| Married-Couple | 694 (83.5%) | 2.92 |
| Single Male/Father | 104 (12.5%) | 5.11 |
| Single Female/Mother | 33 (4.0%) | 3.18 |
| Total Families | 831 (100.0%) | 3.20 |
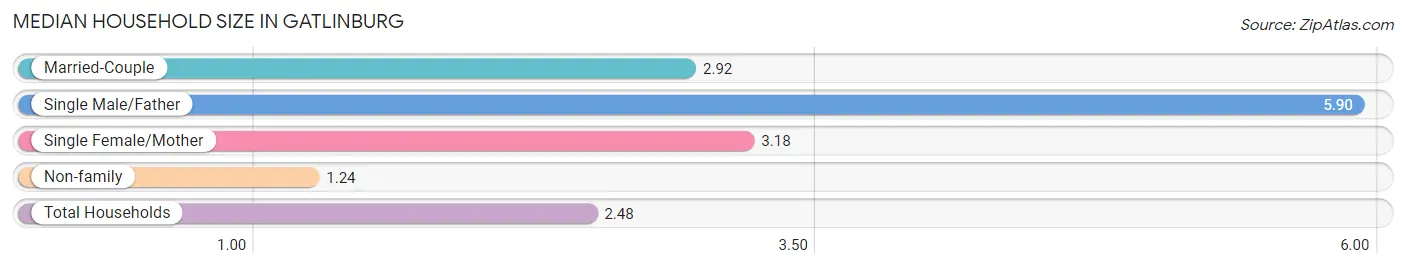
Median Household Size in Gatlinburg
The median household size in Gatlinburg is 2.48 persons per household, with single male/father households (104 | 7.5%) accounting for the largest median household size of 5.9 persons per household. non-family households (552 | 39.9%) represent the smallest median household size with 1.24 persons per household.
| Household Type | # Households | Household Size |
| Married-Couple | 694 (50.2%) | 2.92 |
| Single Male/Father | 104 (7.5%) | 5.90 |
| Single Female/Mother | 33 (2.4%) | 3.18 |
| Non-family | 552 (39.9%) | 1.24 |
| Total Households | 1,383 (100.0%) | 2.48 |
Household Size by Marriage Status in Gatlinburg
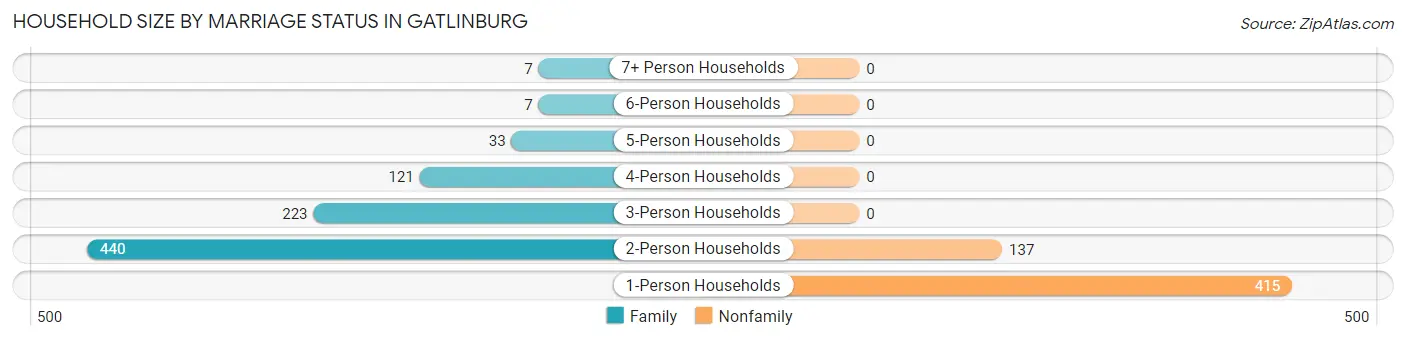
Out of a total of 1,383 households in Gatlinburg, 831 (60.1%) are family households, while 552 (39.9%) are nonfamily households. The most numerous type of family households are 2-person households, comprising 440, and the most common type of nonfamily households are 1-person households, comprising 415.
| Household Size | Family Households | Nonfamily Households |
| 1-Person Households | - | 415 (30.0%) |
| 2-Person Households | 440 (31.8%) | 137 (9.9%) |
| 3-Person Households | 223 (16.1%) | 0 (0.0%) |
| 4-Person Households | 121 (8.7%) | 0 (0.0%) |
| 5-Person Households | 33 (2.4%) | 0 (0.0%) |
| 6-Person Households | 7 (0.5%) | 0 (0.0%) |
| 7+ Person Households | 7 (0.5%) | 0 (0.0%) |
| Total | 831 (60.1%) | 552 (39.9%) |
Female Fertility in Gatlinburg
Fertility by Age in Gatlinburg
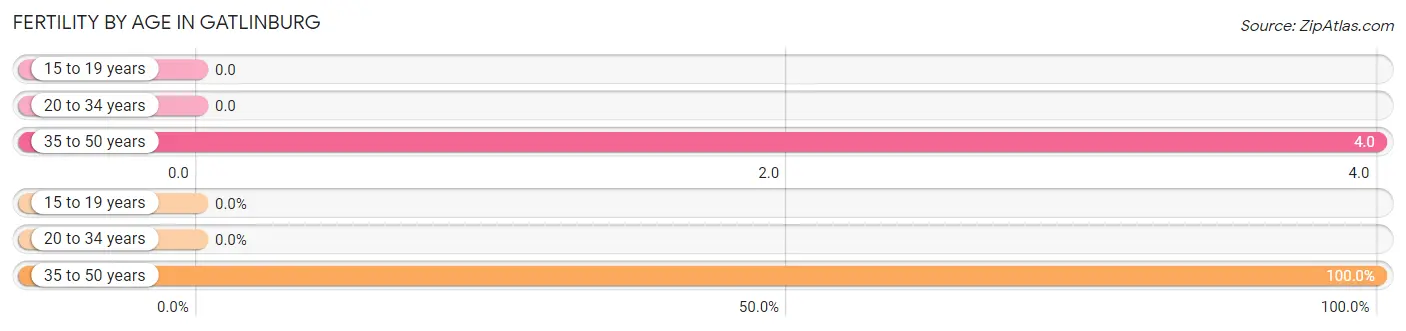
Average fertility rate in Gatlinburg is 1.0 births per 1,000 women. Women in the age bracket of 35 to 50 years have the highest fertility rate with 4.0 births per 1,000 women. Women in the age bracket of 35 to 50 years acount for 100.0% of all women with births.
| Age Bracket | Women with Births | Births / 1,000 Women |
| 15 to 19 years | 0 (0.0%) | 0.0 |
| 20 to 34 years | 0 (0.0%) | 0.0 |
| 35 to 50 years | 1 (100.0%) | 4.0 |
| Total | 1 (100.0%) | 1.0 |
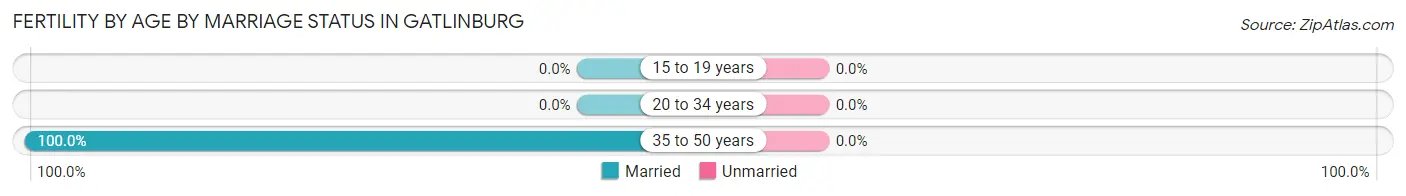
Fertility by Age by Marriage Status in Gatlinburg
| Age Bracket | Married | Unmarried |
| 15 to 19 years | 0 (0.0%) | 0 (0.0%) |
| 20 to 34 years | 0 (0.0%) | 0 (0.0%) |
| 35 to 50 years | 1 (100.0%) | 0 (0.0%) |
| Total | 1 (100.0%) | 0 (0.0%) |
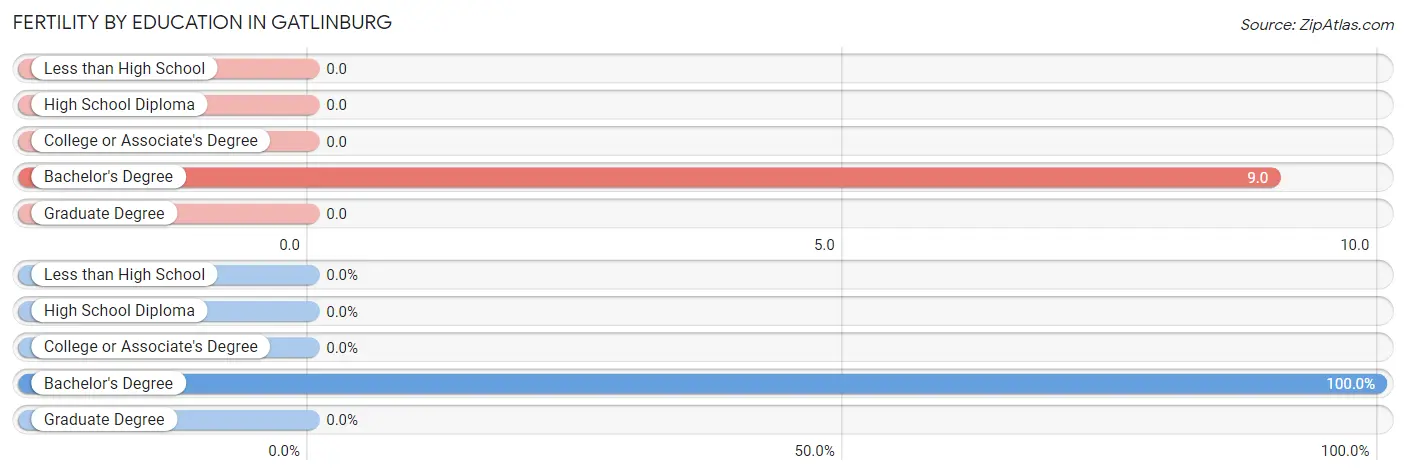
Fertility by Education in Gatlinburg
| Educational Attainment | Women with Births | Births / 1,000 Women |
| Less than High School | 0 (0.0%) | 0.0 |
| High School Diploma | 0 (0.0%) | 0.0 |
| College or Associate's Degree | 0 (0.0%) | 0.0 |
| Bachelor's Degree | 1 (100.0%) | 9.0 |
| Graduate Degree | 0 (0.0%) | 0.0 |
| Total | 1 (100.0%) | 1.0 |
Fertility by Education by Marriage Status in Gatlinburg
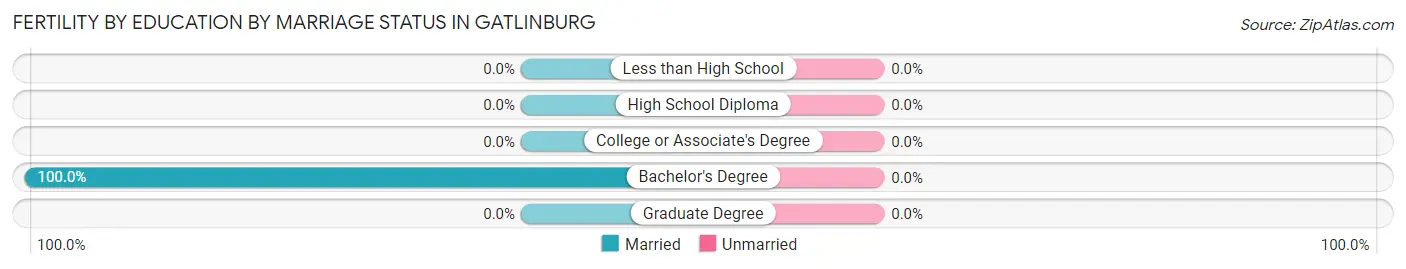
| Educational Attainment | Married | Unmarried |
| Less than High School | 0 (0.0%) | 0 (0.0%) |
| High School Diploma | 0 (0.0%) | 0 (0.0%) |
| College or Associate's Degree | 0 (0.0%) | 0 (0.0%) |
| Bachelor's Degree | 1 (100.0%) | 0 (0.0%) |
| Graduate Degree | 0 (0.0%) | 0 (0.0%) |
| Total | 1 (100.0%) | 0 (0.0%) |
Employment Characteristics in Gatlinburg
Employment by Class of Employer in Gatlinburg
Among the 1,650 employed individuals in Gatlinburg, private company employees (1,272 | 77.1%), self-employed (not incorporated) (97 | 5.9%), and local government employees (93 | 5.6%) make up the most common classes of employment.
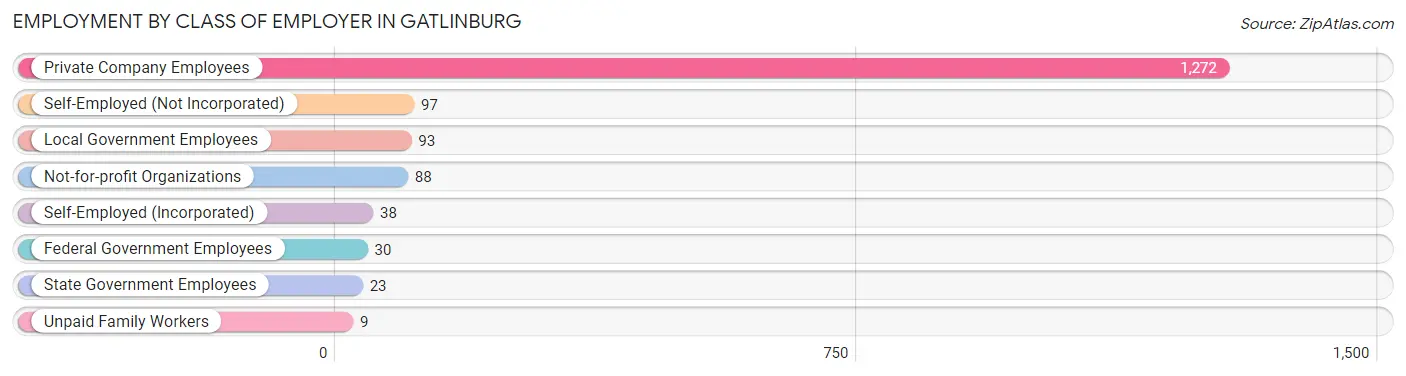
| Employer Class | # Employees | % Employees |
| Private Company Employees | 1,272 | 77.1% |
| Self-Employed (Incorporated) | 38 | 2.3% |
| Self-Employed (Not Incorporated) | 97 | 5.9% |
| Not-for-profit Organizations | 88 | 5.3% |
| Local Government Employees | 93 | 5.6% |
| State Government Employees | 23 | 1.4% |
| Federal Government Employees | 30 | 1.8% |
| Unpaid Family Workers | 9 | 0.5% |
| Total | 1,650 | 100.0% |
Employment Status by Age in Gatlinburg
According to the labor force statistics for Gatlinburg, out of the total population over 16 years of age (2,893), 60.9% or 1,762 individuals are in the labor force, with 5.0% or 88 of them unemployed. The age group with the highest labor force participation rate is 20 to 24 years, with 93.3% or 125 individuals in the labor force. Within the labor force, the 75 years and over age range has the highest percentage of unemployed individuals, with 20.6% or 7 of them being unemployed.
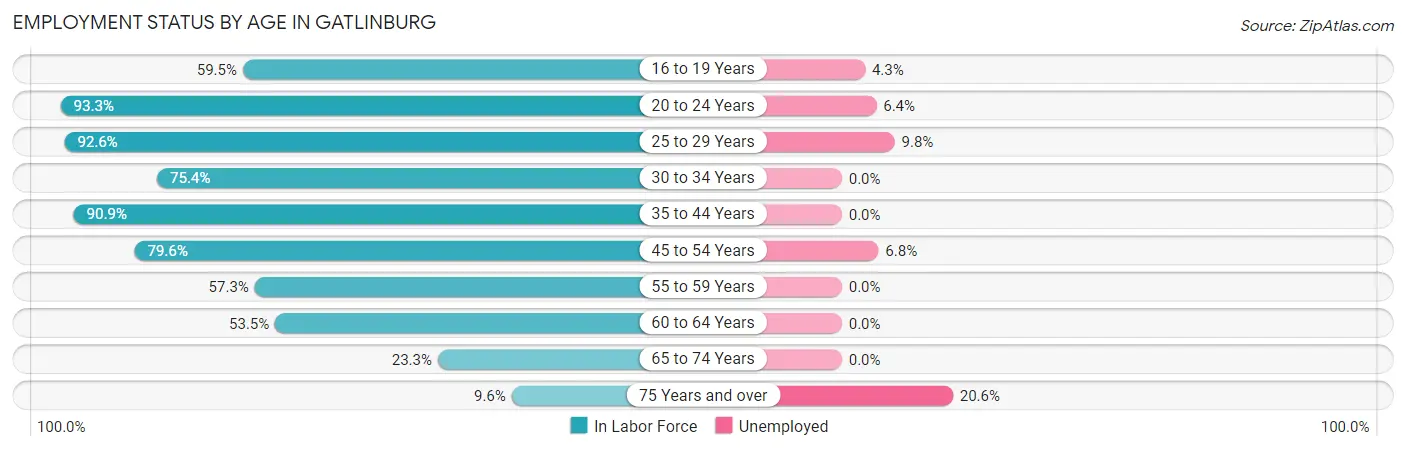
| Age Bracket | In Labor Force | Unemployed |
| 16 to 19 Years | 69 (59.5%) | 3 (4.3%) |
| 20 to 24 Years | 125 (93.3%) | 8 (6.4%) |
| 25 to 29 Years | 460 (92.6%) | 45 (9.8%) |
| 30 to 34 Years | 49 (75.4%) | 0 (0.0%) |
| 35 to 44 Years | 271 (90.9%) | 0 (0.0%) |
| 45 to 54 Years | 370 (79.6%) | 25 (6.8%) |
| 55 to 59 Years | 126 (57.3%) | 0 (0.0%) |
| 60 to 64 Years | 152 (53.5%) | 0 (0.0%) |
| 65 to 74 Years | 107 (23.3%) | 0 (0.0%) |
| 75 Years and over | 34 (9.6%) | 7 (20.6%) |
| Total | 1,762 (60.9%) | 88 (5.0%) |
Employment Status by Educational Attainment in Gatlinburg
According to labor force statistics for Gatlinburg, 78.1% of individuals (1,428) out of the total population between 25 and 64 years of age (1,829) are in the labor force, with 4.9% or 70 of them being unemployed. The group with the highest labor force participation rate are those with the educational attainment of less than high school, with 93.9% or 155 individuals in the labor force. Within the labor force, individuals with college / associate degree education have the highest percentage of unemployment, with 8.9% or 41 of them being unemployed.
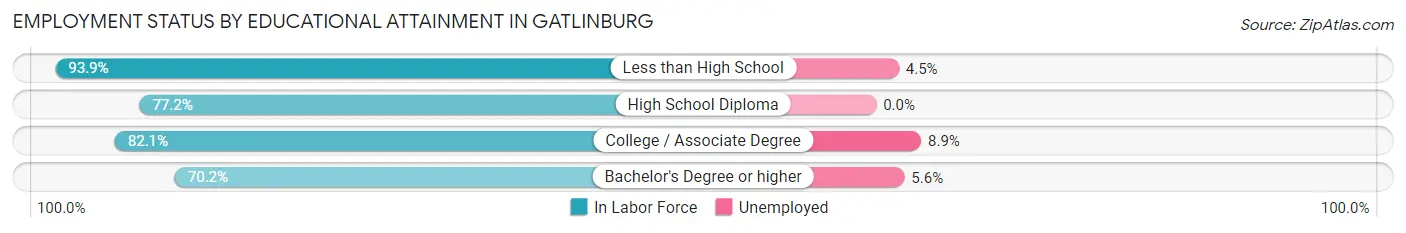
| Educational Attainment | In Labor Force | Unemployed |
| Less than High School | 155 (93.9%) | 7 (4.5%) |
| High School Diploma | 414 (77.2%) | 0 (0.0%) |
| College / Associate Degree | 463 (82.1%) | 50 (8.9%) |
| Bachelor's Degree or higher | 396 (70.2%) | 32 (5.6%) |
| Total | 1,428 (78.1%) | 90 (4.9%) |
Employment Occupations by Sex in Gatlinburg
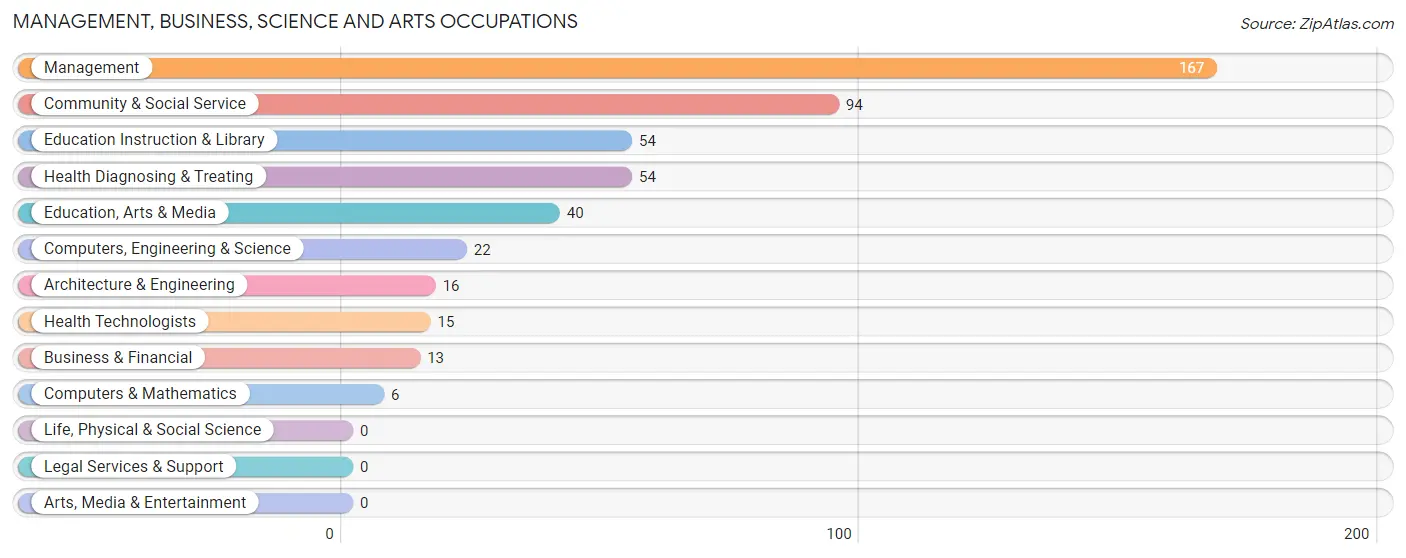
Management, Business, Science and Arts Occupations
The most common Management, Business, Science and Arts occupations in Gatlinburg are Management (167 | 10.0%), Community & Social Service (94 | 5.6%), Education Instruction & Library (54 | 3.2%), Health Diagnosing & Treating (54 | 3.2%), and Education, Arts & Media (40 | 2.4%).
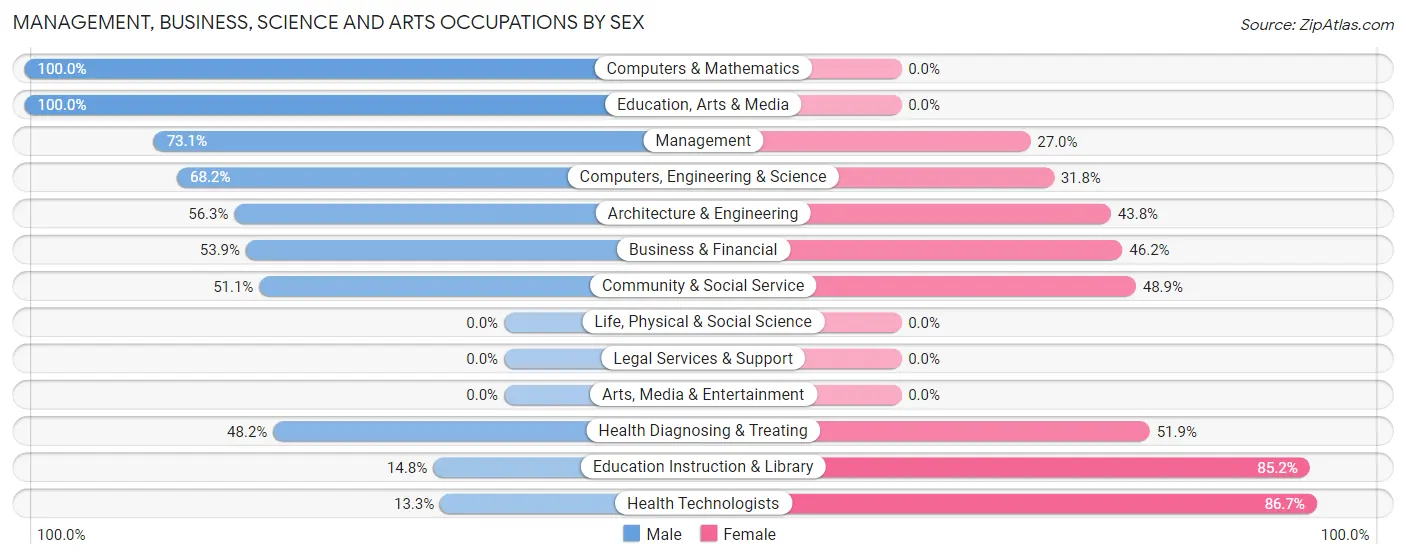
Management, Business, Science and Arts Occupations by Sex
Within the Management, Business, Science and Arts occupations in Gatlinburg, the most male-oriented occupations are Computers & Mathematics (100.0%), Education, Arts & Media (100.0%), and Management (73.1%), while the most female-oriented occupations are Health Technologists (86.7%), Education Instruction & Library (85.2%), and Health Diagnosing & Treating (51.8%).
| Occupation | Male | Female |
| Management | 122 (73.1%) | 45 (27.0%) |
| Business & Financial | 7 (53.8%) | 6 (46.2%) |
| Computers, Engineering & Science | 15 (68.2%) | 7 (31.8%) |
| Computers & Mathematics | 6 (100.0%) | 0 (0.0%) |
| Architecture & Engineering | 9 (56.2%) | 7 (43.8%) |
| Life, Physical & Social Science | 0 (0.0%) | 0 (0.0%) |
| Community & Social Service | 48 (51.1%) | 46 (48.9%) |
| Education, Arts & Media | 40 (100.0%) | 0 (0.0%) |
| Legal Services & Support | 0 (0.0%) | 0 (0.0%) |
| Education Instruction & Library | 8 (14.8%) | 46 (85.2%) |
| Arts, Media & Entertainment | 0 (0.0%) | 0 (0.0%) |
| Health Diagnosing & Treating | 26 (48.1%) | 28 (51.8%) |
| Health Technologists | 2 (13.3%) | 13 (86.7%) |
| Total (Category) | 218 (62.3%) | 132 (37.7%) |
| Total (Overall) | 902 (53.8%) | 773 (46.2%) |
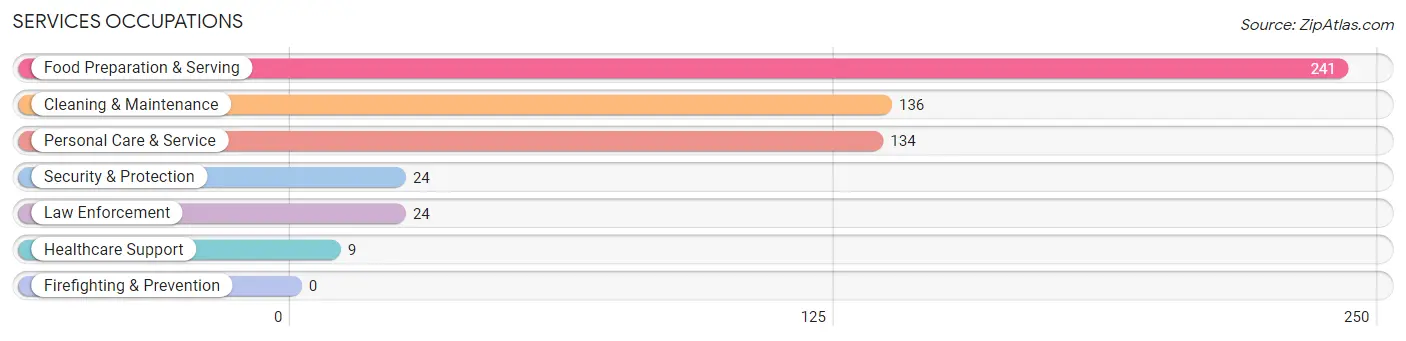
Services Occupations
The most common Services occupations in Gatlinburg are Food Preparation & Serving (241 | 14.4%), Cleaning & Maintenance (136 | 8.1%), Personal Care & Service (134 | 8.0%), Security & Protection (24 | 1.4%), and Law Enforcement (24 | 1.4%).
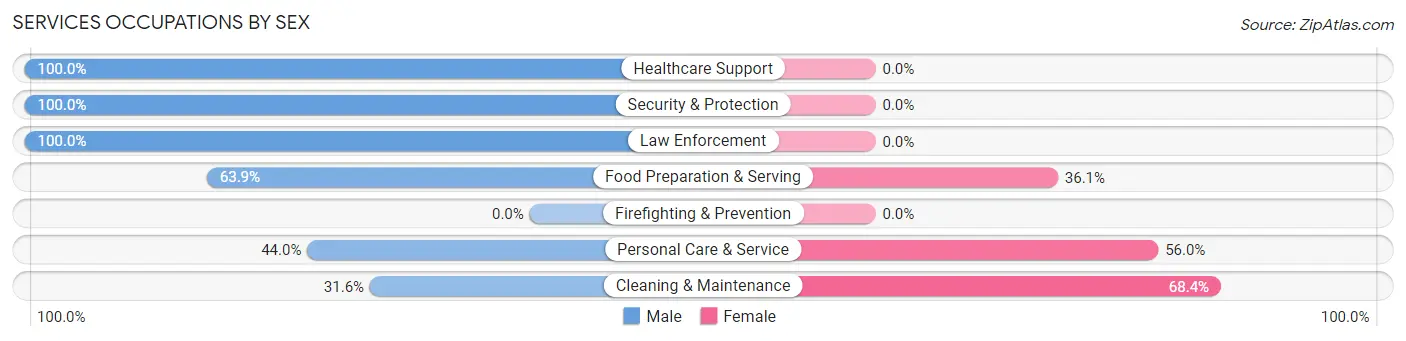
Services Occupations by Sex
Within the Services occupations in Gatlinburg, the most male-oriented occupations are Healthcare Support (100.0%), Security & Protection (100.0%), and Law Enforcement (100.0%), while the most female-oriented occupations are Cleaning & Maintenance (68.4%), Personal Care & Service (56.0%), and Food Preparation & Serving (36.1%).
| Occupation | Male | Female |
| Healthcare Support | 9 (100.0%) | 0 (0.0%) |
| Security & Protection | 24 (100.0%) | 0 (0.0%) |
| Firefighting & Prevention | 0 (0.0%) | 0 (0.0%) |
| Law Enforcement | 24 (100.0%) | 0 (0.0%) |
| Food Preparation & Serving | 154 (63.9%) | 87 (36.1%) |
| Cleaning & Maintenance | 43 (31.6%) | 93 (68.4%) |
| Personal Care & Service | 59 (44.0%) | 75 (56.0%) |
| Total (Category) | 289 (53.1%) | 255 (46.9%) |
| Total (Overall) | 902 (53.8%) | 773 (46.2%) |
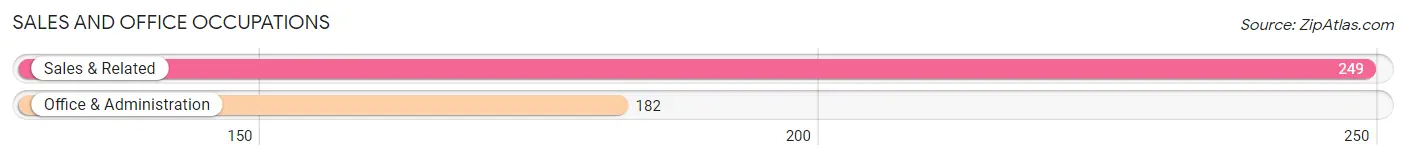
Sales and Office Occupations
The most common Sales and Office occupations in Gatlinburg are Sales & Related (249 | 14.9%), and Office & Administration (182 | 10.9%).
Sales and Office Occupations by Sex
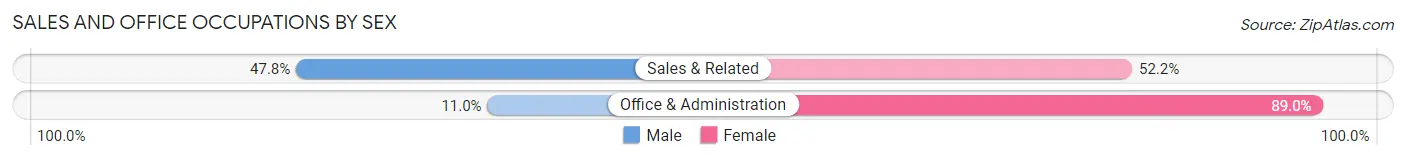
| Occupation | Male | Female |
| Sales & Related | 119 (47.8%) | 130 (52.2%) |
| Office & Administration | 20 (11.0%) | 162 (89.0%) |
| Total (Category) | 139 (32.3%) | 292 (67.7%) |
| Total (Overall) | 902 (53.8%) | 773 (46.2%) |
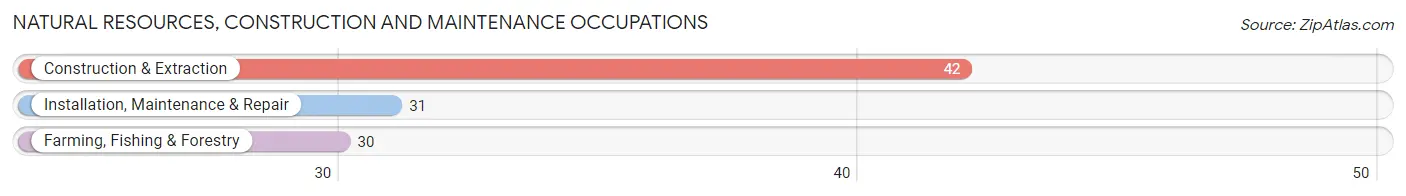
Natural Resources, Construction and Maintenance Occupations
The most common Natural Resources, Construction and Maintenance occupations in Gatlinburg are Construction & Extraction (42 | 2.5%), Installation, Maintenance & Repair (31 | 1.8%), and Farming, Fishing & Forestry (30 | 1.8%).
Natural Resources, Construction and Maintenance Occupations by Sex
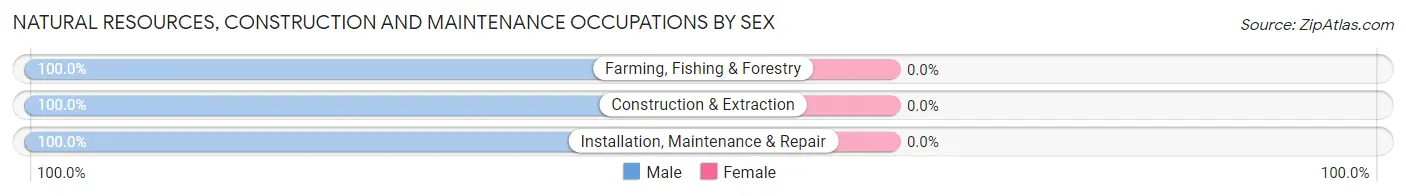
| Occupation | Male | Female |
| Farming, Fishing & Forestry | 30 (100.0%) | 0 (0.0%) |
| Construction & Extraction | 42 (100.0%) | 0 (0.0%) |
| Installation, Maintenance & Repair | 31 (100.0%) | 0 (0.0%) |
| Total (Category) | 103 (100.0%) | 0 (0.0%) |
| Total (Overall) | 902 (53.8%) | 773 (46.2%) |
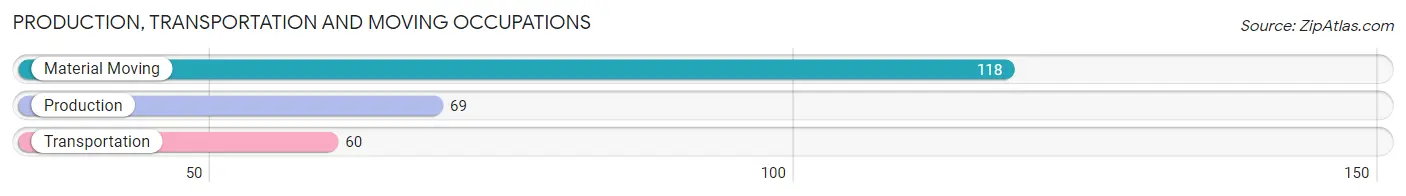
Production, Transportation and Moving Occupations
The most common Production, Transportation and Moving occupations in Gatlinburg are Material Moving (118 | 7.0%), Production (69 | 4.1%), and Transportation (60 | 3.6%).
Production, Transportation and Moving Occupations by Sex
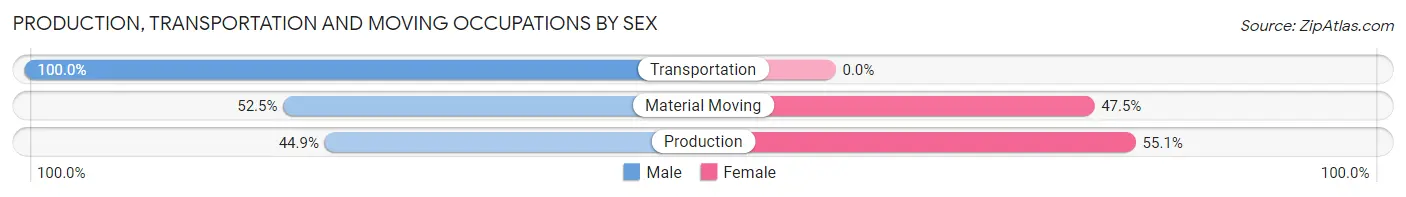
| Occupation | Male | Female |
| Production | 31 (44.9%) | 38 (55.1%) |
| Transportation | 60 (100.0%) | 0 (0.0%) |
| Material Moving | 62 (52.5%) | 56 (47.5%) |
| Total (Category) | 153 (61.9%) | 94 (38.1%) |
| Total (Overall) | 902 (53.8%) | 773 (46.2%) |
Employment Industries by Sex in Gatlinburg
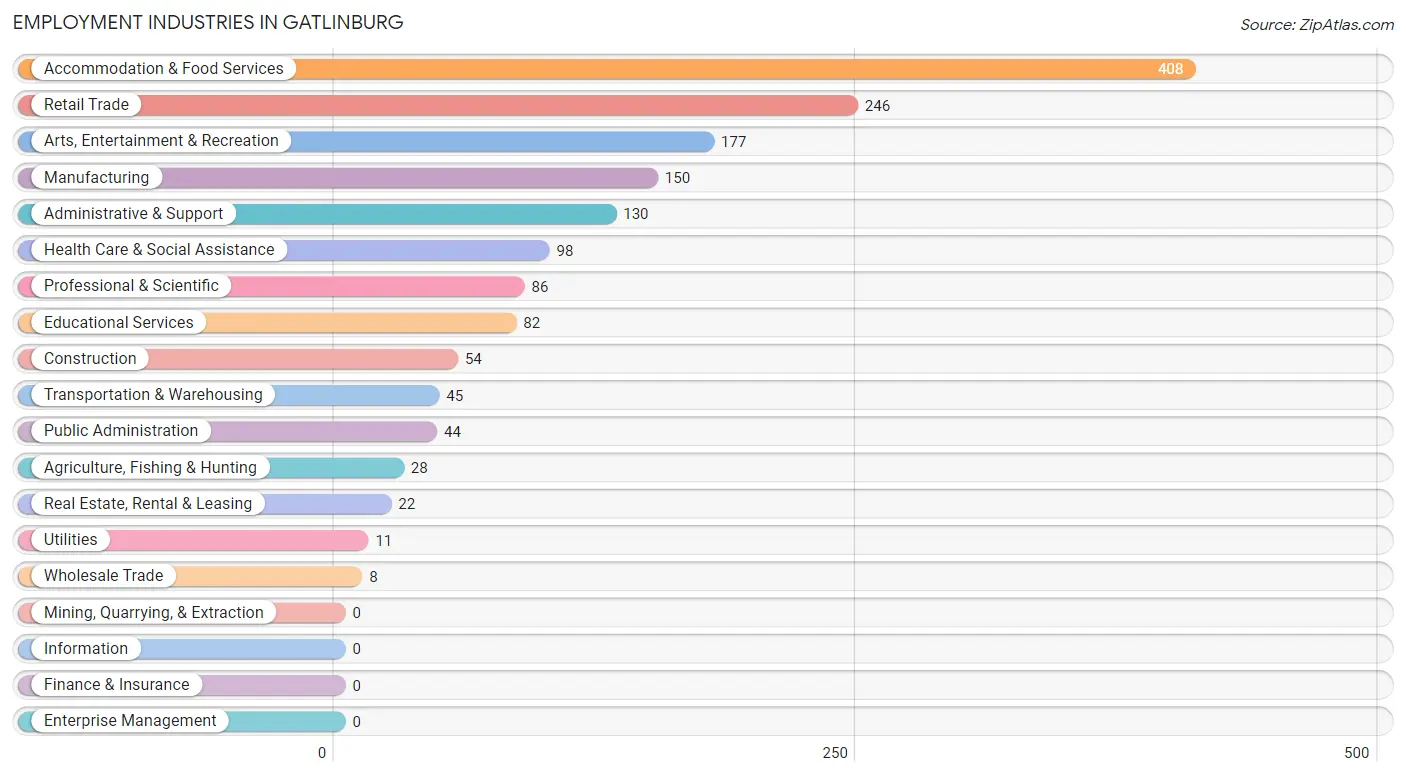
Employment Industries in Gatlinburg
The major employment industries in Gatlinburg include Accommodation & Food Services (408 | 24.4%), Retail Trade (246 | 14.7%), Arts, Entertainment & Recreation (177 | 10.6%), Manufacturing (150 | 9.0%), and Administrative & Support (130 | 7.8%).
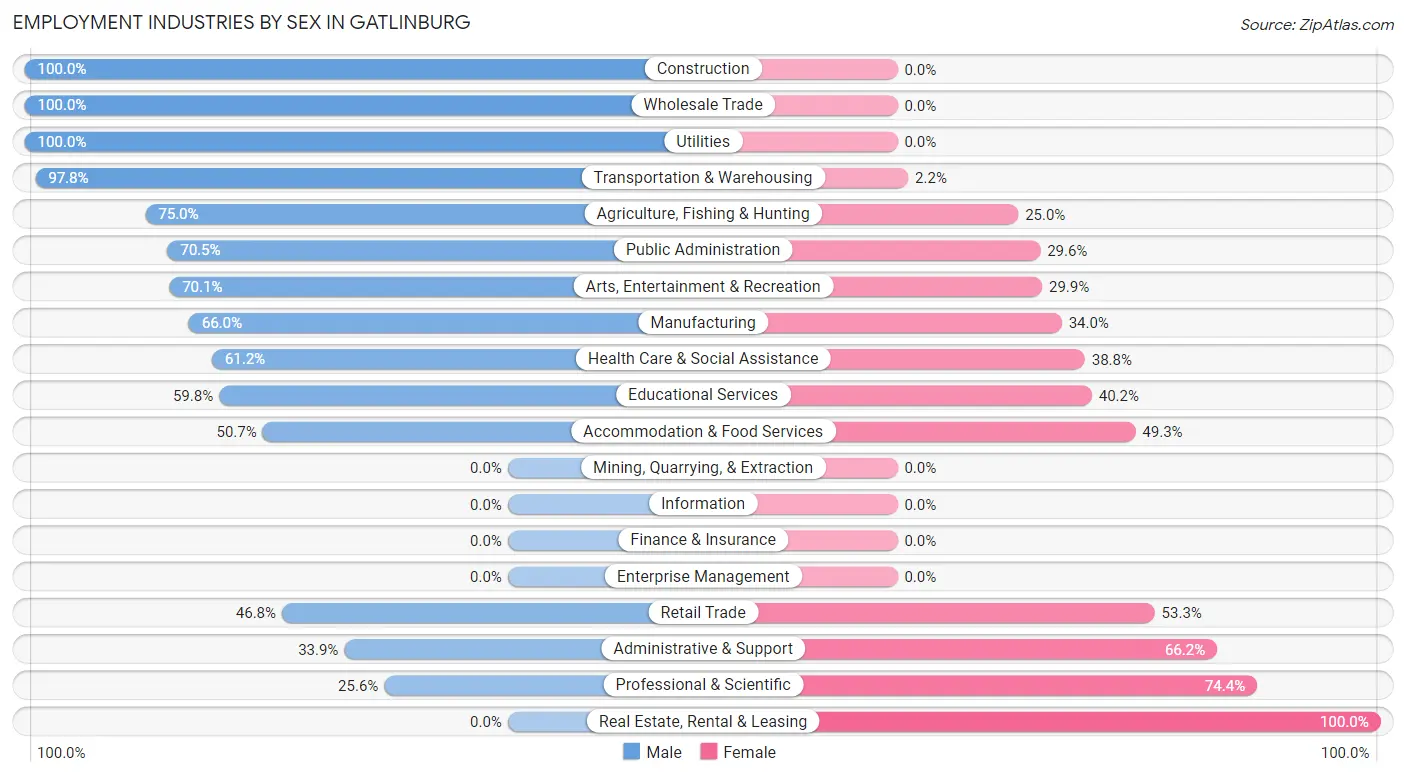
Employment Industries by Sex in Gatlinburg
The Gatlinburg industries that see more men than women are Construction (100.0%), Wholesale Trade (100.0%), and Utilities (100.0%), whereas the industries that tend to have a higher number of women are Real Estate, Rental & Leasing (100.0%), Professional & Scientific (74.4%), and Administrative & Support (66.1%).
| Industry | Male | Female |
| Agriculture, Fishing & Hunting | 21 (75.0%) | 7 (25.0%) |
| Mining, Quarrying, & Extraction | 0 (0.0%) | 0 (0.0%) |
| Construction | 54 (100.0%) | 0 (0.0%) |
| Manufacturing | 99 (66.0%) | 51 (34.0%) |
| Wholesale Trade | 8 (100.0%) | 0 (0.0%) |
| Retail Trade | 115 (46.8%) | 131 (53.2%) |
| Transportation & Warehousing | 44 (97.8%) | 1 (2.2%) |
| Utilities | 11 (100.0%) | 0 (0.0%) |
| Information | 0 (0.0%) | 0 (0.0%) |
| Finance & Insurance | 0 (0.0%) | 0 (0.0%) |
| Real Estate, Rental & Leasing | 0 (0.0%) | 22 (100.0%) |
| Professional & Scientific | 22 (25.6%) | 64 (74.4%) |
| Enterprise Management | 0 (0.0%) | 0 (0.0%) |
| Administrative & Support | 44 (33.9%) | 86 (66.1%) |
| Educational Services | 49 (59.8%) | 33 (40.2%) |
| Health Care & Social Assistance | 60 (61.2%) | 38 (38.8%) |
| Arts, Entertainment & Recreation | 124 (70.1%) | 53 (29.9%) |
| Accommodation & Food Services | 207 (50.7%) | 201 (49.3%) |
| Public Administration | 31 (70.5%) | 13 (29.5%) |
| Total | 902 (53.8%) | 773 (46.2%) |
Education in Gatlinburg
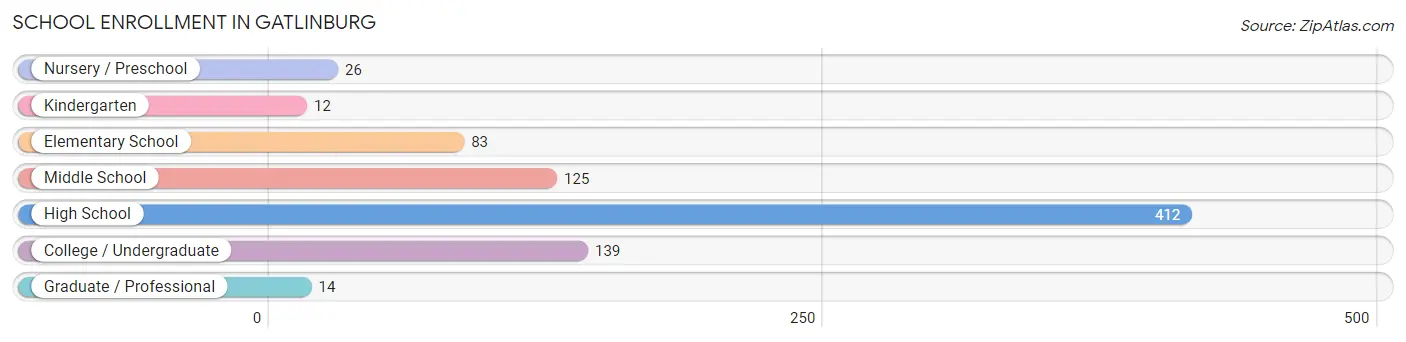
School Enrollment in Gatlinburg
The most common levels of schooling among the 811 students in Gatlinburg are high school (412 | 50.8%), college / undergraduate (139 | 17.1%), and middle school (125 | 15.4%).
| School Level | # Students | % Students |
| Nursery / Preschool | 26 | 3.2% |
| Kindergarten | 12 | 1.5% |
| Elementary School | 83 | 10.2% |
| Middle School | 125 | 15.4% |
| High School | 412 | 50.8% |
| College / Undergraduate | 139 | 17.1% |
| Graduate / Professional | 14 | 1.7% |
| Total | 811 | 100.0% |
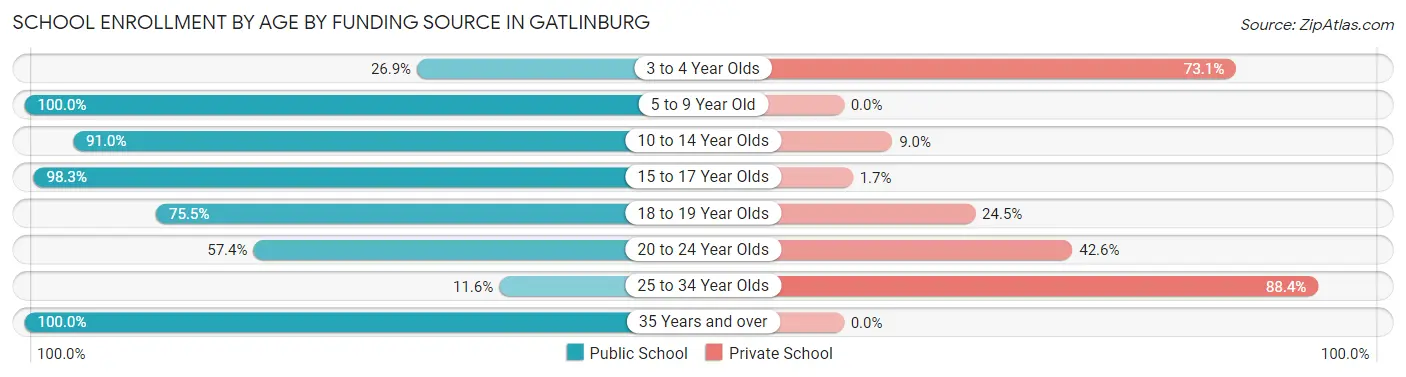
School Enrollment by Age by Funding Source in Gatlinburg
Out of a total of 811 students who are enrolled in schools in Gatlinburg, 113 (13.9%) attend a private institution, while the remaining 698 (86.1%) are enrolled in public schools. The age group of 25 to 34 year olds has the highest likelihood of being enrolled in private schools, with 38 (88.4% in the age bracket) enrolled. Conversely, the age group of 5 to 9 year old has the lowest likelihood of being enrolled in a private school, with 95 (100.0% in the age bracket) attending a public institution.
| Age Bracket | Public School | Private School |
| 3 to 4 Year Olds | 7 (26.9%) | 19 (73.1%) |
| 5 to 9 Year Old | 95 (100.0%) | 0 (0.0%) |
| 10 to 14 Year Olds | 151 (91.0%) | 15 (9.0%) |
| 15 to 17 Year Olds | 351 (98.3%) | 6 (1.7%) |
| 18 to 19 Year Olds | 37 (75.5%) | 12 (24.5%) |
| 20 to 24 Year Olds | 31 (57.4%) | 23 (42.6%) |
| 25 to 34 Year Olds | 5 (11.6%) | 38 (88.4%) |
| 35 Years and over | 21 (100.0%) | 0 (0.0%) |
| Total | 698 (86.1%) | 113 (13.9%) |
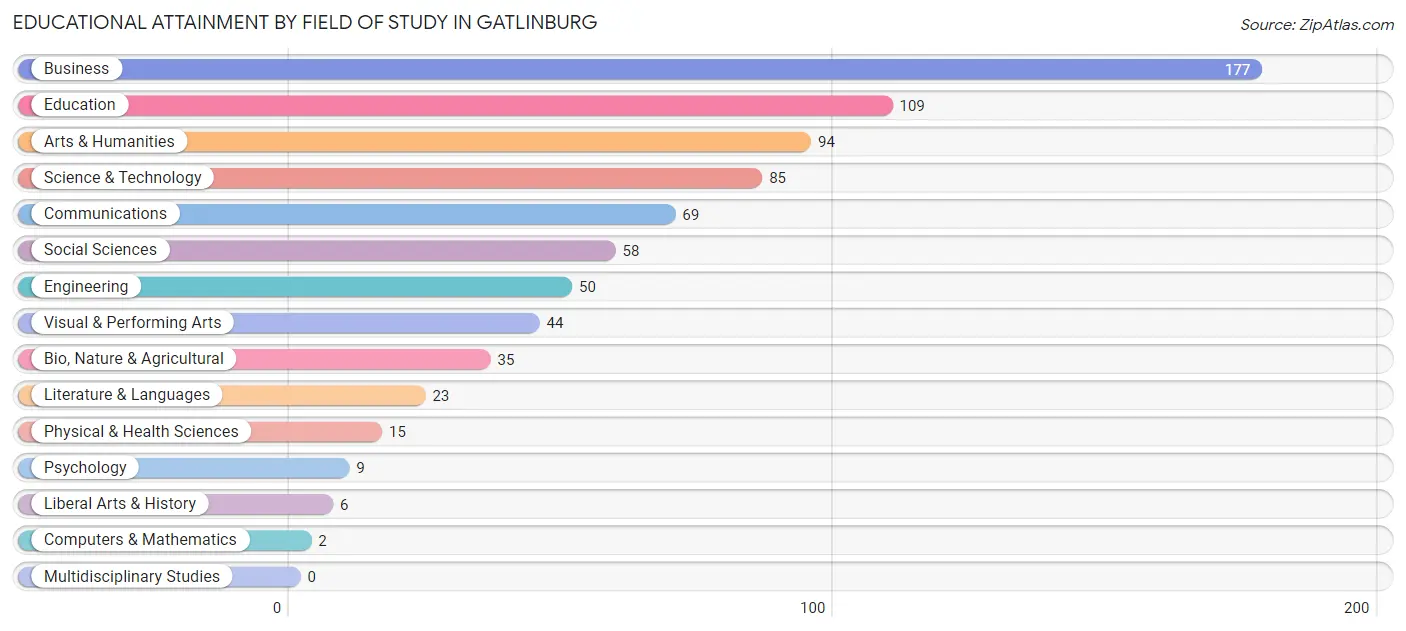
Educational Attainment by Field of Study in Gatlinburg
Business (177 | 22.8%), education (109 | 14.1%), arts & humanities (94 | 12.1%), science & technology (85 | 11.0%), and communications (69 | 8.9%) are the most common fields of study among 776 individuals in Gatlinburg who have obtained a bachelor's degree or higher.
| Field of Study | # Graduates | % Graduates |
| Computers & Mathematics | 2 | 0.3% |
| Bio, Nature & Agricultural | 35 | 4.5% |
| Physical & Health Sciences | 15 | 1.9% |
| Psychology | 9 | 1.2% |
| Social Sciences | 58 | 7.5% |
| Engineering | 50 | 6.4% |
| Multidisciplinary Studies | 0 | 0.0% |
| Science & Technology | 85 | 11.0% |
| Business | 177 | 22.8% |
| Education | 109 | 14.1% |
| Literature & Languages | 23 | 3.0% |
| Liberal Arts & History | 6 | 0.8% |
| Visual & Performing Arts | 44 | 5.7% |
| Communications | 69 | 8.9% |
| Arts & Humanities | 94 | 12.1% |
| Total | 776 | 100.0% |
Transportation & Commute in Gatlinburg
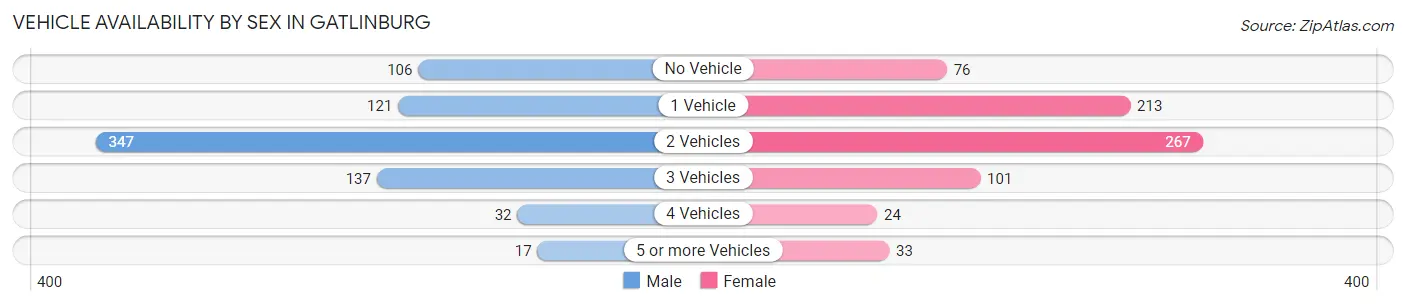
Vehicle Availability by Sex in Gatlinburg
The most prevalent vehicle ownership categories in Gatlinburg are males with 2 vehicles (347, accounting for 45.7%) and females with 2 vehicles (267, making up 48.6%).
| Vehicles Available | Male | Female |
| No Vehicle | 106 (14.0%) | 76 (10.6%) |
| 1 Vehicle | 121 (15.9%) | 213 (29.8%) |
| 2 Vehicles | 347 (45.7%) | 267 (37.4%) |
| 3 Vehicles | 137 (18.0%) | 101 (14.1%) |
| 4 Vehicles | 32 (4.2%) | 24 (3.4%) |
| 5 or more Vehicles | 17 (2.2%) | 33 (4.6%) |
| Total | 760 (100.0%) | 714 (100.0%) |
Commute Time in Gatlinburg
The most frequently occuring commute durations in Gatlinburg are 15 to 19 minutes (345 commuters, 22.4%), 10 to 14 minutes (328 commuters, 21.3%), and 5 to 9 minutes (260 commuters, 16.9%).
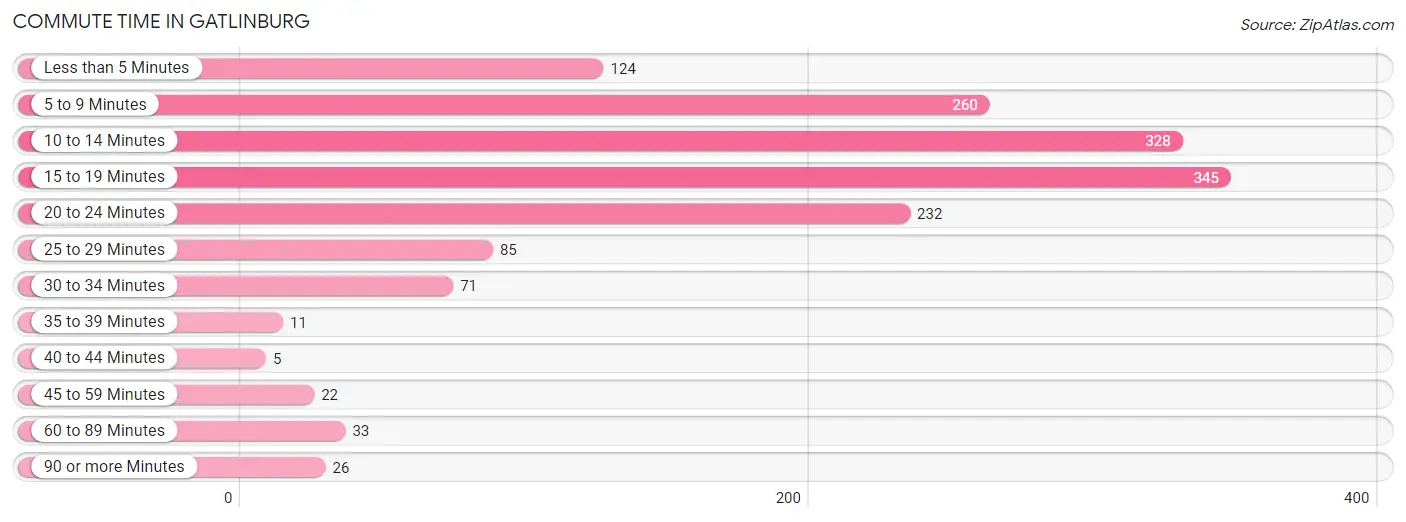
| Commute Time | # Commuters | % Commuters |
| Less than 5 Minutes | 124 | 8.0% |
| 5 to 9 Minutes | 260 | 16.9% |
| 10 to 14 Minutes | 328 | 21.3% |
| 15 to 19 Minutes | 345 | 22.4% |
| 20 to 24 Minutes | 232 | 15.0% |
| 25 to 29 Minutes | 85 | 5.5% |
| 30 to 34 Minutes | 71 | 4.6% |
| 35 to 39 Minutes | 11 | 0.7% |
| 40 to 44 Minutes | 5 | 0.3% |
| 45 to 59 Minutes | 22 | 1.4% |
| 60 to 89 Minutes | 33 | 2.1% |
| 90 or more Minutes | 26 | 1.7% |
Commute Time by Sex in Gatlinburg
The most common commute times in Gatlinburg are 5 to 9 minutes (203 commuters, 24.4%) for males and 15 to 19 minutes (180 commuters, 25.3%) for females.
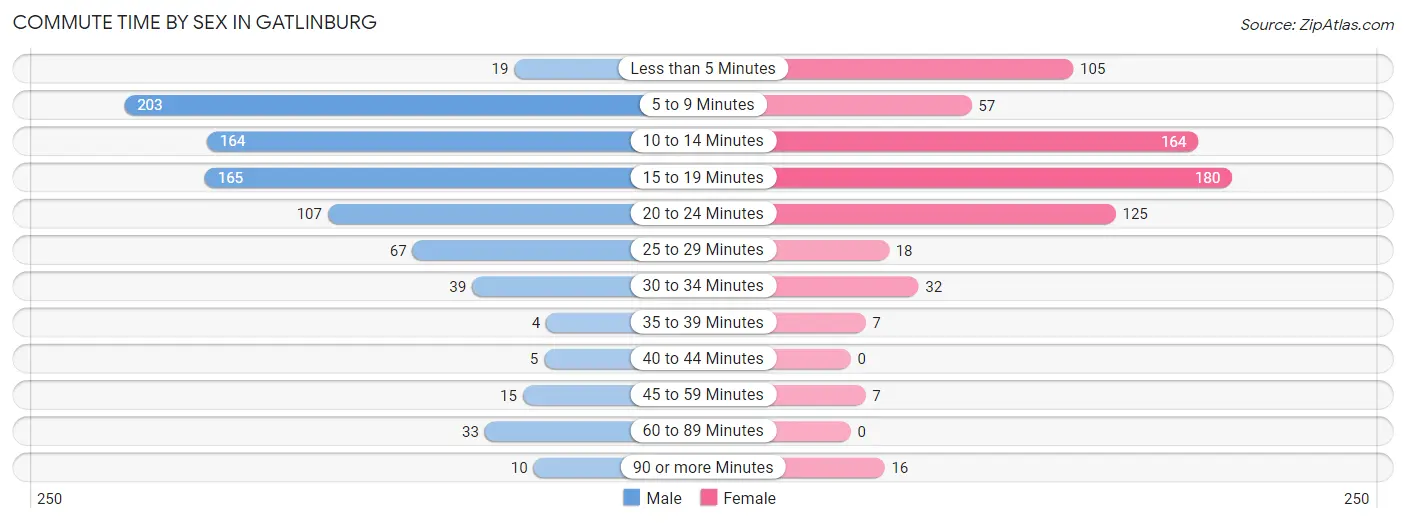
| Commute Time | Male | Female |
| Less than 5 Minutes | 19 (2.3%) | 105 (14.8%) |
| 5 to 9 Minutes | 203 (24.4%) | 57 (8.0%) |
| 10 to 14 Minutes | 164 (19.7%) | 164 (23.1%) |
| 15 to 19 Minutes | 165 (19.9%) | 180 (25.3%) |
| 20 to 24 Minutes | 107 (12.9%) | 125 (17.6%) |
| 25 to 29 Minutes | 67 (8.1%) | 18 (2.5%) |
| 30 to 34 Minutes | 39 (4.7%) | 32 (4.5%) |
| 35 to 39 Minutes | 4 (0.5%) | 7 (1.0%) |
| 40 to 44 Minutes | 5 (0.6%) | 0 (0.0%) |
| 45 to 59 Minutes | 15 (1.8%) | 7 (1.0%) |
| 60 to 89 Minutes | 33 (4.0%) | 0 (0.0%) |
| 90 or more Minutes | 10 (1.2%) | 16 (2.2%) |
Time of Departure to Work by Sex in Gatlinburg
The most frequent times of departure to work in Gatlinburg are 12:00 PM to 3:59 PM (116, 14.0%) for males and 8:00 AM to 8:29 AM (118, 16.6%) for females.
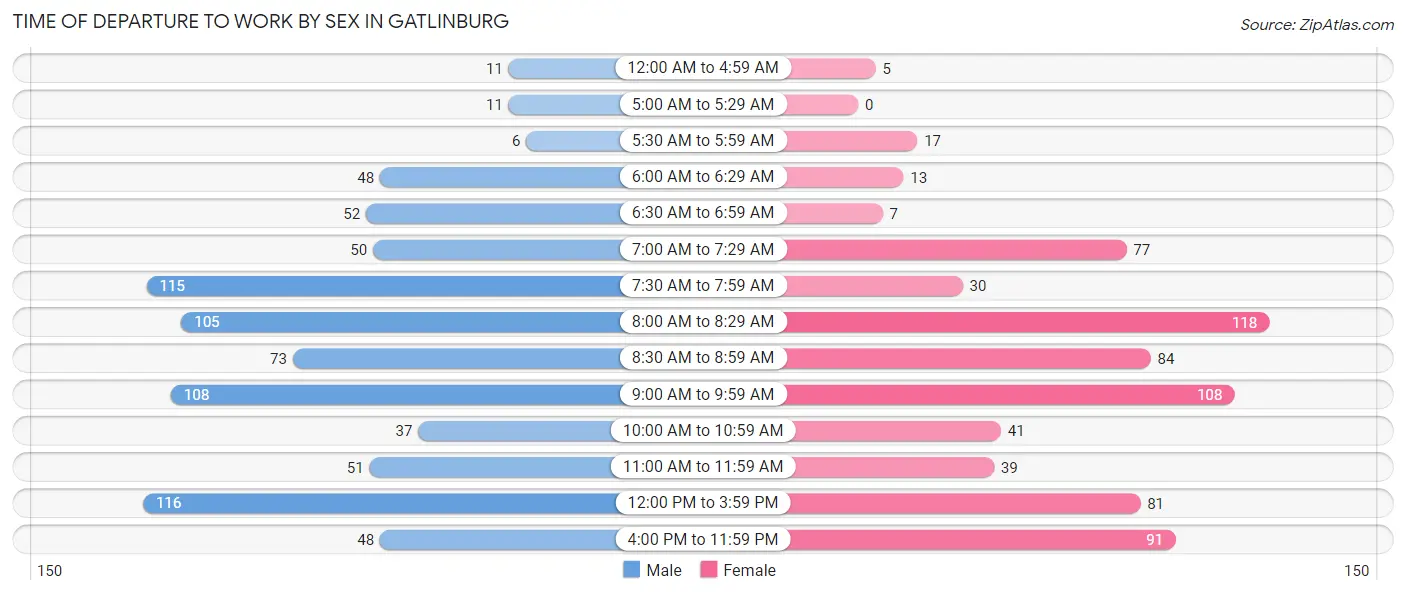
| Time of Departure | Male | Female |
| 12:00 AM to 4:59 AM | 11 (1.3%) | 5 (0.7%) |
| 5:00 AM to 5:29 AM | 11 (1.3%) | 0 (0.0%) |
| 5:30 AM to 5:59 AM | 6 (0.7%) | 17 (2.4%) |
| 6:00 AM to 6:29 AM | 48 (5.8%) | 13 (1.8%) |
| 6:30 AM to 6:59 AM | 52 (6.3%) | 7 (1.0%) |
| 7:00 AM to 7:29 AM | 50 (6.0%) | 77 (10.8%) |
| 7:30 AM to 7:59 AM | 115 (13.8%) | 30 (4.2%) |
| 8:00 AM to 8:29 AM | 105 (12.6%) | 118 (16.6%) |
| 8:30 AM to 8:59 AM | 73 (8.8%) | 84 (11.8%) |
| 9:00 AM to 9:59 AM | 108 (13.0%) | 108 (15.2%) |
| 10:00 AM to 10:59 AM | 37 (4.4%) | 41 (5.8%) |
| 11:00 AM to 11:59 AM | 51 (6.1%) | 39 (5.5%) |
| 12:00 PM to 3:59 PM | 116 (14.0%) | 81 (11.4%) |
| 4:00 PM to 11:59 PM | 48 (5.8%) | 91 (12.8%) |
| Total | 831 (100.0%) | 711 (100.0%) |
Housing Occupancy in Gatlinburg
Occupancy by Ownership in Gatlinburg
Of the total 1,383 dwellings in Gatlinburg, owner-occupied units account for 966 (69.9%), while renter-occupied units make up 417 (30.1%).
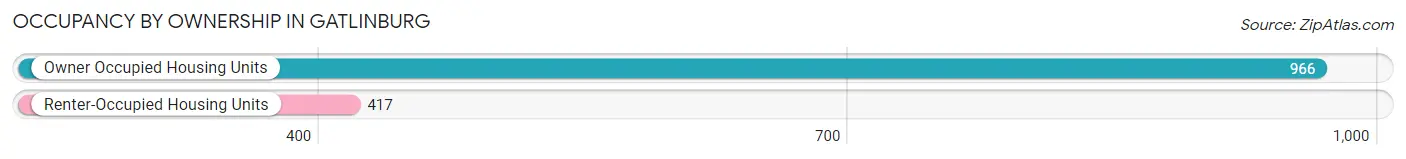
| Occupancy | # Housing Units | % Housing Units |
| Owner Occupied Housing Units | 966 | 69.9% |
| Renter-Occupied Housing Units | 417 | 30.1% |
| Total Occupied Housing Units | 1,383 | 100.0% |
Occupancy by Household Size in Gatlinburg
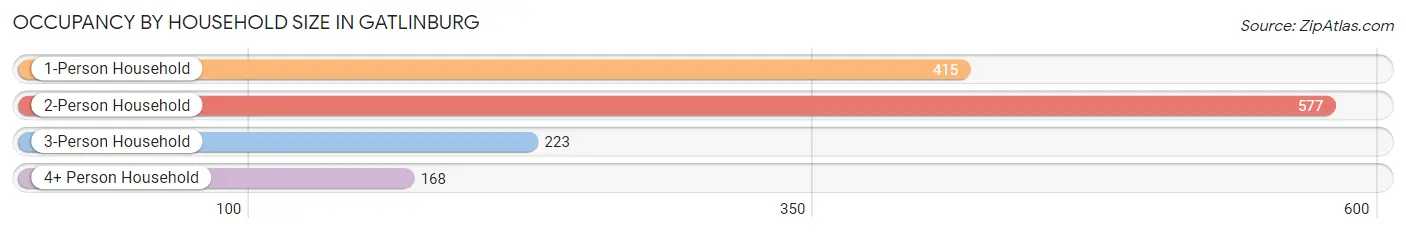
| Household Size | # Housing Units | % Housing Units |
| 1-Person Household | 415 | 30.0% |
| 2-Person Household | 577 | 41.7% |
| 3-Person Household | 223 | 16.1% |
| 4+ Person Household | 168 | 12.1% |
| Total Housing Units | 1,383 | 100.0% |
Occupancy by Ownership by Household Size in Gatlinburg
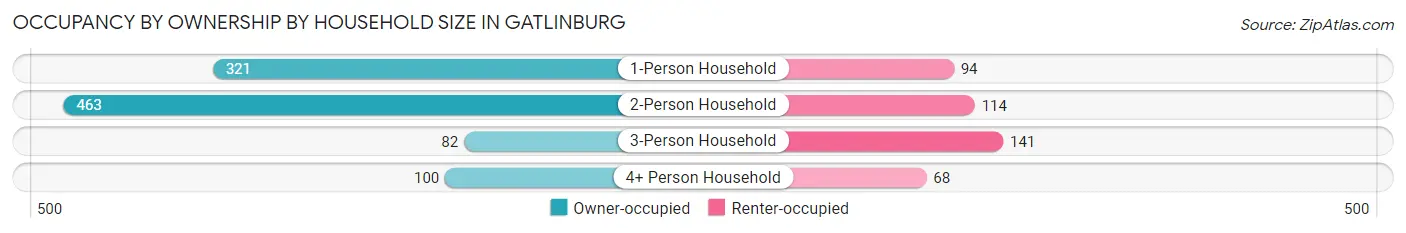
| Household Size | Owner-occupied | Renter-occupied |
| 1-Person Household | 321 (77.3%) | 94 (22.7%) |
| 2-Person Household | 463 (80.2%) | 114 (19.8%) |
| 3-Person Household | 82 (36.8%) | 141 (63.2%) |
| 4+ Person Household | 100 (59.5%) | 68 (40.5%) |
| Total Housing Units | 966 (69.9%) | 417 (30.1%) |
Occupancy by Educational Attainment in Gatlinburg
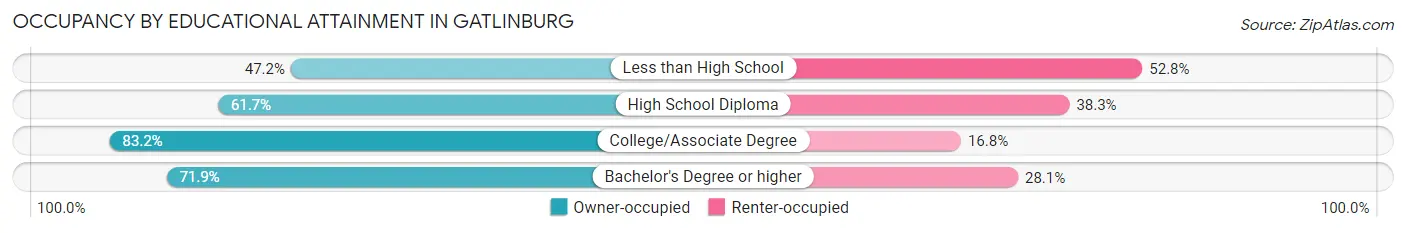
| Household Size | Owner-occupied | Renter-occupied |
| Less than High School | 85 (47.2%) | 95 (52.8%) |
| High School Diploma | 206 (61.7%) | 128 (38.3%) |
| College/Associate Degree | 371 (83.2%) | 75 (16.8%) |
| Bachelor's Degree or higher | 304 (71.9%) | 119 (28.1%) |
Occupancy by Age of Householder in Gatlinburg
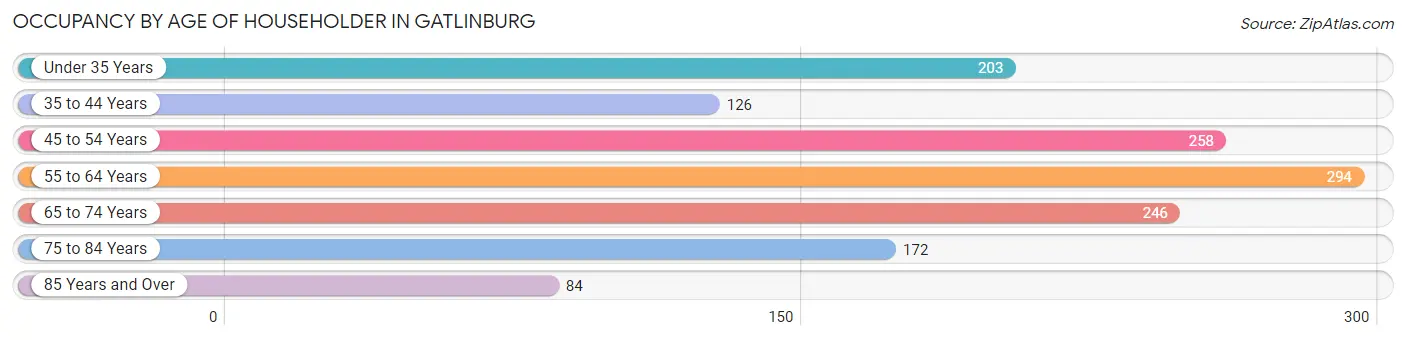
| Age Bracket | # Households | % Households |
| Under 35 Years | 203 | 14.7% |
| 35 to 44 Years | 126 | 9.1% |
| 45 to 54 Years | 258 | 18.7% |
| 55 to 64 Years | 294 | 21.3% |
| 65 to 74 Years | 246 | 17.8% |
| 75 to 84 Years | 172 | 12.4% |
| 85 Years and Over | 84 | 6.1% |
| Total | 1,383 | 100.0% |
Housing Finances in Gatlinburg
Median Income by Occupancy in Gatlinburg
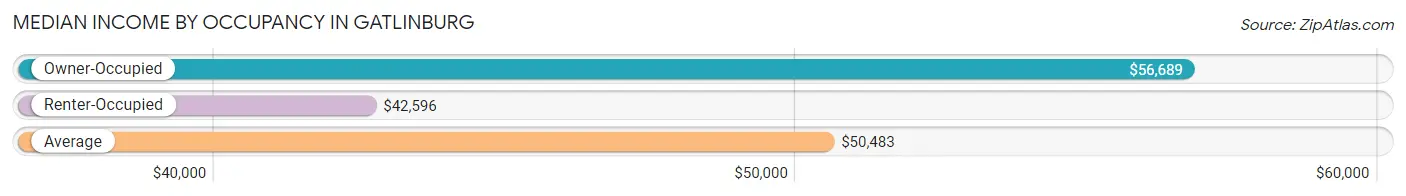
| Occupancy Type | # Households | Median Income |
| Owner-Occupied | 966 (69.9%) | $56,689 |
| Renter-Occupied | 417 (30.1%) | $42,596 |
| Average | 1,383 (100.0%) | $50,483 |
Occupancy by Householder Income Bracket in Gatlinburg
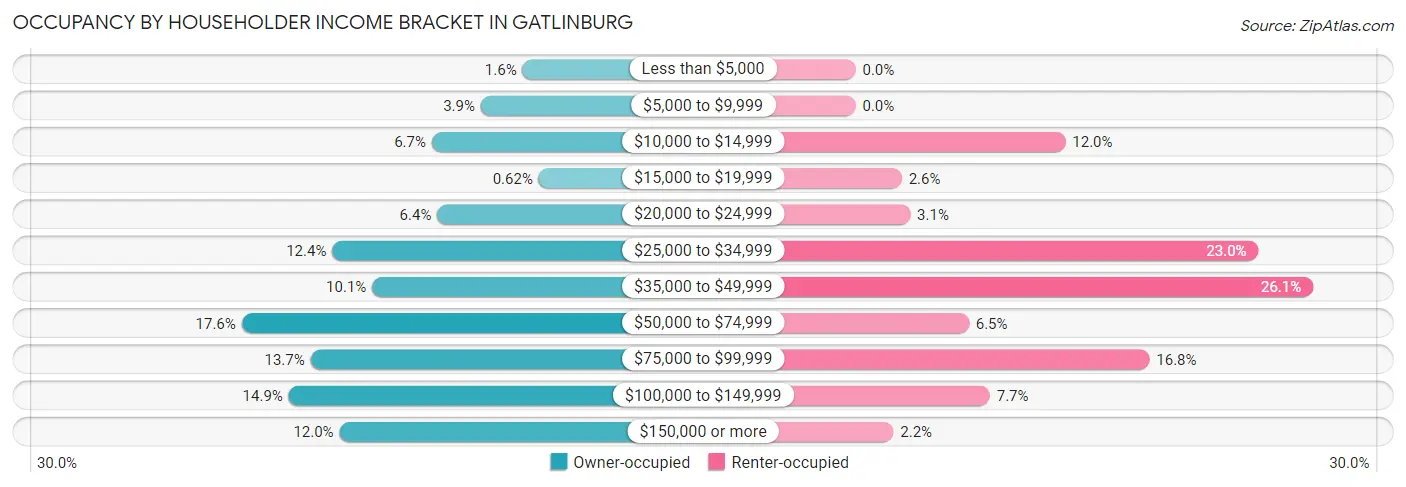
| Income Bracket | Owner-occupied | Renter-occupied |
| Less than $5,000 | 15 (1.5%) | 0 (0.0%) |
| $5,000 to $9,999 | 38 (3.9%) | 0 (0.0%) |
| $10,000 to $14,999 | 65 (6.7%) | 50 (12.0%) |
| $15,000 to $19,999 | 6 (0.6%) | 11 (2.6%) |
| $20,000 to $24,999 | 62 (6.4%) | 13 (3.1%) |
| $25,000 to $34,999 | 120 (12.4%) | 96 (23.0%) |
| $35,000 to $49,999 | 98 (10.1%) | 109 (26.1%) |
| $50,000 to $74,999 | 170 (17.6%) | 27 (6.5%) |
| $75,000 to $99,999 | 132 (13.7%) | 70 (16.8%) |
| $100,000 to $149,999 | 144 (14.9%) | 32 (7.7%) |
| $150,000 or more | 116 (12.0%) | 9 (2.2%) |
| Total | 966 (100.0%) | 417 (100.0%) |
Monthly Housing Cost Tiers in Gatlinburg
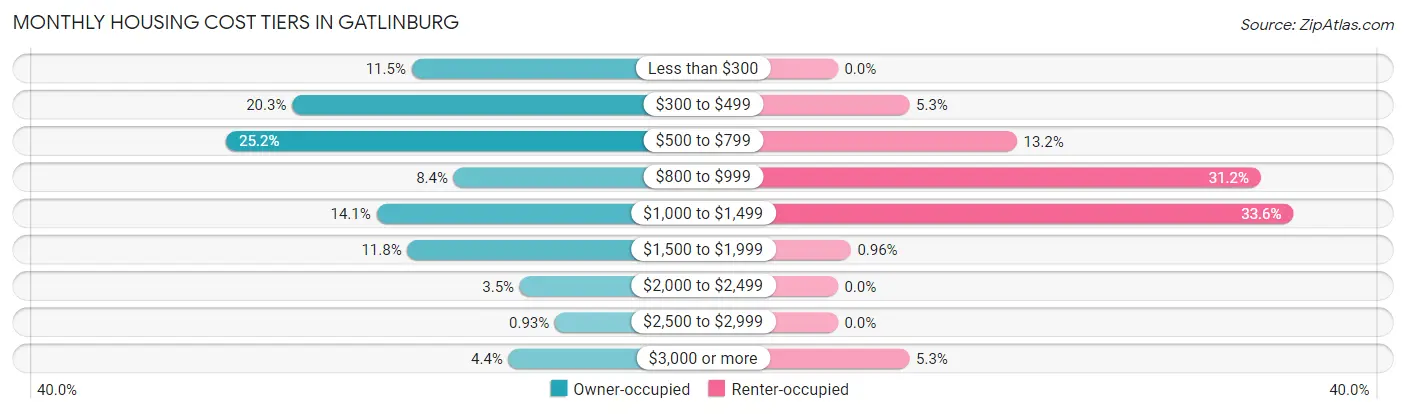
| Monthly Cost | Owner-occupied | Renter-occupied |
| Less than $300 | 111 (11.5%) | 0 (0.0%) |
| $300 to $499 | 196 (20.3%) | 22 (5.3%) |
| $500 to $799 | 243 (25.2%) | 55 (13.2%) |
| $800 to $999 | 81 (8.4%) | 130 (31.2%) |
| $1,000 to $1,499 | 136 (14.1%) | 140 (33.6%) |
| $1,500 to $1,999 | 114 (11.8%) | 4 (1.0%) |
| $2,000 to $2,499 | 34 (3.5%) | 0 (0.0%) |
| $2,500 to $2,999 | 9 (0.9%) | 0 (0.0%) |
| $3,000 or more | 42 (4.3%) | 22 (5.3%) |
| Total | 966 (100.0%) | 417 (100.0%) |
Physical Housing Characteristics in Gatlinburg
Housing Structures in Gatlinburg
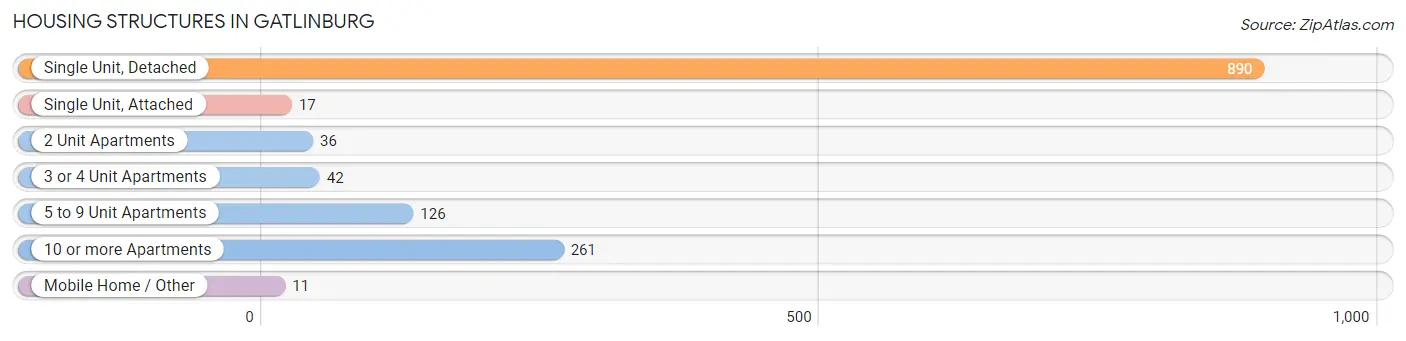
| Structure Type | # Housing Units | % Housing Units |
| Single Unit, Detached | 890 | 64.3% |
| Single Unit, Attached | 17 | 1.2% |
| 2 Unit Apartments | 36 | 2.6% |
| 3 or 4 Unit Apartments | 42 | 3.0% |
| 5 to 9 Unit Apartments | 126 | 9.1% |
| 10 or more Apartments | 261 | 18.9% |
| Mobile Home / Other | 11 | 0.8% |
| Total | 1,383 | 100.0% |
Housing Structures by Occupancy in Gatlinburg
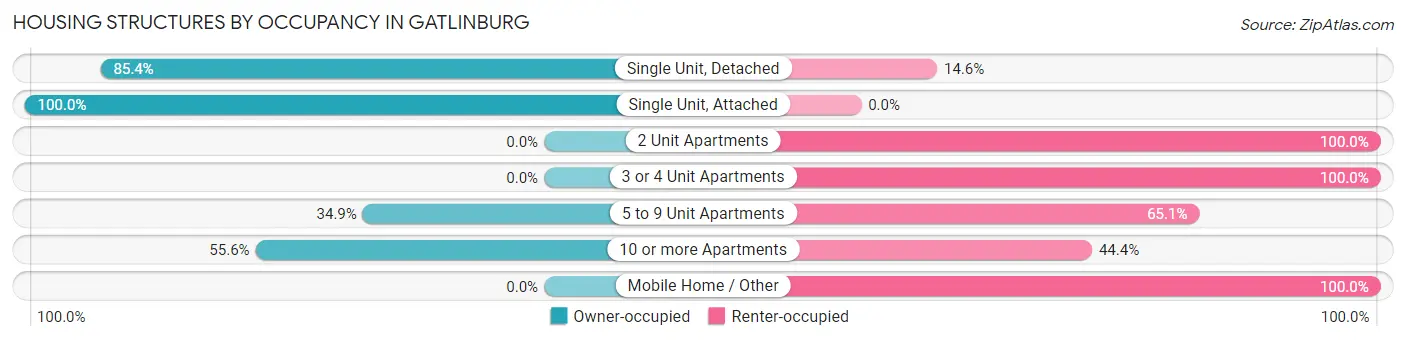
| Structure Type | Owner-occupied | Renter-occupied |
| Single Unit, Detached | 760 (85.4%) | 130 (14.6%) |
| Single Unit, Attached | 17 (100.0%) | 0 (0.0%) |
| 2 Unit Apartments | 0 (0.0%) | 36 (100.0%) |
| 3 or 4 Unit Apartments | 0 (0.0%) | 42 (100.0%) |
| 5 to 9 Unit Apartments | 44 (34.9%) | 82 (65.1%) |
| 10 or more Apartments | 145 (55.6%) | 116 (44.4%) |
| Mobile Home / Other | 0 (0.0%) | 11 (100.0%) |
| Total | 966 (69.9%) | 417 (30.1%) |
Housing Structures by Number of Rooms in Gatlinburg
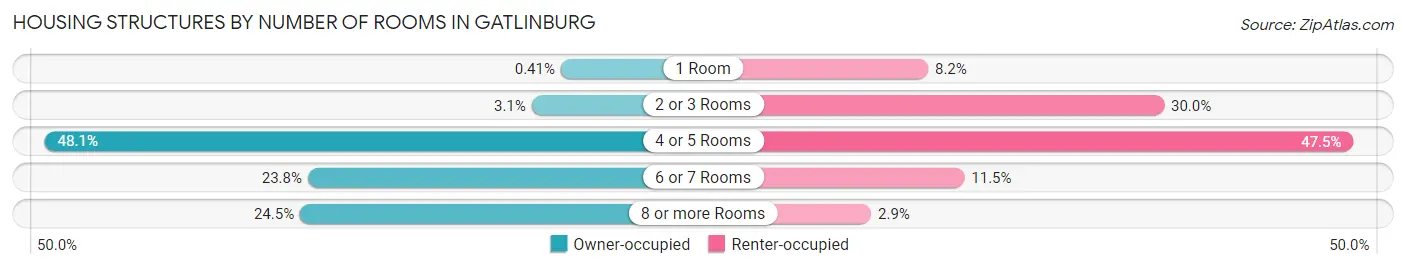
| Number of Rooms | Owner-occupied | Renter-occupied |
| 1 Room | 4 (0.4%) | 34 (8.2%) |
| 2 or 3 Rooms | 30 (3.1%) | 125 (30.0%) |
| 4 or 5 Rooms | 465 (48.1%) | 198 (47.5%) |
| 6 or 7 Rooms | 230 (23.8%) | 48 (11.5%) |
| 8 or more Rooms | 237 (24.5%) | 12 (2.9%) |
| Total | 966 (100.0%) | 417 (100.0%) |
Housing Structure by Heating Type in Gatlinburg
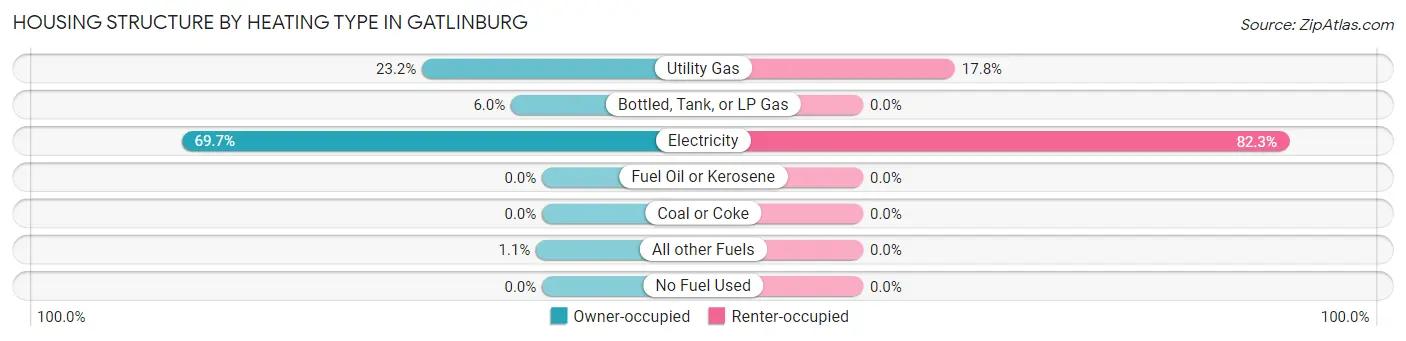
| Heating Type | Owner-occupied | Renter-occupied |
| Utility Gas | 224 (23.2%) | 74 (17.7%) |
| Bottled, Tank, or LP Gas | 58 (6.0%) | 0 (0.0%) |
| Electricity | 673 (69.7%) | 343 (82.3%) |
| Fuel Oil or Kerosene | 0 (0.0%) | 0 (0.0%) |
| Coal or Coke | 0 (0.0%) | 0 (0.0%) |
| All other Fuels | 11 (1.1%) | 0 (0.0%) |
| No Fuel Used | 0 (0.0%) | 0 (0.0%) |
| Total | 966 (100.0%) | 417 (100.0%) |
Household Vehicle Usage in Gatlinburg
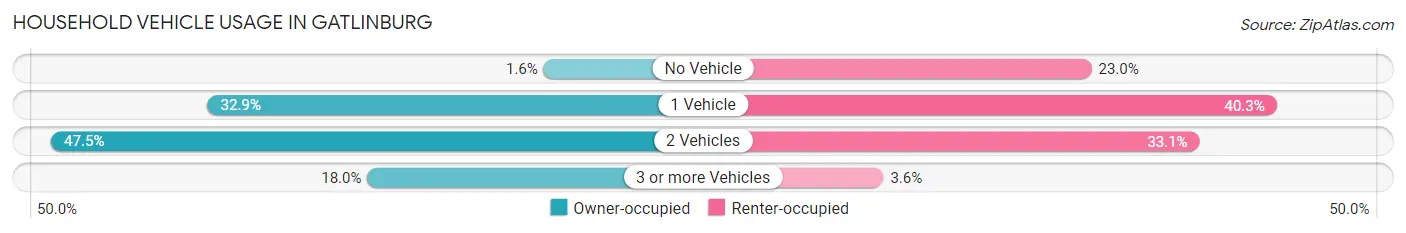
| Vehicles per Household | Owner-occupied | Renter-occupied |
| No Vehicle | 15 (1.5%) | 96 (23.0%) |
| 1 Vehicle | 318 (32.9%) | 168 (40.3%) |
| 2 Vehicles | 459 (47.5%) | 138 (33.1%) |
| 3 or more Vehicles | 174 (18.0%) | 15 (3.6%) |
| Total | 966 (100.0%) | 417 (100.0%) |
Real Estate & Mortgages in Gatlinburg
Real Estate and Mortgage Overview in Gatlinburg
| Characteristic | Without Mortgage | With Mortgage |
| Housing Units | 490 | 476 |
| Median Property Value | $273,600 | $281,700 |
| Median Household Income | $55,000 | $60 |
| Monthly Housing Costs | $415 | $42 |
| Real Estate Taxes | $743 | $20 |
Property Value by Mortgage Status in Gatlinburg
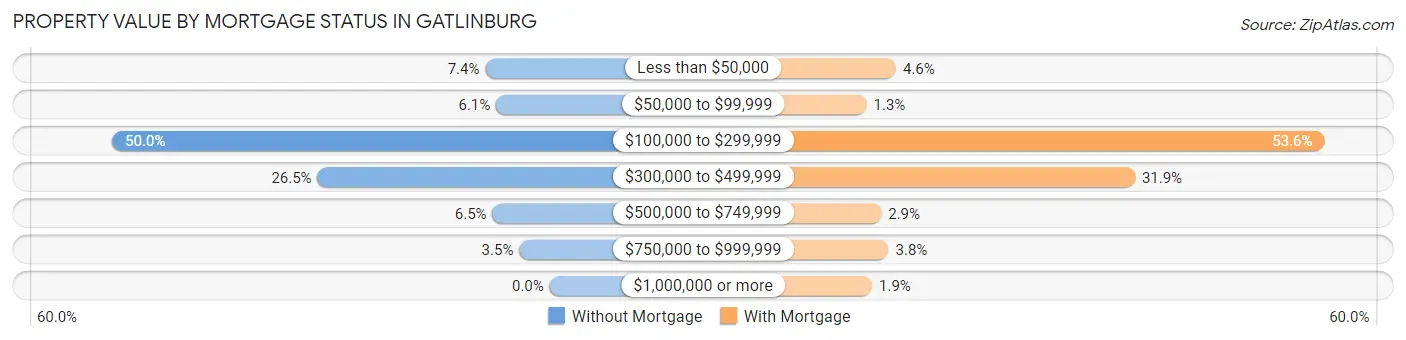
| Property Value | Without Mortgage | With Mortgage |
| Less than $50,000 | 36 (7.3%) | 22 (4.6%) |
| $50,000 to $99,999 | 30 (6.1%) | 6 (1.3%) |
| $100,000 to $299,999 | 245 (50.0%) | 255 (53.6%) |
| $300,000 to $499,999 | 130 (26.5%) | 152 (31.9%) |
| $500,000 to $749,999 | 32 (6.5%) | 14 (2.9%) |
| $750,000 to $999,999 | 17 (3.5%) | 18 (3.8%) |
| $1,000,000 or more | 0 (0.0%) | 9 (1.9%) |
| Total | 490 (100.0%) | 476 (100.0%) |
Household Income by Mortgage Status in Gatlinburg
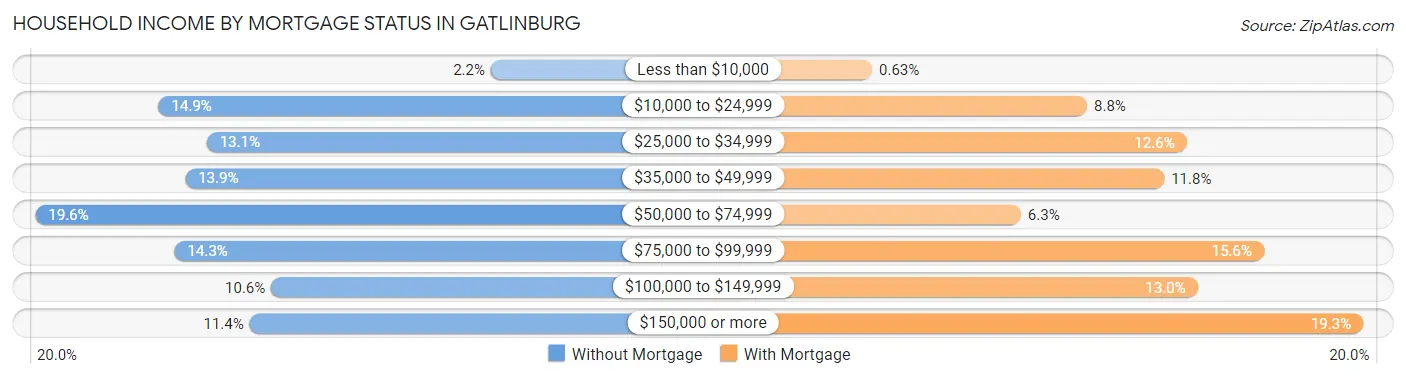
| Household Income | Without Mortgage | With Mortgage |
| Less than $10,000 | 11 (2.2%) | 3 (0.6%) |
| $10,000 to $24,999 | 73 (14.9%) | 42 (8.8%) |
| $25,000 to $34,999 | 64 (13.1%) | 60 (12.6%) |
| $35,000 to $49,999 | 68 (13.9%) | 56 (11.8%) |
| $50,000 to $74,999 | 96 (19.6%) | 30 (6.3%) |
| $75,000 to $99,999 | 70 (14.3%) | 74 (15.5%) |
| $100,000 to $149,999 | 52 (10.6%) | 62 (13.0%) |
| $150,000 or more | 56 (11.4%) | 92 (19.3%) |
| Total | 490 (100.0%) | 476 (100.0%) |
Property Value to Household Income Ratio in Gatlinburg
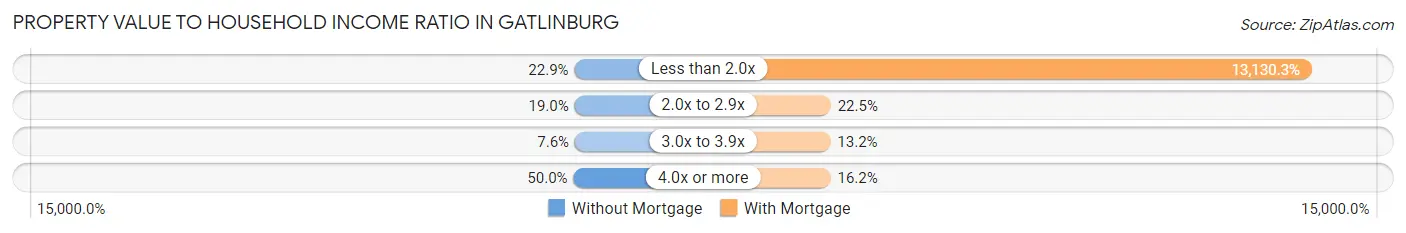
| Value-to-Income Ratio | Without Mortgage | With Mortgage |
| Less than 2.0x | 112 (22.9%) | 62,500 (13,130.3%) |
| 2.0x to 2.9x | 93 (19.0%) | 107 (22.5%) |
| 3.0x to 3.9x | 37 (7.5%) | 63 (13.2%) |
| 4.0x or more | 245 (50.0%) | 77 (16.2%) |
| Total | 490 (100.0%) | 476 (100.0%) |
Real Estate Taxes by Mortgage Status in Gatlinburg
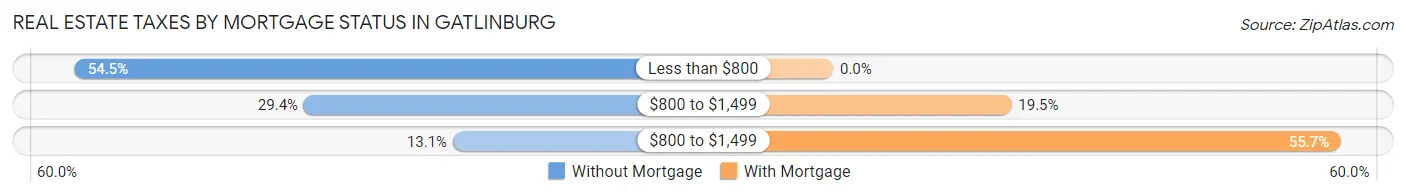
| Property Taxes | Without Mortgage | With Mortgage |
| Less than $800 | 267 (54.5%) | 0 (0.0%) |
| $800 to $1,499 | 144 (29.4%) | 93 (19.5%) |
| $800 to $1,499 | 64 (13.1%) | 265 (55.7%) |
| Total | 490 (100.0%) | 476 (100.0%) |
Health & Disability in Gatlinburg
Health Insurance Coverage by Age in Gatlinburg
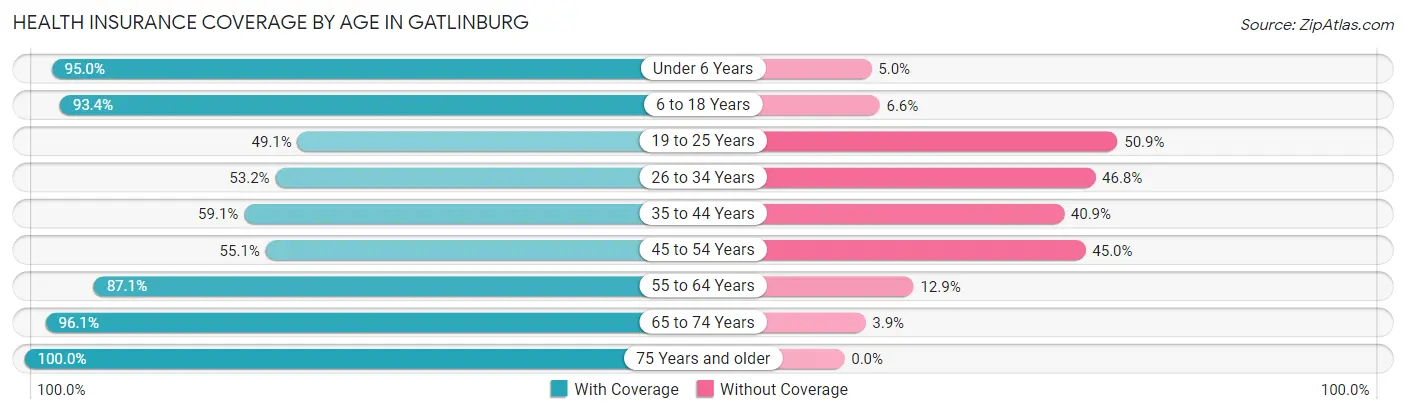
| Age Bracket | With Coverage | Without Coverage |
| Under 6 Years | 132 (95.0%) | 7 (5.0%) |
| 6 to 18 Years | 640 (93.4%) | 45 (6.6%) |
| 19 to 25 Years | 108 (49.1%) | 112 (50.9%) |
| 26 to 34 Years | 272 (53.2%) | 239 (46.8%) |
| 35 to 44 Years | 176 (59.1%) | 122 (40.9%) |
| 45 to 54 Years | 256 (55.0%) | 209 (45.0%) |
| 55 to 64 Years | 439 (87.1%) | 65 (12.9%) |
| 65 to 74 Years | 441 (96.1%) | 18 (3.9%) |
| 75 Years and older | 355 (100.0%) | 0 (0.0%) |
| Total | 2,819 (77.5%) | 817 (22.5%) |
Health Insurance Coverage by Citizenship Status in Gatlinburg
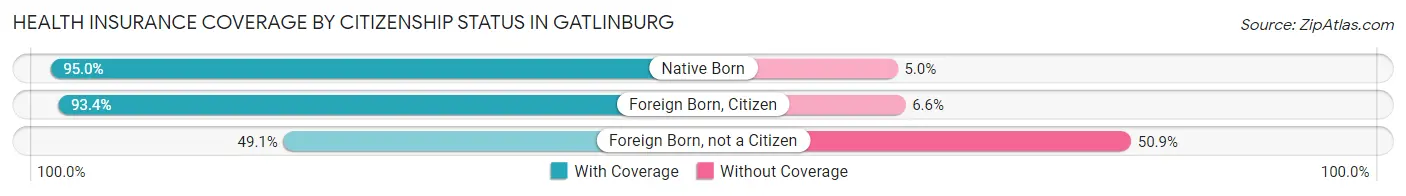
| Citizenship Status | With Coverage | Without Coverage |
| Native Born | 132 (95.0%) | 7 (5.0%) |
| Foreign Born, Citizen | 640 (93.4%) | 45 (6.6%) |
| Foreign Born, not a Citizen | 108 (49.1%) | 112 (50.9%) |
Health Insurance Coverage by Household Income in Gatlinburg
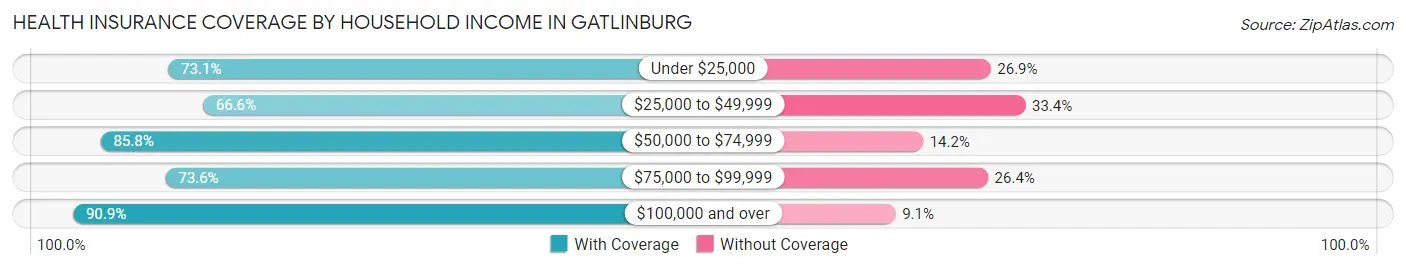
| Household Income | With Coverage | Without Coverage |
| Under $25,000 | 269 (73.1%) | 99 (26.9%) |
| $25,000 to $49,999 | 674 (66.6%) | 338 (33.4%) |
| $50,000 to $74,999 | 579 (85.8%) | 96 (14.2%) |
| $75,000 to $99,999 | 371 (73.6%) | 133 (26.4%) |
| $100,000 and over | 792 (90.9%) | 79 (9.1%) |
Public vs Private Health Insurance Coverage by Age in Gatlinburg
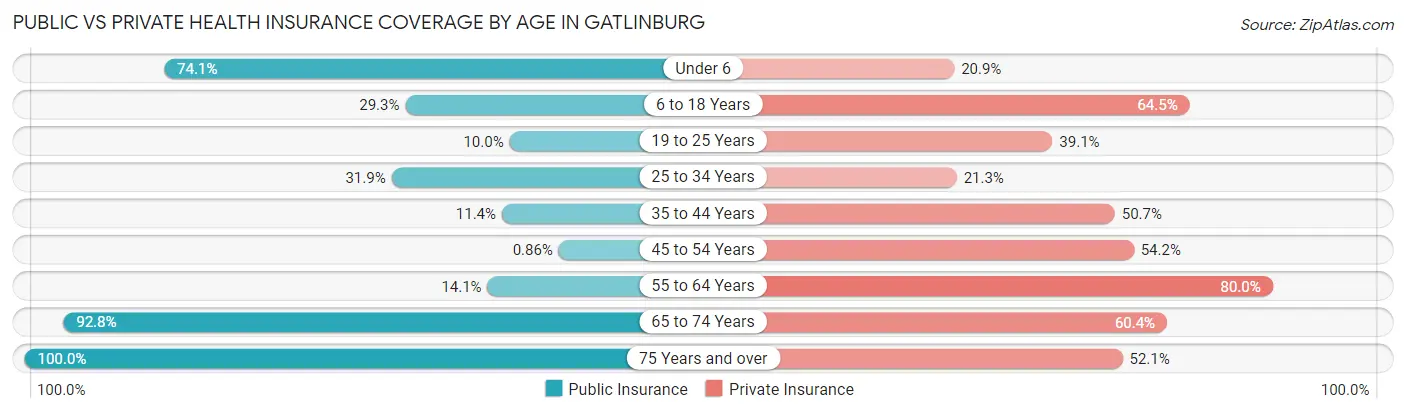
| Age Bracket | Public Insurance | Private Insurance |
| Under 6 | 103 (74.1%) | 29 (20.9%) |
| 6 to 18 Years | 201 (29.3%) | 442 (64.5%) |
| 19 to 25 Years | 22 (10.0%) | 86 (39.1%) |
| 25 to 34 Years | 163 (31.9%) | 109 (21.3%) |
| 35 to 44 Years | 34 (11.4%) | 151 (50.7%) |
| 45 to 54 Years | 4 (0.9%) | 252 (54.2%) |
| 55 to 64 Years | 71 (14.1%) | 403 (80.0%) |
| 65 to 74 Years | 426 (92.8%) | 277 (60.4%) |
| 75 Years and over | 355 (100.0%) | 185 (52.1%) |
| Total | 1,379 (37.9%) | 1,934 (53.2%) |
Disability Status by Sex by Age in Gatlinburg
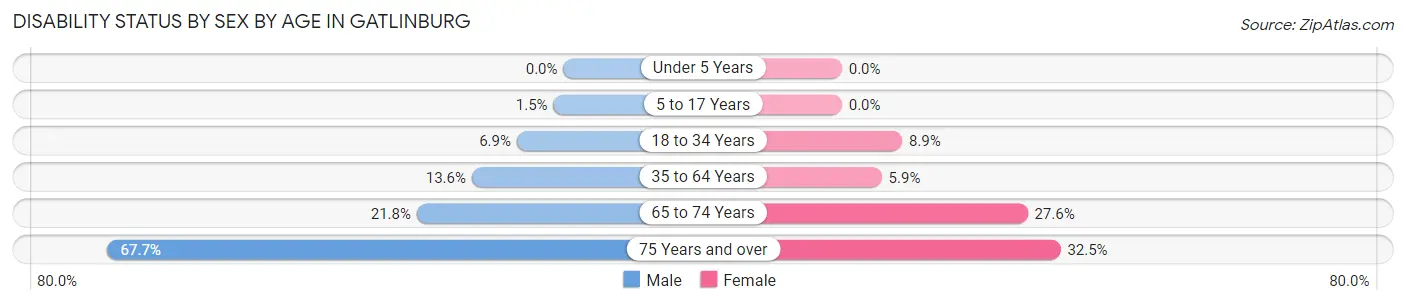
| Age Bracket | Male | Female |
| Under 5 Years | 0 (0.0%) | 0 (0.0%) |
| 5 to 17 Years | 7 (1.5%) | 0 (0.0%) |
| 18 to 34 Years | 26 (6.9%) | 35 (8.9%) |
| 35 to 64 Years | 85 (13.6%) | 38 (5.9%) |
| 65 to 74 Years | 47 (21.8%) | 67 (27.6%) |
| 75 Years and over | 136 (67.7%) | 50 (32.5%) |
Disability Class by Sex by Age in Gatlinburg
Disability Class: Hearing Difficulty
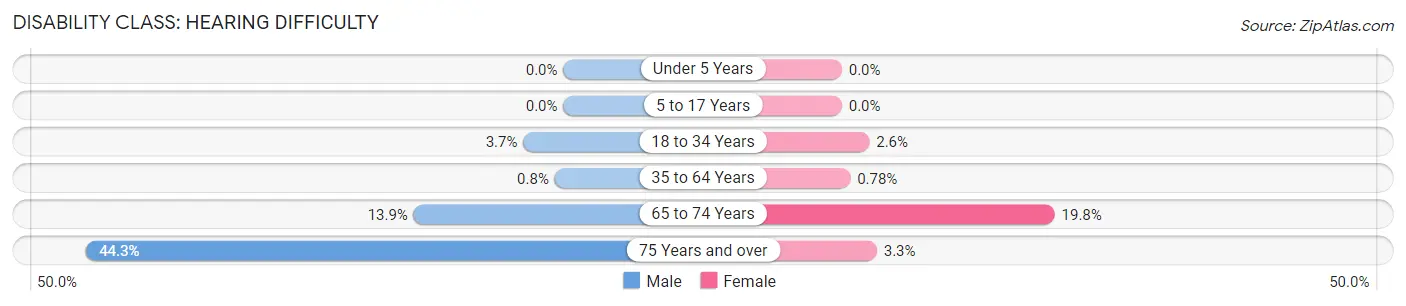
| Age Bracket | Male | Female |
| Under 5 Years | 0 (0.0%) | 0 (0.0%) |
| 5 to 17 Years | 0 (0.0%) | 0 (0.0%) |
| 18 to 34 Years | 14 (3.7%) | 10 (2.5%) |
| 35 to 64 Years | 5 (0.8%) | 5 (0.8%) |
| 65 to 74 Years | 30 (13.9%) | 48 (19.8%) |
| 75 Years and over | 89 (44.3%) | 5 (3.3%) |
Disability Class: Vision Difficulty
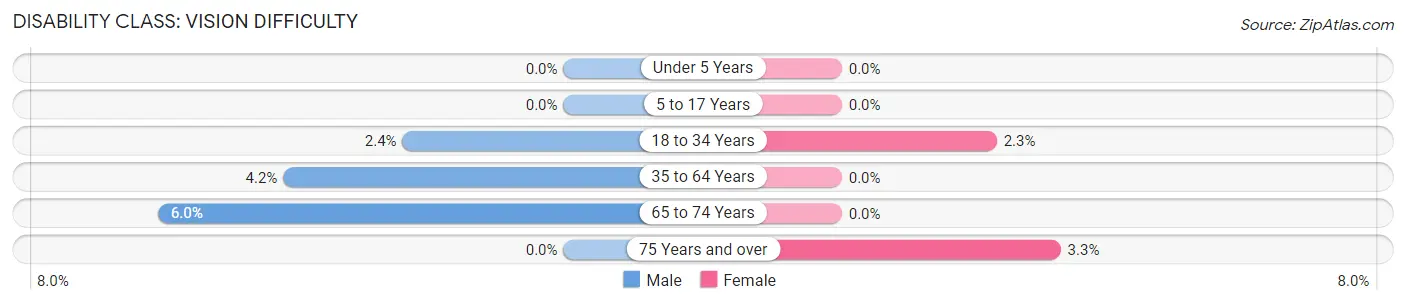
| Age Bracket | Male | Female |
| Under 5 Years | 0 (0.0%) | 0 (0.0%) |
| 5 to 17 Years | 0 (0.0%) | 0 (0.0%) |
| 18 to 34 Years | 9 (2.4%) | 9 (2.3%) |
| 35 to 64 Years | 26 (4.2%) | 0 (0.0%) |
| 65 to 74 Years | 13 (6.0%) | 0 (0.0%) |
| 75 Years and over | 0 (0.0%) | 5 (3.3%) |
Disability Class: Cognitive Difficulty
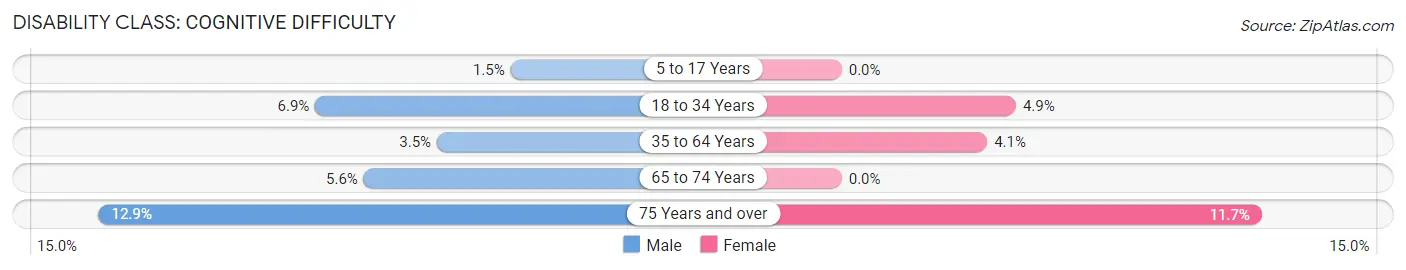
| Age Bracket | Male | Female |
| 5 to 17 Years | 7 (1.5%) | 0 (0.0%) |
| 18 to 34 Years | 26 (6.9%) | 19 (4.9%) |
| 35 to 64 Years | 22 (3.5%) | 26 (4.1%) |
| 65 to 74 Years | 12 (5.6%) | 0 (0.0%) |
| 75 Years and over | 26 (12.9%) | 18 (11.7%) |
Disability Class: Ambulatory Difficulty
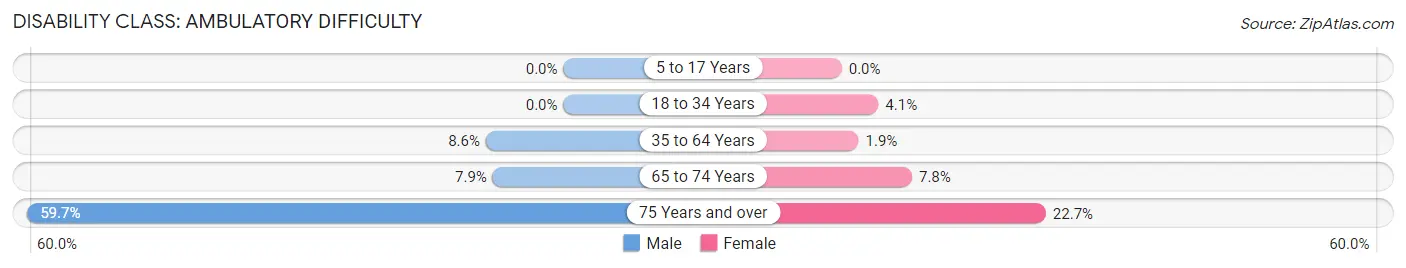
| Age Bracket | Male | Female |
| 5 to 17 Years | 0 (0.0%) | 0 (0.0%) |
| 18 to 34 Years | 0 (0.0%) | 16 (4.1%) |
| 35 to 64 Years | 54 (8.6%) | 12 (1.9%) |
| 65 to 74 Years | 17 (7.9%) | 19 (7.8%) |
| 75 Years and over | 120 (59.7%) | 35 (22.7%) |
Disability Class: Self-Care Difficulty
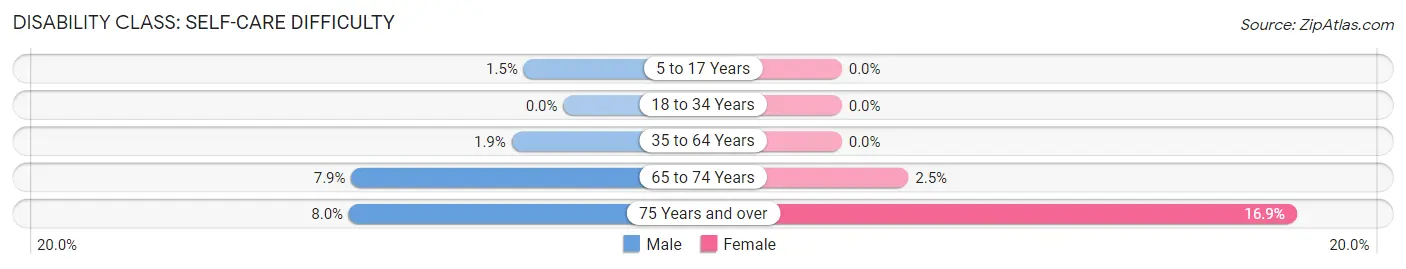
| Age Bracket | Male | Female |
| 5 to 17 Years | 7 (1.5%) | 0 (0.0%) |
| 18 to 34 Years | 0 (0.0%) | 0 (0.0%) |
| 35 to 64 Years | 12 (1.9%) | 0 (0.0%) |
| 65 to 74 Years | 17 (7.9%) | 6 (2.5%) |
| 75 Years and over | 16 (8.0%) | 26 (16.9%) |
Technology Access in Gatlinburg
Computing Device Access in Gatlinburg
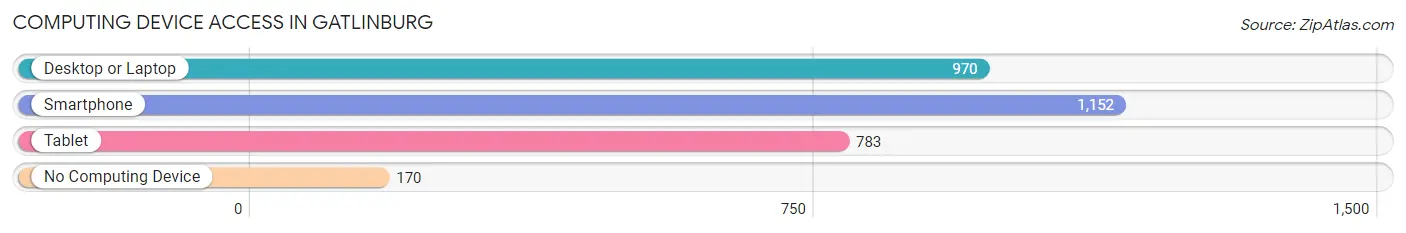
| Device Type | # Households | % Households |
| Desktop or Laptop | 970 | 70.1% |
| Smartphone | 1,152 | 83.3% |
| Tablet | 783 | 56.6% |
| No Computing Device | 170 | 12.3% |
| Total | 1,383 | 100.0% |
Internet Access in Gatlinburg
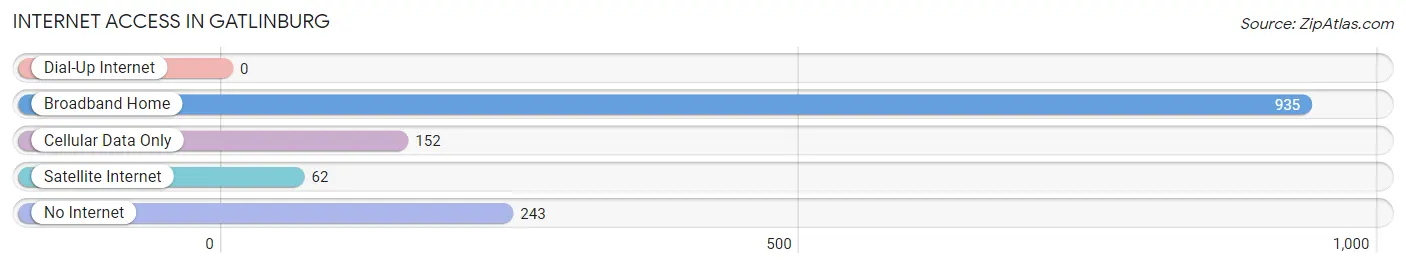
| Internet Type | # Households | % Households |
| Dial-Up Internet | 0 | 0.0% |
| Broadband Home | 935 | 67.6% |
| Cellular Data Only | 152 | 11.0% |
| Satellite Internet | 62 | 4.5% |
| No Internet | 243 | 17.6% |
| Total | 1,383 | 100.0% |
Gatlinburg Summary
Gatlinburg, Tennessee is a small mountain town located in the heart of the Great Smoky Mountains. It is situated in Sevier County, and is the gateway to the Great Smoky Mountains National Park. Gatlinburg is a popular tourist destination, and is known for its beautiful scenery, outdoor activities, and unique attractions.
Geography
Gatlinburg is located in the foothills of the Great Smoky Mountains, and is surrounded by the Cherokee National Forest. The town is situated at the confluence of the Little Pigeon River and the West Prong of the Little Pigeon River. The town is located at an elevation of 1,400 feet, and is surrounded by mountains that reach up to 6,000 feet. The town is located approximately 35 miles southeast of Knoxville, and is accessible by Interstate 40 and US Highway 441.
History
Gatlinburg was founded in 1807 by Radford Gatlin, who was a Revolutionary War veteran. The town was originally known as White Oak Flats, and was a small farming community. In the late 1800s, the town began to grow as a tourist destination, and was known for its beautiful scenery and outdoor activities. In the early 1900s, the town was incorporated and began to develop into a resort town. In the 1950s, the town began to expand and develop, and many of the attractions that are popular today were built.
Economy
Gatlinburg’s economy is largely based on tourism. The town is home to many attractions, including the Great Smoky Mountains National Park, Ober Gatlinburg Ski Resort, Ripley’s Aquarium of the Smokies, and the Gatlinburg Space Needle. The town is also home to many restaurants, shops, and hotels. In addition to tourism, Gatlinburg is also home to several manufacturing companies, including a paper mill and a furniture factory.
Demographics
As of the 2010 census, Gatlinburg had a population of 3,944. The population is predominantly white (93.3%), with a small percentage of African Americans (3.2%) and Hispanics (2.2%). The median household income is $37,813, and the median age is 44. The town is home to many retirees, and the median age of the population is higher than the national average.
Gatlinburg is a small mountain town with a rich history and a vibrant economy. The town is known for its beautiful scenery, outdoor activities, and unique attractions. The town is home to many retirees, and the median age of the population is higher than the national average. The town is also home to many manufacturing companies, and is a popular tourist destination.
Common Questions
What is Per Capita Income in Gatlinburg?
Per Capita income in Gatlinburg is $27,682.
What is the Median Family Income in Gatlinburg?
Median Family Income in Gatlinburg is $63,295.
What is the Median Household income in Gatlinburg?
Median Household Income in Gatlinburg is $50,483.
What is Income or Wage Gap in Gatlinburg?
Income or Wage Gap in Gatlinburg is 9.2%.
Women in Gatlinburg earn 90.8 cents for every dollar earned by a man.
What is Inequality or Gini Index in Gatlinburg?
Inequality or Gini Index in Gatlinburg is 0.43.
What is the Total Population of Gatlinburg?
Total Population of Gatlinburg is 3,636.
What is the Total Male Population of Gatlinburg?
Total Male Population of Gatlinburg is 1,918.
What is the Total Female Population of Gatlinburg?
Total Female Population of Gatlinburg is 1,718.
What is the Ratio of Males per 100 Females in Gatlinburg?
There are 111.64 Males per 100 Females in Gatlinburg.
What is the Ratio of Females per 100 Males in Gatlinburg?
There are 89.57 Females per 100 Males in Gatlinburg.
What is the Median Population Age in Gatlinburg?
Median Population Age in Gatlinburg is 44.2 Years.
What is the Average Family Size in Gatlinburg
Average Family Size in Gatlinburg is 3.2 People.
What is the Average Household Size in Gatlinburg
Average Household Size in Gatlinburg is 2.5 People.
How Large is the Labor Force in Gatlinburg?
There are 1,762 People in the Labor Forcein in Gatlinburg.
What is the Percentage of People in the Labor Force in Gatlinburg?
60.9% of People are in the Labor Force in Gatlinburg.
What is the Unemployment Rate in Gatlinburg?
Unemployment Rate in Gatlinburg is 5.0%.