Zip Codes with the Highest Percentage of Population Employed in Food Preparation & Serving in Nashville, TN
RELATED REPORTS & OPTIONS
Food Preparation & Serving
Nashville
Compare Zip Codes
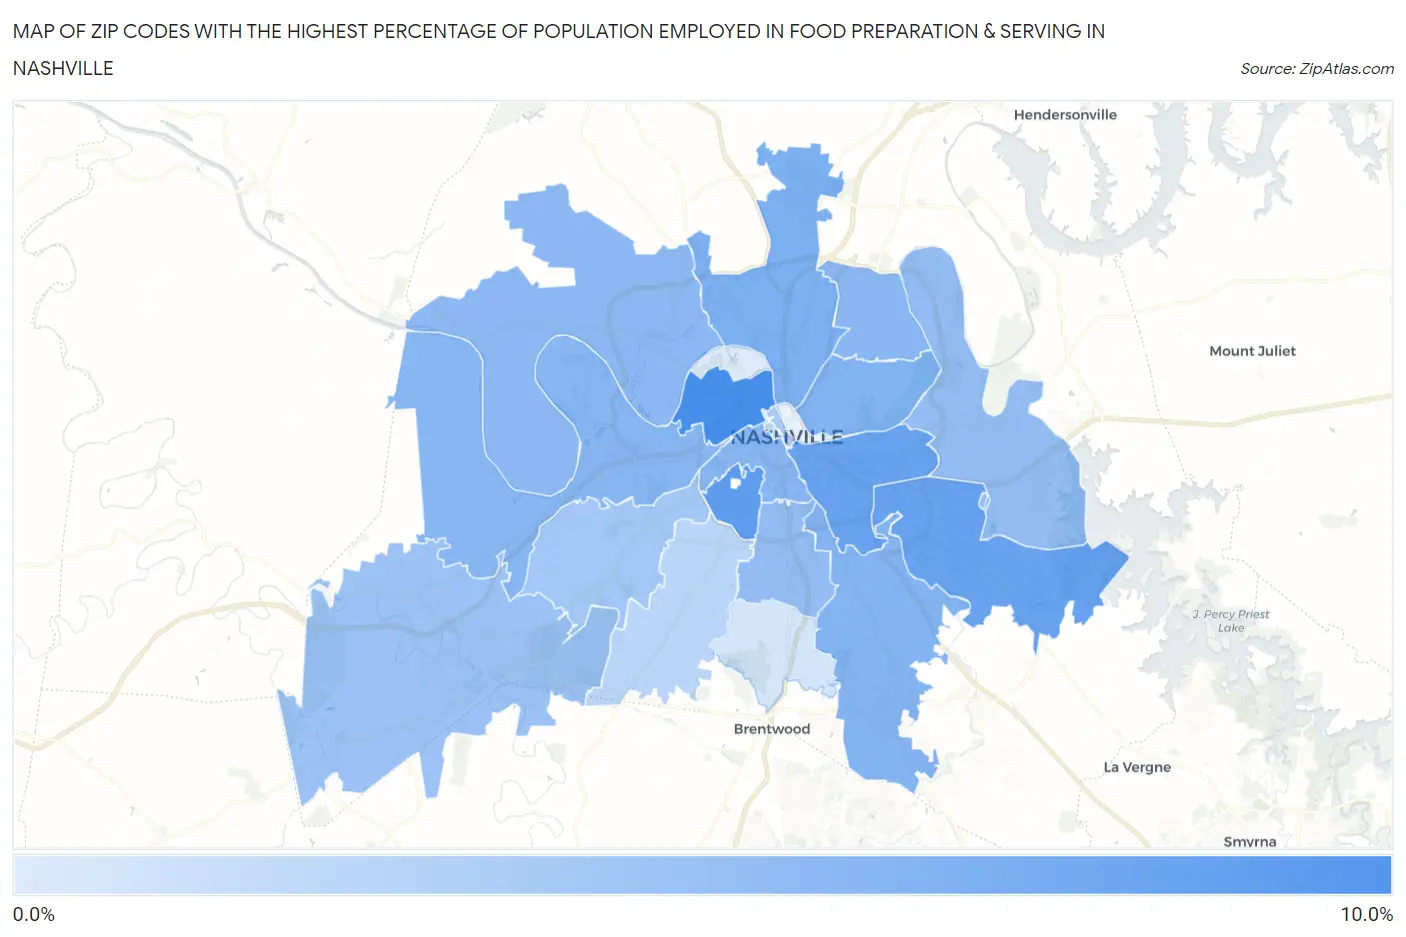
Map of Zip Codes with the Highest Percentage of Population Employed in Food Preparation & Serving in Nashville
0.45%
9.9%
Zip Codes with the Highest Percentage of Population Employed in Food Preparation & Serving in Nashville, TN
| Zip Code | % Employed | vs State | vs National | |
| 1. | 37208 | 9.9% | 5.4%(+4.49)#47 | 5.3%(+4.62)#2,701 |
| 2. | 37212 | 8.4% | 5.4%(+3.02)#81 | 5.3%(+3.15)#4,129 |
| 3. | 37210 | 7.8% | 5.4%(+2.42)#108 | 5.3%(+2.56)#4,974 |
| 4. | 37217 | 7.7% | 5.4%(+2.33)#114 | 5.3%(+2.46)#5,146 |
| 5. | 37207 | 6.5% | 5.4%(+1.04)#166 | 5.3%(+1.17)#7,983 |
| 6. | 37206 | 6.2% | 5.4%(+0.778)#181 | 5.3%(+0.911)#8,740 |
| 7. | 37211 | 6.0% | 5.4%(+0.623)#188 | 5.3%(+0.756)#9,199 |
| 8. | 37203 | 5.7% | 5.4%(+0.314)#210 | 5.3%(+0.447)#10,238 |
| 9. | 37209 | 5.7% | 5.4%(+0.250)#214 | 5.3%(+0.383)#10,460 |
| 10. | 37216 | 5.6% | 5.4%(+0.164)#219 | 5.3%(+0.297)#10,763 |
| 11. | 37218 | 5.4% | 5.4%(+0.017)#223 | 5.3%(+0.150)#11,278 |
| 12. | 37214 | 5.0% | 5.4%(-0.409)#248 | 5.3%(-0.276)#12,908 |
| 13. | 37204 | 5.0% | 5.4%(-0.430)#251 | 5.3%(-0.297)#13,001 |
| 14. | 37221 | 4.5% | 5.4%(-0.931)#303 | 5.3%(-0.799)#15,079 |
| 15. | 37205 | 4.0% | 5.4%(-1.38)#341 | 5.3%(-1.25)#16,965 |
| 16. | 37201 | 3.5% | 5.4%(-1.92)#388 | 5.3%(-1.78)#19,195 |
| 17. | 37215 | 2.6% | 5.4%(-2.82)#460 | 5.3%(-2.68)#22,775 |
| 18. | 37219 | 2.3% | 5.4%(-3.16)#481 | 5.3%(-3.02)#23,914 |
| 19. | 37220 | 1.0% | 5.4%(-4.39)#542 | 5.3%(-4.26)#26,937 |
| 20. | 37228 | 0.45% | 5.4%(-4.97)#553 | 5.3%(-4.84)#27,743 |
1
Common Questions
What are the Top 10 Zip Codes with the Highest Percentage of Population Employed in Food Preparation & Serving in Nashville, TN?
Top 10 Zip Codes with the Highest Percentage of Population Employed in Food Preparation & Serving in Nashville, TN are:
What zip code has the Highest Percentage of Population Employed in Food Preparation & Serving in Nashville, TN?
37208 has the Highest Percentage of Population Employed in Food Preparation & Serving in Nashville, TN with 9.9%.
What is the Percentage of Population Employed in Food Preparation & Serving in Nashville, TN?
Percentage of Population Employed in Food Preparation & Serving in Nashville is 5.9%.
What is the Percentage of Population Employed in Food Preparation & Serving in Tennessee?
Percentage of Population Employed in Food Preparation & Serving in Tennessee is 5.4%.
What is the Percentage of Population Employed in Food Preparation & Serving in the United States?
Percentage of Population Employed in Food Preparation & Serving in the United States is 5.3%.