Gray, TN Map & Demographics
Gray Map
Gray Overview
$30,395
PER CAPITA INCOME
$64,309
AVG FAMILY INCOME
$63,971
AVG HOUSEHOLD INCOME
30.6%
WAGE / INCOME GAP [ % ]
69.4¢/ $1
WAGE / INCOME GAP [ $ ]
0.30
INEQUALITY / GINI INDEX
1,276
TOTAL POPULATION
691
MALE POPULATION
585
FEMALE POPULATION
118.12
MALES / 100 FEMALES
84.66
FEMALES / 100 MALES
60.9
MEDIAN AGE
2.7
AVG FAMILY SIZE
2.4
AVG HOUSEHOLD SIZE
345
LABOR FORCE [ PEOPLE ]
31.3%
PERCENT IN LABOR FORCE
Gray Area Codes
Income in Gray
Income Overview in Gray
Per Capita Income in Gray is $30,395, while median incomes of families and households are $64,309 and $63,971 respectively.
| Characteristic | Number | Measure |
| Per Capita Income | 1,276 | $30,395 |
| Median Family Income | 418 | $64,309 |
| Mean Family Income | 418 | $82,551 |
| Median Household Income | 524 | $63,971 |
| Mean Household Income | 524 | $72,953 |
| Income Deficit | 418 | $0 |
| Wage / Income Gap (%) | 1,276 | 30.59% |
| Wage / Income Gap ($) | 1,276 | 69.41¢ per $1 |
| Gini / Inequality Index | 1,276 | 0.30 |
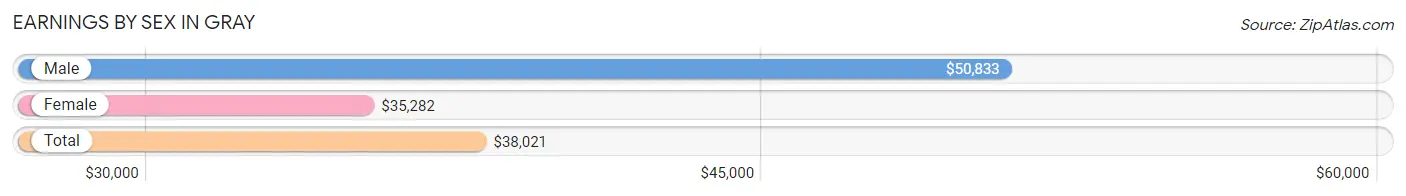
Earnings by Sex in Gray
Average Earnings in Gray are $38,021, $50,833 for men and $35,282 for women, a difference of 30.6%.
| Sex | Number | Average Earnings |
| Male | 184 (53.3%) | $50,833 |
| Female | 161 (46.7%) | $35,282 |
| Total | 345 (100.0%) | $38,021 |
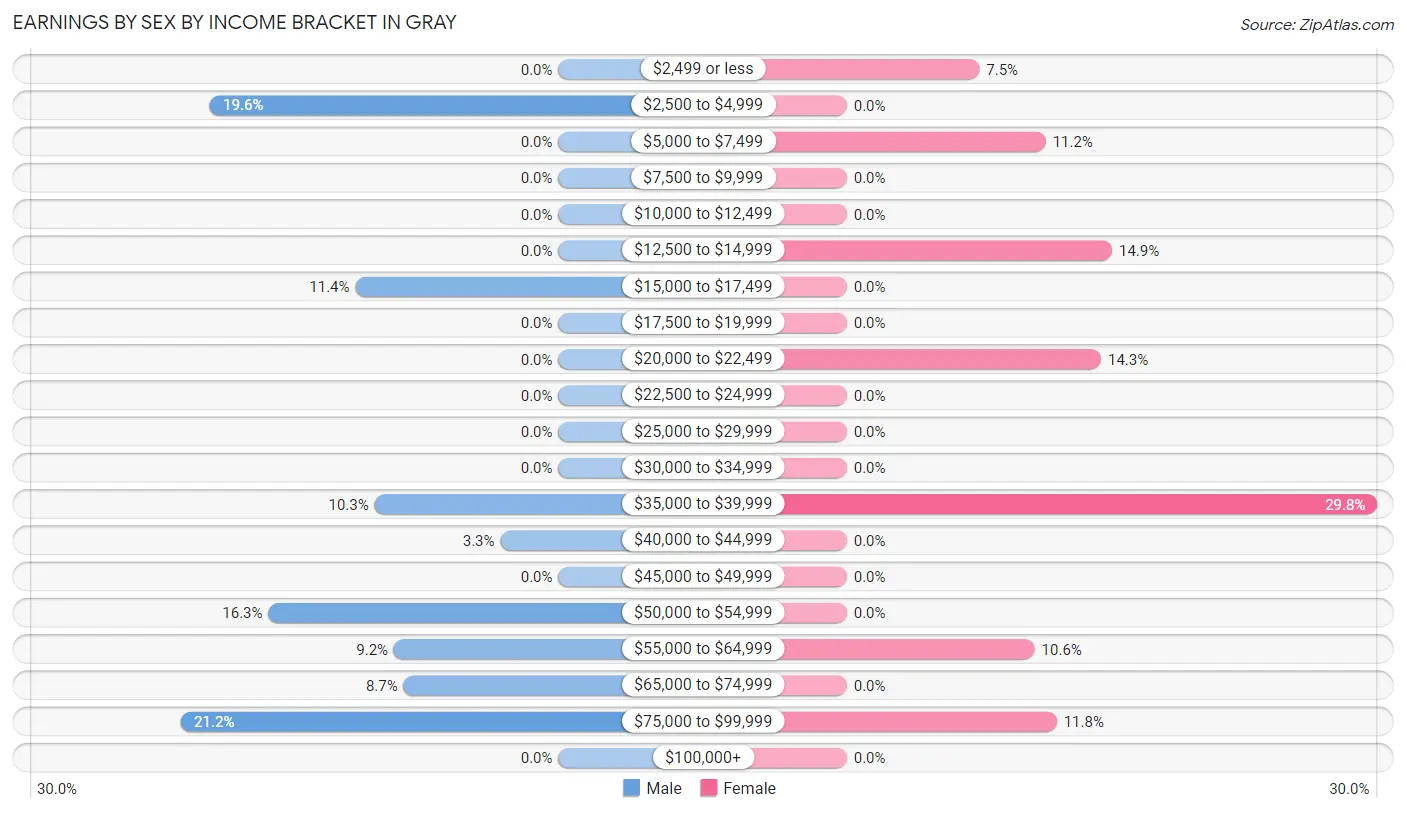
Earnings by Sex by Income Bracket in Gray
The most common earnings brackets in Gray are $75,000 to $99,999 for men (39 | 21.2%) and $35,000 to $39,999 for women (48 | 29.8%).
| Income | Male | Female |
| $2,499 or less | 0 (0.0%) | 12 (7.4%) |
| $2,500 to $4,999 | 36 (19.6%) | 0 (0.0%) |
| $5,000 to $7,499 | 0 (0.0%) | 18 (11.2%) |
| $7,500 to $9,999 | 0 (0.0%) | 0 (0.0%) |
| $10,000 to $12,499 | 0 (0.0%) | 0 (0.0%) |
| $12,500 to $14,999 | 0 (0.0%) | 24 (14.9%) |
| $15,000 to $17,499 | 21 (11.4%) | 0 (0.0%) |
| $17,500 to $19,999 | 0 (0.0%) | 0 (0.0%) |
| $20,000 to $22,499 | 0 (0.0%) | 23 (14.3%) |
| $22,500 to $24,999 | 0 (0.0%) | 0 (0.0%) |
| $25,000 to $29,999 | 0 (0.0%) | 0 (0.0%) |
| $30,000 to $34,999 | 0 (0.0%) | 0 (0.0%) |
| $35,000 to $39,999 | 19 (10.3%) | 48 (29.8%) |
| $40,000 to $44,999 | 6 (3.3%) | 0 (0.0%) |
| $45,000 to $49,999 | 0 (0.0%) | 0 (0.0%) |
| $50,000 to $54,999 | 30 (16.3%) | 0 (0.0%) |
| $55,000 to $64,999 | 17 (9.2%) | 17 (10.6%) |
| $65,000 to $74,999 | 16 (8.7%) | 0 (0.0%) |
| $75,000 to $99,999 | 39 (21.2%) | 19 (11.8%) |
| $100,000+ | 0 (0.0%) | 0 (0.0%) |
| Total | 184 (100.0%) | 161 (100.0%) |
Earnings by Sex by Educational Attainment in Gray
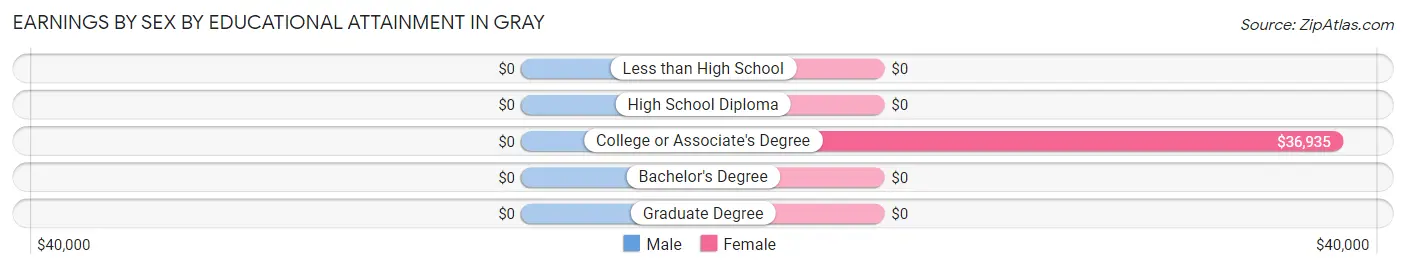
| Educational Attainment | Male Income | Female Income |
| Less than High School | - | - |
| High School Diploma | - | - |
| College or Associate's Degree | - | - |
| Bachelor's Degree | - | - |
| Graduate Degree | - | - |
| Total | - | - |
Family Income in Gray
Family Income Brackets in Gray
According to the Gray family income data, there are 219 families falling into the $50,000 to $74,999 income range, which is the most common income bracket and makes up 52.4% of all families.
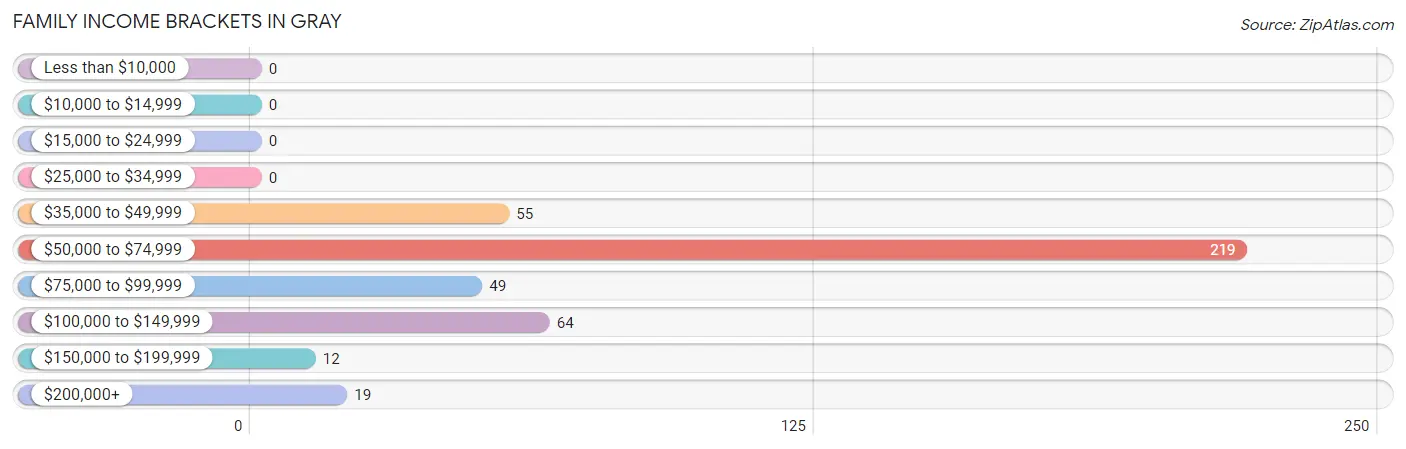
| Income Bracket | # Families | % Families |
| Less than $10,000 | 0 | 0.0% |
| $10,000 to $14,999 | 0 | 0.0% |
| $15,000 to $24,999 | 0 | 0.0% |
| $25,000 to $34,999 | 0 | 0.0% |
| $35,000 to $49,999 | 55 | 13.2% |
| $50,000 to $74,999 | 219 | 52.4% |
| $75,000 to $99,999 | 49 | 11.7% |
| $100,000 to $149,999 | 64 | 15.3% |
| $150,000 to $199,999 | 12 | 2.9% |
| $200,000+ | 19 | 4.5% |
Family Income by Famaliy Size in Gray
2-person families (302 | 72.3%) account for the highest median family income in Gray with $63,882 per family, while 2-person families (302 | 72.3%) have the highest median income of $31,941 per family member.
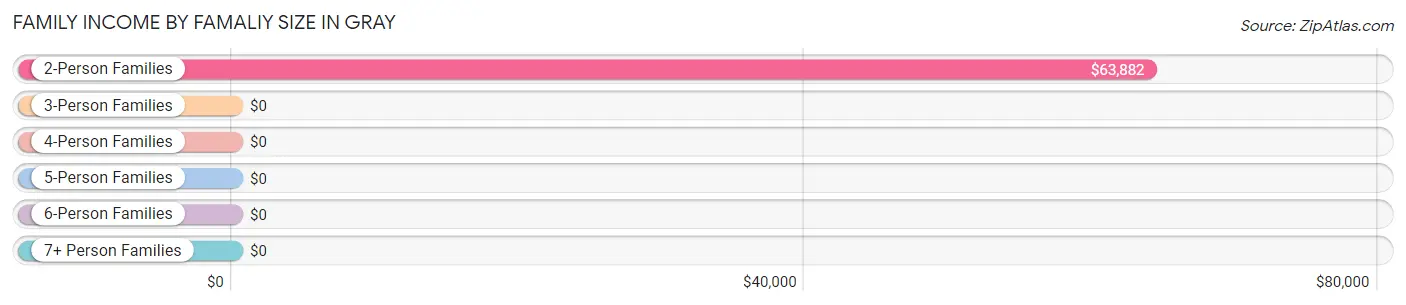
| Income Bracket | # Families | Median Income |
| 2-Person Families | 302 (72.3%) | $63,882 |
| 3-Person Families | 29 (6.9%) | $0 |
| 4-Person Families | 39 (9.3%) | $0 |
| 5-Person Families | 42 (10.1%) | $0 |
| 6-Person Families | 0 (0.0%) | $0 |
| 7+ Person Families | 6 (1.4%) | $0 |
| Total | 418 (100.0%) | $64,309 |
Family Income by Number of Earners in Gray
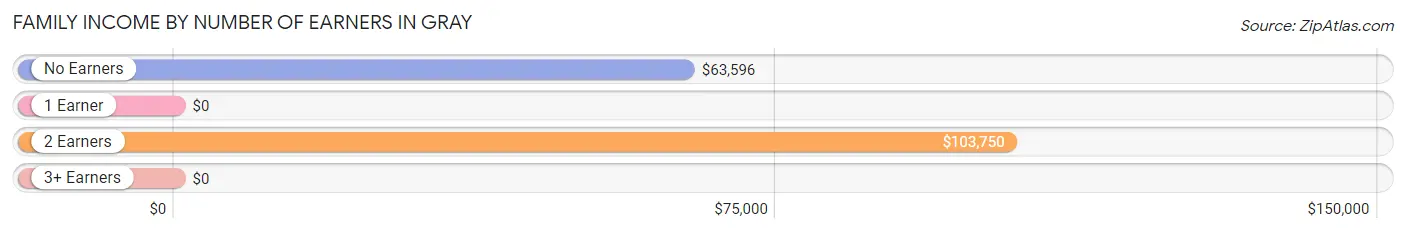
| Number of Earners | # Families | Median Income |
| No Earners | 285 (68.2%) | $63,596 |
| 1 Earner | 42 (10.1%) | $0 |
| 2 Earners | 72 (17.2%) | $103,750 |
| 3+ Earners | 19 (4.5%) | $0 |
| Total | 418 (100.0%) | $64,309 |
Household Income in Gray
Household Income Brackets in Gray
With 249 households falling in the category, the $50,000 to $74,999 income range is the most frequent in Gray, accounting for 47.5% of all households.
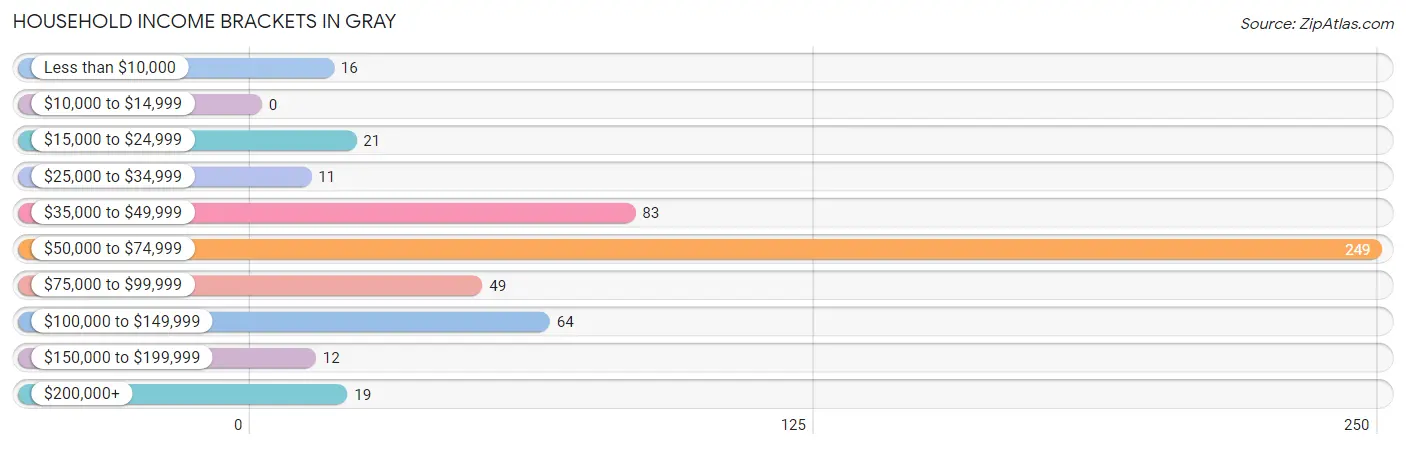
| Income Bracket | # Households | % Households |
| Less than $10,000 | 16 | 3.1% |
| $10,000 to $14,999 | 0 | 0.0% |
| $15,000 to $24,999 | 21 | 4.0% |
| $25,000 to $34,999 | 11 | 2.1% |
| $35,000 to $49,999 | 83 | 15.8% |
| $50,000 to $74,999 | 249 | 47.5% |
| $75,000 to $99,999 | 49 | 9.4% |
| $100,000 to $149,999 | 64 | 12.2% |
| $150,000 to $199,999 | 12 | 2.3% |
| $200,000+ | 19 | 3.6% |
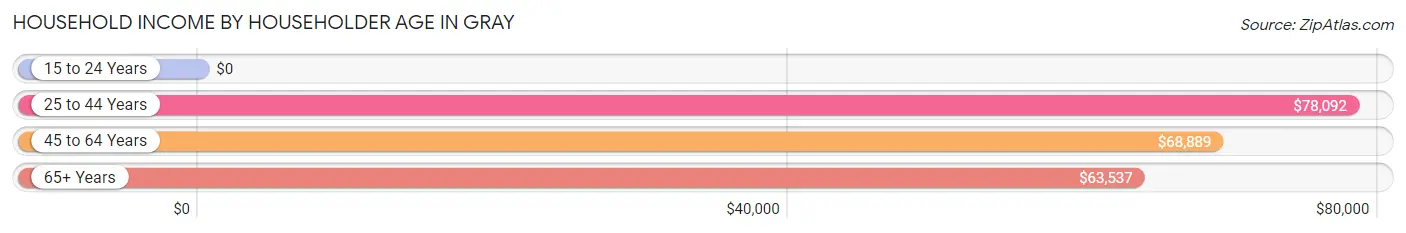
Household Income by Householder Age in Gray
The median household income in Gray is $63,971, with the highest median household income of $78,092 found in the 25 to 44 years age bracket for the primary householder. A total of 95 households (18.1%) fall into this category. Meanwhile, the 15 to 24 years age bracket for the primary householder has the lowest median household income of $0, with 30 households (5.7%) in this group.
| Income Bracket | # Households | Median Income |
| 15 to 24 Years | 30 (5.7%) | $0 |
| 25 to 44 Years | 95 (18.1%) | $78,092 |
| 45 to 64 Years | 126 (24.0%) | $68,889 |
| 65+ Years | 273 (52.1%) | $63,537 |
| Total | 524 (100.0%) | $63,971 |
Poverty in Gray
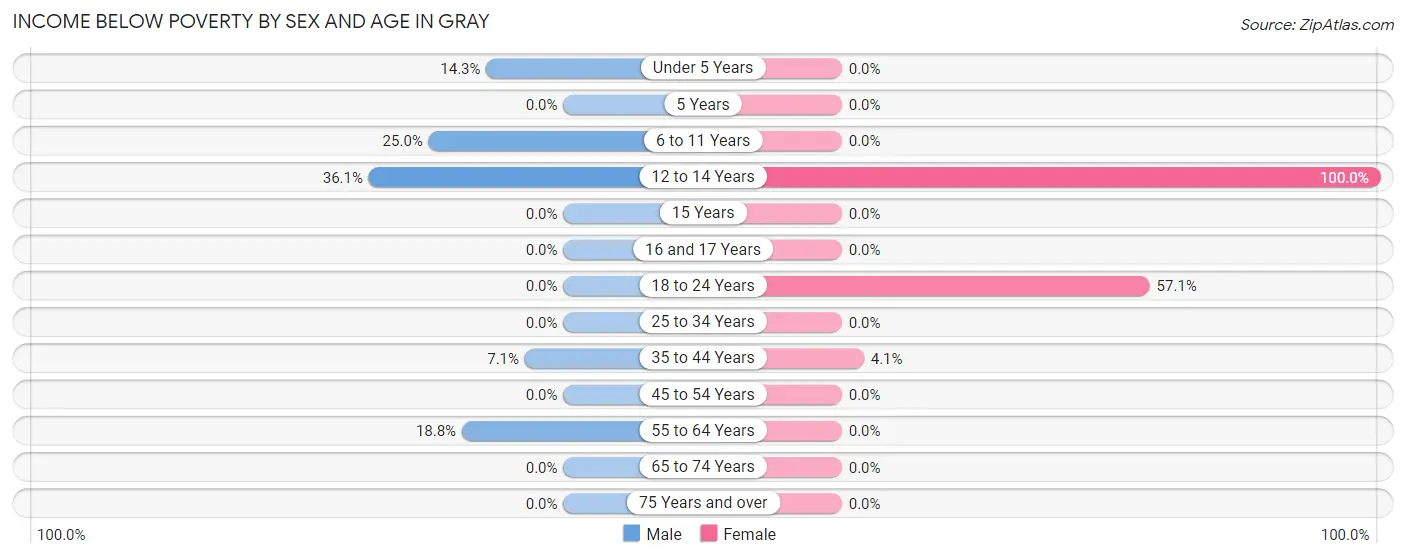
Income Below Poverty by Sex and Age in Gray
With 7.7% poverty level for males and 5.8% for females among the residents of Gray, 12 to 14 year old males and 12 to 14 year old females are the most vulnerable to poverty, with 13 males (36.1%) and 8 females (100.0%) in their respective age groups living below the poverty level.
| Age Bracket | Male | Female |
| Under 5 Years | 5 (14.3%) | 0 (0.0%) |
| 5 Years | 0 (0.0%) | 0 (0.0%) |
| 6 to 11 Years | 13 (25.0%) | 0 (0.0%) |
| 12 to 14 Years | 13 (36.1%) | 8 (100.0%) |
| 15 Years | 0 (0.0%) | 0 (0.0%) |
| 16 and 17 Years | 0 (0.0%) | 0 (0.0%) |
| 18 to 24 Years | 0 (0.0%) | 24 (57.1%) |
| 25 to 34 Years | 0 (0.0%) | 0 (0.0%) |
| 35 to 44 Years | 6 (7.1%) | 2 (4.1%) |
| 45 to 54 Years | 0 (0.0%) | 0 (0.0%) |
| 55 to 64 Years | 16 (18.8%) | 0 (0.0%) |
| 65 to 74 Years | 0 (0.0%) | 0 (0.0%) |
| 75 Years and over | 0 (0.0%) | 0 (0.0%) |
| Total | 53 (7.7%) | 34 (5.8%) |
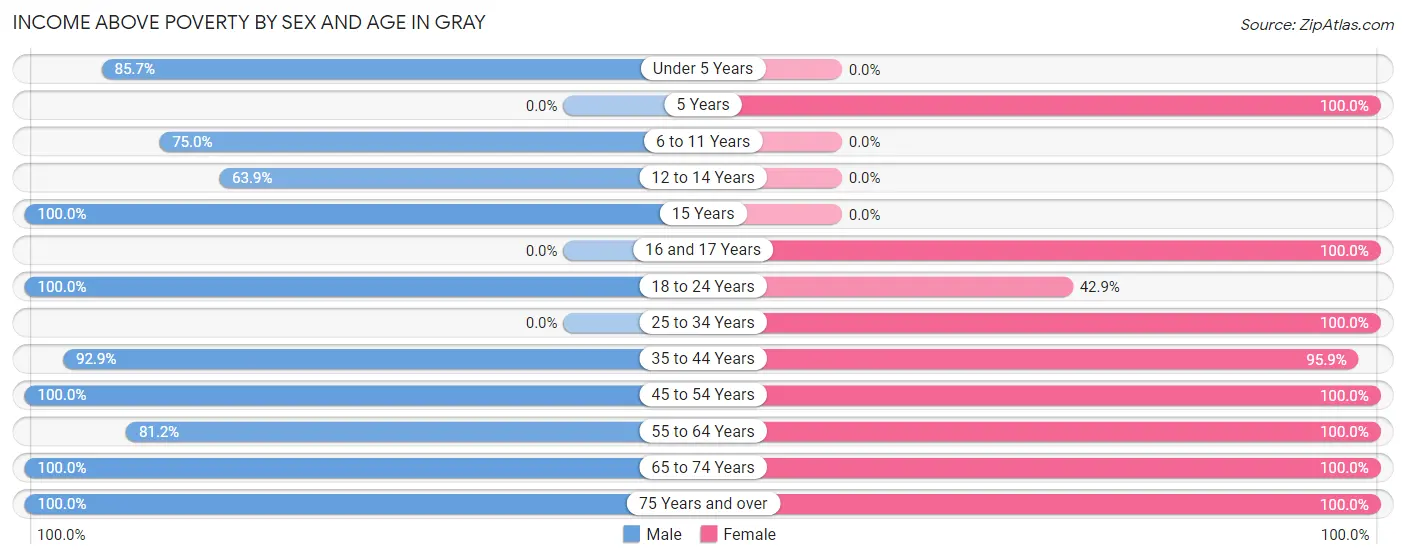
Income Above Poverty by Sex and Age in Gray
According to the poverty statistics in Gray, males aged 15 years and females aged 5 years are the age groups that are most secure financially, with 100.0% of males and 100.0% of females in these age groups living above the poverty line.
| Age Bracket | Male | Female |
| Under 5 Years | 30 (85.7%) | 0 (0.0%) |
| 5 Years | 0 (0.0%) | 21 (100.0%) |
| 6 to 11 Years | 39 (75.0%) | 0 (0.0%) |
| 12 to 14 Years | 23 (63.9%) | 0 (0.0%) |
| 15 Years | 21 (100.0%) | 0 (0.0%) |
| 16 and 17 Years | 0 (0.0%) | 27 (100.0%) |
| 18 to 24 Years | 77 (100.0%) | 18 (42.9%) |
| 25 to 34 Years | 0 (0.0%) | 36 (100.0%) |
| 35 to 44 Years | 78 (92.9%) | 47 (95.9%) |
| 45 to 54 Years | 55 (100.0%) | 80 (100.0%) |
| 55 to 64 Years | 69 (81.2%) | 18 (100.0%) |
| 65 to 74 Years | 193 (100.0%) | 226 (100.0%) |
| 75 Years and over | 53 (100.0%) | 78 (100.0%) |
| Total | 638 (92.3%) | 551 (94.2%) |
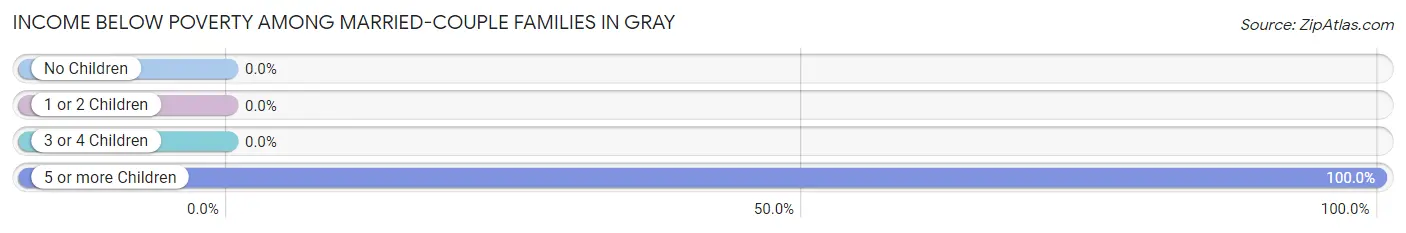
Income Below Poverty Among Married-Couple Families in Gray
The poverty statistics for married-couple families in Gray show that 1.4% or 6 of the total 418 families live below the poverty line. Families with 5 or more children have the highest poverty rate of 100.0%, comprising of 6 families. On the other hand, families with no children have the lowest poverty rate of 0.0%, which includes 0 families.
| Children | Above Poverty | Below Poverty |
| No Children | 333 (100.0%) | 0 (0.0%) |
| 1 or 2 Children | 60 (100.0%) | 0 (0.0%) |
| 3 or 4 Children | 19 (100.0%) | 0 (0.0%) |
| 5 or more Children | 0 (0.0%) | 6 (100.0%) |
| Total | 412 (98.6%) | 6 (1.4%) |
Income Below Poverty Among Single-Parent Households in Gray
| Children | Single Father | Single Mother |
| No Children | 0 (0.0%) | 0 (0.0%) |
| 1 or 2 Children | 0 (0.0%) | 0 (0.0%) |
| 3 or 4 Children | 0 (0.0%) | 0 (0.0%) |
| 5 or more Children | 0 (0.0%) | 0 (0.0%) |
| Total | 0 (0.0%) | 0 (0.0%) |
Income Below Poverty Among Married-Couple vs Single-Parent Households in Gray
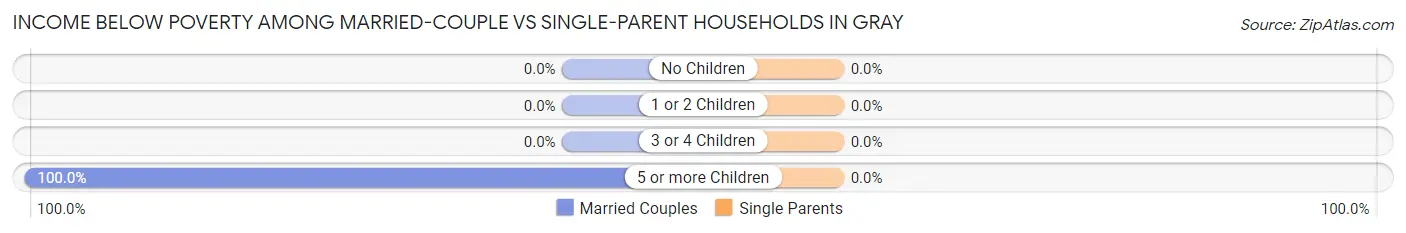
| Children | Married-Couple Families | Single-Parent Households |
| No Children | 0 (0.0%) | 0 (0.0%) |
| 1 or 2 Children | 0 (0.0%) | 0 (0.0%) |
| 3 or 4 Children | 0 (0.0%) | 0 (0.0%) |
| 5 or more Children | 6 (100.0%) | 0 (0.0%) |
| Total | 6 (1.4%) | 0 (0.0%) |
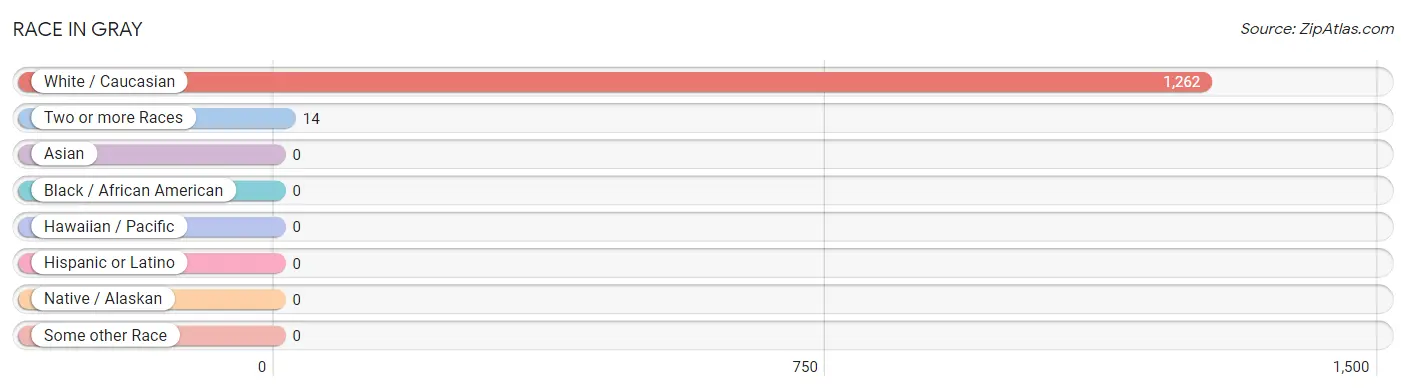
Race in Gray
The most populous races in Gray are White / Caucasian (1,262 | 98.9%), and Two or more Races (14 | 1.1%).
| Race | # Population | % Population |
| Asian | 0 | 0.0% |
| Black / African American | 0 | 0.0% |
| Hawaiian / Pacific | 0 | 0.0% |
| Hispanic or Latino | 0 | 0.0% |
| Native / Alaskan | 0 | 0.0% |
| White / Caucasian | 1,262 | 98.9% |
| Two or more Races | 14 | 1.1% |
| Some other Race | 0 | 0.0% |
| Total | 1,276 | 100.0% |
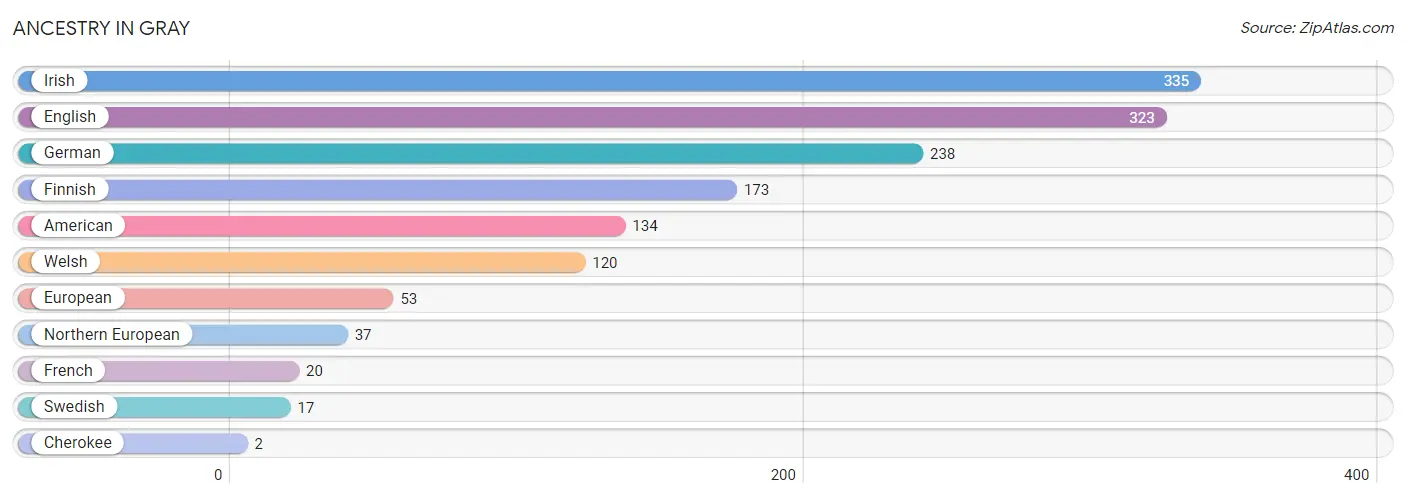
Ancestry in Gray
The most populous ancestries reported in Gray are Irish (335 | 26.3%), English (323 | 25.3%), German (238 | 18.6%), Finnish (173 | 13.6%), and American (134 | 10.5%), together accounting for 94.3% of all Gray residents.
| Ancestry | # Population | % Population |
| American | 134 | 10.5% |
| Cherokee | 2 | 0.2% |
| English | 323 | 25.3% |
| European | 53 | 4.2% |
| Finnish | 173 | 13.6% |
| French | 20 | 1.6% |
| German | 238 | 18.6% |
| Irish | 335 | 26.3% |
| Northern European | 37 | 2.9% |
| Swedish | 17 | 1.3% |
| Welsh | 120 | 9.4% | View All 11 Rows |
Immigrants in Gray

| Immigration Origin | # Population | % Population | View All 0 Rows |
Sex and Age in Gray
Sex and Age in Gray
The most populous age groups in Gray are 70 to 74 Years (178 | 25.8%) for men and 70 to 74 Years (201 | 34.4%) for women.
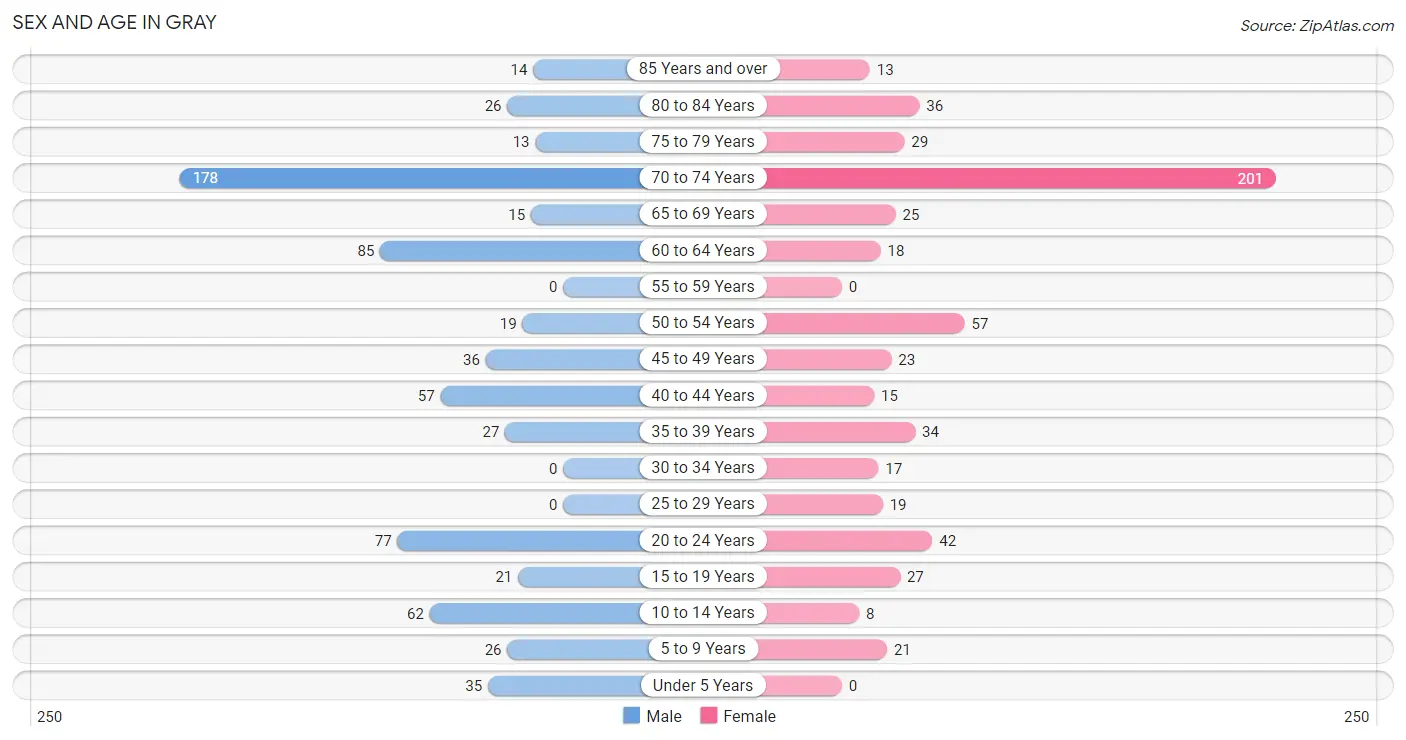
| Age Bracket | Male | Female |
| Under 5 Years | 35 (5.1%) | 0 (0.0%) |
| 5 to 9 Years | 26 (3.8%) | 21 (3.6%) |
| 10 to 14 Years | 62 (9.0%) | 8 (1.4%) |
| 15 to 19 Years | 21 (3.0%) | 27 (4.6%) |
| 20 to 24 Years | 77 (11.1%) | 42 (7.2%) |
| 25 to 29 Years | 0 (0.0%) | 19 (3.3%) |
| 30 to 34 Years | 0 (0.0%) | 17 (2.9%) |
| 35 to 39 Years | 27 (3.9%) | 34 (5.8%) |
| 40 to 44 Years | 57 (8.3%) | 15 (2.6%) |
| 45 to 49 Years | 36 (5.2%) | 23 (3.9%) |
| 50 to 54 Years | 19 (2.8%) | 57 (9.7%) |
| 55 to 59 Years | 0 (0.0%) | 0 (0.0%) |
| 60 to 64 Years | 85 (12.3%) | 18 (3.1%) |
| 65 to 69 Years | 15 (2.2%) | 25 (4.3%) |
| 70 to 74 Years | 178 (25.8%) | 201 (34.4%) |
| 75 to 79 Years | 13 (1.9%) | 29 (5.0%) |
| 80 to 84 Years | 26 (3.8%) | 36 (6.1%) |
| 85 Years and over | 14 (2.0%) | 13 (2.2%) |
| Total | 691 (100.0%) | 585 (100.0%) |
Families and Households in Gray
Median Family Size in Gray
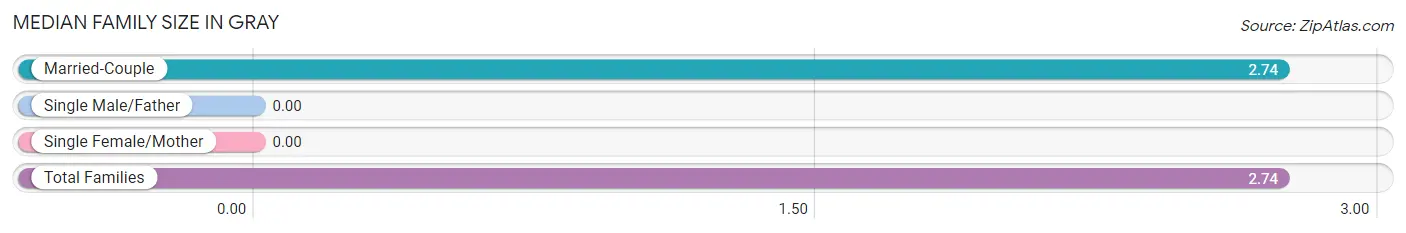
| Family Type | # Families | Family Size |
| Married-Couple | 418 (100.0%) | 2.74 |
| Single Male/Father | 0 (0.0%) | - |
| Single Female/Mother | 0 (0.0%) | - |
| Total Families | 418 (100.0%) | 2.74 |
Median Household Size in Gray
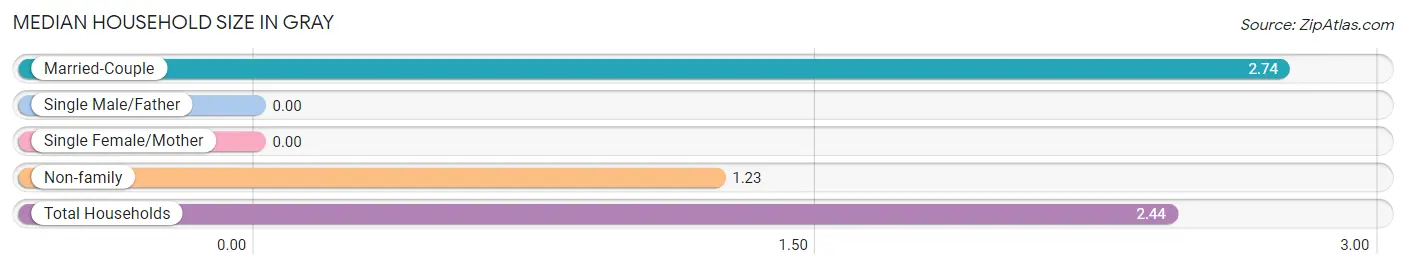
| Household Type | # Households | Household Size |
| Married-Couple | 418 (79.8%) | 2.74 |
| Single Male/Father | 0 (0.0%) | - |
| Single Female/Mother | 0 (0.0%) | - |
| Non-family | 106 (20.2%) | 1.23 |
| Total Households | 524 (100.0%) | 2.44 |
Household Size by Marriage Status in Gray
Out of a total of 524 households in Gray, 418 (79.8%) are family households, while 106 (20.2%) are nonfamily households. The most numerous type of family households are 2-person households, comprising 302, and the most common type of nonfamily households are 1-person households, comprising 76.
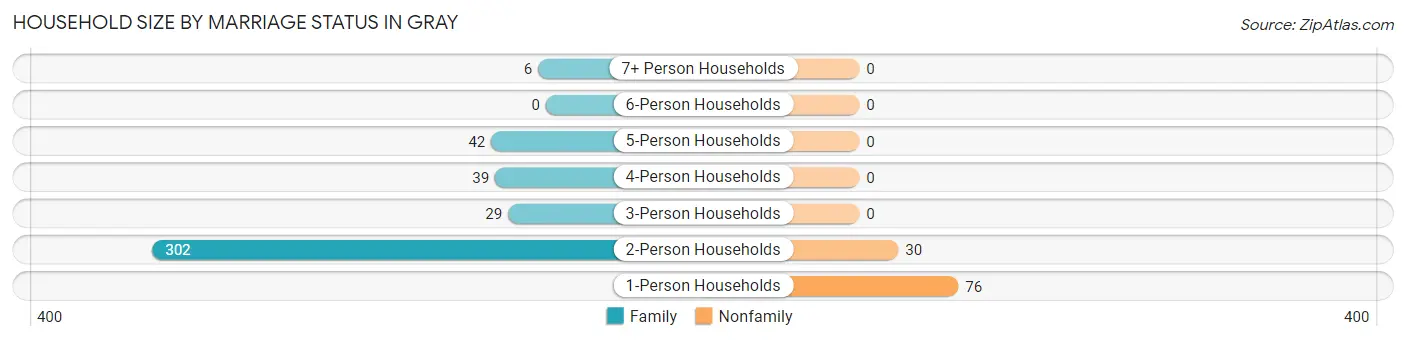
| Household Size | Family Households | Nonfamily Households |
| 1-Person Households | - | 76 (14.5%) |
| 2-Person Households | 302 (57.6%) | 30 (5.7%) |
| 3-Person Households | 29 (5.5%) | 0 (0.0%) |
| 4-Person Households | 39 (7.4%) | 0 (0.0%) |
| 5-Person Households | 42 (8.0%) | 0 (0.0%) |
| 6-Person Households | 0 (0.0%) | 0 (0.0%) |
| 7+ Person Households | 6 (1.1%) | 0 (0.0%) |
| Total | 418 (79.8%) | 106 (20.2%) |
Female Fertility in Gray
Fertility by Age in Gray
| Age Bracket | Women with Births | Births / 1,000 Women |
| 15 to 19 years | 0 (0.0%) | 0.0 |
| 20 to 34 years | 0 (0.0%) | 0.0 |
| 35 to 50 years | 0 (0.0%) | 0.0 |
| Total | 0 (0.0%) | 0.0 |
Fertility by Age by Marriage Status in Gray
| Age Bracket | Married | Unmarried |
| 15 to 19 years | 0 (0.0%) | 0 (0.0%) |
| 20 to 34 years | 0 (0.0%) | 0 (0.0%) |
| 35 to 50 years | 0 (0.0%) | 0 (0.0%) |
| Total | 0 (0.0%) | 0 (0.0%) |
Fertility by Education in Gray
| Educational Attainment | Women with Births | Births / 1,000 Women |
| Less than High School | 0 (0.0%) | 0.0 |
| High School Diploma | 0 (0.0%) | 0.0 |
| College or Associate's Degree | 0 (0.0%) | 0.0 |
| Bachelor's Degree | 0 (0.0%) | 0.0 |
| Graduate Degree | 0 (0.0%) | 0.0 |
| Total | 0 (0.0%) | 0.0 |
Fertility by Education by Marriage Status in Gray
| Educational Attainment | Married | Unmarried |
| Less than High School | 0 (0.0%) | 0 (0.0%) |
| High School Diploma | 0 (0.0%) | 0 (0.0%) |
| College or Associate's Degree | 0 (0.0%) | 0 (0.0%) |
| Bachelor's Degree | 0 (0.0%) | 0 (0.0%) |
| Graduate Degree | 0 (0.0%) | 0 (0.0%) |
| Total | 0 (0.0%) | 0 (0.0%) |
Employment Characteristics in Gray
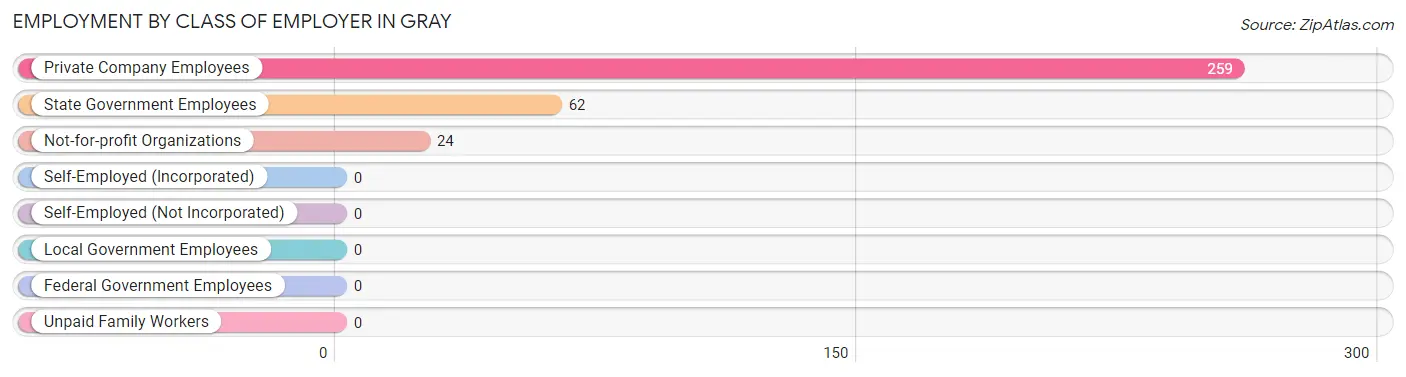
Employment by Class of Employer in Gray
Among the 345 employed individuals in Gray, private company employees (259 | 75.1%), state government employees (62 | 18.0%), and not-for-profit organizations (24 | 7.0%) make up the most common classes of employment.
| Employer Class | # Employees | % Employees |
| Private Company Employees | 259 | 75.1% |
| Self-Employed (Incorporated) | 0 | 0.0% |
| Self-Employed (Not Incorporated) | 0 | 0.0% |
| Not-for-profit Organizations | 24 | 7.0% |
| Local Government Employees | 0 | 0.0% |
| State Government Employees | 62 | 18.0% |
| Federal Government Employees | 0 | 0.0% |
| Unpaid Family Workers | 0 | 0.0% |
| Total | 345 | 100.0% |
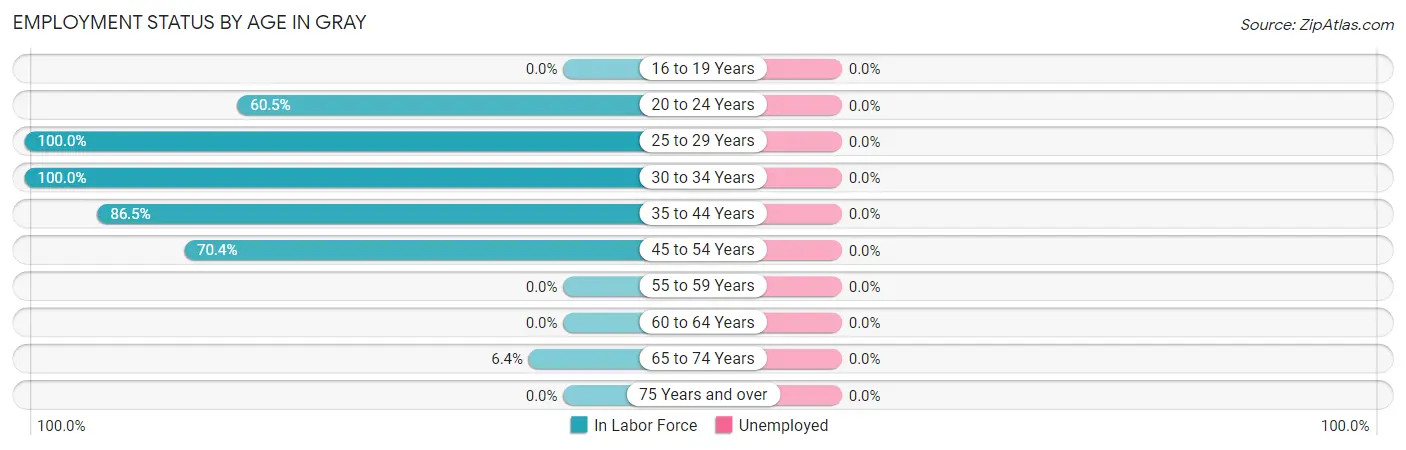
Employment Status by Age in Gray
| Age Bracket | In Labor Force | Unemployed |
| 16 to 19 Years | 0 (0.0%) | 0 (0.0%) |
| 20 to 24 Years | 72 (60.5%) | 0 (0.0%) |
| 25 to 29 Years | 19 (100.0%) | 0 (0.0%) |
| 30 to 34 Years | 17 (100.0%) | 0 (0.0%) |
| 35 to 44 Years | 115 (86.5%) | 0 (0.0%) |
| 45 to 54 Years | 95 (70.4%) | 0 (0.0%) |
| 55 to 59 Years | 0 (0.0%) | 0 (0.0%) |
| 60 to 64 Years | 0 (0.0%) | 0 (0.0%) |
| 65 to 74 Years | 27 (6.4%) | 0 (0.0%) |
| 75 Years and over | 0 (0.0%) | 0 (0.0%) |
| Total | 345 (31.3%) | 0 (0.0%) |
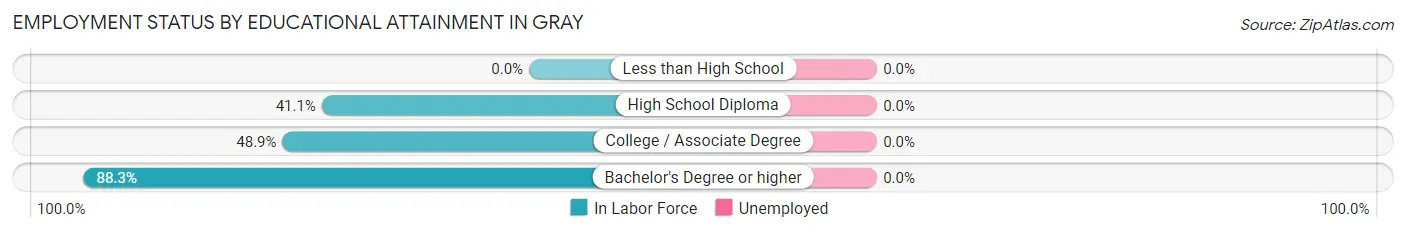
Employment Status by Educational Attainment in Gray
| Educational Attainment | In Labor Force | Unemployed |
| Less than High School | 0 (0.0%) | 0 (0.0%) |
| High School Diploma | 37 (41.1%) | 0 (0.0%) |
| College / Associate Degree | 88 (48.9%) | 0 (0.0%) |
| Bachelor's Degree or higher | 121 (88.3%) | 0 (0.0%) |
| Total | 246 (60.4%) | 0 (0.0%) |
Employment Occupations by Sex in Gray
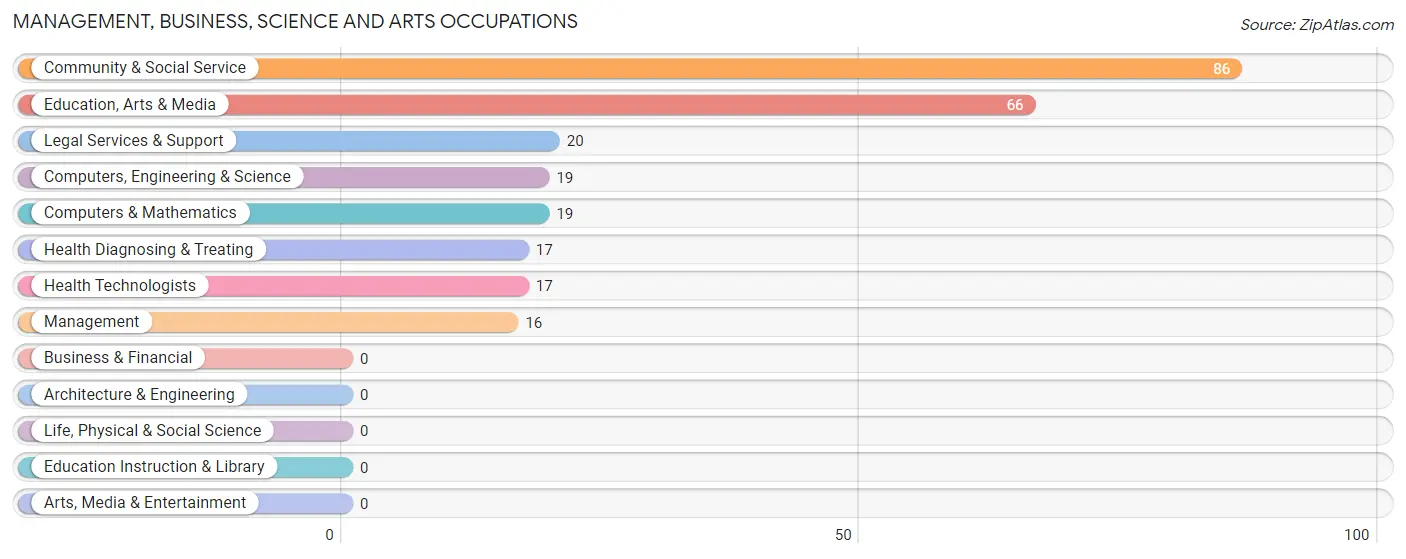
Management, Business, Science and Arts Occupations
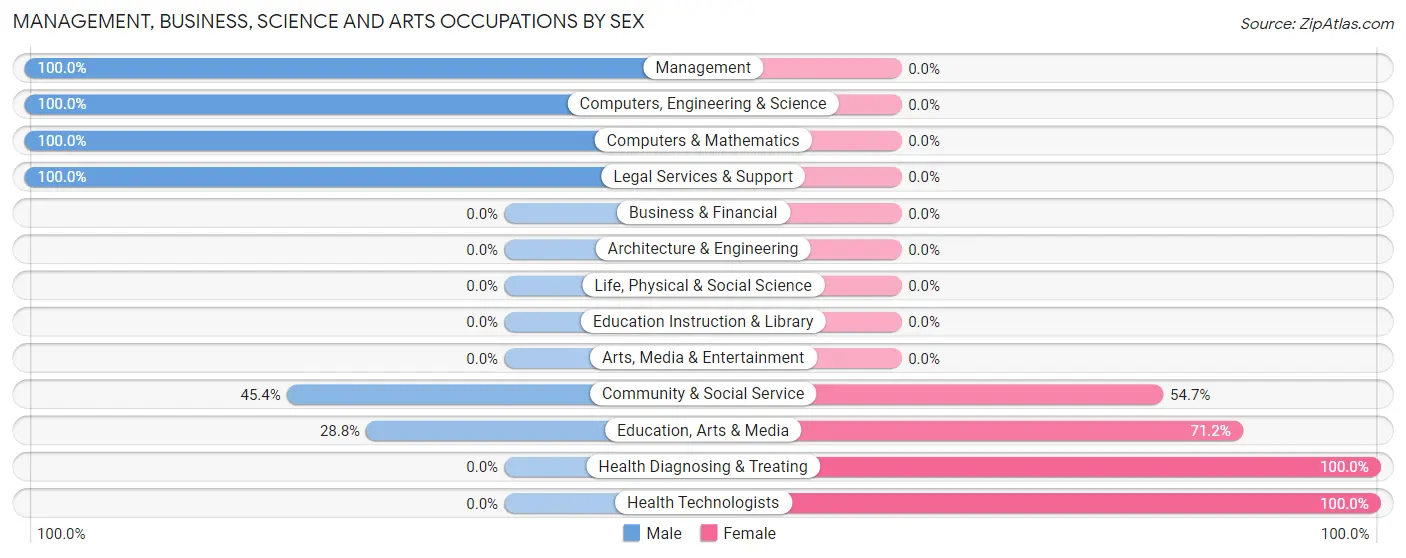
The most common Management, Business, Science and Arts occupations in Gray are Community & Social Service (86 | 24.9%), Education, Arts & Media (66 | 19.1%), Legal Services & Support (20 | 5.8%), Computers, Engineering & Science (19 | 5.5%), and Computers & Mathematics (19 | 5.5%).
Management, Business, Science and Arts Occupations by Sex
Within the Management, Business, Science and Arts occupations in Gray, the most male-oriented occupations are Management (100.0%), Computers, Engineering & Science (100.0%), and Computers & Mathematics (100.0%), while the most female-oriented occupations are Health Diagnosing & Treating (100.0%), Health Technologists (100.0%), and Education, Arts & Media (71.2%).
| Occupation | Male | Female |
| Management | 16 (100.0%) | 0 (0.0%) |
| Business & Financial | 0 (0.0%) | 0 (0.0%) |
| Computers, Engineering & Science | 19 (100.0%) | 0 (0.0%) |
| Computers & Mathematics | 19 (100.0%) | 0 (0.0%) |
| Architecture & Engineering | 0 (0.0%) | 0 (0.0%) |
| Life, Physical & Social Science | 0 (0.0%) | 0 (0.0%) |
| Community & Social Service | 39 (45.4%) | 47 (54.6%) |
| Education, Arts & Media | 19 (28.8%) | 47 (71.2%) |
| Legal Services & Support | 20 (100.0%) | 0 (0.0%) |
| Education Instruction & Library | 0 (0.0%) | 0 (0.0%) |
| Arts, Media & Entertainment | 0 (0.0%) | 0 (0.0%) |
| Health Diagnosing & Treating | 0 (0.0%) | 17 (100.0%) |
| Health Technologists | 0 (0.0%) | 17 (100.0%) |
| Total (Category) | 74 (53.6%) | 64 (46.4%) |
| Total (Overall) | 184 (53.3%) | 161 (46.7%) |
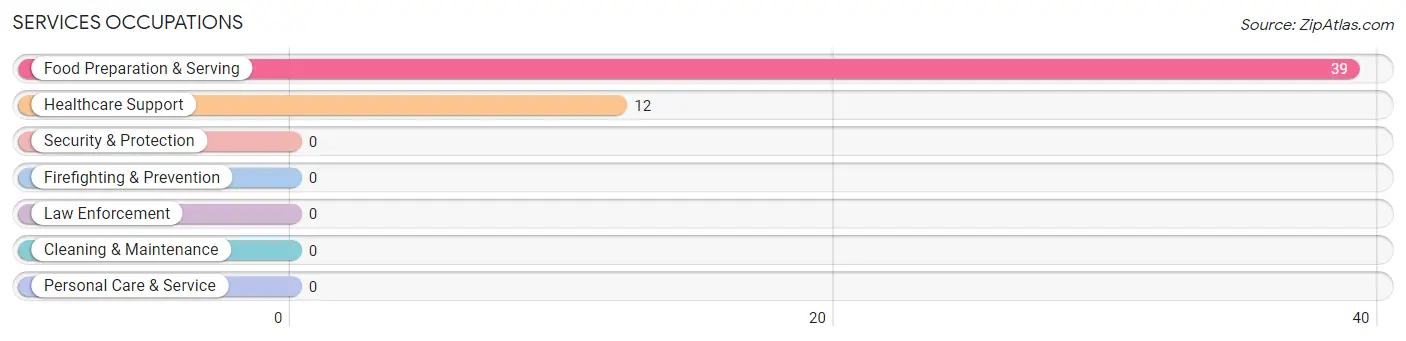
Services Occupations
The most common Services occupations in Gray are Food Preparation & Serving (39 | 11.3%), and Healthcare Support (12 | 3.5%).
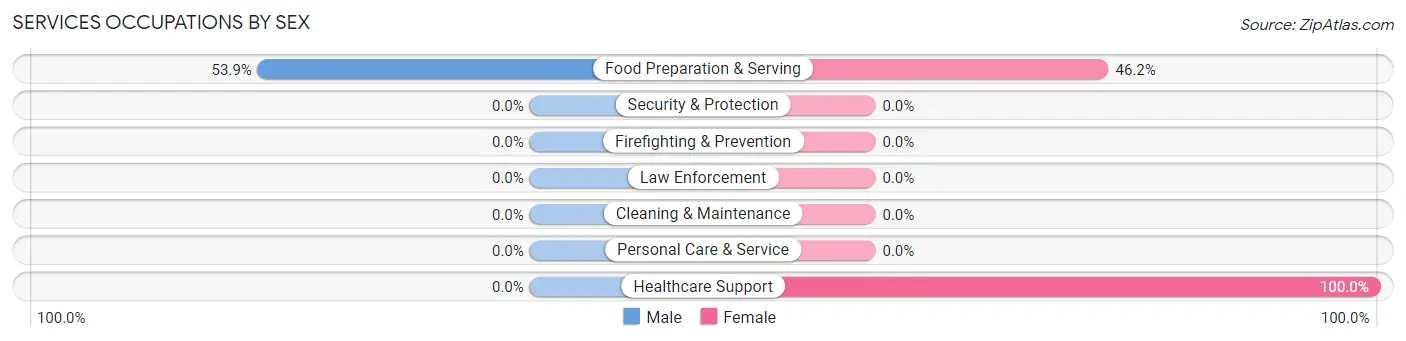
Services Occupations by Sex
| Occupation | Male | Female |
| Healthcare Support | 0 (0.0%) | 12 (100.0%) |
| Security & Protection | 0 (0.0%) | 0 (0.0%) |
| Firefighting & Prevention | 0 (0.0%) | 0 (0.0%) |
| Law Enforcement | 0 (0.0%) | 0 (0.0%) |
| Food Preparation & Serving | 21 (53.8%) | 18 (46.2%) |
| Cleaning & Maintenance | 0 (0.0%) | 0 (0.0%) |
| Personal Care & Service | 0 (0.0%) | 0 (0.0%) |
| Total (Category) | 21 (41.2%) | 30 (58.8%) |
| Total (Overall) | 184 (53.3%) | 161 (46.7%) |
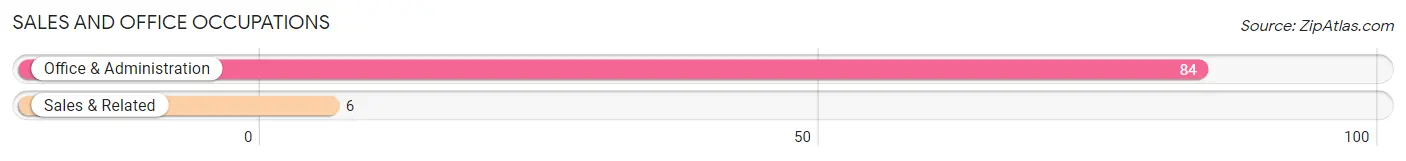
Sales and Office Occupations
The most common Sales and Office occupations in Gray are Office & Administration (84 | 24.3%), and Sales & Related (6 | 1.7%).
Sales and Office Occupations by Sex

| Occupation | Male | Female |
| Sales & Related | 6 (100.0%) | 0 (0.0%) |
| Office & Administration | 17 (20.2%) | 67 (79.8%) |
| Total (Category) | 23 (25.6%) | 67 (74.4%) |
| Total (Overall) | 184 (53.3%) | 161 (46.7%) |
Natural Resources, Construction and Maintenance Occupations
The most common Natural Resources, Construction and Maintenance occupations in Gray are , and Construction & Extraction (30 | 8.7%).
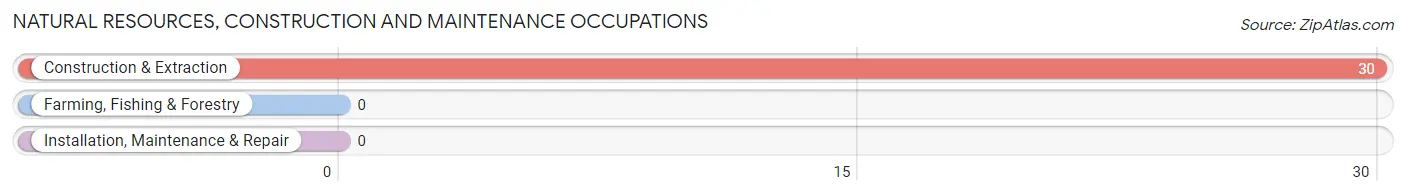
Natural Resources, Construction and Maintenance Occupations by Sex
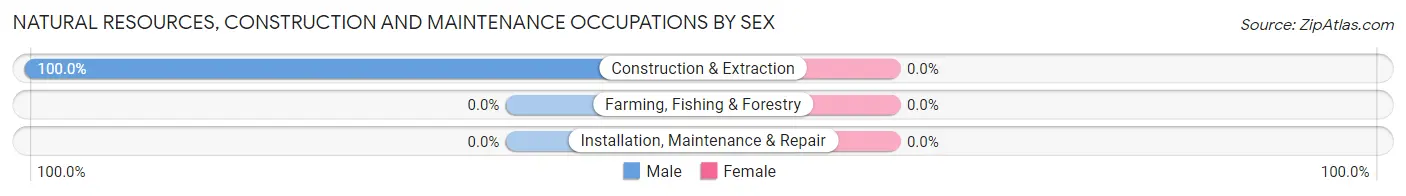
| Occupation | Male | Female |
| Farming, Fishing & Forestry | 0 (0.0%) | 0 (0.0%) |
| Construction & Extraction | 30 (100.0%) | 0 (0.0%) |
| Installation, Maintenance & Repair | 0 (0.0%) | 0 (0.0%) |
| Total (Category) | 30 (100.0%) | 0 (0.0%) |
| Total (Overall) | 184 (53.3%) | 161 (46.7%) |
Production, Transportation and Moving Occupations
The most common Production, Transportation and Moving occupations in Gray are , and Transportation (36 | 10.4%).
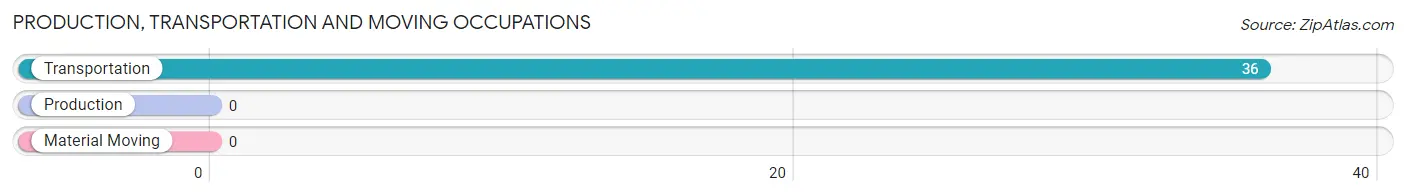
Production, Transportation and Moving Occupations by Sex
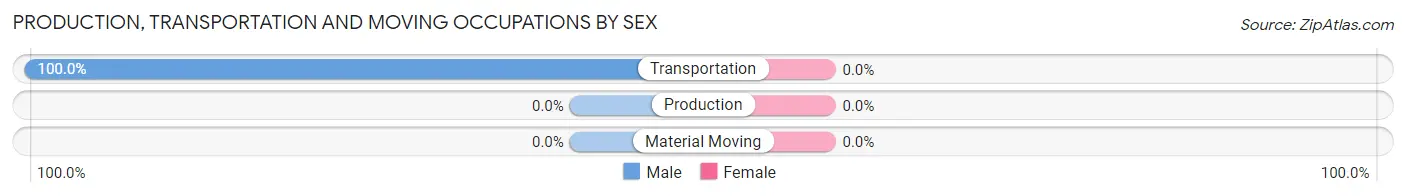
| Occupation | Male | Female |
| Production | 0 (0.0%) | 0 (0.0%) |
| Transportation | 36 (100.0%) | 0 (0.0%) |
| Material Moving | 0 (0.0%) | 0 (0.0%) |
| Total (Category) | 36 (100.0%) | 0 (0.0%) |
| Total (Overall) | 184 (53.3%) | 161 (46.7%) |
Employment Industries by Sex in Gray
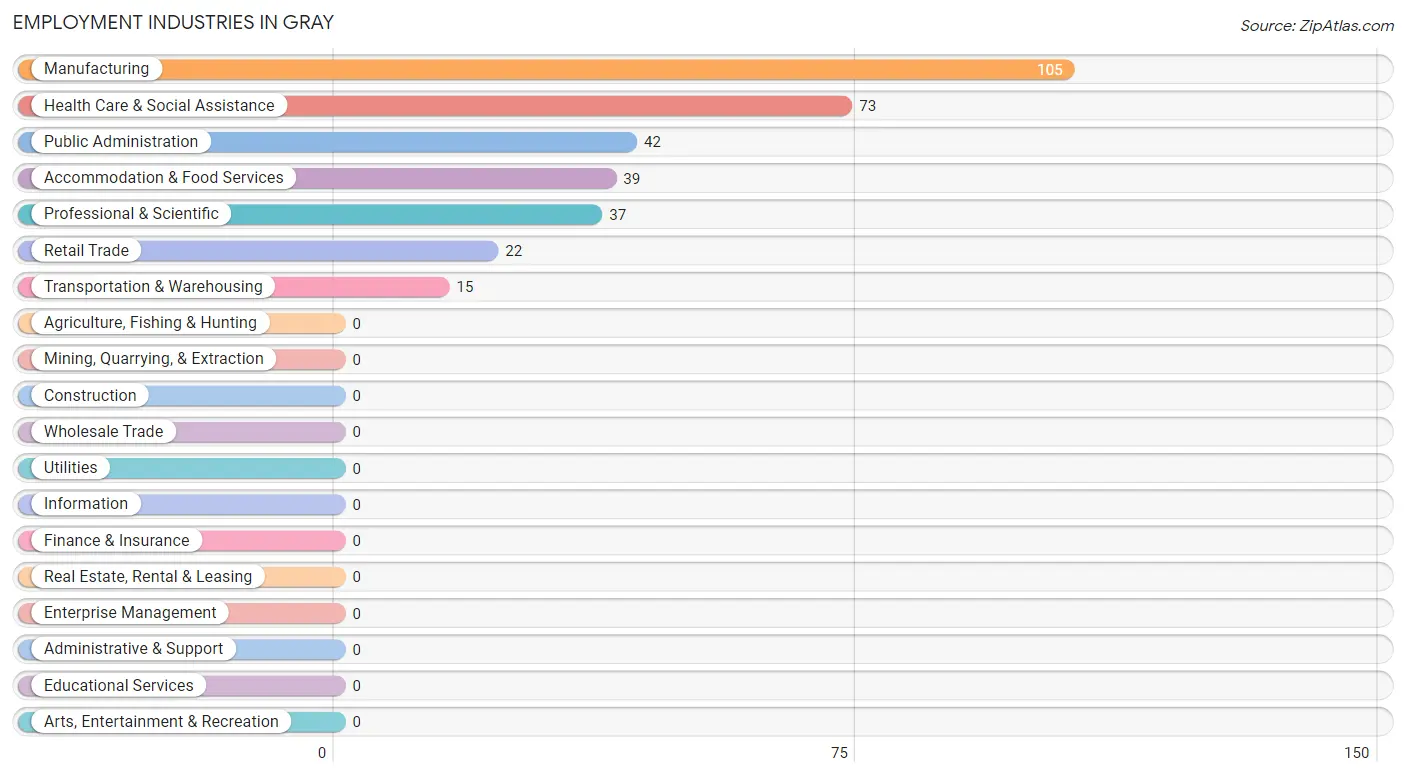
Employment Industries in Gray
The major employment industries in Gray include Manufacturing (105 | 30.4%), Health Care & Social Assistance (73 | 21.2%), Public Administration (42 | 12.2%), Accommodation & Food Services (39 | 11.3%), and Professional & Scientific (37 | 10.7%).
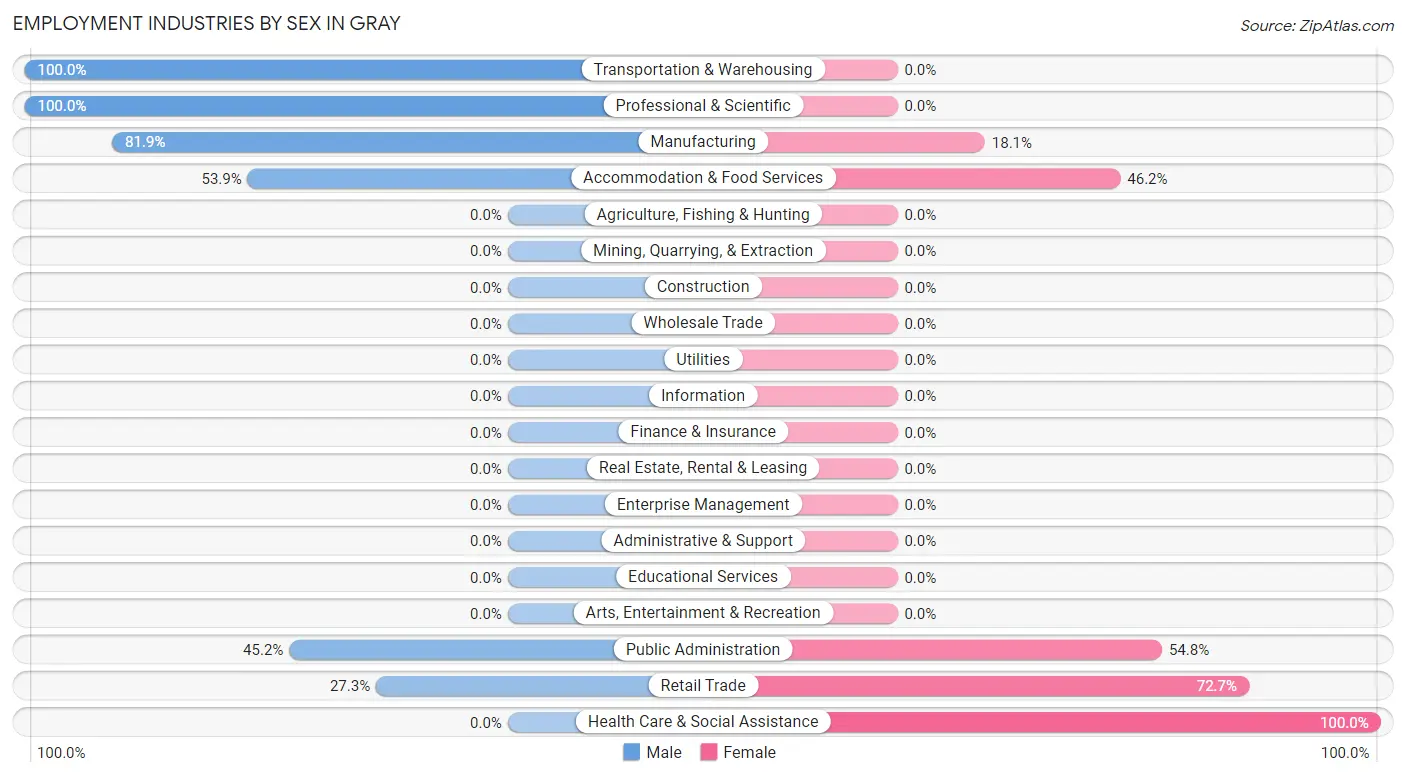
Employment Industries by Sex in Gray
The Gray industries that see more men than women are Transportation & Warehousing (100.0%), Professional & Scientific (100.0%), and Manufacturing (81.9%), whereas the industries that tend to have a higher number of women are Health Care & Social Assistance (100.0%), Retail Trade (72.7%), and Public Administration (54.8%).
| Industry | Male | Female |
| Agriculture, Fishing & Hunting | 0 (0.0%) | 0 (0.0%) |
| Mining, Quarrying, & Extraction | 0 (0.0%) | 0 (0.0%) |
| Construction | 0 (0.0%) | 0 (0.0%) |
| Manufacturing | 86 (81.9%) | 19 (18.1%) |
| Wholesale Trade | 0 (0.0%) | 0 (0.0%) |
| Retail Trade | 6 (27.3%) | 16 (72.7%) |
| Transportation & Warehousing | 15 (100.0%) | 0 (0.0%) |
| Utilities | 0 (0.0%) | 0 (0.0%) |
| Information | 0 (0.0%) | 0 (0.0%) |
| Finance & Insurance | 0 (0.0%) | 0 (0.0%) |
| Real Estate, Rental & Leasing | 0 (0.0%) | 0 (0.0%) |
| Professional & Scientific | 37 (100.0%) | 0 (0.0%) |
| Enterprise Management | 0 (0.0%) | 0 (0.0%) |
| Administrative & Support | 0 (0.0%) | 0 (0.0%) |
| Educational Services | 0 (0.0%) | 0 (0.0%) |
| Health Care & Social Assistance | 0 (0.0%) | 73 (100.0%) |
| Arts, Entertainment & Recreation | 0 (0.0%) | 0 (0.0%) |
| Accommodation & Food Services | 21 (53.8%) | 18 (46.2%) |
| Public Administration | 19 (45.2%) | 23 (54.8%) |
| Total | 184 (53.3%) | 161 (46.7%) |
Education in Gray
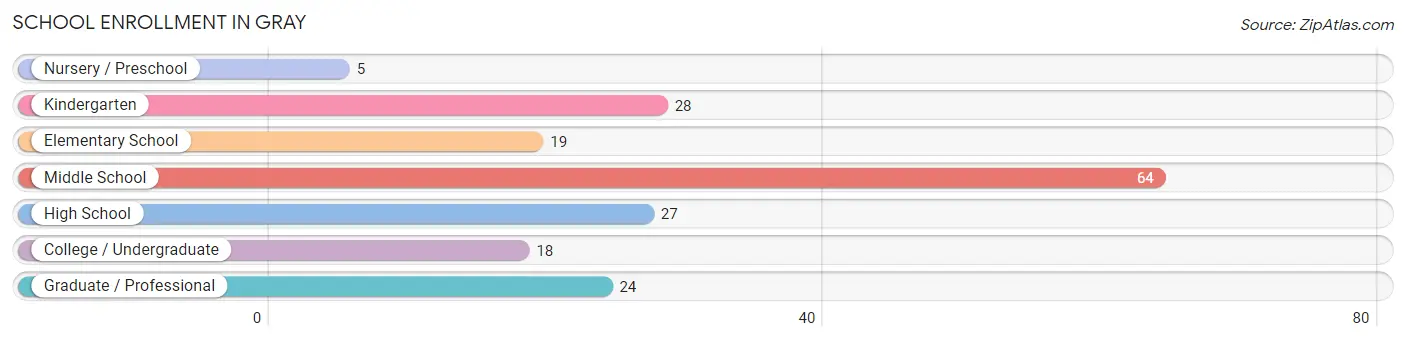
School Enrollment in Gray
The most common levels of schooling among the 185 students in Gray are middle school (64 | 34.6%), kindergarten (28 | 15.1%), and high school (27 | 14.6%).
| School Level | # Students | % Students |
| Nursery / Preschool | 5 | 2.7% |
| Kindergarten | 28 | 15.1% |
| Elementary School | 19 | 10.3% |
| Middle School | 64 | 34.6% |
| High School | 27 | 14.6% |
| College / Undergraduate | 18 | 9.7% |
| Graduate / Professional | 24 | 13.0% |
| Total | 185 | 100.0% |
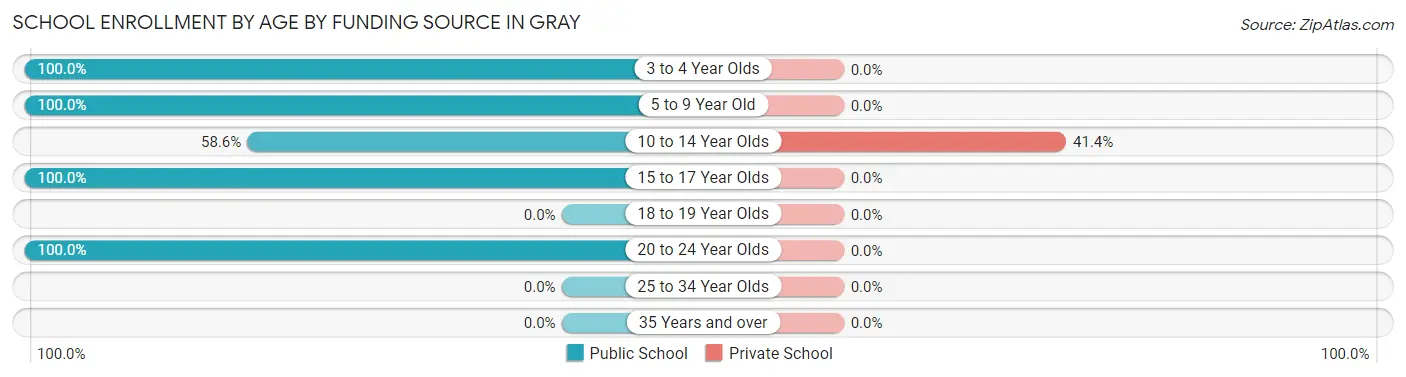
School Enrollment by Age by Funding Source in Gray
Out of a total of 185 students who are enrolled in schools in Gray, 29 (15.7%) attend a private institution, while the remaining 156 (84.3%) are enrolled in public schools. The age group of 10 to 14 year olds has the highest likelihood of being enrolled in private schools, with 29 (41.4% in the age bracket) enrolled. Conversely, the age group of 3 to 4 year olds has the lowest likelihood of being enrolled in a private school, with 5 (100.0% in the age bracket) attending a public institution.
| Age Bracket | Public School | Private School |
| 3 to 4 Year Olds | 5 (100.0%) | 0 (0.0%) |
| 5 to 9 Year Old | 47 (100.0%) | 0 (0.0%) |
| 10 to 14 Year Olds | 41 (58.6%) | 29 (41.4%) |
| 15 to 17 Year Olds | 21 (100.0%) | 0 (0.0%) |
| 18 to 19 Year Olds | 0 (0.0%) | 0 (0.0%) |
| 20 to 24 Year Olds | 42 (100.0%) | 0 (0.0%) |
| 25 to 34 Year Olds | 0 (0.0%) | 0 (0.0%) |
| 35 Years and over | 0 (0.0%) | 0 (0.0%) |
| Total | 156 (84.3%) | 29 (15.7%) |
Educational Attainment by Field of Study in Gray
Social sciences (173 | 45.1%), arts & humanities (49 | 12.8%), education (42 | 10.9%), business (36 | 9.4%), and engineering (33 | 8.6%) are the most common fields of study among 384 individuals in Gray who have obtained a bachelor's degree or higher.
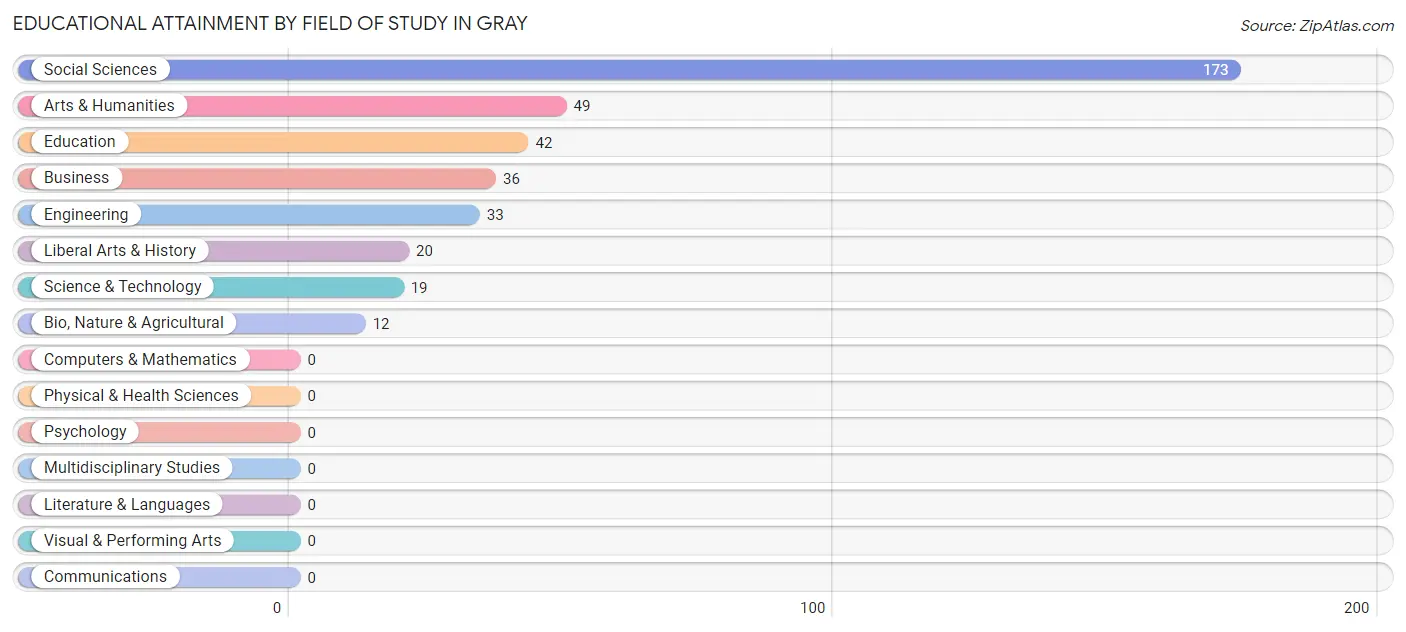
| Field of Study | # Graduates | % Graduates |
| Computers & Mathematics | 0 | 0.0% |
| Bio, Nature & Agricultural | 12 | 3.1% |
| Physical & Health Sciences | 0 | 0.0% |
| Psychology | 0 | 0.0% |
| Social Sciences | 173 | 45.1% |
| Engineering | 33 | 8.6% |
| Multidisciplinary Studies | 0 | 0.0% |
| Science & Technology | 19 | 5.0% |
| Business | 36 | 9.4% |
| Education | 42 | 10.9% |
| Literature & Languages | 0 | 0.0% |
| Liberal Arts & History | 20 | 5.2% |
| Visual & Performing Arts | 0 | 0.0% |
| Communications | 0 | 0.0% |
| Arts & Humanities | 49 | 12.8% |
| Total | 384 | 100.0% |
Transportation & Commute in Gray
Vehicle Availability by Sex in Gray
The most prevalent vehicle ownership categories in Gray are males with 2 vehicles (124, accounting for 67.4%) and females with 2 vehicles (84, making up 77.0%).
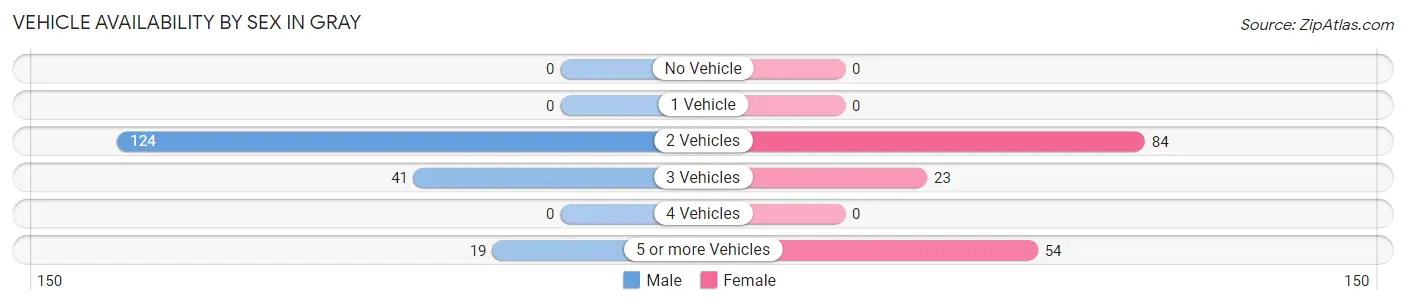
| Vehicles Available | Male | Female |
| No Vehicle | 0 (0.0%) | 0 (0.0%) |
| 1 Vehicle | 0 (0.0%) | 0 (0.0%) |
| 2 Vehicles | 124 (67.4%) | 84 (52.2%) |
| 3 Vehicles | 41 (22.3%) | 23 (14.3%) |
| 4 Vehicles | 0 (0.0%) | 0 (0.0%) |
| 5 or more Vehicles | 19 (10.3%) | 54 (33.5%) |
| Total | 184 (100.0%) | 161 (100.0%) |
Commute Time in Gray
The most frequently occuring commute durations in Gray are 20 to 24 minutes (127 commuters, 40.1%), 25 to 29 minutes (93 commuters, 29.3%), and 15 to 19 minutes (37 commuters, 11.7%).
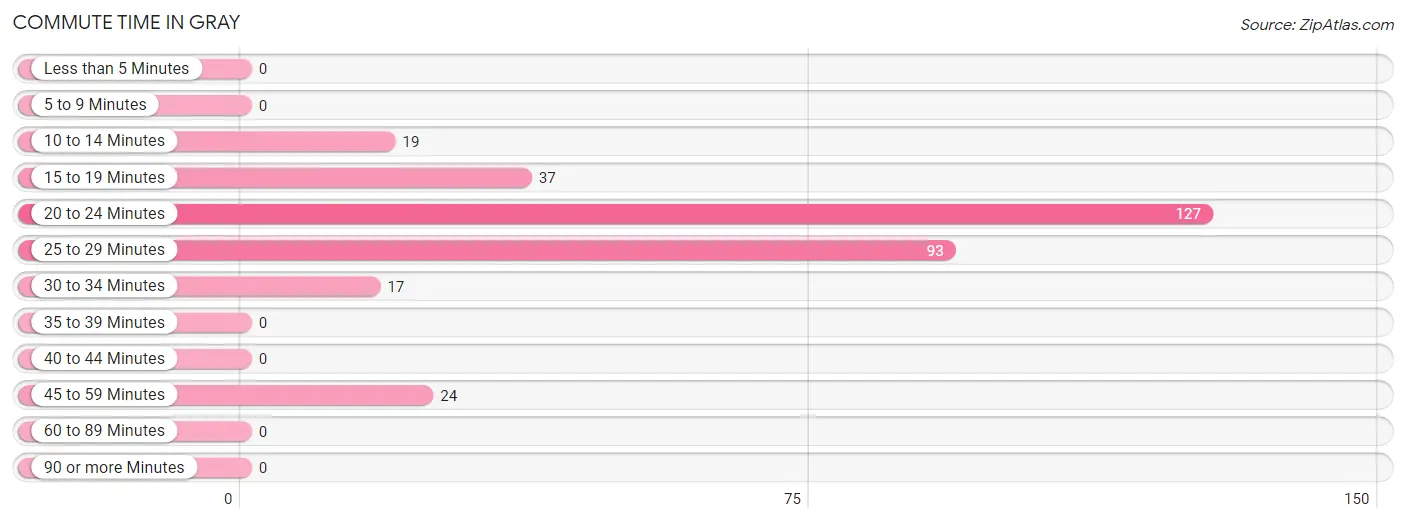
| Commute Time | # Commuters | % Commuters |
| Less than 5 Minutes | 0 | 0.0% |
| 5 to 9 Minutes | 0 | 0.0% |
| 10 to 14 Minutes | 19 | 6.0% |
| 15 to 19 Minutes | 37 | 11.7% |
| 20 to 24 Minutes | 127 | 40.1% |
| 25 to 29 Minutes | 93 | 29.3% |
| 30 to 34 Minutes | 17 | 5.4% |
| 35 to 39 Minutes | 0 | 0.0% |
| 40 to 44 Minutes | 0 | 0.0% |
| 45 to 59 Minutes | 24 | 7.6% |
| 60 to 89 Minutes | 0 | 0.0% |
| 90 or more Minutes | 0 | 0.0% |
Commute Time by Sex in Gray
The most common commute times in Gray are 25 to 29 minutes (93 commuters, 50.5%) for males and 20 to 24 minutes (72 commuters, 54.1%) for females.
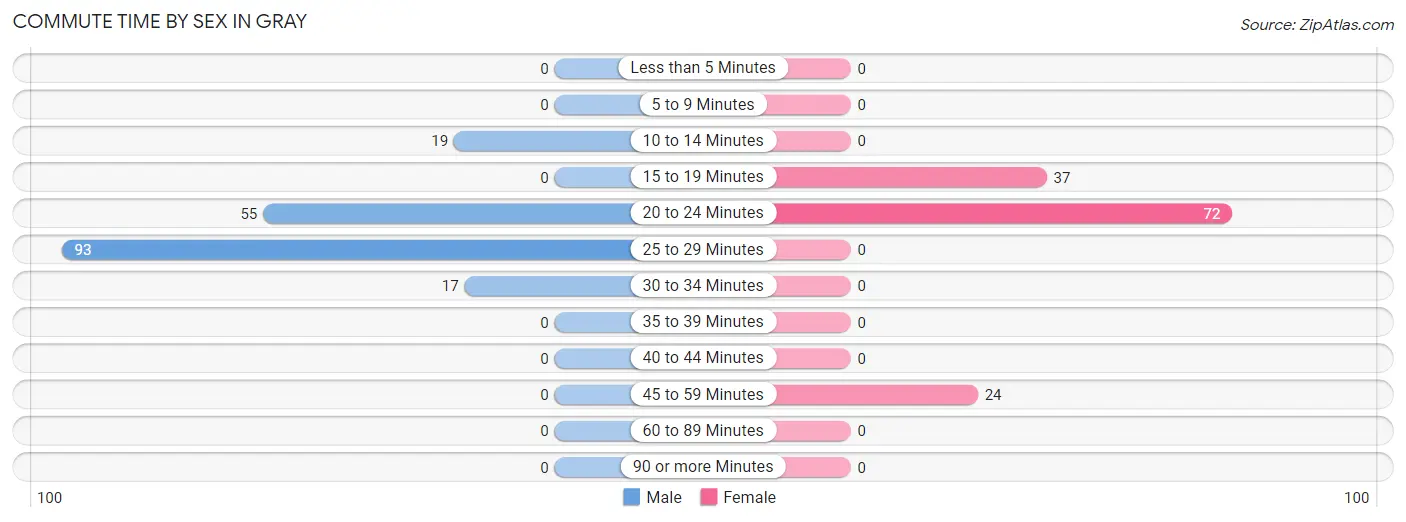
| Commute Time | Male | Female |
| Less than 5 Minutes | 0 (0.0%) | 0 (0.0%) |
| 5 to 9 Minutes | 0 (0.0%) | 0 (0.0%) |
| 10 to 14 Minutes | 19 (10.3%) | 0 (0.0%) |
| 15 to 19 Minutes | 0 (0.0%) | 37 (27.8%) |
| 20 to 24 Minutes | 55 (29.9%) | 72 (54.1%) |
| 25 to 29 Minutes | 93 (50.5%) | 0 (0.0%) |
| 30 to 34 Minutes | 17 (9.2%) | 0 (0.0%) |
| 35 to 39 Minutes | 0 (0.0%) | 0 (0.0%) |
| 40 to 44 Minutes | 0 (0.0%) | 0 (0.0%) |
| 45 to 59 Minutes | 0 (0.0%) | 24 (18.0%) |
| 60 to 89 Minutes | 0 (0.0%) | 0 (0.0%) |
| 90 or more Minutes | 0 (0.0%) | 0 (0.0%) |
Time of Departure to Work by Sex in Gray
The most frequent times of departure to work in Gray are 7:30 AM to 7:59 AM (39, 21.2%) for males and 7:30 AM to 7:59 AM (40, 30.1%) for females.
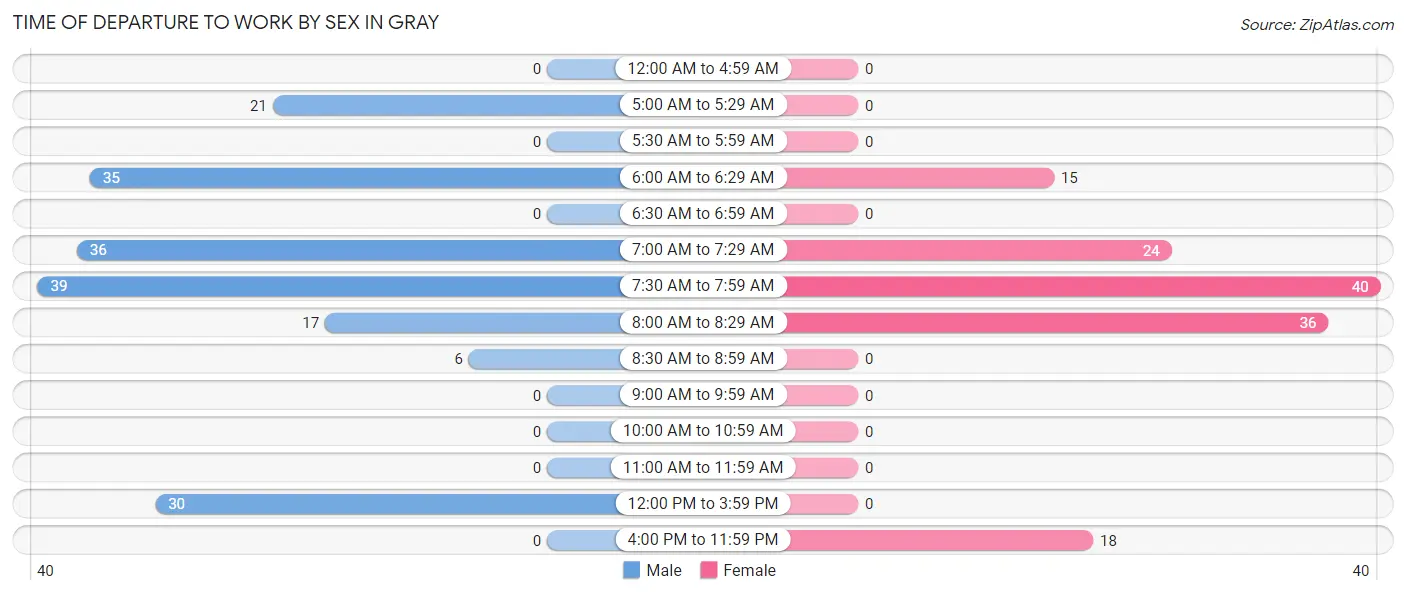
| Time of Departure | Male | Female |
| 12:00 AM to 4:59 AM | 0 (0.0%) | 0 (0.0%) |
| 5:00 AM to 5:29 AM | 21 (11.4%) | 0 (0.0%) |
| 5:30 AM to 5:59 AM | 0 (0.0%) | 0 (0.0%) |
| 6:00 AM to 6:29 AM | 35 (19.0%) | 15 (11.3%) |
| 6:30 AM to 6:59 AM | 0 (0.0%) | 0 (0.0%) |
| 7:00 AM to 7:29 AM | 36 (19.6%) | 24 (18.0%) |
| 7:30 AM to 7:59 AM | 39 (21.2%) | 40 (30.1%) |
| 8:00 AM to 8:29 AM | 17 (9.2%) | 36 (27.1%) |
| 8:30 AM to 8:59 AM | 6 (3.3%) | 0 (0.0%) |
| 9:00 AM to 9:59 AM | 0 (0.0%) | 0 (0.0%) |
| 10:00 AM to 10:59 AM | 0 (0.0%) | 0 (0.0%) |
| 11:00 AM to 11:59 AM | 0 (0.0%) | 0 (0.0%) |
| 12:00 PM to 3:59 PM | 30 (16.3%) | 0 (0.0%) |
| 4:00 PM to 11:59 PM | 0 (0.0%) | 18 (13.5%) |
| Total | 184 (100.0%) | 133 (100.0%) |
Housing Occupancy in Gray
Occupancy by Ownership in Gray
Of the total 524 dwellings in Gray, owner-occupied units account for 444 (84.7%), while renter-occupied units make up 80 (15.3%).
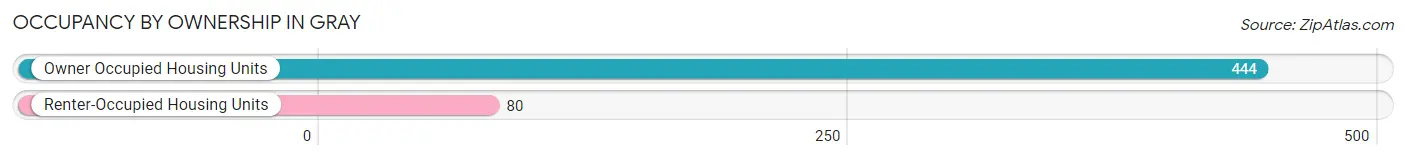
| Occupancy | # Housing Units | % Housing Units |
| Owner Occupied Housing Units | 444 | 84.7% |
| Renter-Occupied Housing Units | 80 | 15.3% |
| Total Occupied Housing Units | 524 | 100.0% |
Occupancy by Household Size in Gray
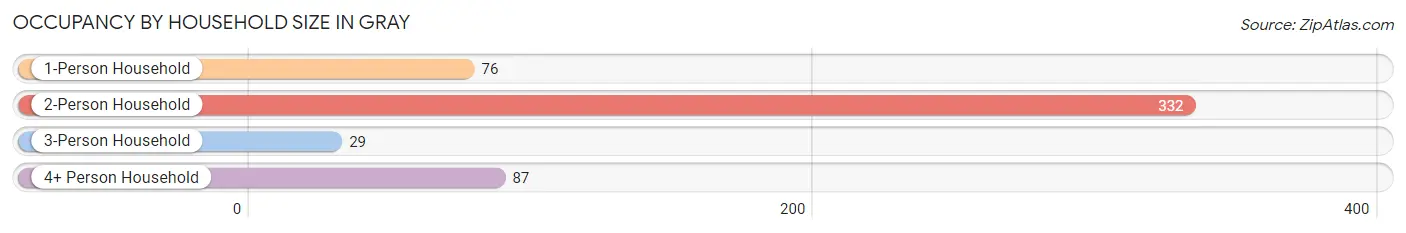
| Household Size | # Housing Units | % Housing Units |
| 1-Person Household | 76 | 14.5% |
| 2-Person Household | 332 | 63.4% |
| 3-Person Household | 29 | 5.5% |
| 4+ Person Household | 87 | 16.6% |
| Total Housing Units | 524 | 100.0% |
Occupancy by Ownership by Household Size in Gray
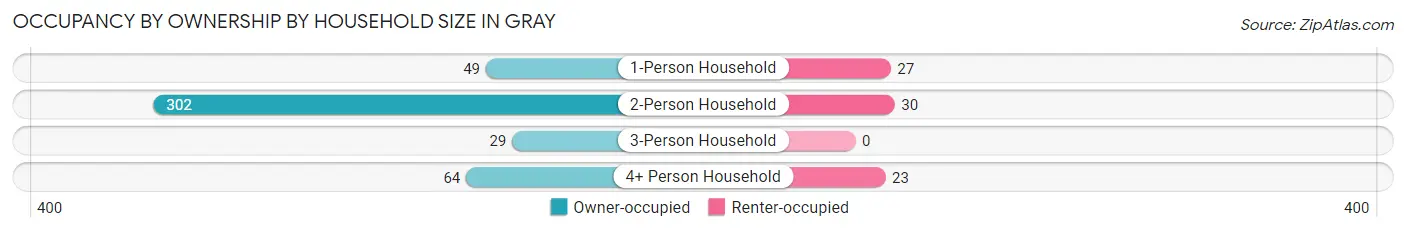
| Household Size | Owner-occupied | Renter-occupied |
| 1-Person Household | 49 (64.5%) | 27 (35.5%) |
| 2-Person Household | 302 (91.0%) | 30 (9.0%) |
| 3-Person Household | 29 (100.0%) | 0 (0.0%) |
| 4+ Person Household | 64 (73.6%) | 23 (26.4%) |
| Total Housing Units | 444 (84.7%) | 80 (15.3%) |
Occupancy by Educational Attainment in Gray
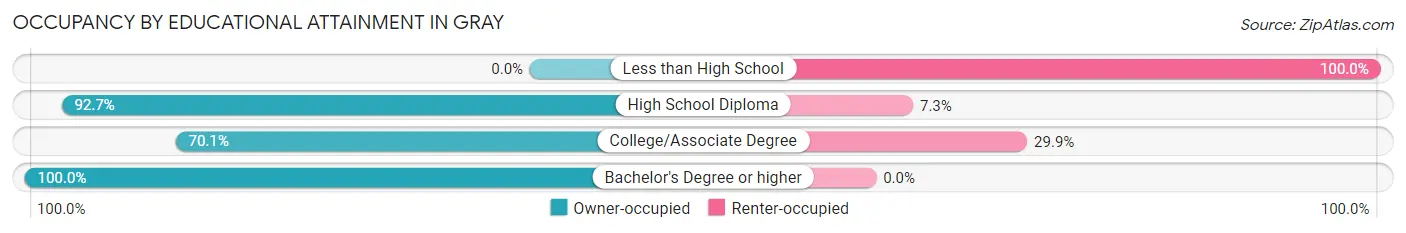
| Household Size | Owner-occupied | Renter-occupied |
| Less than High School | 0 (0.0%) | 11 (100.0%) |
| High School Diploma | 203 (92.7%) | 16 (7.3%) |
| College/Associate Degree | 124 (70.1%) | 53 (29.9%) |
| Bachelor's Degree or higher | 117 (100.0%) | 0 (0.0%) |
Occupancy by Age of Householder in Gray
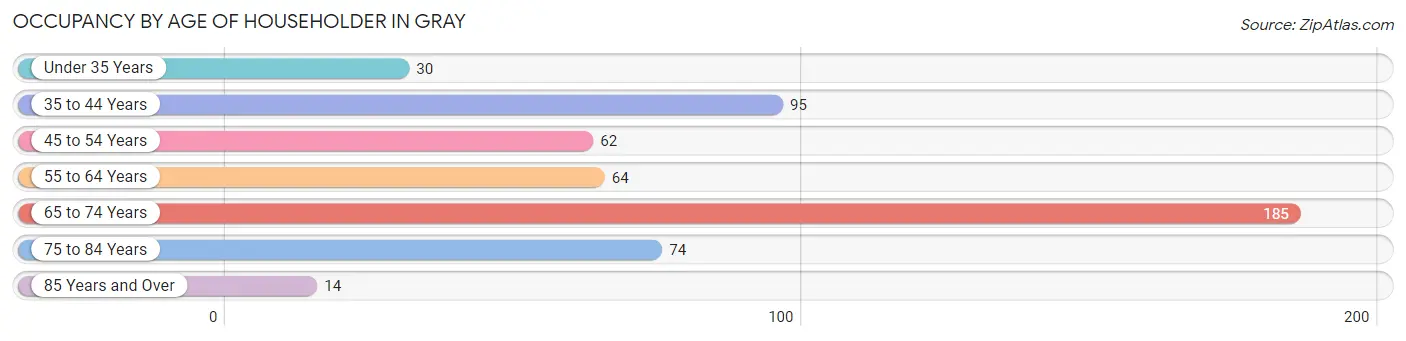
| Age Bracket | # Households | % Households |
| Under 35 Years | 30 | 5.7% |
| 35 to 44 Years | 95 | 18.1% |
| 45 to 54 Years | 62 | 11.8% |
| 55 to 64 Years | 64 | 12.2% |
| 65 to 74 Years | 185 | 35.3% |
| 75 to 84 Years | 74 | 14.1% |
| 85 Years and Over | 14 | 2.7% |
| Total | 524 | 100.0% |
Housing Finances in Gray
Median Income by Occupancy in Gray
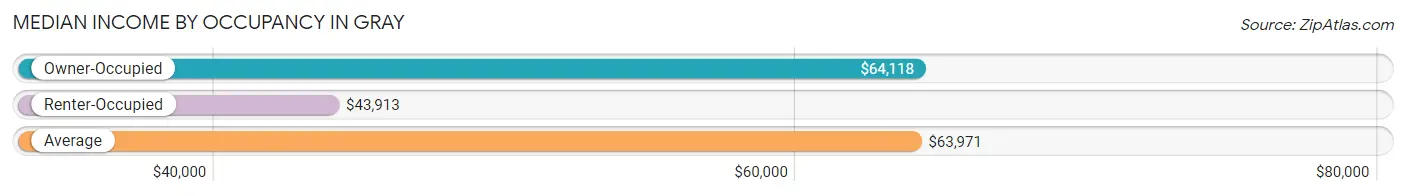
| Occupancy Type | # Households | Median Income |
| Owner-Occupied | 444 (84.7%) | $64,118 |
| Renter-Occupied | 80 (15.3%) | $43,913 |
| Average | 524 (100.0%) | $63,971 |
Occupancy by Householder Income Bracket in Gray
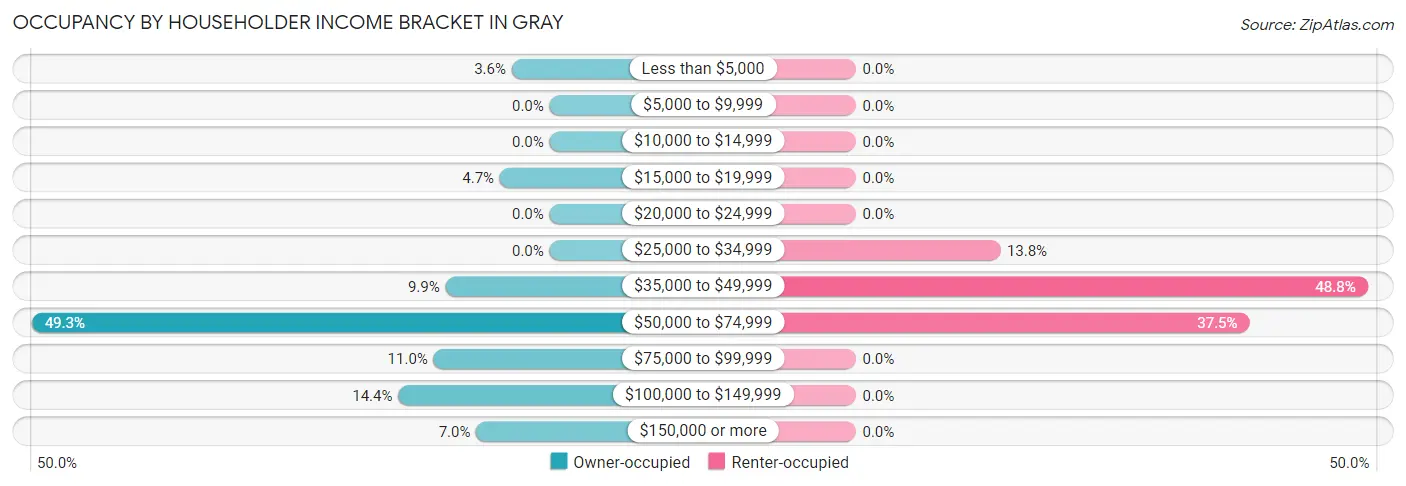
| Income Bracket | Owner-occupied | Renter-occupied |
| Less than $5,000 | 16 (3.6%) | 0 (0.0%) |
| $5,000 to $9,999 | 0 (0.0%) | 0 (0.0%) |
| $10,000 to $14,999 | 0 (0.0%) | 0 (0.0%) |
| $15,000 to $19,999 | 21 (4.7%) | 0 (0.0%) |
| $20,000 to $24,999 | 0 (0.0%) | 0 (0.0%) |
| $25,000 to $34,999 | 0 (0.0%) | 11 (13.8%) |
| $35,000 to $49,999 | 44 (9.9%) | 39 (48.7%) |
| $50,000 to $74,999 | 219 (49.3%) | 30 (37.5%) |
| $75,000 to $99,999 | 49 (11.0%) | 0 (0.0%) |
| $100,000 to $149,999 | 64 (14.4%) | 0 (0.0%) |
| $150,000 or more | 31 (7.0%) | 0 (0.0%) |
| Total | 444 (100.0%) | 80 (100.0%) |
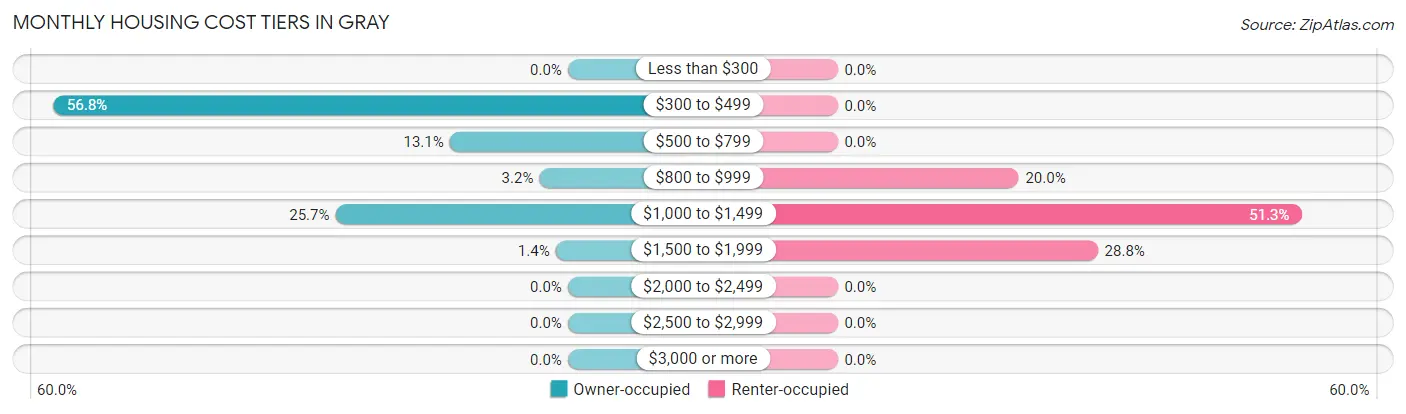
Monthly Housing Cost Tiers in Gray
| Monthly Cost | Owner-occupied | Renter-occupied |
| Less than $300 | 0 (0.0%) | 0 (0.0%) |
| $300 to $499 | 252 (56.8%) | 0 (0.0%) |
| $500 to $799 | 58 (13.1%) | 0 (0.0%) |
| $800 to $999 | 14 (3.2%) | 16 (20.0%) |
| $1,000 to $1,499 | 114 (25.7%) | 41 (51.2%) |
| $1,500 to $1,999 | 6 (1.3%) | 23 (28.7%) |
| $2,000 to $2,499 | 0 (0.0%) | 0 (0.0%) |
| $2,500 to $2,999 | 0 (0.0%) | 0 (0.0%) |
| $3,000 or more | 0 (0.0%) | 0 (0.0%) |
| Total | 444 (100.0%) | 80 (100.0%) |
Physical Housing Characteristics in Gray
Housing Structures in Gray
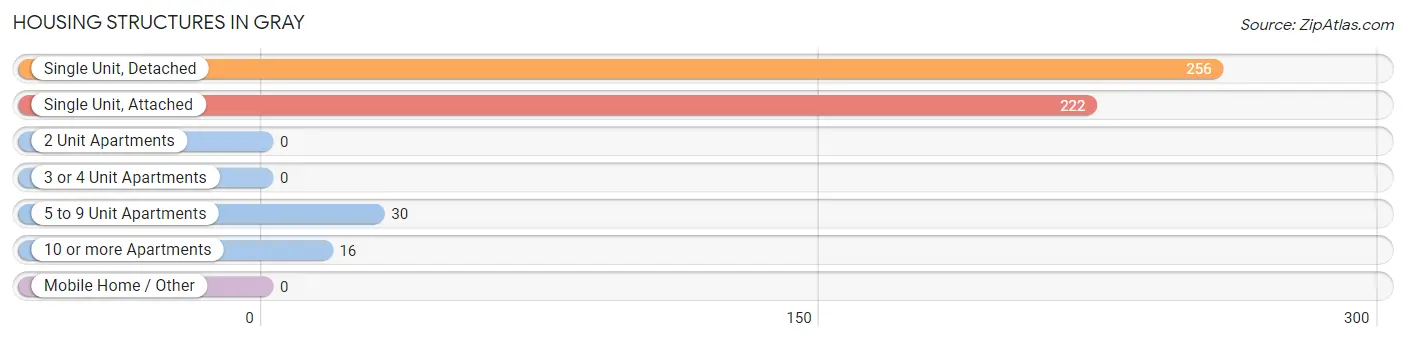
| Structure Type | # Housing Units | % Housing Units |
| Single Unit, Detached | 256 | 48.8% |
| Single Unit, Attached | 222 | 42.4% |
| 2 Unit Apartments | 0 | 0.0% |
| 3 or 4 Unit Apartments | 0 | 0.0% |
| 5 to 9 Unit Apartments | 30 | 5.7% |
| 10 or more Apartments | 16 | 3.0% |
| Mobile Home / Other | 0 | 0.0% |
| Total | 524 | 100.0% |
Housing Structures by Occupancy in Gray
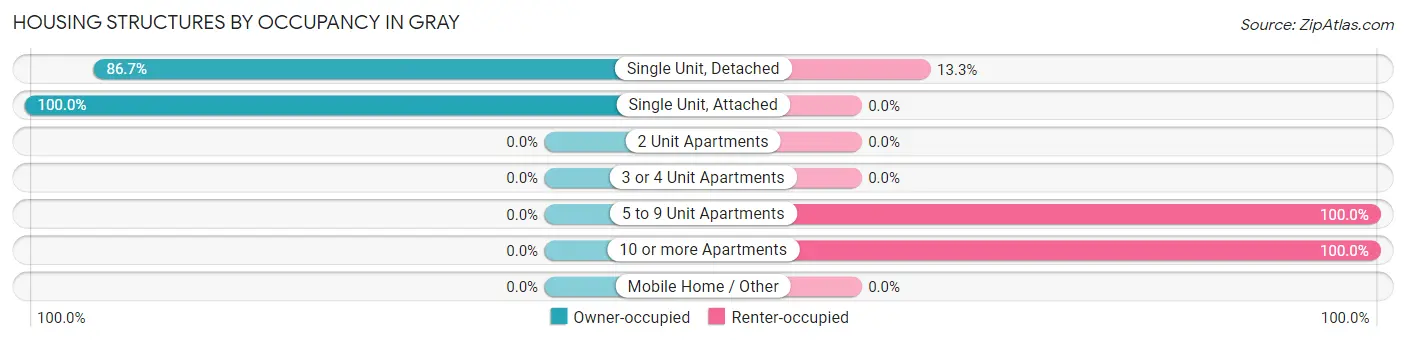
| Structure Type | Owner-occupied | Renter-occupied |
| Single Unit, Detached | 222 (86.7%) | 34 (13.3%) |
| Single Unit, Attached | 222 (100.0%) | 0 (0.0%) |
| 2 Unit Apartments | 0 (0.0%) | 0 (0.0%) |
| 3 or 4 Unit Apartments | 0 (0.0%) | 0 (0.0%) |
| 5 to 9 Unit Apartments | 0 (0.0%) | 30 (100.0%) |
| 10 or more Apartments | 0 (0.0%) | 16 (100.0%) |
| Mobile Home / Other | 0 (0.0%) | 0 (0.0%) |
| Total | 444 (84.7%) | 80 (15.3%) |
Housing Structures by Number of Rooms in Gray
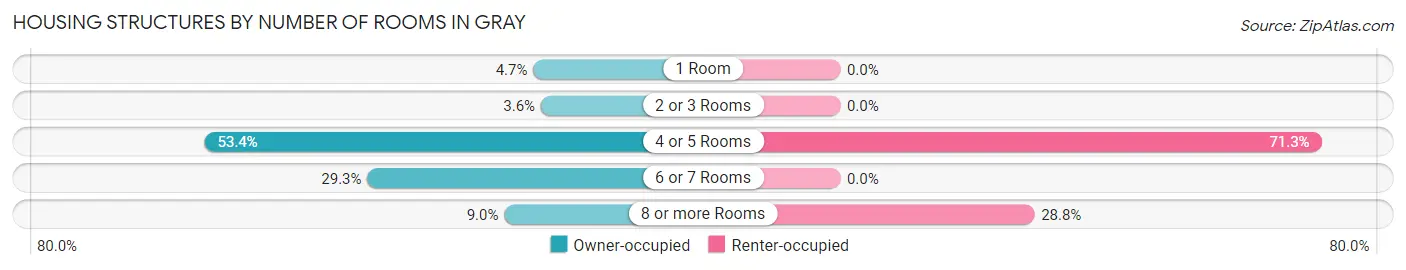
| Number of Rooms | Owner-occupied | Renter-occupied |
| 1 Room | 21 (4.7%) | 0 (0.0%) |
| 2 or 3 Rooms | 16 (3.6%) | 0 (0.0%) |
| 4 or 5 Rooms | 237 (53.4%) | 57 (71.3%) |
| 6 or 7 Rooms | 130 (29.3%) | 0 (0.0%) |
| 8 or more Rooms | 40 (9.0%) | 23 (28.7%) |
| Total | 444 (100.0%) | 80 (100.0%) |
Housing Structure by Heating Type in Gray
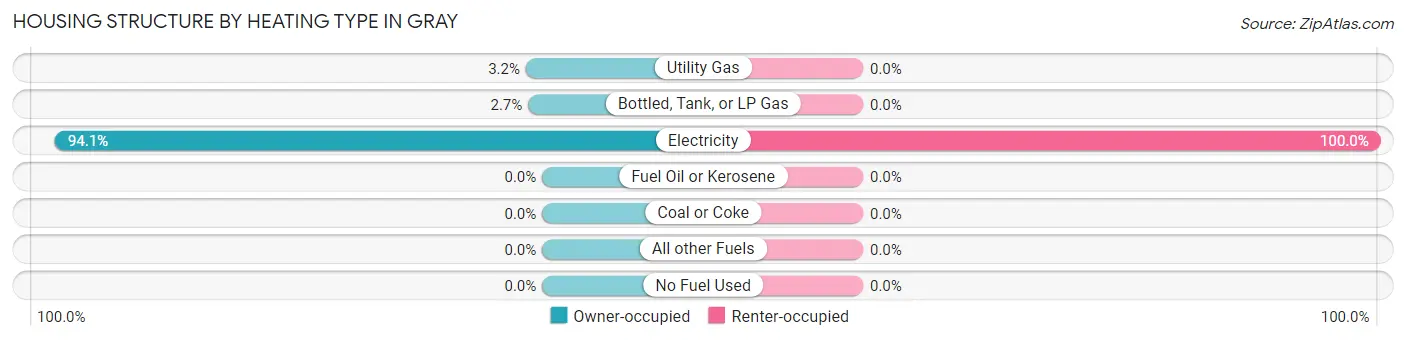
| Heating Type | Owner-occupied | Renter-occupied |
| Utility Gas | 14 (3.2%) | 0 (0.0%) |
| Bottled, Tank, or LP Gas | 12 (2.7%) | 0 (0.0%) |
| Electricity | 418 (94.1%) | 80 (100.0%) |
| Fuel Oil or Kerosene | 0 (0.0%) | 0 (0.0%) |
| Coal or Coke | 0 (0.0%) | 0 (0.0%) |
| All other Fuels | 0 (0.0%) | 0 (0.0%) |
| No Fuel Used | 0 (0.0%) | 0 (0.0%) |
| Total | 444 (100.0%) | 80 (100.0%) |
Household Vehicle Usage in Gray
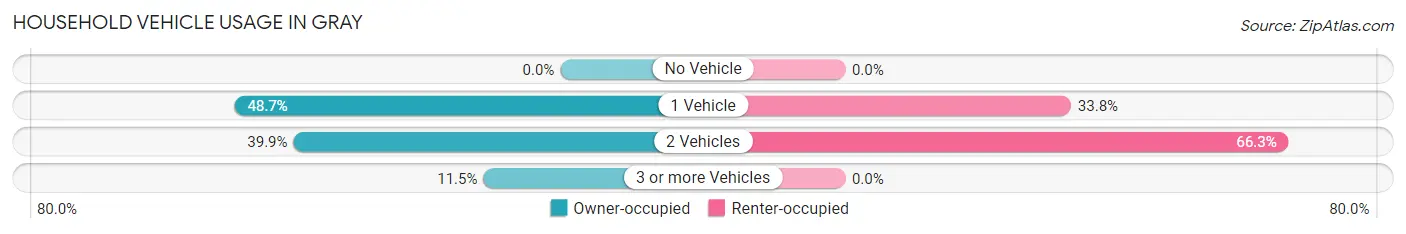
| Vehicles per Household | Owner-occupied | Renter-occupied |
| No Vehicle | 0 (0.0%) | 0 (0.0%) |
| 1 Vehicle | 216 (48.6%) | 27 (33.8%) |
| 2 Vehicles | 177 (39.9%) | 53 (66.2%) |
| 3 or more Vehicles | 51 (11.5%) | 0 (0.0%) |
| Total | 444 (100.0%) | 80 (100.0%) |
Real Estate & Mortgages in Gray
Real Estate and Mortgage Overview in Gray
| Characteristic | Without Mortgage | With Mortgage |
| Housing Units | 310 | 134 |
| Median Property Value | $168,200 | $189,000 |
| Median Household Income | $63,734 | $19 |
| Monthly Housing Costs | $387 | $0 |
| Real Estate Taxes | $970 | $16 |
Property Value by Mortgage Status in Gray
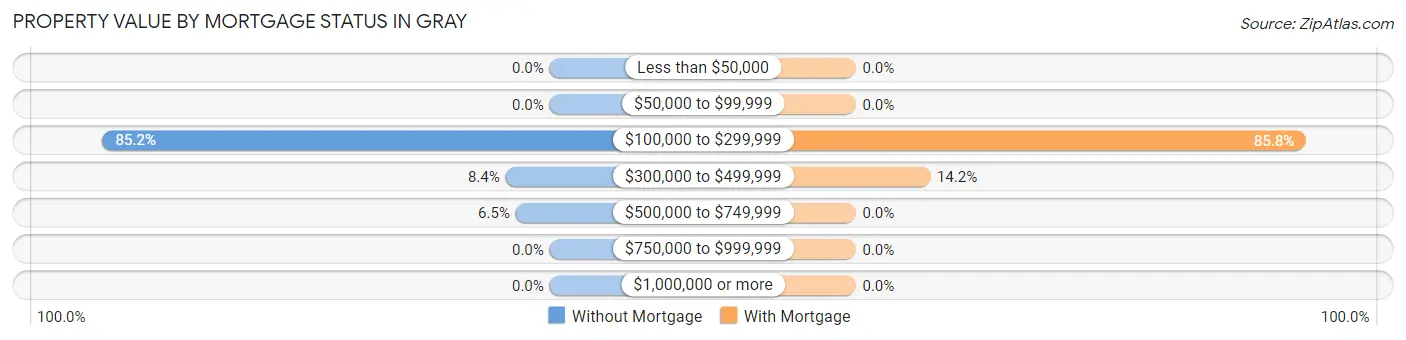
| Property Value | Without Mortgage | With Mortgage |
| Less than $50,000 | 0 (0.0%) | 0 (0.0%) |
| $50,000 to $99,999 | 0 (0.0%) | 0 (0.0%) |
| $100,000 to $299,999 | 264 (85.2%) | 115 (85.8%) |
| $300,000 to $499,999 | 26 (8.4%) | 19 (14.2%) |
| $500,000 to $749,999 | 20 (6.5%) | 0 (0.0%) |
| $750,000 to $999,999 | 0 (0.0%) | 0 (0.0%) |
| $1,000,000 or more | 0 (0.0%) | 0 (0.0%) |
| Total | 310 (100.0%) | 134 (100.0%) |
Household Income by Mortgage Status in Gray
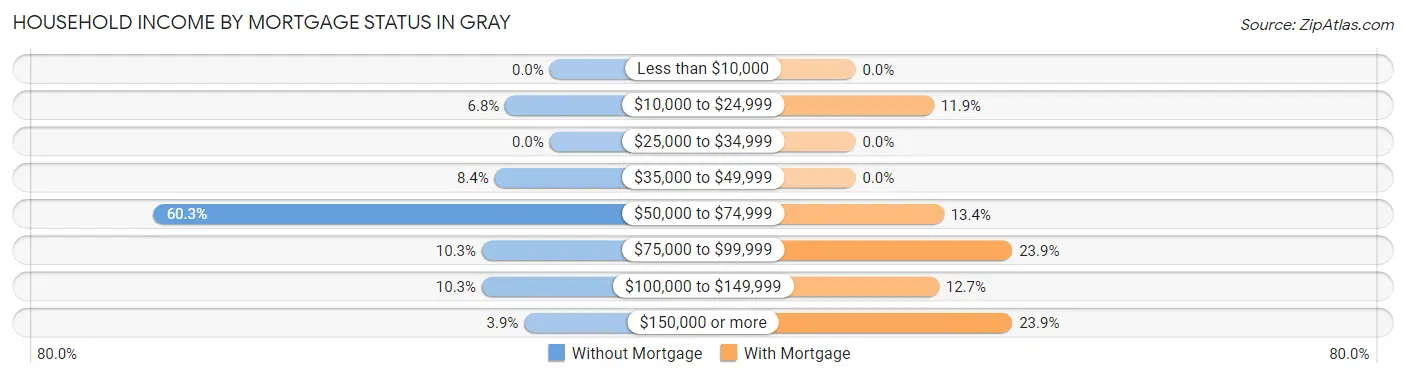
| Household Income | Without Mortgage | With Mortgage |
| Less than $10,000 | 0 (0.0%) | 0 (0.0%) |
| $10,000 to $24,999 | 21 (6.8%) | 16 (11.9%) |
| $25,000 to $34,999 | 0 (0.0%) | 0 (0.0%) |
| $35,000 to $49,999 | 26 (8.4%) | 0 (0.0%) |
| $50,000 to $74,999 | 187 (60.3%) | 18 (13.4%) |
| $75,000 to $99,999 | 32 (10.3%) | 32 (23.9%) |
| $100,000 to $149,999 | 32 (10.3%) | 17 (12.7%) |
| $150,000 or more | 12 (3.9%) | 32 (23.9%) |
| Total | 310 (100.0%) | 134 (100.0%) |
Property Value to Household Income Ratio in Gray
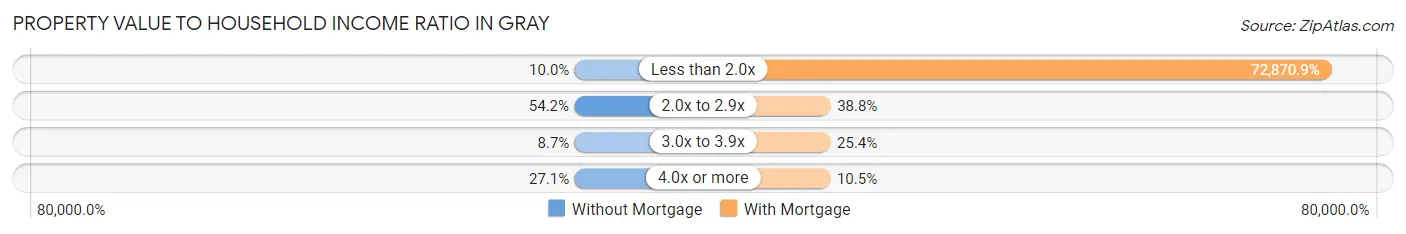
| Value-to-Income Ratio | Without Mortgage | With Mortgage |
| Less than 2.0x | 31 (10.0%) | 97,647 (72,870.9%) |
| 2.0x to 2.9x | 168 (54.2%) | 52 (38.8%) |
| 3.0x to 3.9x | 27 (8.7%) | 34 (25.4%) |
| 4.0x or more | 84 (27.1%) | 14 (10.4%) |
| Total | 310 (100.0%) | 134 (100.0%) |
Real Estate Taxes by Mortgage Status in Gray
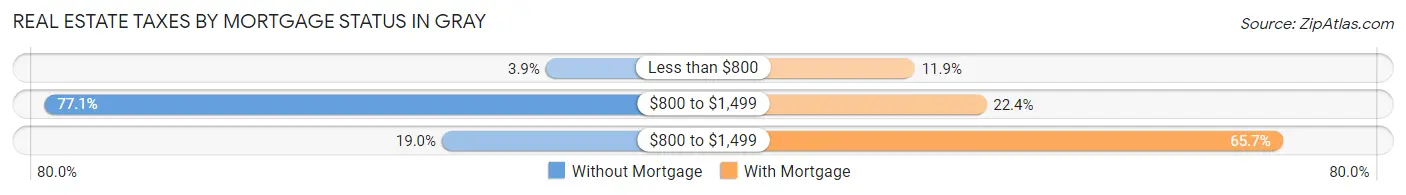
| Property Taxes | Without Mortgage | With Mortgage |
| Less than $800 | 12 (3.9%) | 16 (11.9%) |
| $800 to $1,499 | 239 (77.1%) | 30 (22.4%) |
| $800 to $1,499 | 59 (19.0%) | 88 (65.7%) |
| Total | 310 (100.0%) | 134 (100.0%) |
Health & Disability in Gray
Health Insurance Coverage by Age in Gray
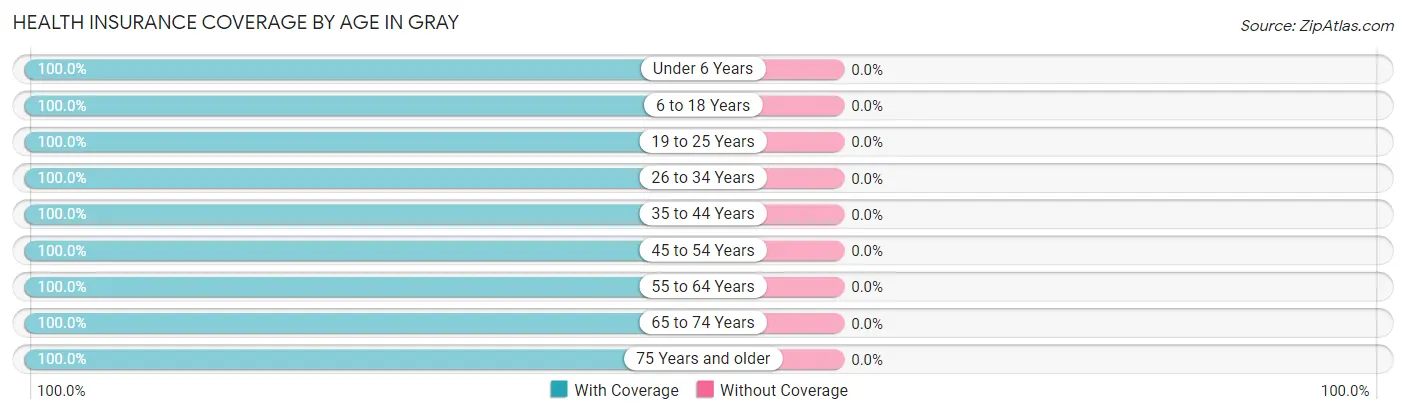
| Age Bracket | With Coverage | Without Coverage |
| Under 6 Years | 56 (100.0%) | 0 (0.0%) |
| 6 to 18 Years | 144 (100.0%) | 0 (0.0%) |
| 19 to 25 Years | 138 (100.0%) | 0 (0.0%) |
| 26 to 34 Years | 17 (100.0%) | 0 (0.0%) |
| 35 to 44 Years | 133 (100.0%) | 0 (0.0%) |
| 45 to 54 Years | 135 (100.0%) | 0 (0.0%) |
| 55 to 64 Years | 103 (100.0%) | 0 (0.0%) |
| 65 to 74 Years | 419 (100.0%) | 0 (0.0%) |
| 75 Years and older | 131 (100.0%) | 0 (0.0%) |
| Total | 1,276 (100.0%) | 0 (0.0%) |
Health Insurance Coverage by Citizenship Status in Gray
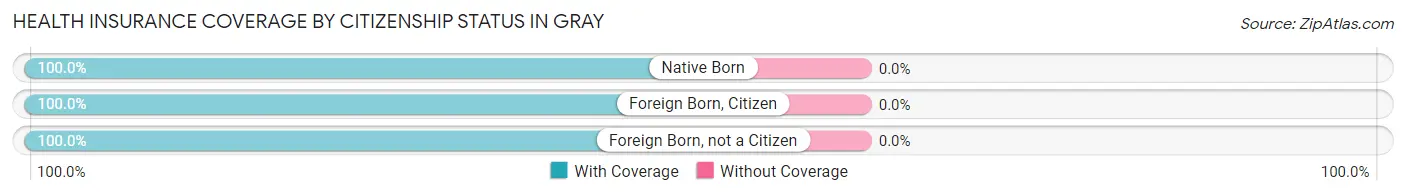
| Citizenship Status | With Coverage | Without Coverage |
| Native Born | 56 (100.0%) | 0 (0.0%) |
| Foreign Born, Citizen | 144 (100.0%) | 0 (0.0%) |
| Foreign Born, not a Citizen | 138 (100.0%) | 0 (0.0%) |
Health Insurance Coverage by Household Income in Gray
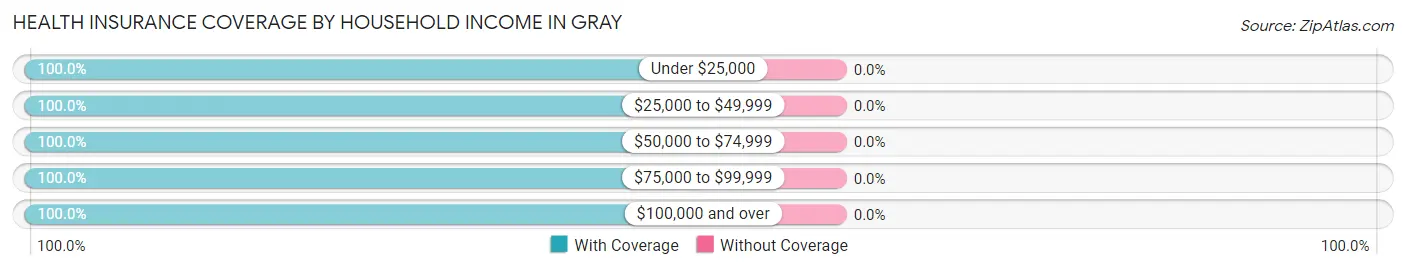
| Household Income | With Coverage | Without Coverage |
| Under $25,000 | 37 (100.0%) | 0 (0.0%) |
| $25,000 to $49,999 | 280 (100.0%) | 0 (0.0%) |
| $50,000 to $74,999 | 496 (100.0%) | 0 (0.0%) |
| $75,000 to $99,999 | 167 (100.0%) | 0 (0.0%) |
| $100,000 and over | 296 (100.0%) | 0 (0.0%) |
Public vs Private Health Insurance Coverage by Age in Gray
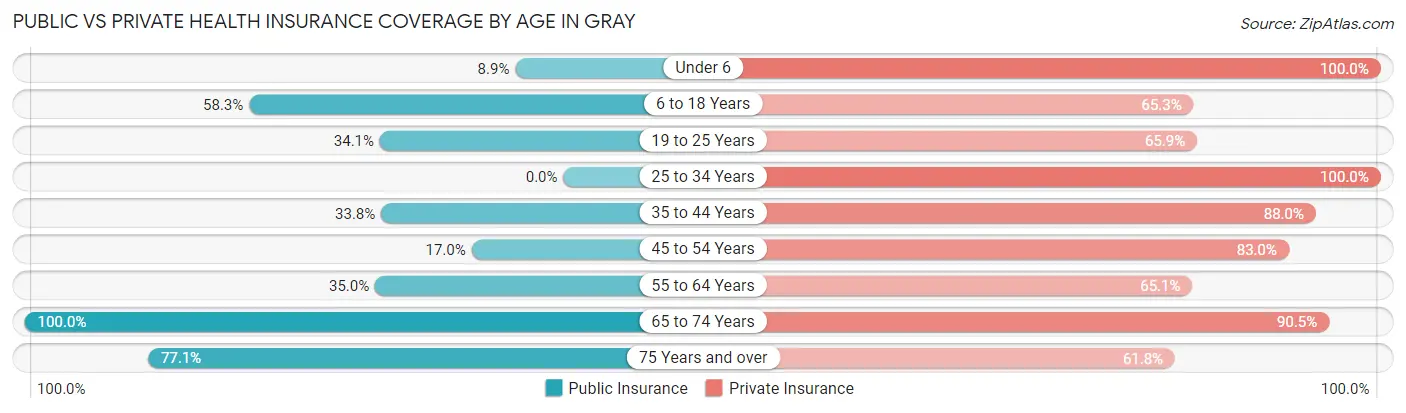
| Age Bracket | Public Insurance | Private Insurance |
| Under 6 | 5 (8.9%) | 56 (100.0%) |
| 6 to 18 Years | 84 (58.3%) | 94 (65.3%) |
| 19 to 25 Years | 47 (34.1%) | 91 (65.9%) |
| 25 to 34 Years | 0 (0.0%) | 17 (100.0%) |
| 35 to 44 Years | 45 (33.8%) | 117 (88.0%) |
| 45 to 54 Years | 23 (17.0%) | 112 (83.0%) |
| 55 to 64 Years | 36 (34.9%) | 67 (65.0%) |
| 65 to 74 Years | 419 (100.0%) | 379 (90.4%) |
| 75 Years and over | 101 (77.1%) | 81 (61.8%) |
| Total | 760 (59.6%) | 1,014 (79.5%) |
Disability Status by Sex by Age in Gray
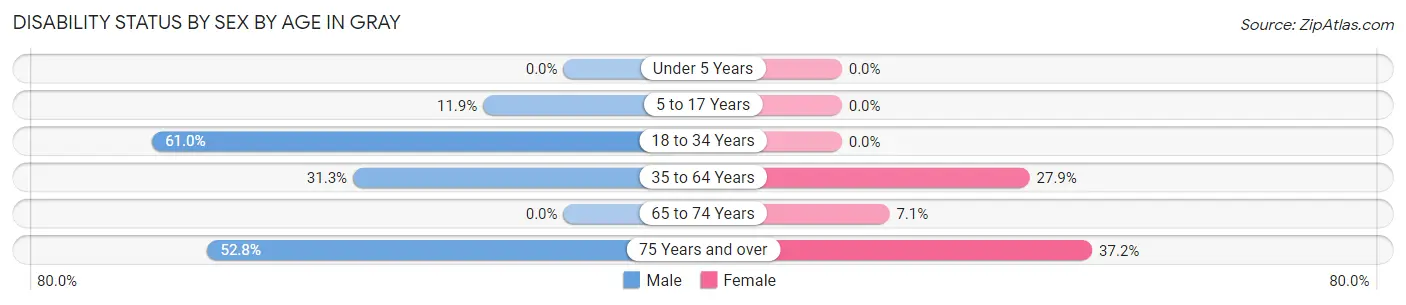
| Age Bracket | Male | Female |
| Under 5 Years | 0 (0.0%) | 0 (0.0%) |
| 5 to 17 Years | 13 (11.9%) | 0 (0.0%) |
| 18 to 34 Years | 47 (61.0%) | 0 (0.0%) |
| 35 to 64 Years | 70 (31.2%) | 41 (27.9%) |
| 65 to 74 Years | 0 (0.0%) | 16 (7.1%) |
| 75 Years and over | 28 (52.8%) | 29 (37.2%) |
Disability Class by Sex by Age in Gray
Disability Class: Hearing Difficulty
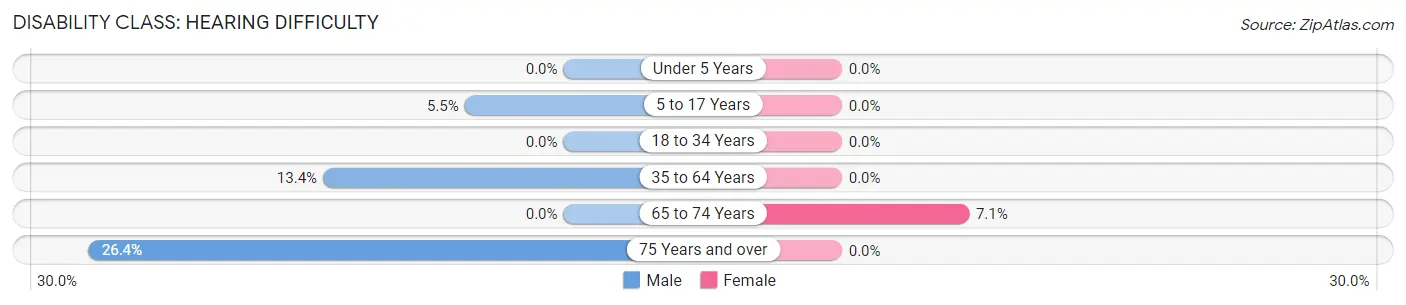
| Age Bracket | Male | Female |
| Under 5 Years | 0 (0.0%) | 0 (0.0%) |
| 5 to 17 Years | 6 (5.5%) | 0 (0.0%) |
| 18 to 34 Years | 0 (0.0%) | 0 (0.0%) |
| 35 to 64 Years | 30 (13.4%) | 0 (0.0%) |
| 65 to 74 Years | 0 (0.0%) | 16 (7.1%) |
| 75 Years and over | 14 (26.4%) | 0 (0.0%) |
Disability Class: Vision Difficulty
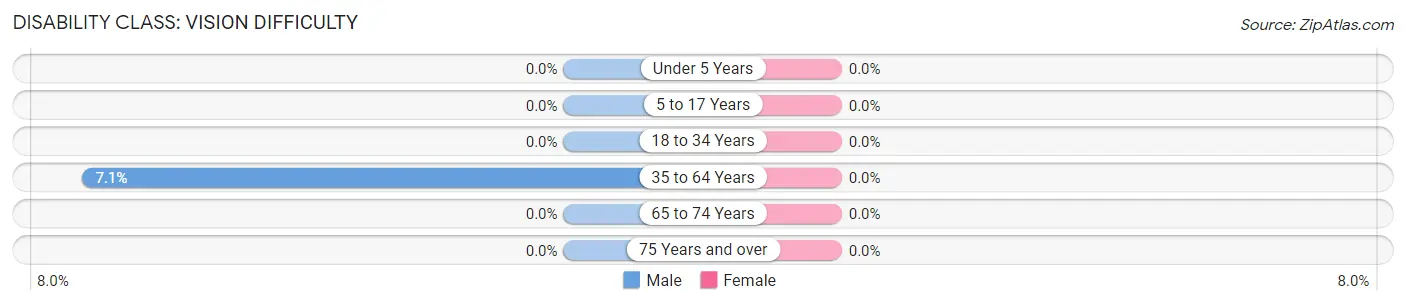
| Age Bracket | Male | Female |
| Under 5 Years | 0 (0.0%) | 0 (0.0%) |
| 5 to 17 Years | 0 (0.0%) | 0 (0.0%) |
| 18 to 34 Years | 0 (0.0%) | 0 (0.0%) |
| 35 to 64 Years | 16 (7.1%) | 0 (0.0%) |
| 65 to 74 Years | 0 (0.0%) | 0 (0.0%) |
| 75 Years and over | 0 (0.0%) | 0 (0.0%) |
Disability Class: Cognitive Difficulty
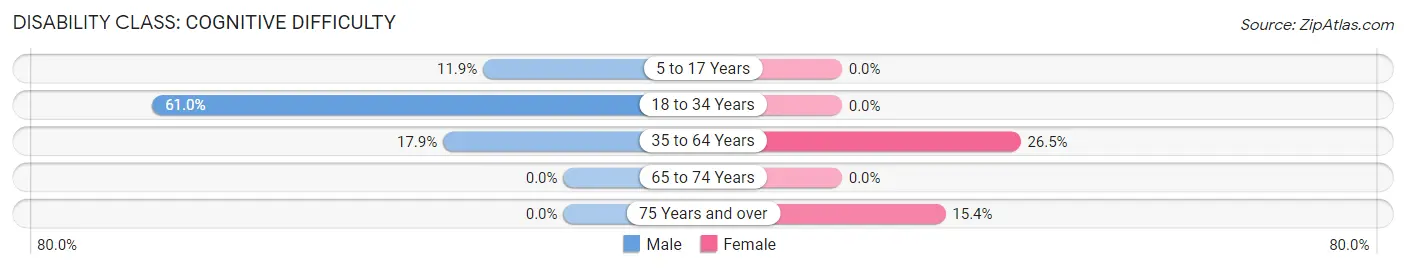
| Age Bracket | Male | Female |
| 5 to 17 Years | 13 (11.9%) | 0 (0.0%) |
| 18 to 34 Years | 47 (61.0%) | 0 (0.0%) |
| 35 to 64 Years | 40 (17.9%) | 39 (26.5%) |
| 65 to 74 Years | 0 (0.0%) | 0 (0.0%) |
| 75 Years and over | 0 (0.0%) | 12 (15.4%) |
Disability Class: Ambulatory Difficulty
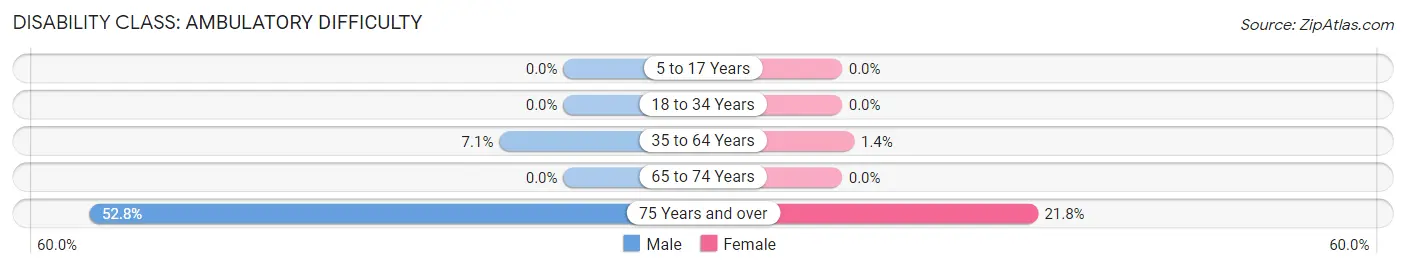
| Age Bracket | Male | Female |
| 5 to 17 Years | 0 (0.0%) | 0 (0.0%) |
| 18 to 34 Years | 0 (0.0%) | 0 (0.0%) |
| 35 to 64 Years | 16 (7.1%) | 2 (1.4%) |
| 65 to 74 Years | 0 (0.0%) | 0 (0.0%) |
| 75 Years and over | 28 (52.8%) | 17 (21.8%) |
Disability Class: Self-Care Difficulty
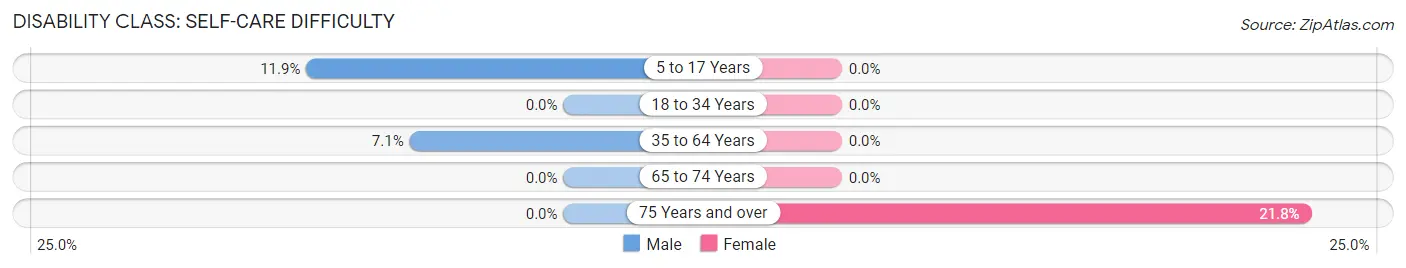
| Age Bracket | Male | Female |
| 5 to 17 Years | 13 (11.9%) | 0 (0.0%) |
| 18 to 34 Years | 0 (0.0%) | 0 (0.0%) |
| 35 to 64 Years | 16 (7.1%) | 0 (0.0%) |
| 65 to 74 Years | 0 (0.0%) | 0 (0.0%) |
| 75 Years and over | 0 (0.0%) | 17 (21.8%) |
Technology Access in Gray
Computing Device Access in Gray
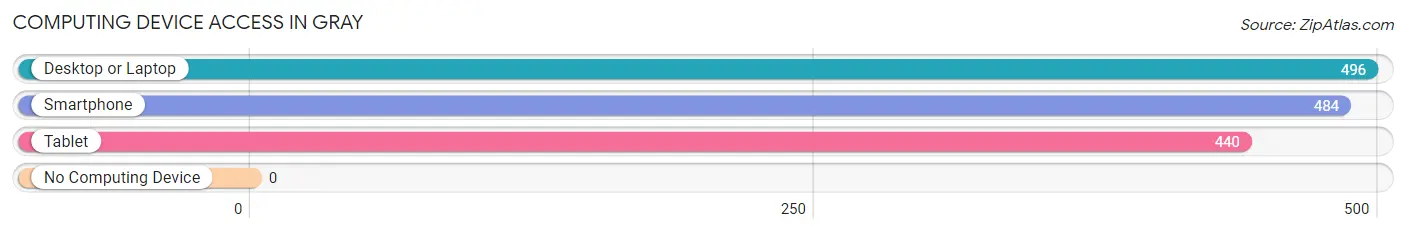
| Device Type | # Households | % Households |
| Desktop or Laptop | 496 | 94.7% |
| Smartphone | 484 | 92.4% |
| Tablet | 440 | 84.0% |
| No Computing Device | 0 | 0.0% |
| Total | 524 | 100.0% |
Internet Access in Gray
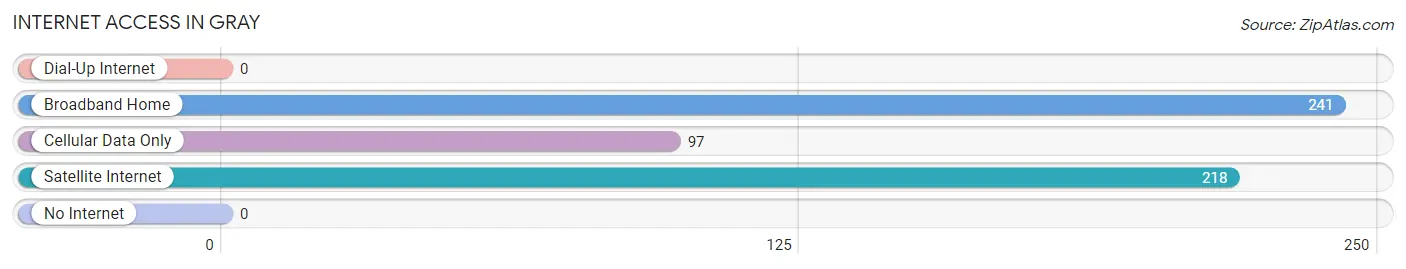
| Internet Type | # Households | % Households |
| Dial-Up Internet | 0 | 0.0% |
| Broadband Home | 241 | 46.0% |
| Cellular Data Only | 97 | 18.5% |
| Satellite Internet | 218 | 41.6% |
| No Internet | 0 | 0.0% |
| Total | 524 | 100.0% |
Gray Summary
Gray, Tennessee is a small city located in Washington County, in the northeastern part of the state. It is part of the Johnson City Metropolitan Statistical Area, and is situated along the Nolichucky River. The city has a population of approximately 7,000 people, and is known for its rural charm and small-town atmosphere.
Geography
Gray is located in the Appalachian Mountains, and is surrounded by rolling hills and lush forests. The city is situated at an elevation of 1,400 feet, and is located at the intersection of Interstate 81 and State Route 75. The Nolichucky River runs through the city, and is a popular spot for fishing and other outdoor activities. The city is also home to several parks, including Gray Community Park, which features a playground, picnic areas, and a walking trail.
Economy
Gray’s economy is largely based on agriculture and manufacturing. The city is home to several large farms, which produce a variety of crops, including corn, soybeans, and hay. The city is also home to several manufacturing companies, including Eastman Chemical Company, which produces a variety of chemicals and plastics. The city is also home to several small businesses, including restaurants, retail stores, and service providers.
Demographics
As of the 2010 census, the population of Gray was 7,001. The racial makeup of the city was 95.3% White, 1.3% African American, 0.3% Native American, 0.7% Asian, 0.1% Pacific Islander, and 1.3% from other races. The median household income was $37,945, and the median family income was $45,945. The per capita income was $19,945.
Conclusion
Gray, Tennessee is a small city located in Washington County, in the northeastern part of the state. It is part of the Johnson City Metropolitan Statistical Area, and is situated along the Nolichucky River. The city has a population of approximately 7,000 people, and is known for its rural charm and small-town atmosphere. The economy of Gray is largely based on agriculture and manufacturing, and the city is home to several large farms and manufacturing companies. The racial makeup of the city is predominantly White, with a small percentage of African American, Native American, Asian, and Pacific Islander residents. The median household income is $37,945, and the median family income is $45,945.
Common Questions
What is Per Capita Income in Gray?
Per Capita income in Gray is $30,395.
What is the Median Family Income in Gray?
Median Family Income in Gray is $64,309.
What is the Median Household income in Gray?
Median Household Income in Gray is $63,971.
What is Income or Wage Gap in Gray?
Income or Wage Gap in Gray is 30.6%.
Women in Gray earn 69.4 cents for every dollar earned by a man.
What is Inequality or Gini Index in Gray?
Inequality or Gini Index in Gray is 0.30.
What is the Total Population of Gray?
Total Population of Gray is 1,276.
What is the Total Male Population of Gray?
Total Male Population of Gray is 691.
What is the Total Female Population of Gray?
Total Female Population of Gray is 585.
What is the Ratio of Males per 100 Females in Gray?
There are 118.12 Males per 100 Females in Gray.
What is the Ratio of Females per 100 Males in Gray?
There are 84.66 Females per 100 Males in Gray.
What is the Median Population Age in Gray?
Median Population Age in Gray is 60.9 Years.
What is the Average Family Size in Gray
Average Family Size in Gray is 2.7 People.
What is the Average Household Size in Gray
Average Household Size in Gray is 2.4 People.
How Large is the Labor Force in Gray?
There are 345 People in the Labor Forcein in Gray.
What is the Percentage of People in the Labor Force in Gray?
31.3% of People are in the Labor Force in Gray.