Zip Codes with the Highest Percentage of Population Employed in Food Preparation & Serving in Franklin, TN
RELATED REPORTS & OPTIONS
Food Preparation & Serving
Franklin
Compare Zip Codes
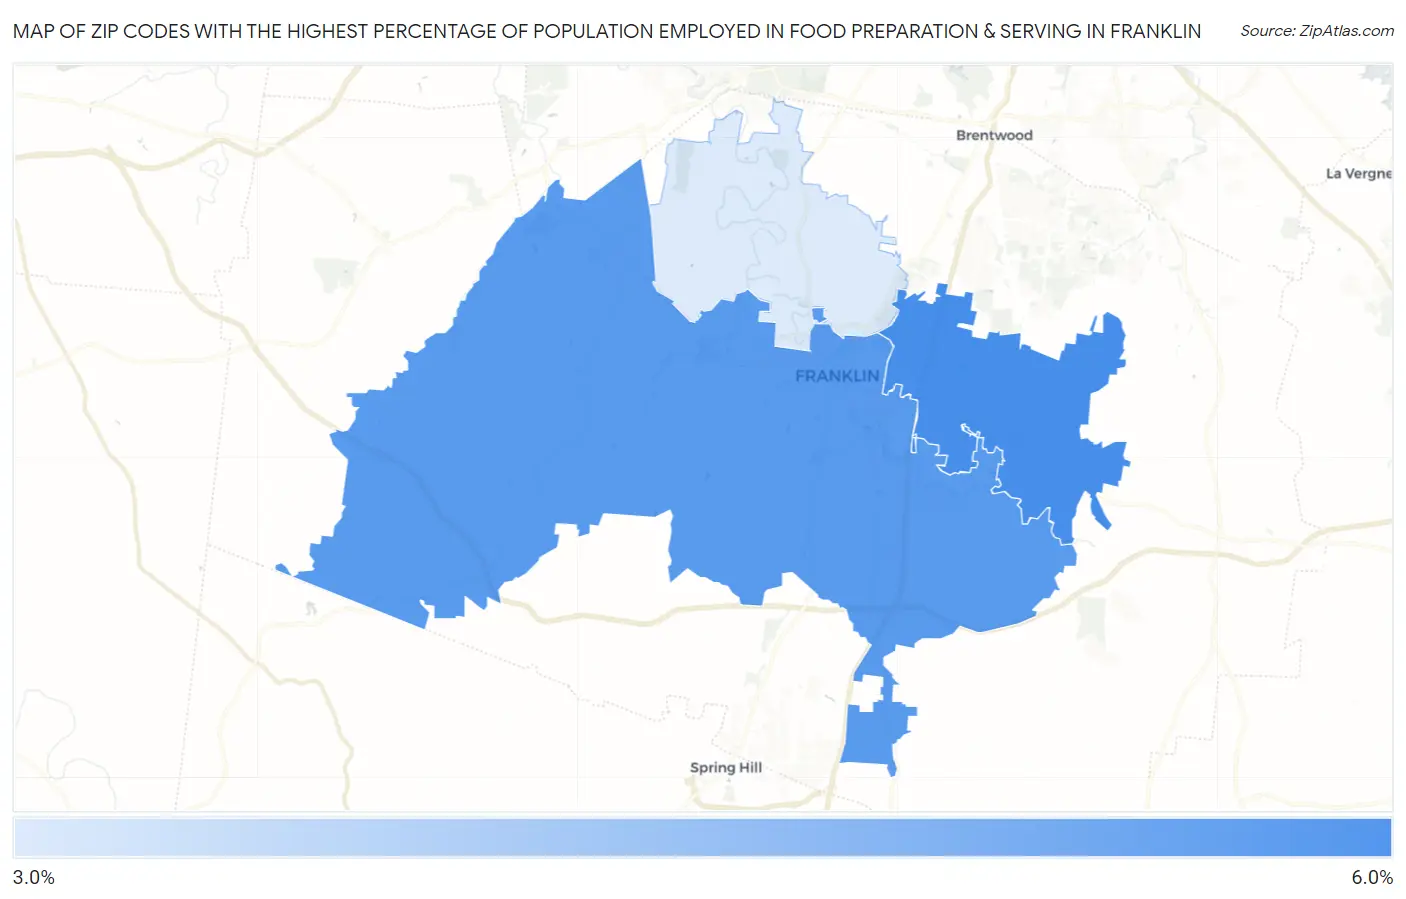
Map of Zip Codes with the Highest Percentage of Population Employed in Food Preparation & Serving in Franklin
3.1%
5.3%
Zip Codes with the Highest Percentage of Population Employed in Food Preparation & Serving in Franklin, TN
| Zip Code | % Employed | vs State | vs National | |
| 1. | 37067 | 5.3% | 5.4%(-0.106)#232 | 5.3%(+0.027)#11,713 |
| 2. | 37064 | 5.1% | 5.4%(-0.333)#245 | 5.3%(-0.200)#12,593 |
| 3. | 37069 | 3.1% | 5.4%(-2.28)#425 | 5.3%(-2.15)#20,716 |
1
Common Questions
What are the Top Zip Codes with the Highest Percentage of Population Employed in Food Preparation & Serving in Franklin, TN?
Top Zip Codes with the Highest Percentage of Population Employed in Food Preparation & Serving in Franklin, TN are:
What zip code has the Highest Percentage of Population Employed in Food Preparation & Serving in Franklin, TN?
37067 has the Highest Percentage of Population Employed in Food Preparation & Serving in Franklin, TN with 5.3%.
What is the Percentage of Population Employed in Food Preparation & Serving in Franklin, TN?
Percentage of Population Employed in Food Preparation & Serving in Franklin is 5.2%.
What is the Percentage of Population Employed in Food Preparation & Serving in Tennessee?
Percentage of Population Employed in Food Preparation & Serving in Tennessee is 5.4%.
What is the Percentage of Population Employed in Food Preparation & Serving in the United States?
Percentage of Population Employed in Food Preparation & Serving in the United States is 5.3%.