Zip Codes with the Highest Percentage of Population Employed in Food Preparation & Serving in Cordova, TN
RELATED REPORTS & OPTIONS
Food Preparation & Serving
Cordova
Compare Zip Codes
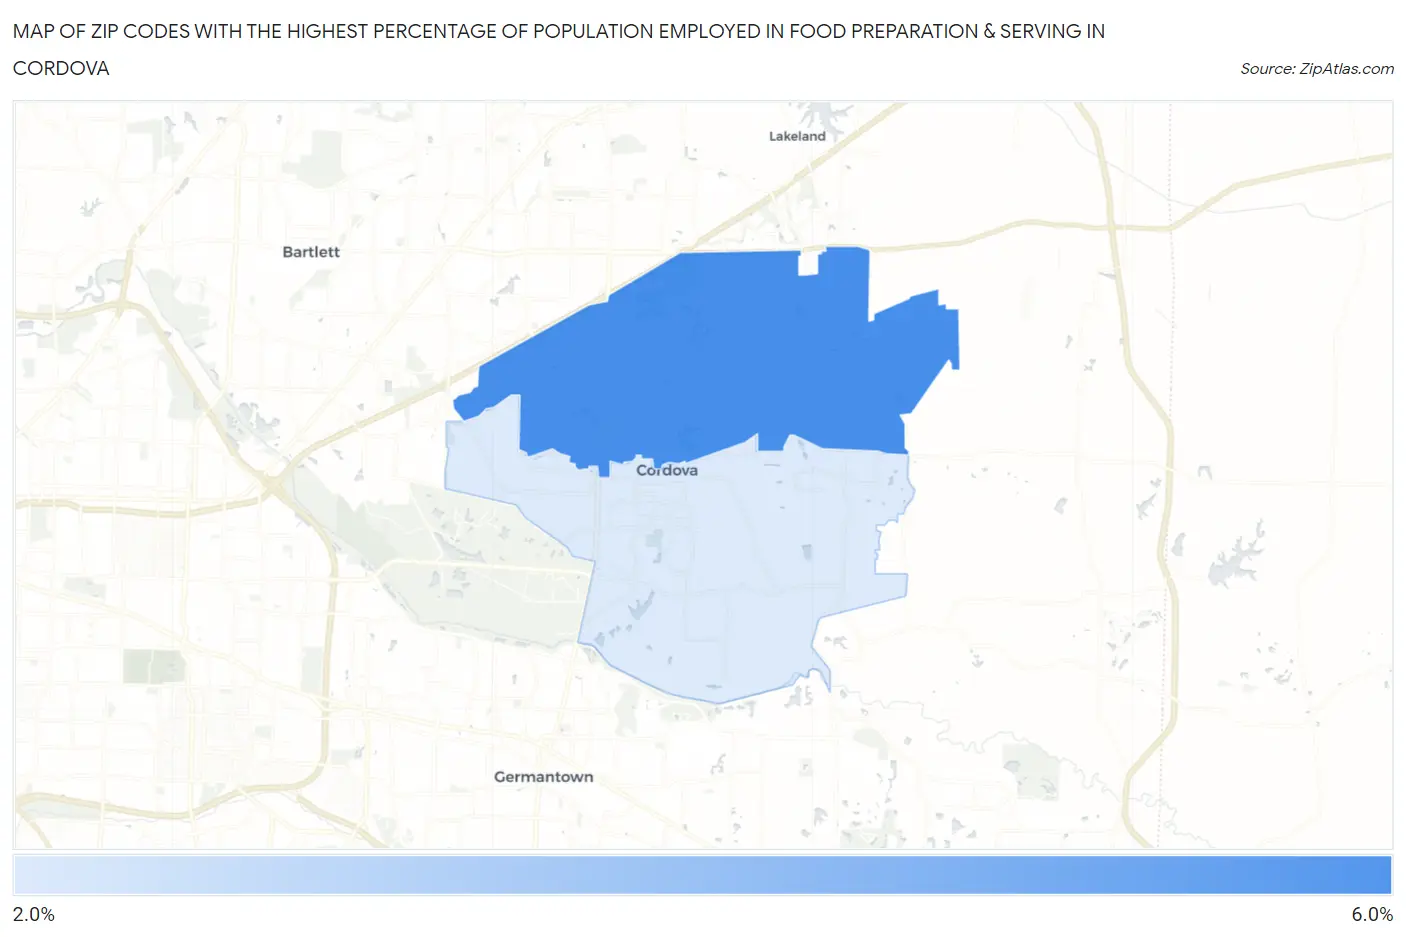
Map of Zip Codes with the Highest Percentage of Population Employed in Food Preparation & Serving in Cordova
2.5%
5.2%
Zip Codes with the Highest Percentage of Population Employed in Food Preparation & Serving in Cordova, TN
| Zip Code | % Employed | vs State | vs National | |
| 1. | 38016 | 5.2% | 5.4%(-0.253)#238 | 5.3%(-0.120)#12,293 |
| 2. | 38018 | 2.5% | 5.4%(-2.90)#467 | 5.3%(-2.77)#23,108 |
1
Common Questions
What are the Top Zip Codes with the Highest Percentage of Population Employed in Food Preparation & Serving in Cordova, TN?
Top Zip Codes with the Highest Percentage of Population Employed in Food Preparation & Serving in Cordova, TN are:
What zip code has the Highest Percentage of Population Employed in Food Preparation & Serving in Cordova, TN?
38016 has the Highest Percentage of Population Employed in Food Preparation & Serving in Cordova, TN with 5.2%.
What is the Percentage of Population Employed in Food Preparation & Serving in Tennessee?
Percentage of Population Employed in Food Preparation & Serving in Tennessee is 5.4%.
What is the Percentage of Population Employed in Food Preparation & Serving in the United States?
Percentage of Population Employed in Food Preparation & Serving in the United States is 5.3%.