Eagleton Village, TN Map & Demographics
Eagleton Village Map
Eagleton Village Overview
$30,343
PER CAPITA INCOME
$82,997
AVG FAMILY INCOME
$53,579
AVG HOUSEHOLD INCOME
43.0%
WAGE / INCOME GAP [ % ]
57.0¢/ $1
WAGE / INCOME GAP [ $ ]
0.46
INEQUALITY / GINI INDEX
5,328
TOTAL POPULATION
2,748
MALE POPULATION
2,580
FEMALE POPULATION
106.51
MALES / 100 FEMALES
93.89
FEMALES / 100 MALES
40.7
MEDIAN AGE
2.8
AVG FAMILY SIZE
2.3
AVG HOUSEHOLD SIZE
2,559
LABOR FORCE [ PEOPLE ]
61.9%
PERCENT IN LABOR FORCE
4.9%
UNEMPLOYMENT RATE
Income in Eagleton Village
Income Overview in Eagleton Village
Per Capita Income in Eagleton Village is $30,343, while median incomes of families and households are $82,997 and $53,579 respectively.
| Characteristic | Number | Measure |
| Per Capita Income | 5,328 | $30,343 |
| Median Family Income | 1,581 | $82,997 |
| Mean Family Income | 1,581 | $80,567 |
| Median Household Income | 2,278 | $53,579 |
| Mean Household Income | 2,278 | $70,053 |
| Income Deficit | 1,581 | $0 |
| Wage / Income Gap (%) | 5,328 | 43.02% |
| Wage / Income Gap ($) | 5,328 | 56.98¢ per $1 |
| Gini / Inequality Index | 5,328 | 0.46 |
Earnings by Sex in Eagleton Village
Average Earnings in Eagleton Village are $40,711, $52,142 for men and $29,713 for women, a difference of 43.0%.
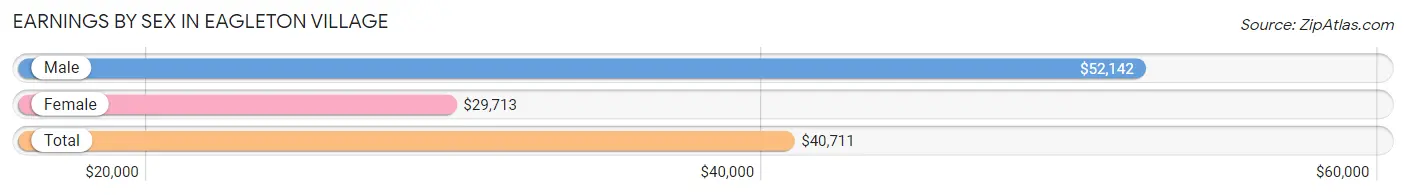
| Sex | Number | Average Earnings |
| Male | 1,277 (47.8%) | $52,142 |
| Female | 1,394 (52.2%) | $29,713 |
| Total | 2,671 (100.0%) | $40,711 |
Earnings by Sex by Income Bracket in Eagleton Village
The most common earnings brackets in Eagleton Village are $55,000 to $64,999 for men (244 | 19.1%) and $45,000 to $49,999 for women (148 | 10.6%).
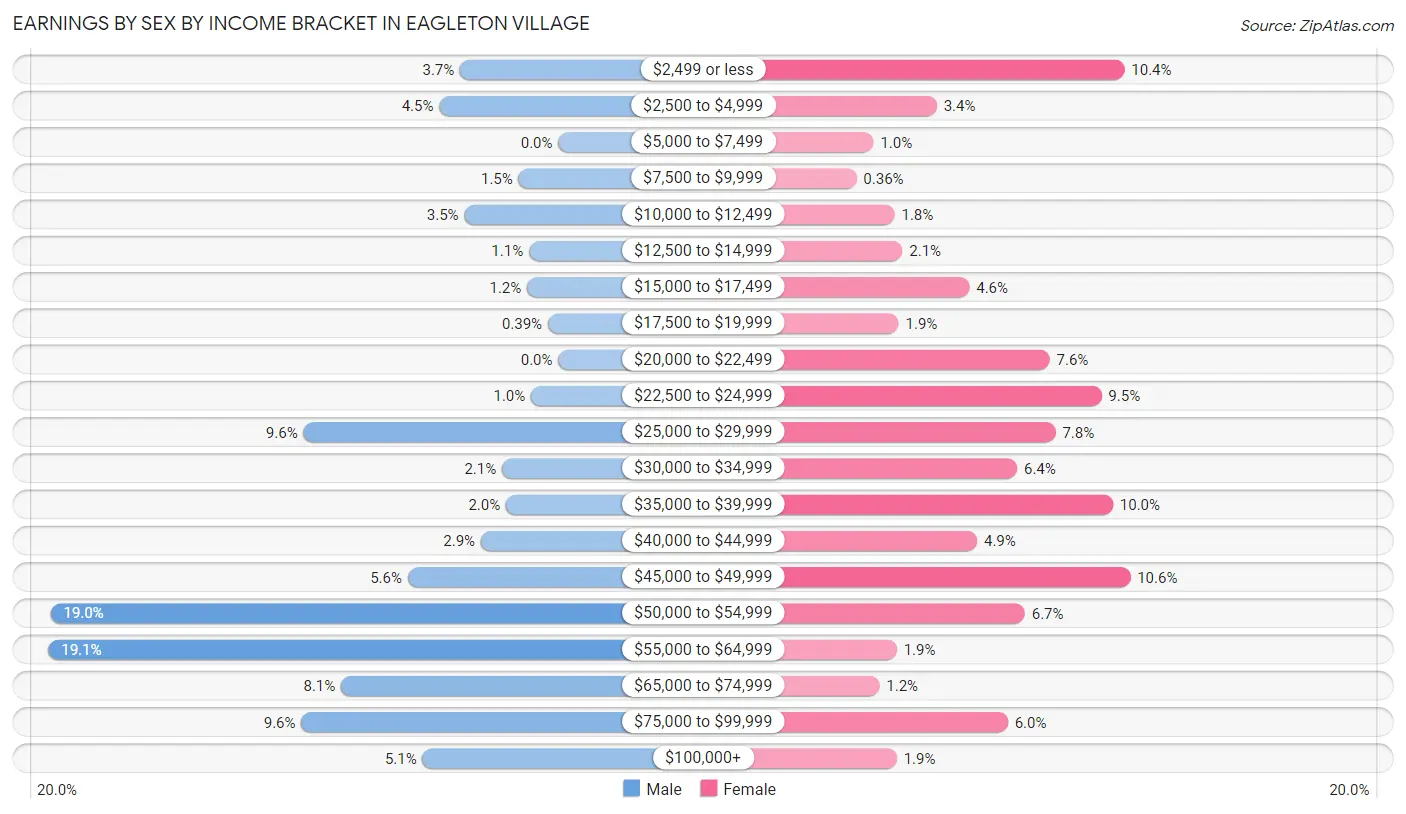
| Income | Male | Female |
| $2,499 or less | 47 (3.7%) | 145 (10.4%) |
| $2,500 to $4,999 | 57 (4.5%) | 47 (3.4%) |
| $5,000 to $7,499 | 0 (0.0%) | 14 (1.0%) |
| $7,500 to $9,999 | 19 (1.5%) | 5 (0.4%) |
| $10,000 to $12,499 | 45 (3.5%) | 25 (1.8%) |
| $12,500 to $14,999 | 14 (1.1%) | 29 (2.1%) |
| $15,000 to $17,499 | 15 (1.2%) | 64 (4.6%) |
| $17,500 to $19,999 | 5 (0.4%) | 27 (1.9%) |
| $20,000 to $22,499 | 0 (0.0%) | 106 (7.6%) |
| $22,500 to $24,999 | 13 (1.0%) | 133 (9.5%) |
| $25,000 to $29,999 | 122 (9.6%) | 109 (7.8%) |
| $30,000 to $34,999 | 27 (2.1%) | 89 (6.4%) |
| $35,000 to $39,999 | 25 (2.0%) | 139 (10.0%) |
| $40,000 to $44,999 | 37 (2.9%) | 68 (4.9%) |
| $45,000 to $49,999 | 72 (5.6%) | 148 (10.6%) |
| $50,000 to $54,999 | 243 (19.0%) | 93 (6.7%) |
| $55,000 to $64,999 | 244 (19.1%) | 26 (1.9%) |
| $65,000 to $74,999 | 104 (8.1%) | 17 (1.2%) |
| $75,000 to $99,999 | 123 (9.6%) | 84 (6.0%) |
| $100,000+ | 65 (5.1%) | 26 (1.9%) |
| Total | 1,277 (100.0%) | 1,394 (100.0%) |
Earnings by Sex by Educational Attainment in Eagleton Village
Average earnings in Eagleton Village are $55,193 for men and $35,534 for women, a difference of 35.6%. Men with an educational attainment of high school diploma enjoy the highest average annual earnings of $57,446, while those with bachelor's degree education earn the least with $53,221. Women with an educational attainment of bachelor's degree earn the most with the average annual earnings of $43,958, while those with less than high school education have the smallest earnings of $25,647.
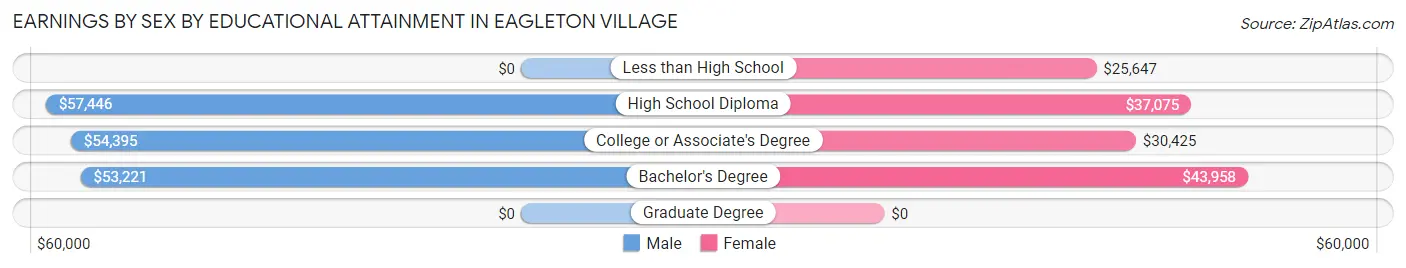
| Educational Attainment | Male Income | Female Income |
| Less than High School | - | - |
| High School Diploma | $57,446 | $37,075 |
| College or Associate's Degree | $54,395 | $30,425 |
| Bachelor's Degree | $53,221 | $43,958 |
| Graduate Degree | - | - |
| Total | $55,193 | $35,534 |
Family Income in Eagleton Village
Family Income Brackets in Eagleton Village
According to the Eagleton Village family income data, there are 451 families falling into the $75,000 to $99,999 income range, which is the most common income bracket and makes up 28.5% of all families. Conversely, the $150,000 to $199,999 income bracket is the least frequent group with only 19 families (1.2%) belonging to this category.
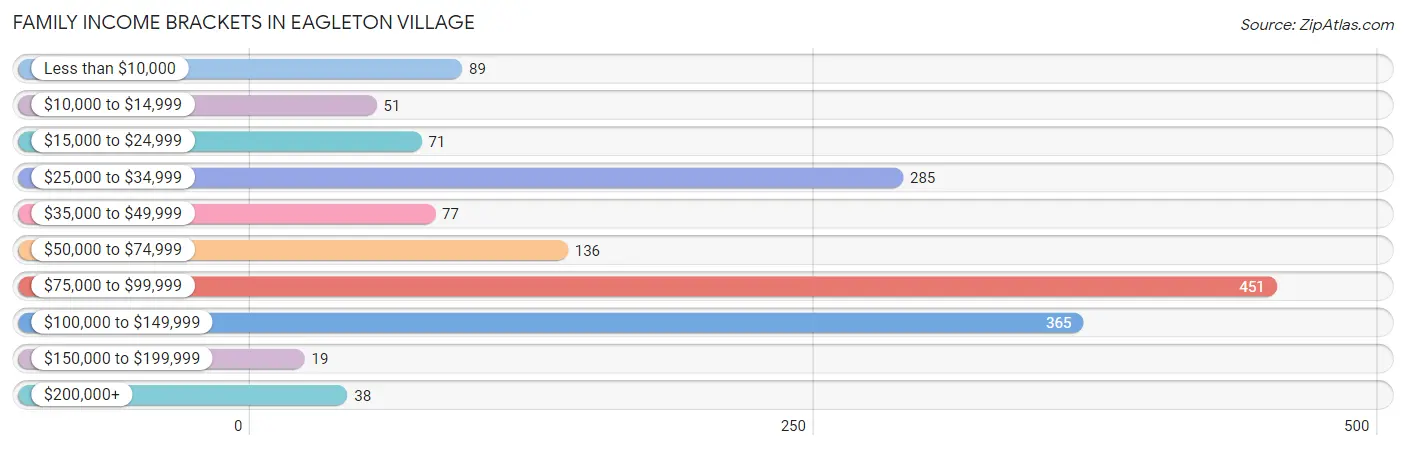
| Income Bracket | # Families | % Families |
| Less than $10,000 | 89 | 5.6% |
| $10,000 to $14,999 | 51 | 3.2% |
| $15,000 to $24,999 | 71 | 4.5% |
| $25,000 to $34,999 | 285 | 18.0% |
| $35,000 to $49,999 | 77 | 4.9% |
| $50,000 to $74,999 | 136 | 8.6% |
| $75,000 to $99,999 | 451 | 28.5% |
| $100,000 to $149,999 | 365 | 23.1% |
| $150,000 to $199,999 | 19 | 1.2% |
| $200,000+ | 38 | 2.4% |
Family Income by Famaliy Size in Eagleton Village
5-person families (89 | 5.6%) account for the highest median family income in Eagleton Village with $121,563 per family, while 2-person families (948 | 60.0%) have the highest median income of $38,154 per family member.
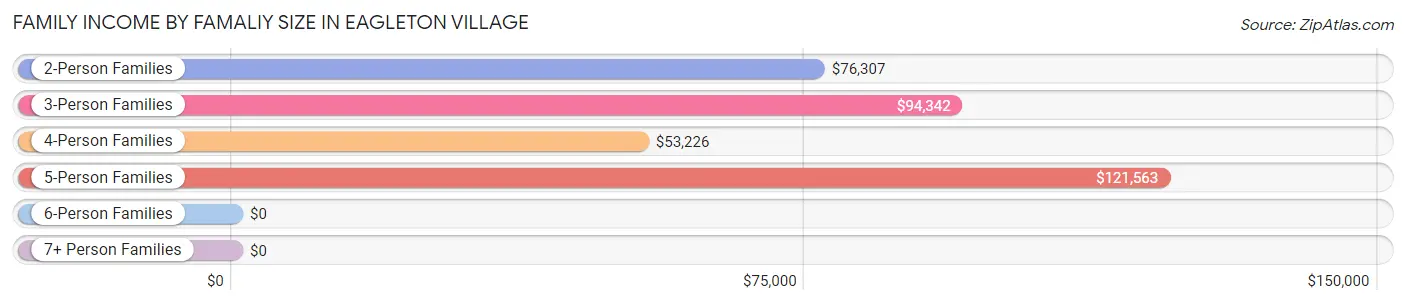
| Income Bracket | # Families | Median Income |
| 2-Person Families | 948 (60.0%) | $76,307 |
| 3-Person Families | 294 (18.6%) | $94,342 |
| 4-Person Families | 192 (12.1%) | $53,226 |
| 5-Person Families | 89 (5.6%) | $121,563 |
| 6-Person Families | 57 (3.6%) | $0 |
| 7+ Person Families | 1 (0.1%) | $0 |
| Total | 1,581 (100.0%) | $82,997 |
Family Income by Number of Earners in Eagleton Village
The median family income in Eagleton Village is $82,997, with families comprising 3+ earners (133) having the highest median family income of $122,326, while families with no earners (429) have the lowest median family income of $28,970, accounting for 8.4% and 27.1% of families, respectively.
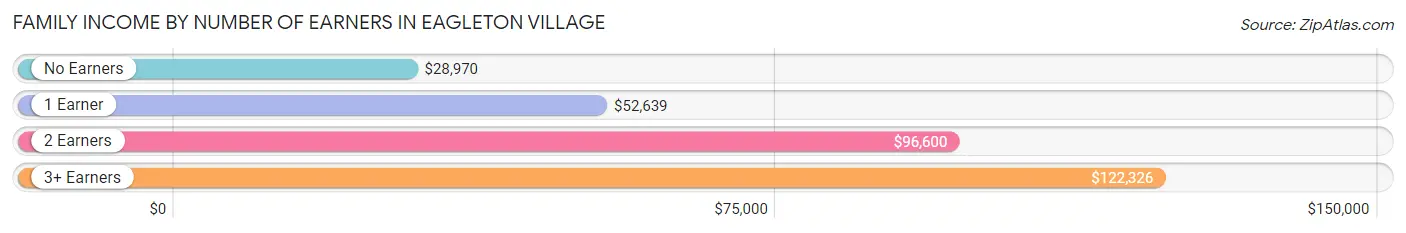
| Number of Earners | # Families | Median Income |
| No Earners | 429 (27.1%) | $28,970 |
| 1 Earner | 333 (21.1%) | $52,639 |
| 2 Earners | 686 (43.4%) | $96,600 |
| 3+ Earners | 133 (8.4%) | $122,326 |
| Total | 1,581 (100.0%) | $82,997 |
Household Income in Eagleton Village
Household Income Brackets in Eagleton Village
With 472 households falling in the category, the $75,000 to $99,999 income range is the most frequent in Eagleton Village, accounting for 20.7% of all households. In contrast, only 18 households (0.8%) fall into the $150,000 to $199,999 income bracket, making it the least populous group.
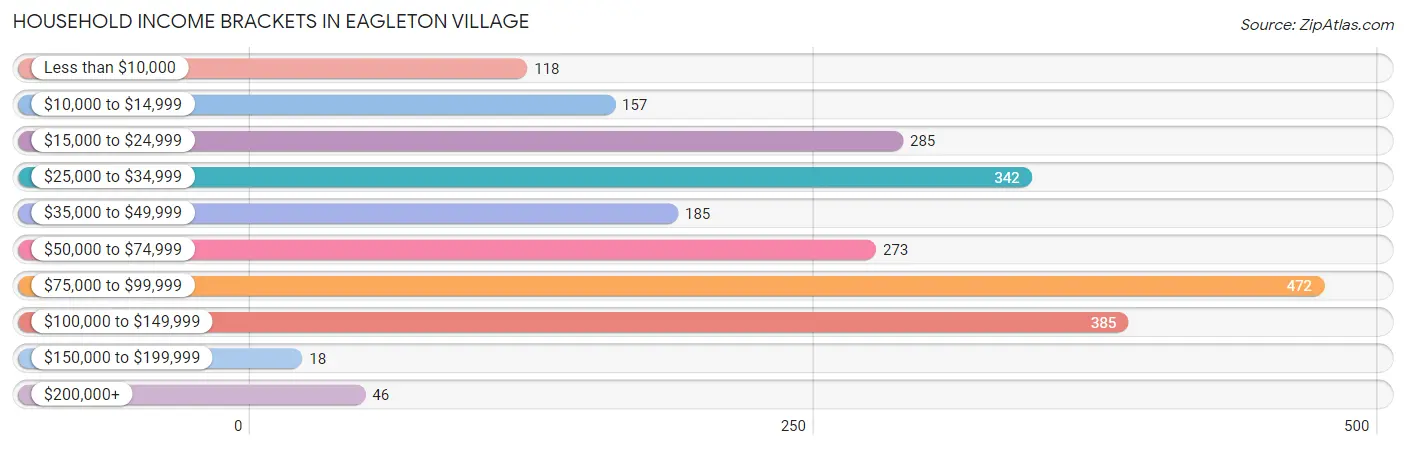
| Income Bracket | # Households | % Households |
| Less than $10,000 | 118 | 5.2% |
| $10,000 to $14,999 | 157 | 6.9% |
| $15,000 to $24,999 | 285 | 12.5% |
| $25,000 to $34,999 | 342 | 15.0% |
| $35,000 to $49,999 | 185 | 8.1% |
| $50,000 to $74,999 | 273 | 12.0% |
| $75,000 to $99,999 | 472 | 20.7% |
| $100,000 to $149,999 | 385 | 16.9% |
| $150,000 to $199,999 | 18 | 0.8% |
| $200,000+ | 46 | 2.0% |
Household Income by Householder Age in Eagleton Village
The median household income in Eagleton Village is $53,579, with the highest median household income of $88,920 found in the 45 to 64 years age bracket for the primary householder. A total of 815 households (35.8%) fall into this category. Meanwhile, the 15 to 24 years age bracket for the primary householder has the lowest median household income of $23,783, with 209 households (9.2%) in this group.
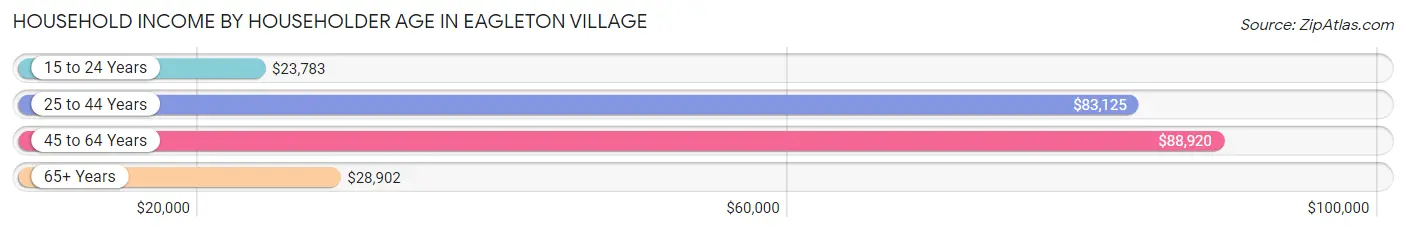
| Income Bracket | # Households | Median Income |
| 15 to 24 Years | 209 (9.2%) | $23,783 |
| 25 to 44 Years | 594 (26.1%) | $83,125 |
| 45 to 64 Years | 815 (35.8%) | $88,920 |
| 65+ Years | 660 (29.0%) | $28,902 |
| Total | 2,278 (100.0%) | $53,579 |
Poverty in Eagleton Village
Income Below Poverty by Sex and Age in Eagleton Village
With 19.3% poverty level for males and 19.2% for females among the residents of Eagleton Village, 15 year old males and 12 to 14 year old females are the most vulnerable to poverty, with 25 males (78.1%) and 64 females (78.0%) in their respective age groups living below the poverty level.
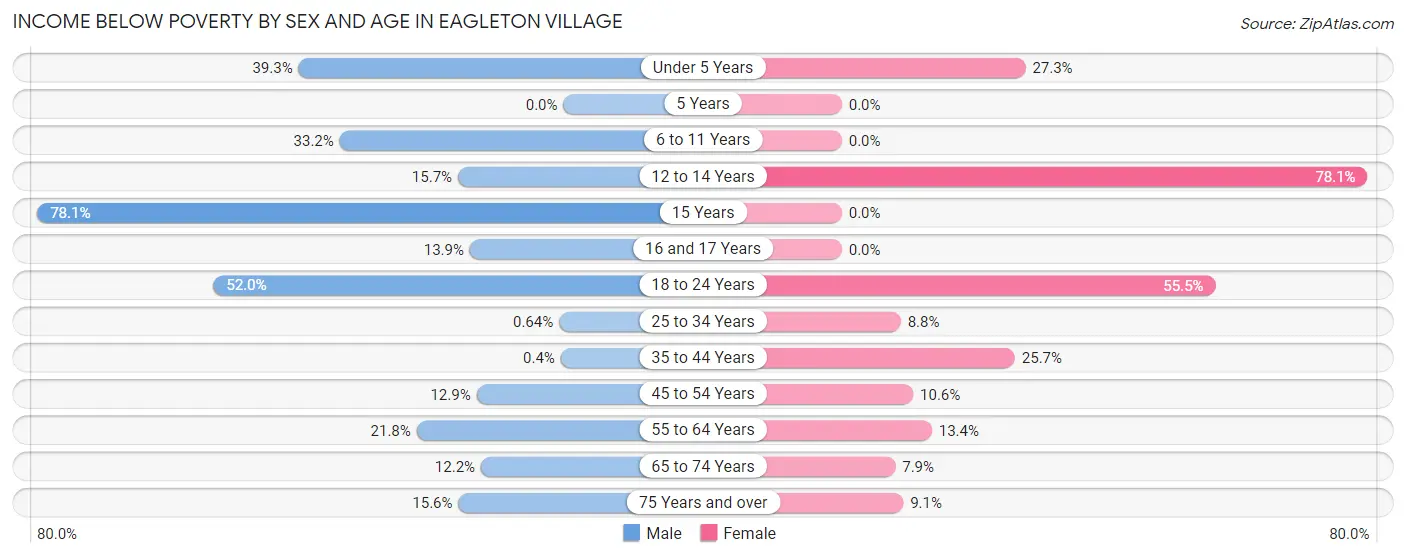
| Age Bracket | Male | Female |
| Under 5 Years | 105 (39.3%) | 54 (27.3%) |
| 5 Years | 0 (0.0%) | 0 (0.0%) |
| 6 to 11 Years | 96 (33.2%) | 0 (0.0%) |
| 12 to 14 Years | 13 (15.7%) | 64 (78.0%) |
| 15 Years | 25 (78.1%) | 0 (0.0%) |
| 16 and 17 Years | 15 (13.9%) | 0 (0.0%) |
| 18 to 24 Years | 66 (52.0%) | 137 (55.5%) |
| 25 to 34 Years | 2 (0.6%) | 23 (8.7%) |
| 35 to 44 Years | 1 (0.4%) | 83 (25.7%) |
| 45 to 54 Years | 36 (12.9%) | 41 (10.6%) |
| 55 to 64 Years | 85 (21.8%) | 48 (13.4%) |
| 65 to 74 Years | 24 (12.2%) | 15 (7.9%) |
| 75 Years and over | 58 (15.6%) | 30 (9.1%) |
| Total | 526 (19.3%) | 495 (19.2%) |
Income Above Poverty by Sex and Age in Eagleton Village
According to the poverty statistics in Eagleton Village, males aged 5 years and females aged 5 years are the age groups that are most secure financially, with 100.0% of males and 100.0% of females in these age groups living above the poverty line.
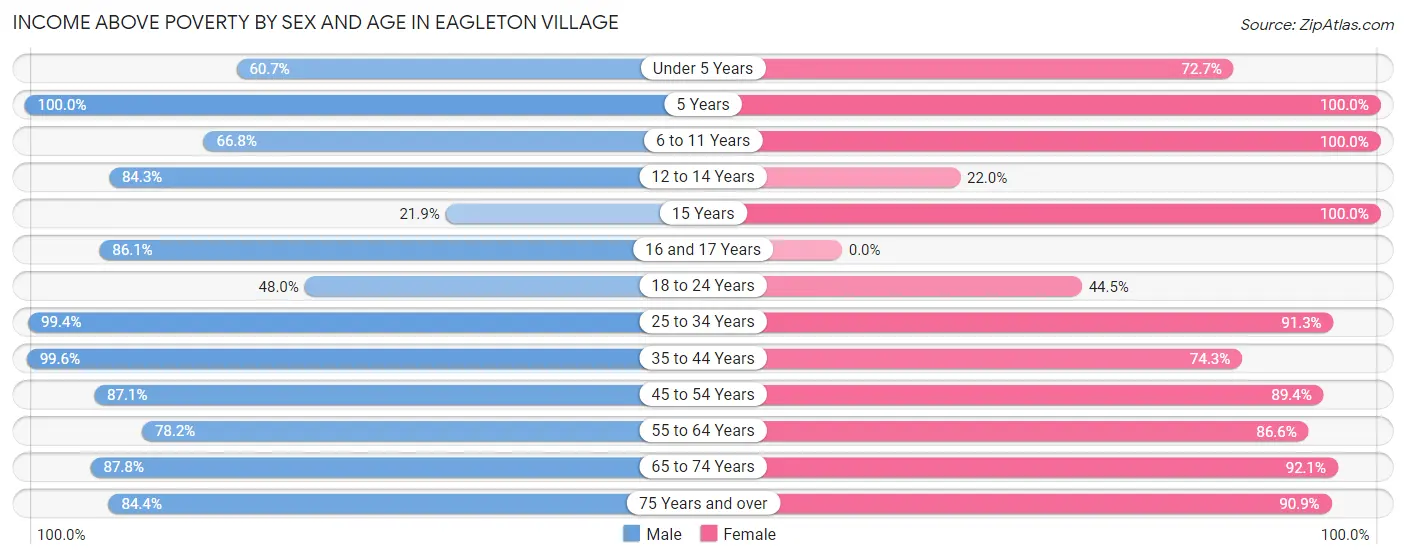
| Age Bracket | Male | Female |
| Under 5 Years | 162 (60.7%) | 144 (72.7%) |
| 5 Years | 18 (100.0%) | 17 (100.0%) |
| 6 to 11 Years | 193 (66.8%) | 179 (100.0%) |
| 12 to 14 Years | 70 (84.3%) | 18 (22.0%) |
| 15 Years | 7 (21.9%) | 7 (100.0%) |
| 16 and 17 Years | 93 (86.1%) | 0 (0.0%) |
| 18 to 24 Years | 61 (48.0%) | 110 (44.5%) |
| 25 to 34 Years | 312 (99.4%) | 240 (91.2%) |
| 35 to 44 Years | 250 (99.6%) | 240 (74.3%) |
| 45 to 54 Years | 243 (87.1%) | 346 (89.4%) |
| 55 to 64 Years | 305 (78.2%) | 311 (86.6%) |
| 65 to 74 Years | 172 (87.8%) | 174 (92.1%) |
| 75 Years and over | 314 (84.4%) | 299 (90.9%) |
| Total | 2,200 (80.7%) | 2,085 (80.8%) |
Income Below Poverty Among Married-Couple Families in Eagleton Village
The poverty statistics for married-couple families in Eagleton Village show that 11.5% or 155 of the total 1,348 families live below the poverty line. Families with 1 or 2 children have the highest poverty rate of 23.0%, comprising of 73 families. On the other hand, families with no children have the lowest poverty rate of 7.6%, which includes 68 families.
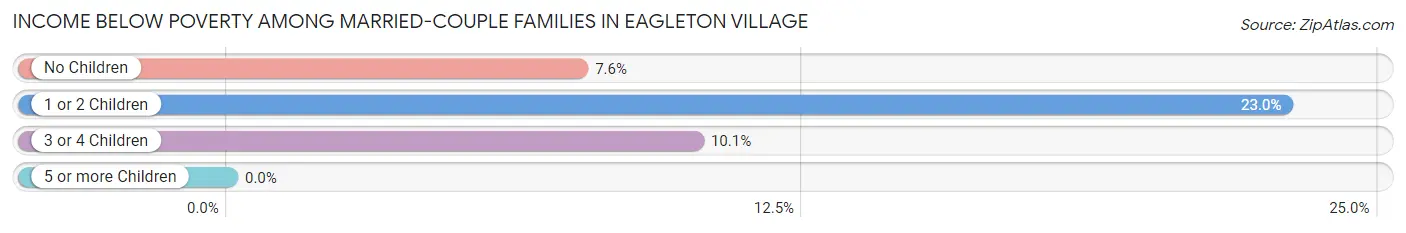
| Children | Above Poverty | Below Poverty |
| No Children | 824 (92.4%) | 68 (7.6%) |
| 1 or 2 Children | 245 (77.0%) | 73 (23.0%) |
| 3 or 4 Children | 124 (89.9%) | 14 (10.1%) |
| 5 or more Children | 0 (0.0%) | 0 (0.0%) |
| Total | 1,193 (88.5%) | 155 (11.5%) |
Income Below Poverty Among Single-Parent Households in Eagleton Village
According to the poverty data in Eagleton Village, 26.9% or 18 single-father households and 57.2% or 95 single-mother households are living below the poverty line. Among single-father households, those with no children have the highest poverty rate, with 18 households (72.0%) experiencing poverty. Likewise, among single-mother households, those with 1 or 2 children have the highest poverty rate, with 95 households (73.1%) falling below the poverty line.
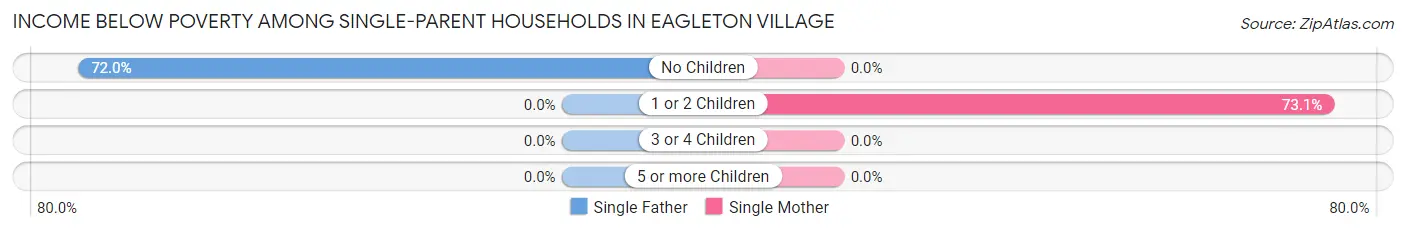
| Children | Single Father | Single Mother |
| No Children | 18 (72.0%) | 0 (0.0%) |
| 1 or 2 Children | 0 (0.0%) | 95 (73.1%) |
| 3 or 4 Children | 0 (0.0%) | 0 (0.0%) |
| 5 or more Children | 0 (0.0%) | 0 (0.0%) |
| Total | 18 (26.9%) | 95 (57.2%) |
Income Below Poverty Among Married-Couple vs Single-Parent Households in Eagleton Village
The poverty data for Eagleton Village shows that 155 of the married-couple family households (11.5%) and 113 of the single-parent households (48.5%) are living below the poverty level. Within the married-couple family households, those with 1 or 2 children have the highest poverty rate, with 73 households (23.0%) falling below the poverty line. Among the single-parent households, those with 1 or 2 children have the highest poverty rate, with 95 household (57.9%) living below poverty.
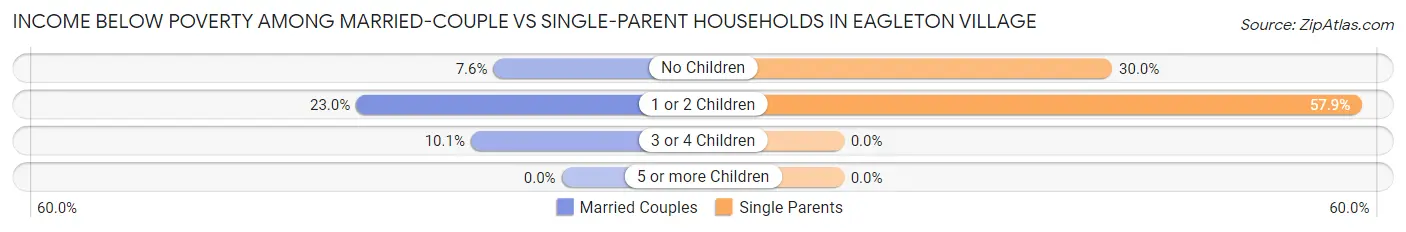
| Children | Married-Couple Families | Single-Parent Households |
| No Children | 68 (7.6%) | 18 (30.0%) |
| 1 or 2 Children | 73 (23.0%) | 95 (57.9%) |
| 3 or 4 Children | 14 (10.1%) | 0 (0.0%) |
| 5 or more Children | 0 (0.0%) | 0 (0.0%) |
| Total | 155 (11.5%) | 113 (48.5%) |
Race in Eagleton Village
The most populous races in Eagleton Village are White / Caucasian (4,750 | 89.1%), Hispanic or Latino (378 | 7.1%), and Two or more Races (268 | 5.0%).
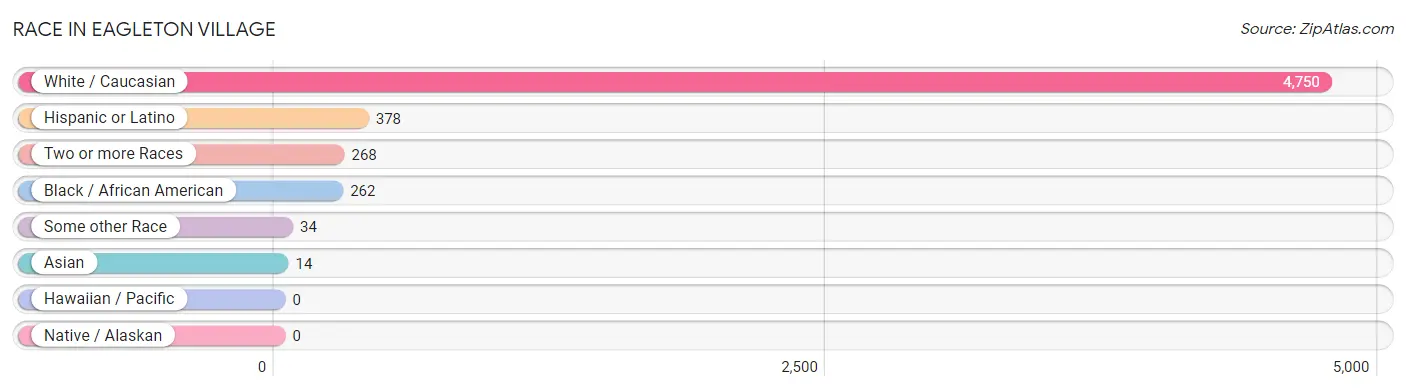
| Race | # Population | % Population |
| Asian | 14 | 0.3% |
| Black / African American | 262 | 4.9% |
| Hawaiian / Pacific | 0 | 0.0% |
| Hispanic or Latino | 378 | 7.1% |
| Native / Alaskan | 0 | 0.0% |
| White / Caucasian | 4,750 | 89.1% |
| Two or more Races | 268 | 5.0% |
| Some other Race | 34 | 0.6% |
| Total | 5,328 | 100.0% |
Ancestry in Eagleton Village
The most populous ancestries reported in Eagleton Village are German (647 | 12.1%), English (584 | 11.0%), Irish (550 | 10.3%), American (355 | 6.7%), and Mexican (241 | 4.5%), together accounting for 44.6% of all Eagleton Village residents.
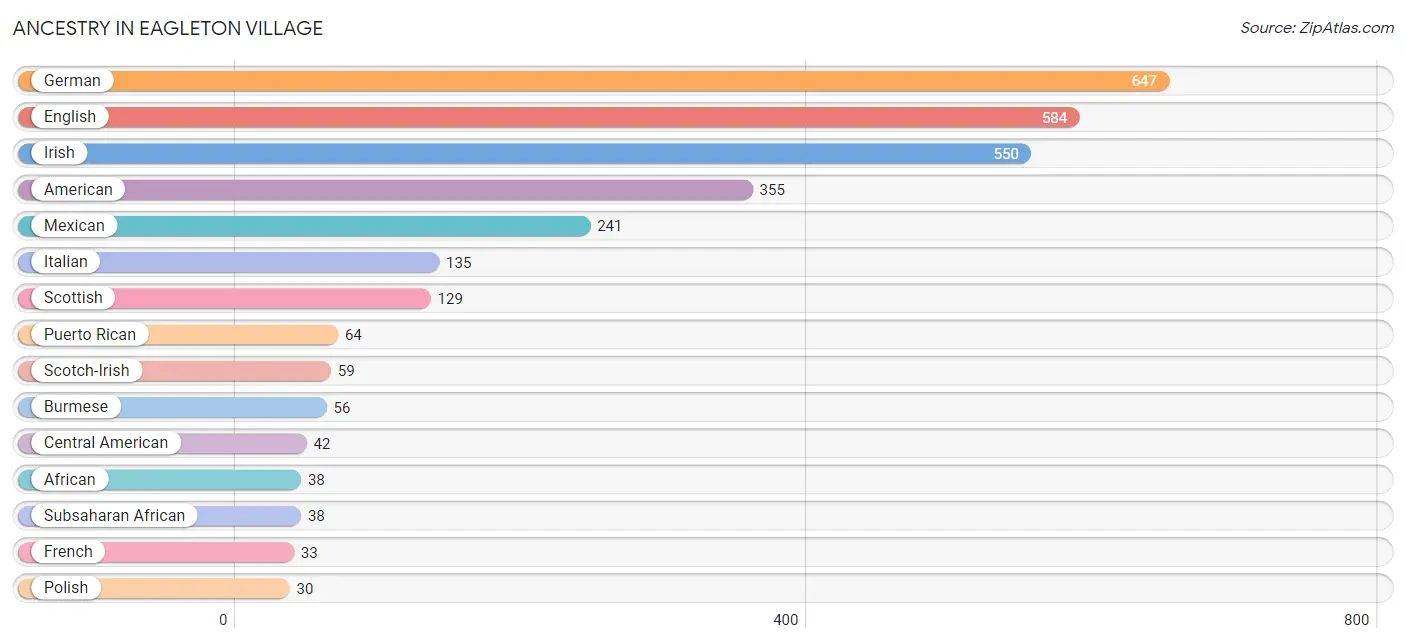
| Ancestry | # Population | % Population |
| African | 38 | 0.7% |
| American | 355 | 6.7% |
| British | 13 | 0.2% |
| Burmese | 56 | 1.1% |
| Central American | 42 | 0.8% |
| Cherokee | 10 | 0.2% |
| Cuban | 21 | 0.4% |
| Dutch | 10 | 0.2% |
| Dutch West Indian | 8 | 0.2% |
| Eastern European | 19 | 0.4% |
| English | 584 | 11.0% |
| European | 26 | 0.5% |
| Finnish | 11 | 0.2% |
| French | 33 | 0.6% |
| French Canadian | 15 | 0.3% |
| German | 647 | 12.1% |
| Honduran | 23 | 0.4% |
| Irish | 550 | 10.3% |
| Italian | 135 | 2.5% |
| Mexican | 241 | 4.5% |
| Nicaraguan | 19 | 0.4% |
| Northern European | 14 | 0.3% |
| Norwegian | 16 | 0.3% |
| Polish | 30 | 0.6% |
| Puerto Rican | 64 | 1.2% |
| Russian | 14 | 0.3% |
| Scotch-Irish | 59 | 1.1% |
| Scottish | 129 | 2.4% |
| Sioux | 17 | 0.3% |
| Spanish | 10 | 0.2% |
| Subsaharan African | 38 | 0.7% |
| Swedish | 5 | 0.1% | View All 32 Rows |
Immigrants in Eagleton Village
The most numerous immigrant groups reported in Eagleton Village came from Central America (132 | 2.5%), Latin America (132 | 2.5%), Mexico (90 | 1.7%), Africa (38 | 0.7%), and Eastern Africa (38 | 0.7%), together accounting for 8.1% of all Eagleton Village residents.
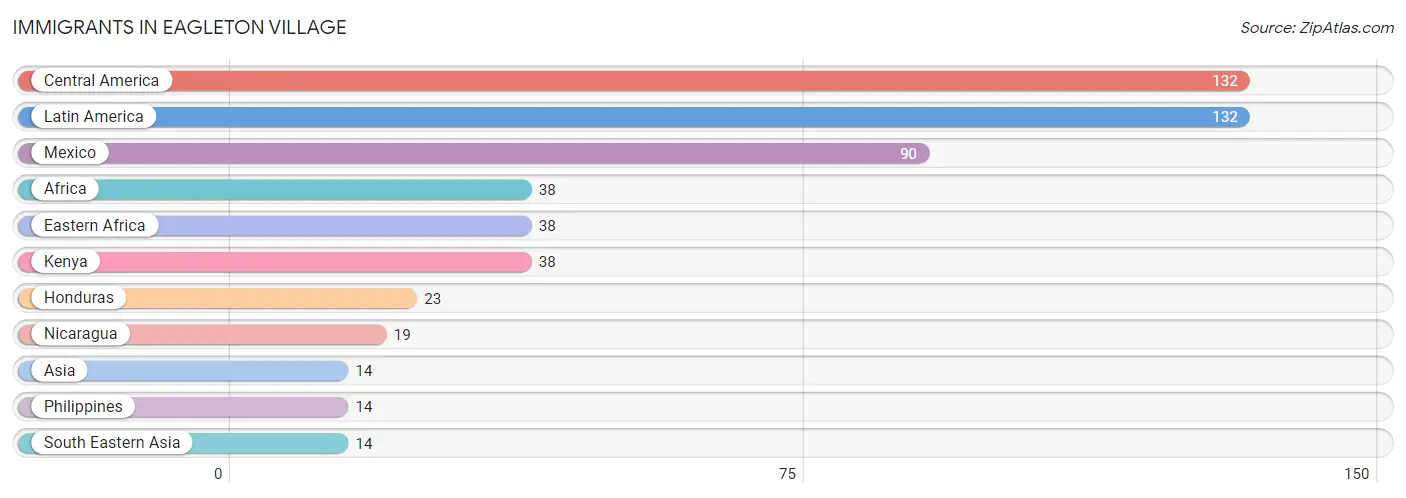
| Immigration Origin | # Population | % Population |
| Africa | 38 | 0.7% |
| Asia | 14 | 0.3% |
| Central America | 132 | 2.5% |
| Eastern Africa | 38 | 0.7% |
| Honduras | 23 | 0.4% |
| Kenya | 38 | 0.7% |
| Latin America | 132 | 2.5% |
| Mexico | 90 | 1.7% |
| Nicaragua | 19 | 0.4% |
| Philippines | 14 | 0.3% |
| South Eastern Asia | 14 | 0.3% | View All 11 Rows |
Sex and Age in Eagleton Village
Sex and Age in Eagleton Village
The most populous age groups in Eagleton Village are 75 to 79 Years (275 | 10.0%) for men and 50 to 54 Years (273 | 10.6%) for women.
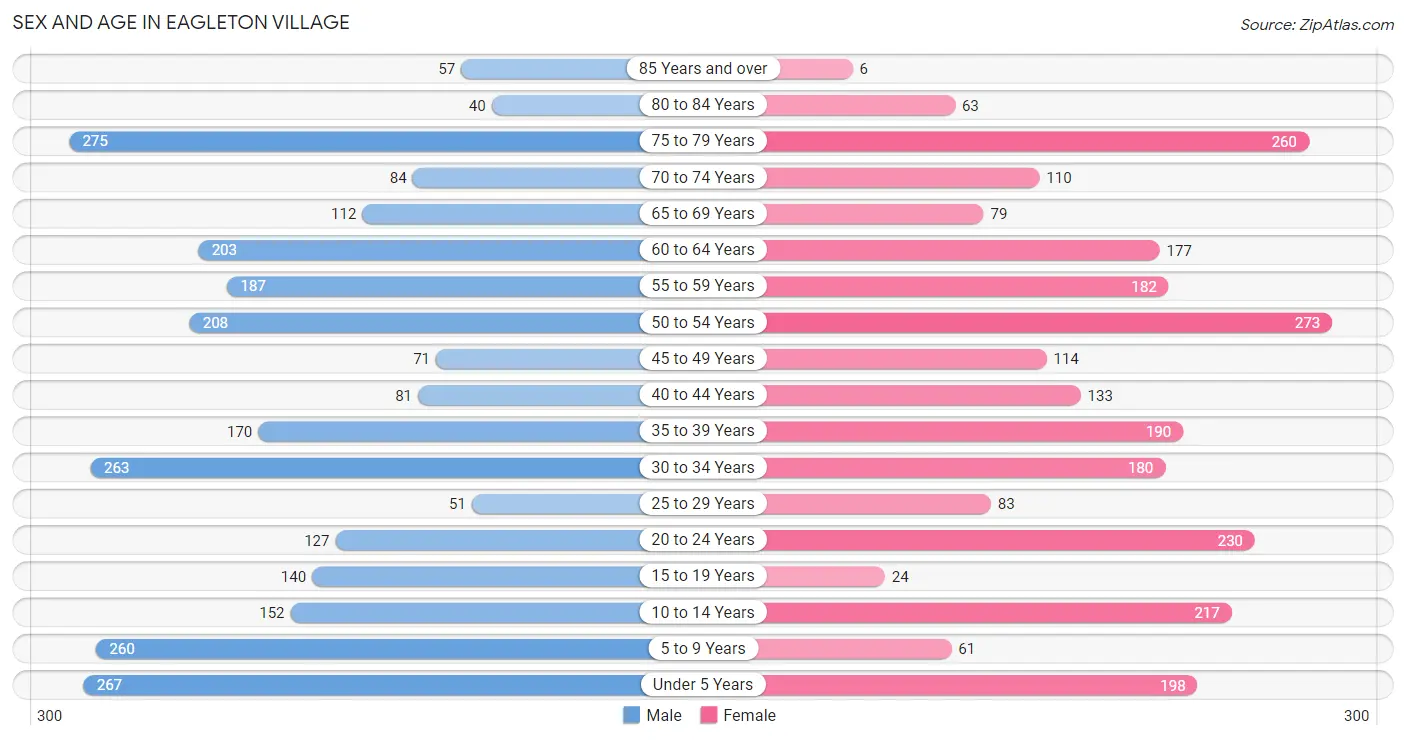
| Age Bracket | Male | Female |
| Under 5 Years | 267 (9.7%) | 198 (7.7%) |
| 5 to 9 Years | 260 (9.5%) | 61 (2.4%) |
| 10 to 14 Years | 152 (5.5%) | 217 (8.4%) |
| 15 to 19 Years | 140 (5.1%) | 24 (0.9%) |
| 20 to 24 Years | 127 (4.6%) | 230 (8.9%) |
| 25 to 29 Years | 51 (1.9%) | 83 (3.2%) |
| 30 to 34 Years | 263 (9.6%) | 180 (7.0%) |
| 35 to 39 Years | 170 (6.2%) | 190 (7.4%) |
| 40 to 44 Years | 81 (2.9%) | 133 (5.2%) |
| 45 to 49 Years | 71 (2.6%) | 114 (4.4%) |
| 50 to 54 Years | 208 (7.6%) | 273 (10.6%) |
| 55 to 59 Years | 187 (6.8%) | 182 (7.0%) |
| 60 to 64 Years | 203 (7.4%) | 177 (6.9%) |
| 65 to 69 Years | 112 (4.1%) | 79 (3.1%) |
| 70 to 74 Years | 84 (3.1%) | 110 (4.3%) |
| 75 to 79 Years | 275 (10.0%) | 260 (10.1%) |
| 80 to 84 Years | 40 (1.5%) | 63 (2.4%) |
| 85 Years and over | 57 (2.1%) | 6 (0.2%) |
| Total | 2,748 (100.0%) | 2,580 (100.0%) |
Families and Households in Eagleton Village
Median Family Size in Eagleton Village
The median family size in Eagleton Village is 2.82 persons per family, with single female/mother families (166 | 10.5%) accounting for the largest median family size of 2.93 persons per family. On the other hand, married-couple families (1,348 | 85.3%) represent the smallest median family size with 2.81 persons per family.
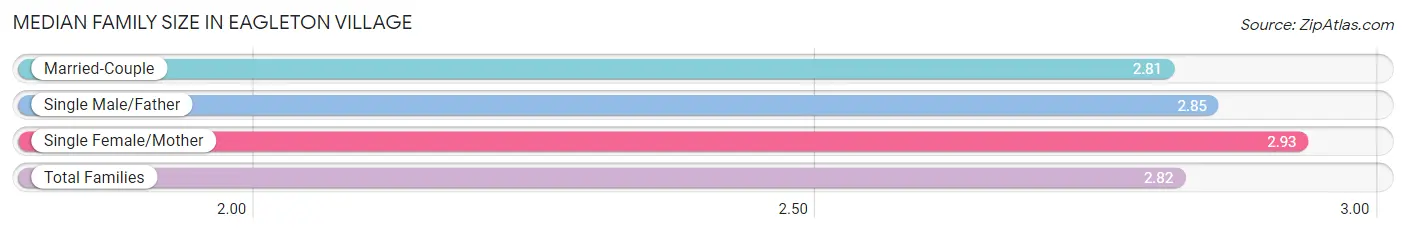
| Family Type | # Families | Family Size |
| Married-Couple | 1,348 (85.3%) | 2.81 |
| Single Male/Father | 67 (4.2%) | 2.85 |
| Single Female/Mother | 166 (10.5%) | 2.93 |
| Total Families | 1,581 (100.0%) | 2.82 |
Median Household Size in Eagleton Village
The median household size in Eagleton Village is 2.33 persons per household, with single male/father households (67 | 2.9%) accounting for the largest median household size of 3.06 persons per household. non-family households (697 | 30.6%) represent the smallest median household size with 1.18 persons per household.
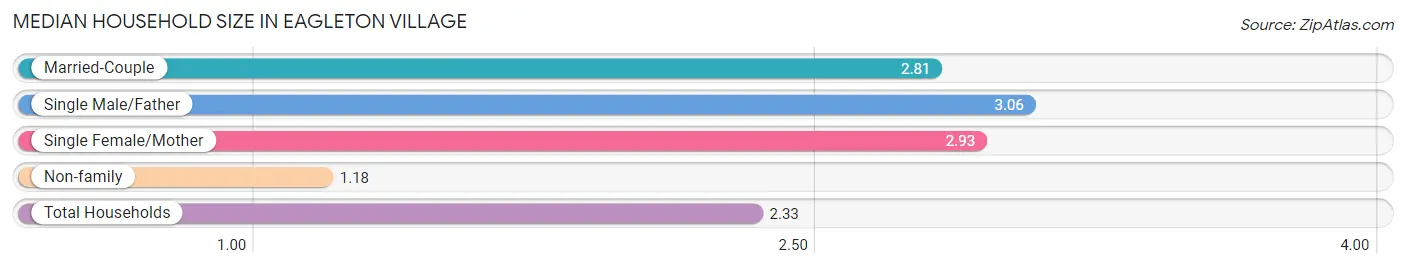
| Household Type | # Households | Household Size |
| Married-Couple | 1,348 (59.2%) | 2.81 |
| Single Male/Father | 67 (2.9%) | 3.06 |
| Single Female/Mother | 166 (7.3%) | 2.93 |
| Non-family | 697 (30.6%) | 1.18 |
| Total Households | 2,278 (100.0%) | 2.33 |
Household Size by Marriage Status in Eagleton Village
Out of a total of 2,278 households in Eagleton Village, 1,581 (69.4%) are family households, while 697 (30.6%) are nonfamily households. The most numerous type of family households are 2-person households, comprising 948, and the most common type of nonfamily households are 1-person households, comprising 622.
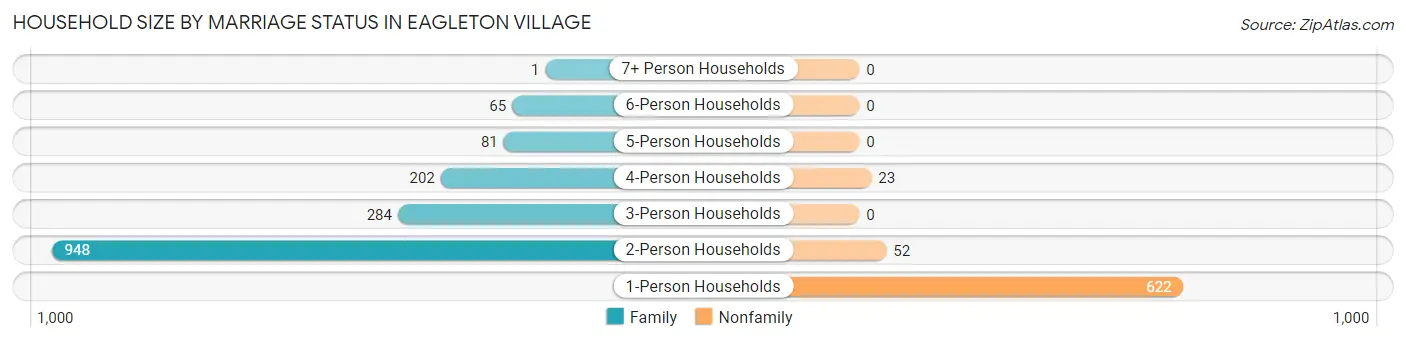
| Household Size | Family Households | Nonfamily Households |
| 1-Person Households | - | 622 (27.3%) |
| 2-Person Households | 948 (41.6%) | 52 (2.3%) |
| 3-Person Households | 284 (12.5%) | 0 (0.0%) |
| 4-Person Households | 202 (8.9%) | 23 (1.0%) |
| 5-Person Households | 81 (3.6%) | 0 (0.0%) |
| 6-Person Households | 65 (2.9%) | 0 (0.0%) |
| 7+ Person Households | 1 (0.0%) | 0 (0.0%) |
| Total | 1,581 (69.4%) | 697 (30.6%) |
Female Fertility in Eagleton Village
Fertility by Age in Eagleton Village
Average fertility rate in Eagleton Village is 95.0 births per 1,000 women. Women in the age bracket of 20 to 34 years have the highest fertility rate with 185.0 births per 1,000 women. Women in the age bracket of 20 to 34 years acount for 100.0% of all women with births.
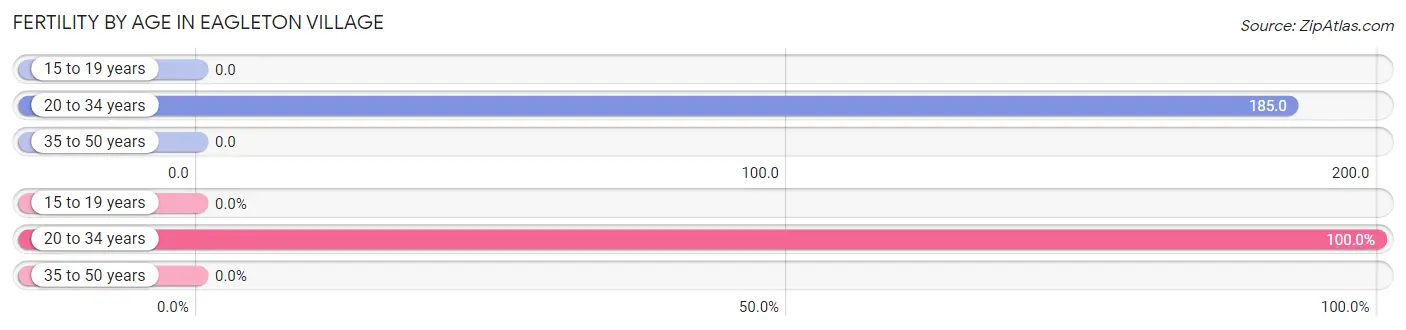
| Age Bracket | Women with Births | Births / 1,000 Women |
| 15 to 19 years | 0 (0.0%) | 0.0 |
| 20 to 34 years | 91 (100.0%) | 185.0 |
| 35 to 50 years | 0 (0.0%) | 0.0 |
| Total | 91 (100.0%) | 95.0 |
Fertility by Age by Marriage Status in Eagleton Village
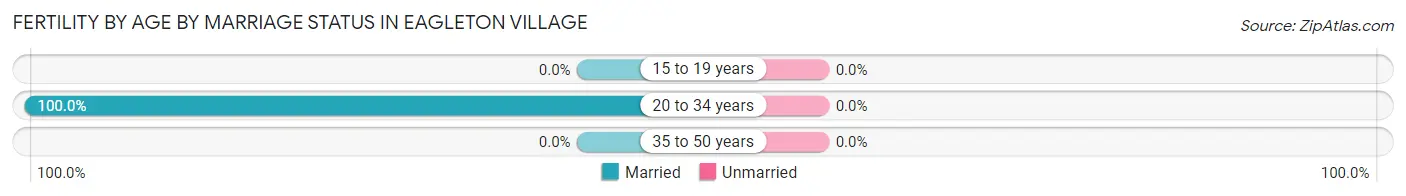
| Age Bracket | Married | Unmarried |
| 15 to 19 years | 0 (0.0%) | 0 (0.0%) |
| 20 to 34 years | 91 (100.0%) | 0 (0.0%) |
| 35 to 50 years | 0 (0.0%) | 0 (0.0%) |
| Total | 91 (100.0%) | 0 (0.0%) |
Fertility by Education in Eagleton Village
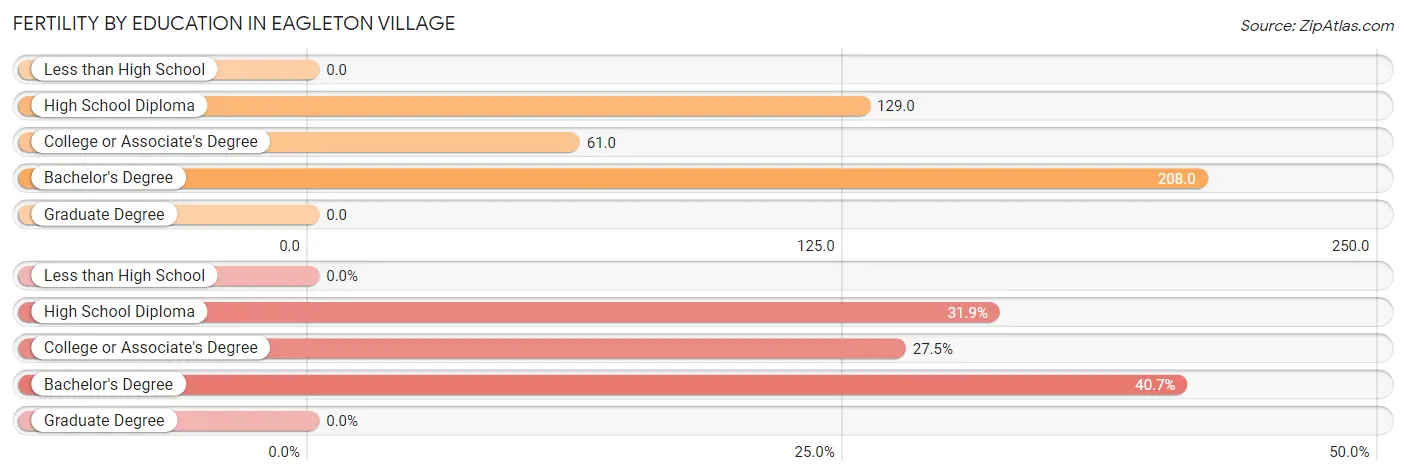
| Educational Attainment | Women with Births | Births / 1,000 Women |
| Less than High School | 0 (0.0%) | 0.0 |
| High School Diploma | 29 (31.9%) | 129.0 |
| College or Associate's Degree | 25 (27.5%) | 61.0 |
| Bachelor's Degree | 37 (40.7%) | 208.0 |
| Graduate Degree | 0 (0.0%) | 0.0 |
| Total | 91 (100.0%) | 95.0 |
Fertility by Education by Marriage Status in Eagleton Village
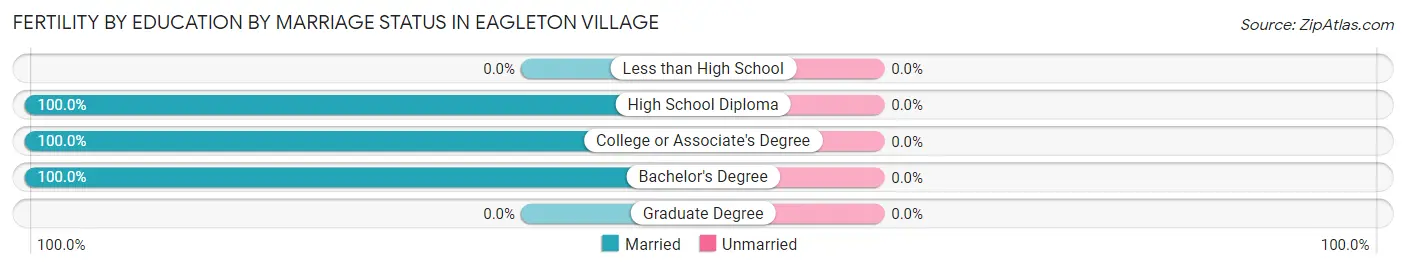
| Educational Attainment | Married | Unmarried |
| Less than High School | 0 (0.0%) | 0 (0.0%) |
| High School Diploma | 29 (100.0%) | 0 (0.0%) |
| College or Associate's Degree | 25 (100.0%) | 0 (0.0%) |
| Bachelor's Degree | 37 (100.0%) | 0 (0.0%) |
| Graduate Degree | 0 (0.0%) | 0 (0.0%) |
| Total | 91 (100.0%) | 0 (0.0%) |
Employment Characteristics in Eagleton Village
Employment by Class of Employer in Eagleton Village
Among the 2,394 employed individuals in Eagleton Village, private company employees (1,887 | 78.8%), not-for-profit organizations (139 | 5.8%), and self-employed (not incorporated) (112 | 4.7%) make up the most common classes of employment.
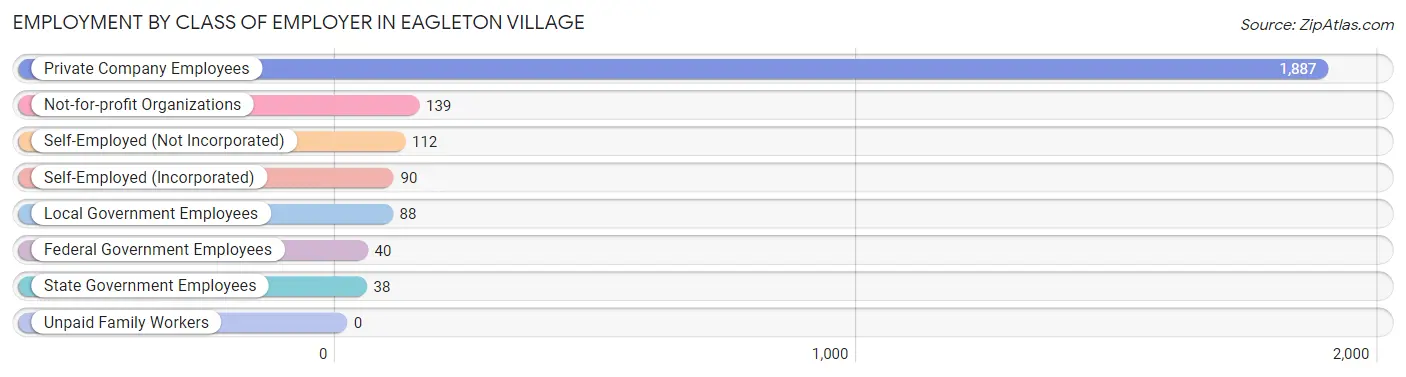
| Employer Class | # Employees | % Employees |
| Private Company Employees | 1,887 | 78.8% |
| Self-Employed (Incorporated) | 90 | 3.8% |
| Self-Employed (Not Incorporated) | 112 | 4.7% |
| Not-for-profit Organizations | 139 | 5.8% |
| Local Government Employees | 88 | 3.7% |
| State Government Employees | 38 | 1.6% |
| Federal Government Employees | 40 | 1.7% |
| Unpaid Family Workers | 0 | 0.0% |
| Total | 2,394 | 100.0% |
Employment Status by Age in Eagleton Village
According to the labor force statistics for Eagleton Village, out of the total population over 16 years of age (4,134), 61.9% or 2,559 individuals are in the labor force, with 4.9% or 125 of them unemployed. The age group with the highest labor force participation rate is 45 to 54 years, with 93.2% or 621 individuals in the labor force. Within the labor force, the 35 to 44 years age range has the highest percentage of unemployed individuals, with 10.8% or 54 of them being unemployed.
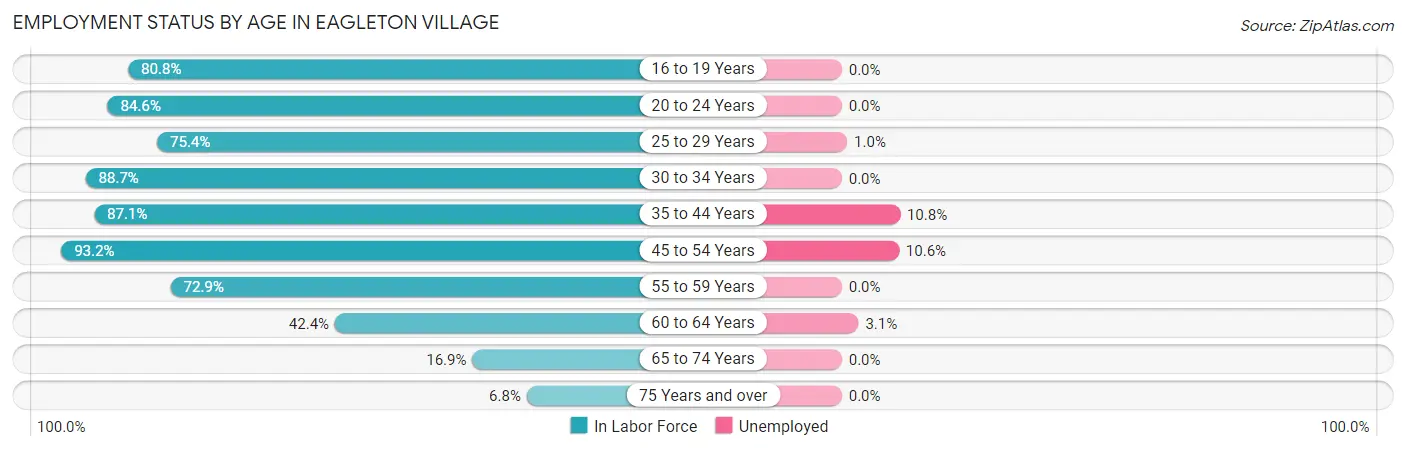
| Age Bracket | In Labor Force | Unemployed |
| 16 to 19 Years | 101 (80.8%) | 0 (0.0%) |
| 20 to 24 Years | 302 (84.6%) | 0 (0.0%) |
| 25 to 29 Years | 101 (75.4%) | 1 (1.0%) |
| 30 to 34 Years | 393 (88.7%) | 0 (0.0%) |
| 35 to 44 Years | 500 (87.1%) | 54 (10.8%) |
| 45 to 54 Years | 621 (93.2%) | 66 (10.6%) |
| 55 to 59 Years | 269 (72.9%) | 0 (0.0%) |
| 60 to 64 Years | 161 (42.4%) | 5 (3.1%) |
| 65 to 74 Years | 65 (16.9%) | 0 (0.0%) |
| 75 Years and over | 48 (6.8%) | 0 (0.0%) |
| Total | 2,559 (61.9%) | 125 (4.9%) |
Employment Status by Educational Attainment in Eagleton Village
According to labor force statistics for Eagleton Village, 79.7% of individuals (2,045) out of the total population between 25 and 64 years of age (2,566) are in the labor force, with 6.2% or 127 of them being unemployed. The group with the highest labor force participation rate are those with the educational attainment of bachelor's degree or higher, with 91.4% or 414 individuals in the labor force. Within the labor force, individuals with college / associate degree education have the highest percentage of unemployment, with 15.4% or 113 of them being unemployed.
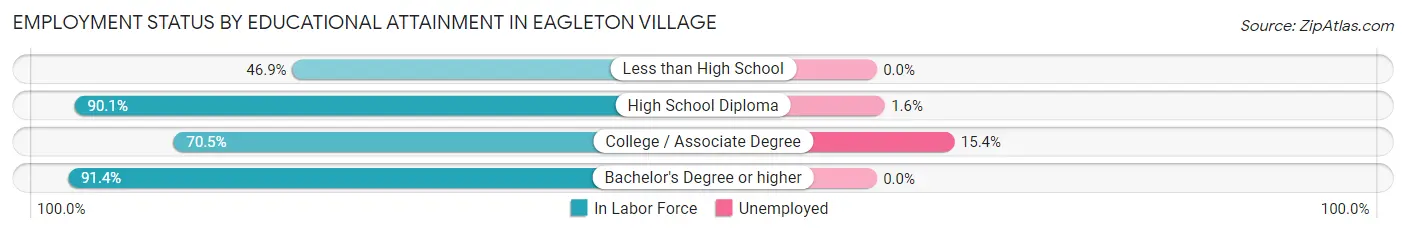
| Educational Attainment | In Labor Force | Unemployed |
| Less than High School | 76 (46.9%) | 0 (0.0%) |
| High School Diploma | 823 (90.1%) | 15 (1.6%) |
| College / Associate Degree | 732 (70.5%) | 160 (15.4%) |
| Bachelor's Degree or higher | 414 (91.4%) | 0 (0.0%) |
| Total | 2,045 (79.7%) | 159 (6.2%) |
Employment Occupations by Sex in Eagleton Village
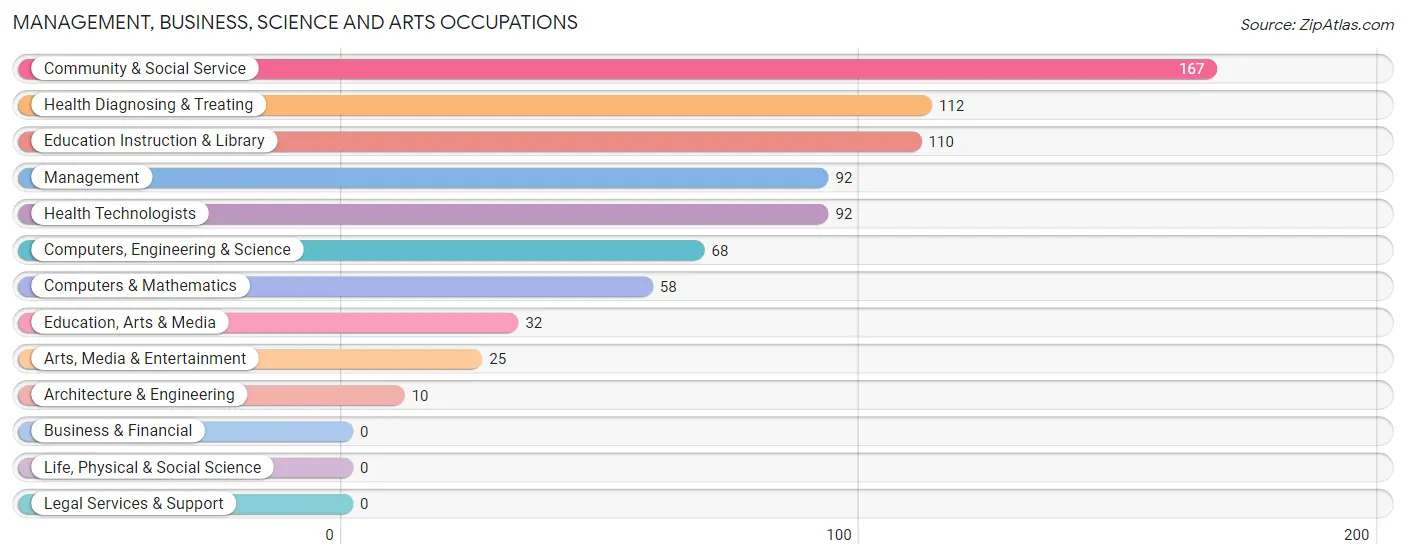
Management, Business, Science and Arts Occupations
The most common Management, Business, Science and Arts occupations in Eagleton Village are Community & Social Service (167 | 6.9%), Health Diagnosing & Treating (112 | 4.6%), Education Instruction & Library (110 | 4.5%), Management (92 | 3.8%), and Health Technologists (92 | 3.8%).
Management, Business, Science and Arts Occupations by Sex
Within the Management, Business, Science and Arts occupations in Eagleton Village, the most male-oriented occupations are Architecture & Engineering (100.0%), Computers, Engineering & Science (73.5%), and Computers & Mathematics (69.0%), while the most female-oriented occupations are Health Diagnosing & Treating (100.0%), Health Technologists (100.0%), and Education Instruction & Library (70.0%).
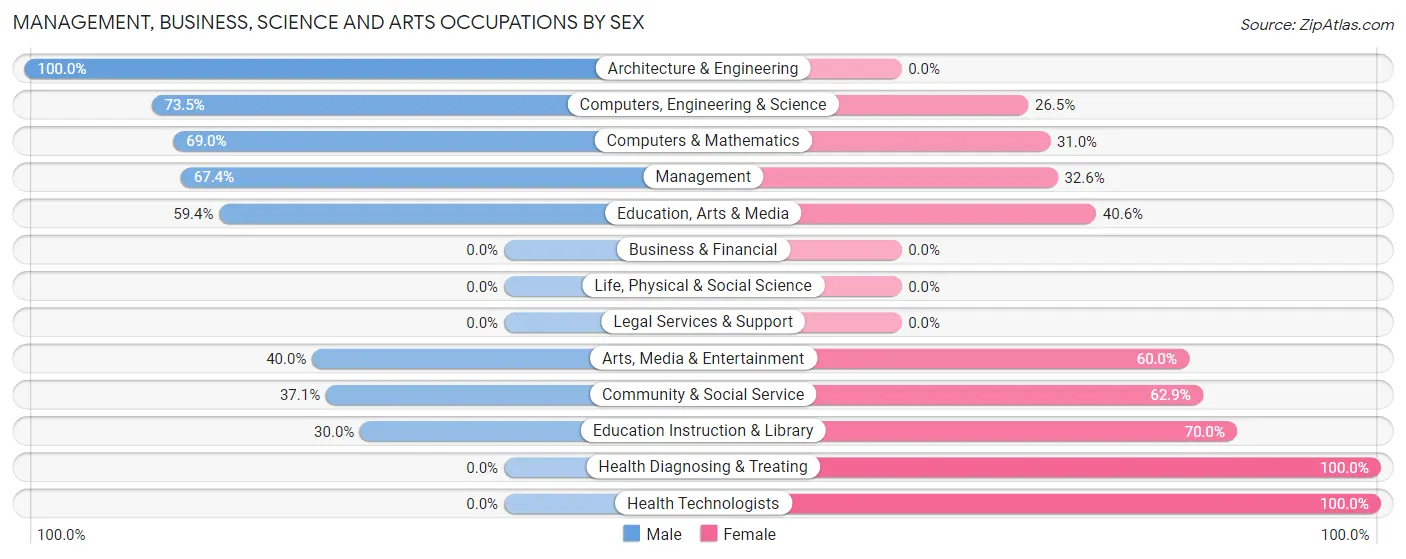
| Occupation | Male | Female |
| Management | 62 (67.4%) | 30 (32.6%) |
| Business & Financial | 0 (0.0%) | 0 (0.0%) |
| Computers, Engineering & Science | 50 (73.5%) | 18 (26.5%) |
| Computers & Mathematics | 40 (69.0%) | 18 (31.0%) |
| Architecture & Engineering | 10 (100.0%) | 0 (0.0%) |
| Life, Physical & Social Science | 0 (0.0%) | 0 (0.0%) |
| Community & Social Service | 62 (37.1%) | 105 (62.9%) |
| Education, Arts & Media | 19 (59.4%) | 13 (40.6%) |
| Legal Services & Support | 0 (0.0%) | 0 (0.0%) |
| Education Instruction & Library | 33 (30.0%) | 77 (70.0%) |
| Arts, Media & Entertainment | 10 (40.0%) | 15 (60.0%) |
| Health Diagnosing & Treating | 0 (0.0%) | 112 (100.0%) |
| Health Technologists | 0 (0.0%) | 92 (100.0%) |
| Total (Category) | 174 (39.6%) | 265 (60.4%) |
| Total (Overall) | 1,241 (51.0%) | 1,194 (49.0%) |
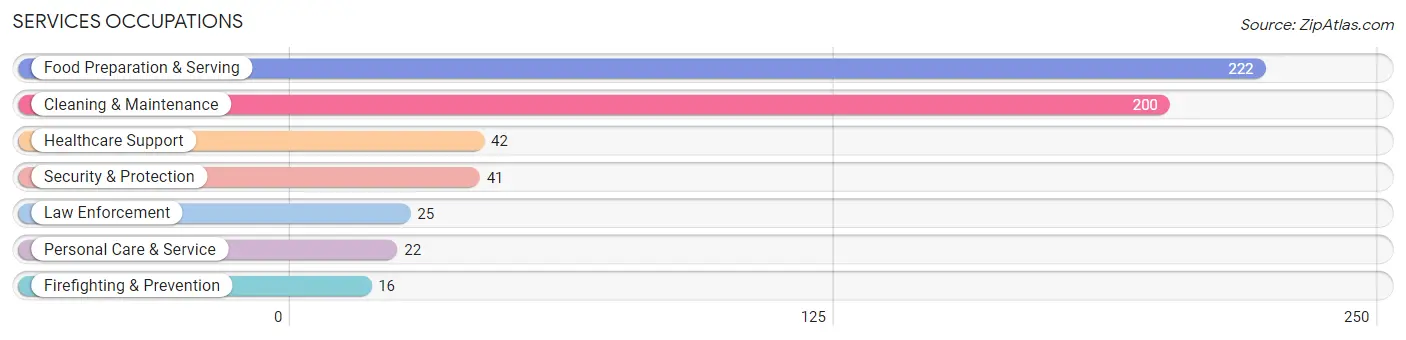
Services Occupations
The most common Services occupations in Eagleton Village are Food Preparation & Serving (222 | 9.1%), Cleaning & Maintenance (200 | 8.2%), Healthcare Support (42 | 1.7%), Security & Protection (41 | 1.7%), and Law Enforcement (25 | 1.0%).
Services Occupations by Sex
Within the Services occupations in Eagleton Village, the most male-oriented occupations are Law Enforcement (100.0%), Personal Care & Service (63.6%), and Security & Protection (61.0%), while the most female-oriented occupations are Healthcare Support (100.0%), Firefighting & Prevention (100.0%), and Cleaning & Maintenance (86.0%).
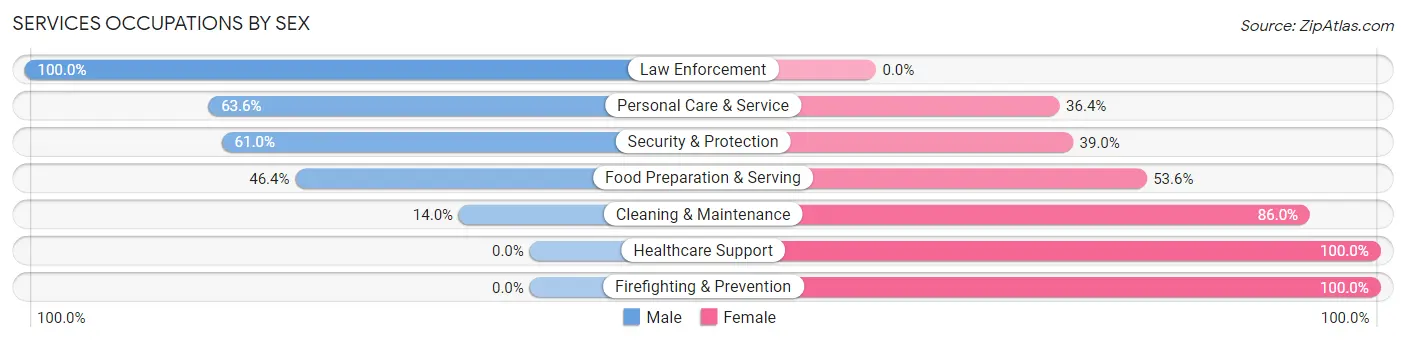
| Occupation | Male | Female |
| Healthcare Support | 0 (0.0%) | 42 (100.0%) |
| Security & Protection | 25 (61.0%) | 16 (39.0%) |
| Firefighting & Prevention | 0 (0.0%) | 16 (100.0%) |
| Law Enforcement | 25 (100.0%) | 0 (0.0%) |
| Food Preparation & Serving | 103 (46.4%) | 119 (53.6%) |
| Cleaning & Maintenance | 28 (14.0%) | 172 (86.0%) |
| Personal Care & Service | 14 (63.6%) | 8 (36.4%) |
| Total (Category) | 170 (32.3%) | 357 (67.7%) |
| Total (Overall) | 1,241 (51.0%) | 1,194 (49.0%) |
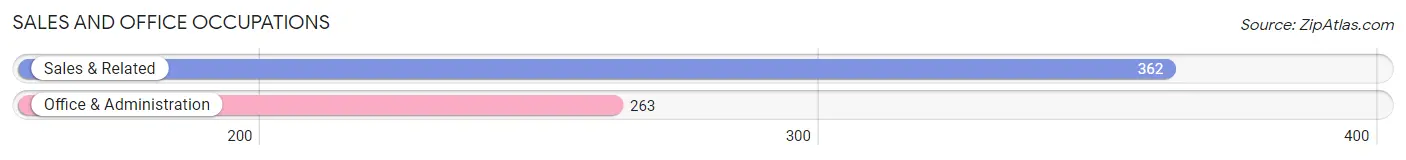
Sales and Office Occupations
The most common Sales and Office occupations in Eagleton Village are Sales & Related (362 | 14.9%), and Office & Administration (263 | 10.8%).
Sales and Office Occupations by Sex
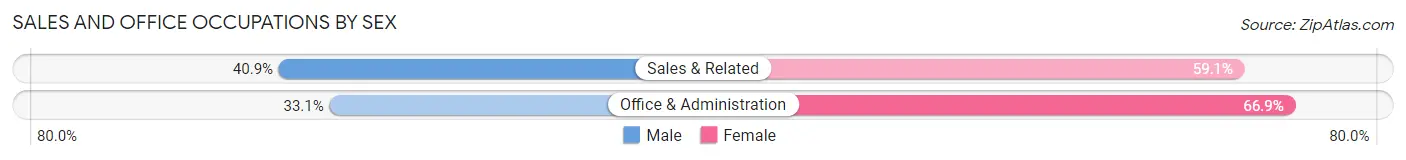
| Occupation | Male | Female |
| Sales & Related | 148 (40.9%) | 214 (59.1%) |
| Office & Administration | 87 (33.1%) | 176 (66.9%) |
| Total (Category) | 235 (37.6%) | 390 (62.4%) |
| Total (Overall) | 1,241 (51.0%) | 1,194 (49.0%) |
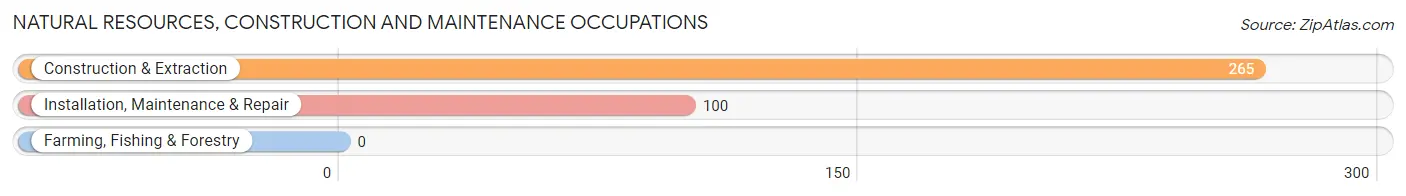
Natural Resources, Construction and Maintenance Occupations
The most common Natural Resources, Construction and Maintenance occupations in Eagleton Village are Construction & Extraction (265 | 10.9%), and Installation, Maintenance & Repair (100 | 4.1%).
Natural Resources, Construction and Maintenance Occupations by Sex
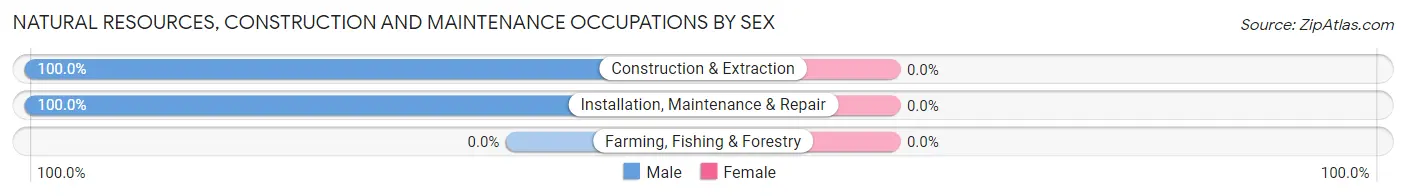
| Occupation | Male | Female |
| Farming, Fishing & Forestry | 0 (0.0%) | 0 (0.0%) |
| Construction & Extraction | 265 (100.0%) | 0 (0.0%) |
| Installation, Maintenance & Repair | 100 (100.0%) | 0 (0.0%) |
| Total (Category) | 365 (100.0%) | 0 (0.0%) |
| Total (Overall) | 1,241 (51.0%) | 1,194 (49.0%) |
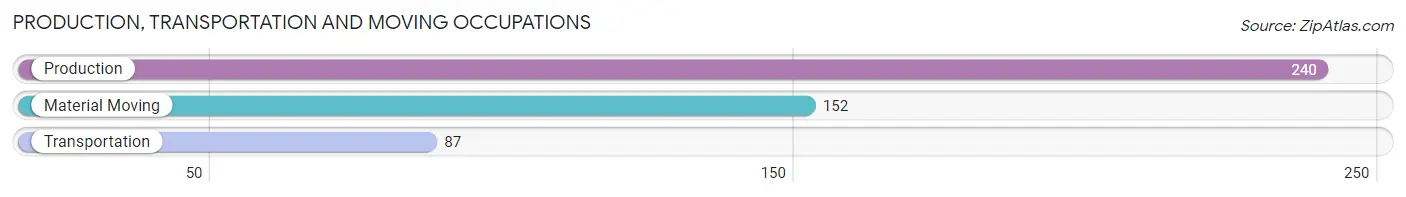
Production, Transportation and Moving Occupations
The most common Production, Transportation and Moving occupations in Eagleton Village are Production (240 | 9.9%), Material Moving (152 | 6.2%), and Transportation (87 | 3.6%).
Production, Transportation and Moving Occupations by Sex
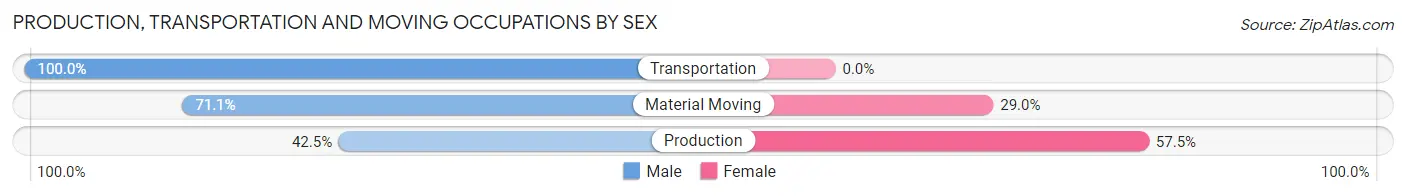
| Occupation | Male | Female |
| Production | 102 (42.5%) | 138 (57.5%) |
| Transportation | 87 (100.0%) | 0 (0.0%) |
| Material Moving | 108 (71.1%) | 44 (28.9%) |
| Total (Category) | 297 (62.0%) | 182 (38.0%) |
| Total (Overall) | 1,241 (51.0%) | 1,194 (49.0%) |
Employment Industries by Sex in Eagleton Village
Employment Industries in Eagleton Village
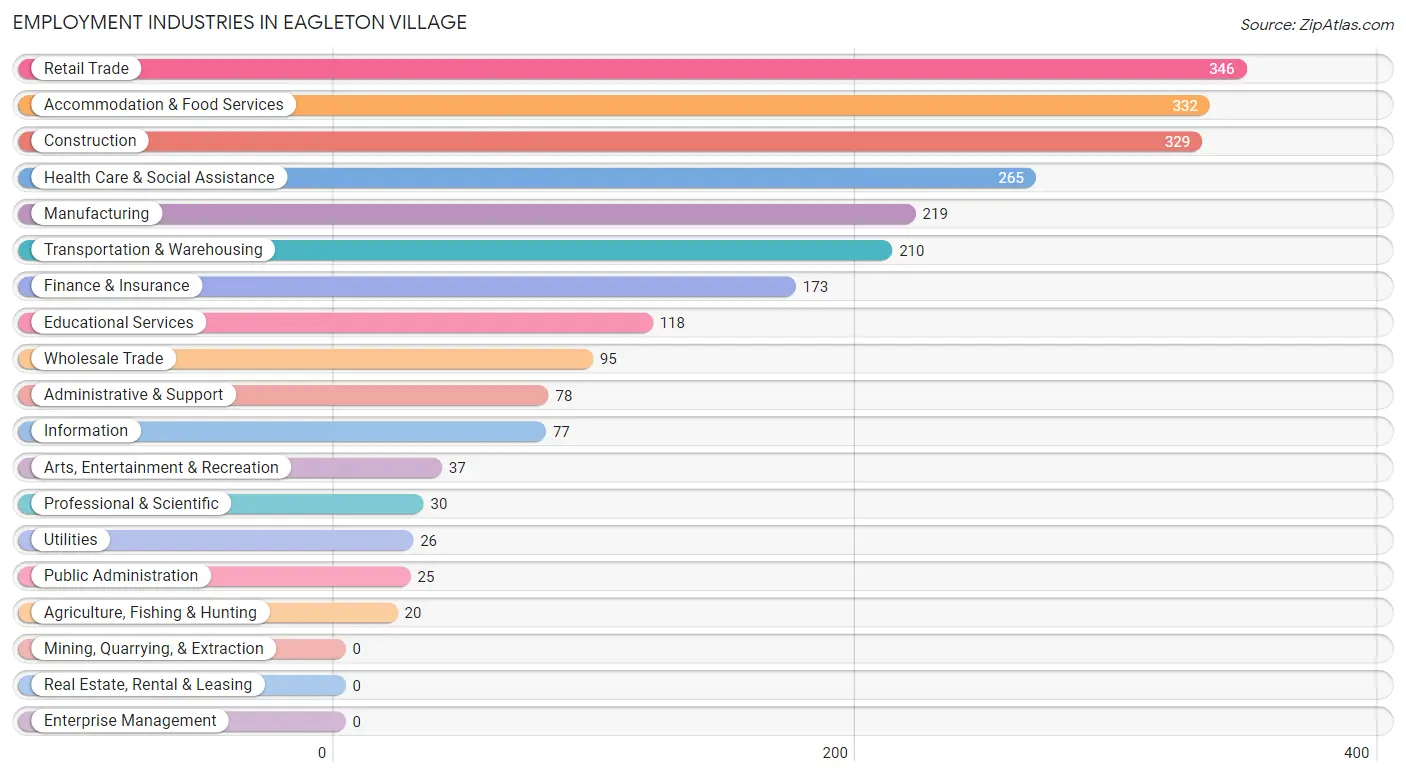
The major employment industries in Eagleton Village include Retail Trade (346 | 14.2%), Accommodation & Food Services (332 | 13.6%), Construction (329 | 13.5%), Health Care & Social Assistance (265 | 10.9%), and Manufacturing (219 | 9.0%).
Employment Industries by Sex in Eagleton Village
The Eagleton Village industries that see more men than women are Agriculture, Fishing & Hunting (100.0%), Information (100.0%), and Public Administration (100.0%), whereas the industries that tend to have a higher number of women are Health Care & Social Assistance (100.0%), Educational Services (75.4%), and Utilities (69.2%).
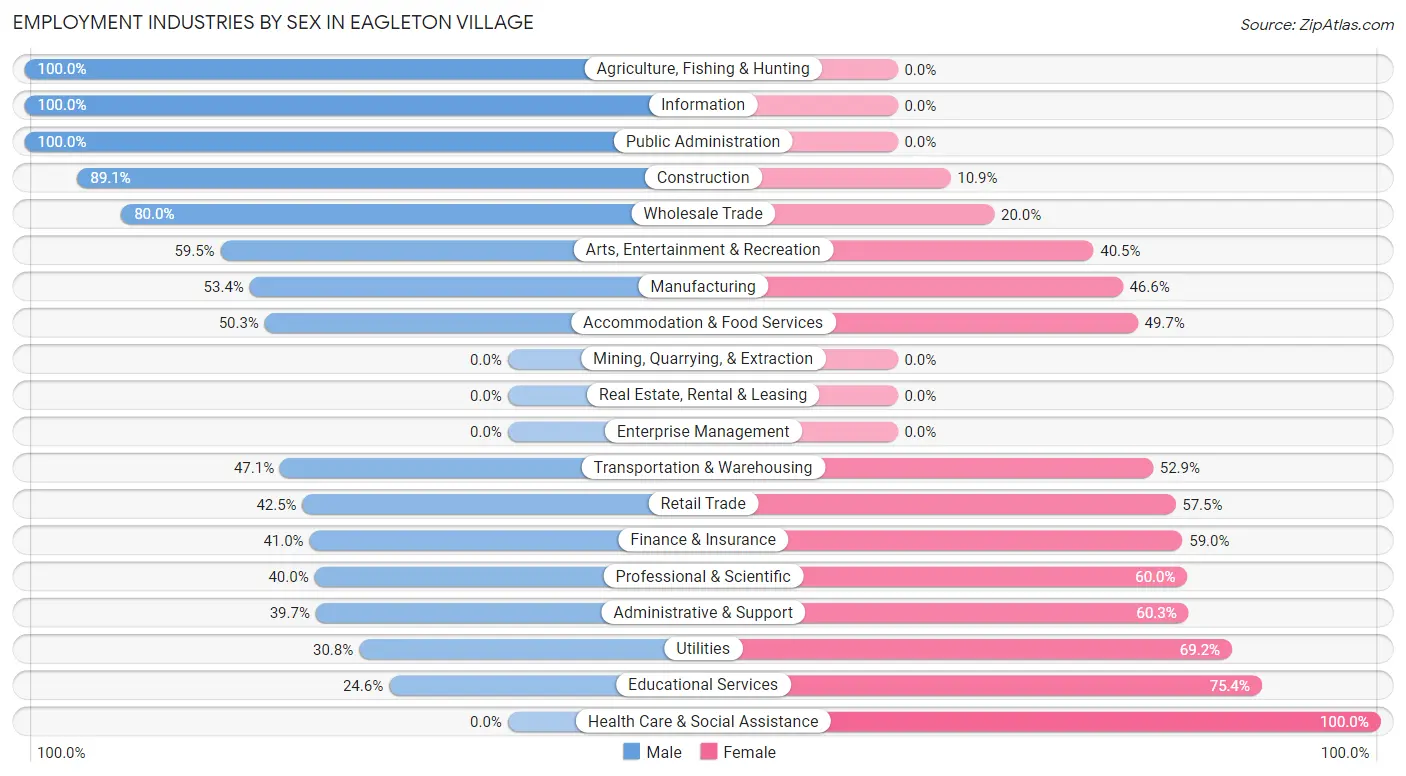
| Industry | Male | Female |
| Agriculture, Fishing & Hunting | 20 (100.0%) | 0 (0.0%) |
| Mining, Quarrying, & Extraction | 0 (0.0%) | 0 (0.0%) |
| Construction | 293 (89.1%) | 36 (10.9%) |
| Manufacturing | 117 (53.4%) | 102 (46.6%) |
| Wholesale Trade | 76 (80.0%) | 19 (20.0%) |
| Retail Trade | 147 (42.5%) | 199 (57.5%) |
| Transportation & Warehousing | 99 (47.1%) | 111 (52.9%) |
| Utilities | 8 (30.8%) | 18 (69.2%) |
| Information | 77 (100.0%) | 0 (0.0%) |
| Finance & Insurance | 71 (41.0%) | 102 (59.0%) |
| Real Estate, Rental & Leasing | 0 (0.0%) | 0 (0.0%) |
| Professional & Scientific | 12 (40.0%) | 18 (60.0%) |
| Enterprise Management | 0 (0.0%) | 0 (0.0%) |
| Administrative & Support | 31 (39.7%) | 47 (60.3%) |
| Educational Services | 29 (24.6%) | 89 (75.4%) |
| Health Care & Social Assistance | 0 (0.0%) | 265 (100.0%) |
| Arts, Entertainment & Recreation | 22 (59.5%) | 15 (40.5%) |
| Accommodation & Food Services | 167 (50.3%) | 165 (49.7%) |
| Public Administration | 25 (100.0%) | 0 (0.0%) |
| Total | 1,241 (51.0%) | 1,194 (49.0%) |
Education in Eagleton Village
School Enrollment in Eagleton Village
The most common levels of schooling among the 982 students in Eagleton Village are middle school (445 | 45.3%), elementary school (158 | 16.1%), and high school (139 | 14.1%).
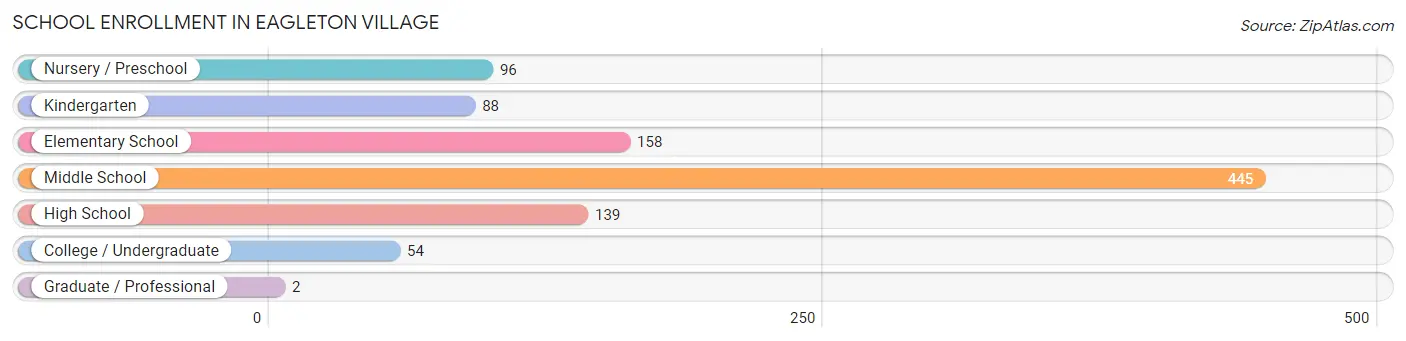
| School Level | # Students | % Students |
| Nursery / Preschool | 96 | 9.8% |
| Kindergarten | 88 | 9.0% |
| Elementary School | 158 | 16.1% |
| Middle School | 445 | 45.3% |
| High School | 139 | 14.1% |
| College / Undergraduate | 54 | 5.5% |
| Graduate / Professional | 2 | 0.2% |
| Total | 982 | 100.0% |
School Enrollment by Age by Funding Source in Eagleton Village
Out of a total of 982 students who are enrolled in schools in Eagleton Village, 170 (17.3%) attend a private institution, while the remaining 812 (82.7%) are enrolled in public schools. The age group of 35 years and over has the highest likelihood of being enrolled in private schools, with 11 (44.0% in the age bracket) enrolled. Conversely, the age group of 18 to 19 year olds has the lowest likelihood of being enrolled in a private school, with 17 (100.0% in the age bracket) attending a public institution.
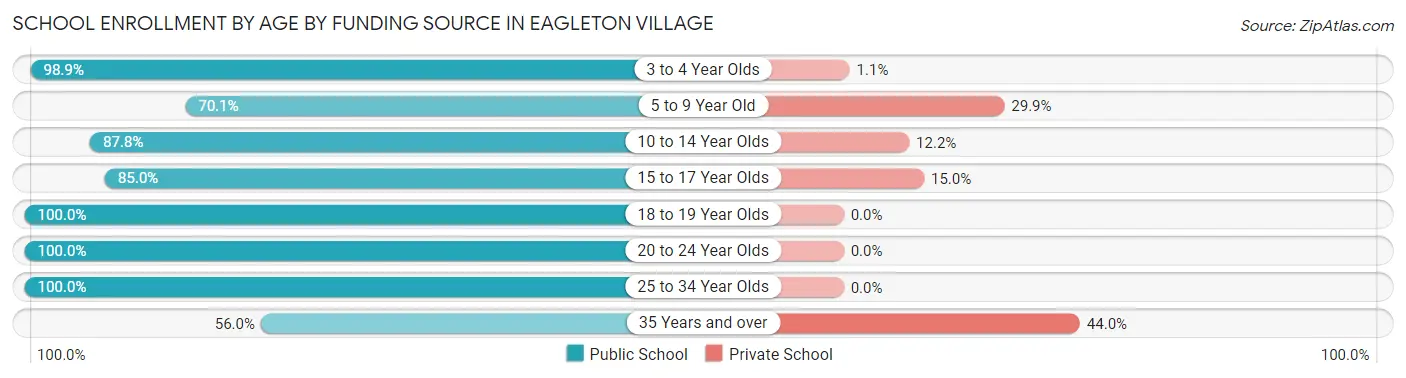
| Age Bracket | Public School | Private School |
| 3 to 4 Year Olds | 88 (98.9%) | 1 (1.1%) |
| 5 to 9 Year Old | 213 (70.1%) | 91 (29.9%) |
| 10 to 14 Year Olds | 324 (87.8%) | 45 (12.2%) |
| 15 to 17 Year Olds | 125 (85.0%) | 22 (15.0%) |
| 18 to 19 Year Olds | 17 (100.0%) | 0 (0.0%) |
| 20 to 24 Year Olds | 14 (100.0%) | 0 (0.0%) |
| 25 to 34 Year Olds | 17 (100.0%) | 0 (0.0%) |
| 35 Years and over | 14 (56.0%) | 11 (44.0%) |
| Total | 812 (82.7%) | 170 (17.3%) |
Educational Attainment by Field of Study in Eagleton Village
Arts & humanities (81 | 14.5%), engineering (69 | 12.4%), business (65 | 11.7%), education (52 | 9.3%), and communications (52 | 9.3%) are the most common fields of study among 558 individuals in Eagleton Village who have obtained a bachelor's degree or higher.
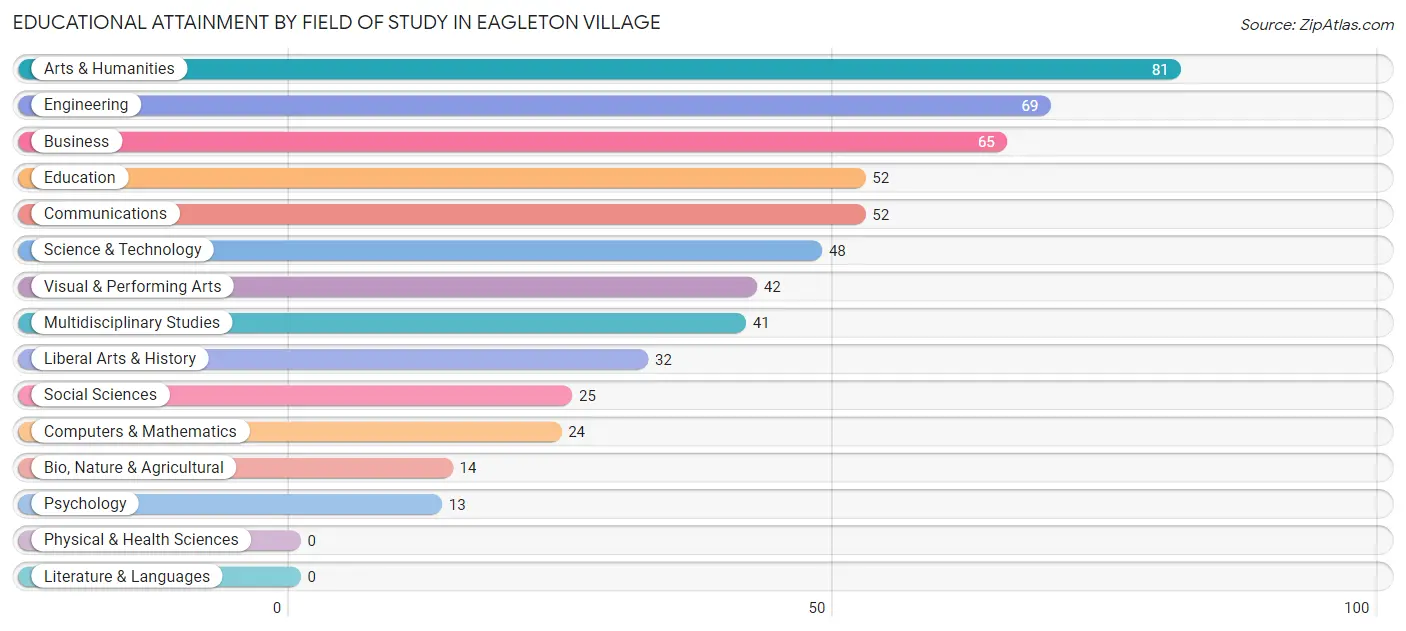
| Field of Study | # Graduates | % Graduates |
| Computers & Mathematics | 24 | 4.3% |
| Bio, Nature & Agricultural | 14 | 2.5% |
| Physical & Health Sciences | 0 | 0.0% |
| Psychology | 13 | 2.3% |
| Social Sciences | 25 | 4.5% |
| Engineering | 69 | 12.4% |
| Multidisciplinary Studies | 41 | 7.3% |
| Science & Technology | 48 | 8.6% |
| Business | 65 | 11.7% |
| Education | 52 | 9.3% |
| Literature & Languages | 0 | 0.0% |
| Liberal Arts & History | 32 | 5.7% |
| Visual & Performing Arts | 42 | 7.5% |
| Communications | 52 | 9.3% |
| Arts & Humanities | 81 | 14.5% |
| Total | 558 | 100.0% |
Transportation & Commute in Eagleton Village
Vehicle Availability by Sex in Eagleton Village
The most prevalent vehicle ownership categories in Eagleton Village are males with 2 vehicles (454, accounting for 36.6%) and females with 2 vehicles (316, making up 39.6%).
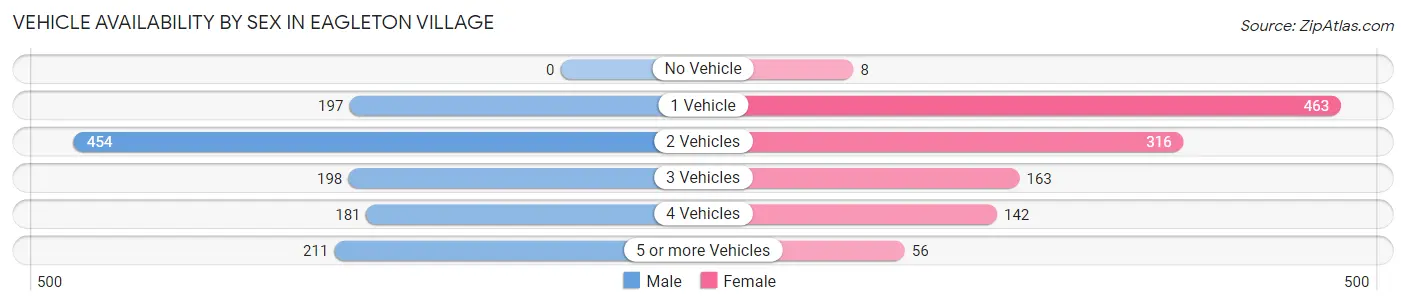
| Vehicles Available | Male | Female |
| No Vehicle | 0 (0.0%) | 8 (0.7%) |
| 1 Vehicle | 197 (15.9%) | 463 (40.3%) |
| 2 Vehicles | 454 (36.6%) | 316 (27.5%) |
| 3 Vehicles | 198 (16.0%) | 163 (14.2%) |
| 4 Vehicles | 181 (14.6%) | 142 (12.4%) |
| 5 or more Vehicles | 211 (17.0%) | 56 (4.9%) |
| Total | 1,241 (100.0%) | 1,148 (100.0%) |
Commute Time in Eagleton Village
The most frequently occuring commute durations in Eagleton Village are 10 to 14 minutes (552 commuters, 25.2%), 15 to 19 minutes (372 commuters, 17.0%), and 20 to 24 minutes (356 commuters, 16.2%).
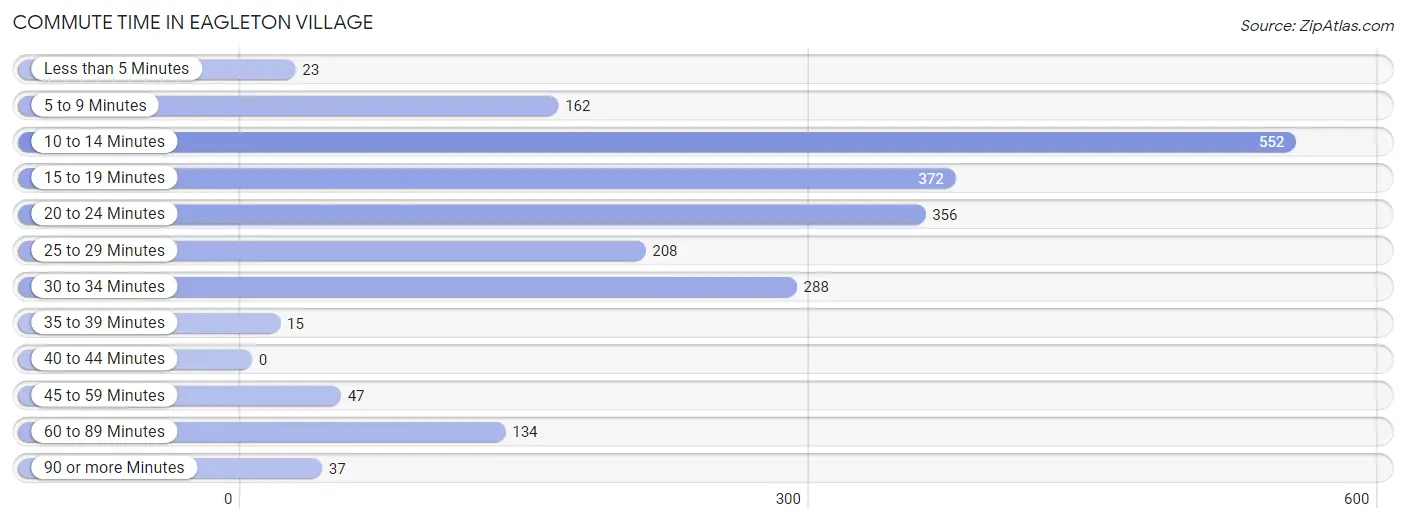
| Commute Time | # Commuters | % Commuters |
| Less than 5 Minutes | 23 | 1.1% |
| 5 to 9 Minutes | 162 | 7.4% |
| 10 to 14 Minutes | 552 | 25.2% |
| 15 to 19 Minutes | 372 | 17.0% |
| 20 to 24 Minutes | 356 | 16.2% |
| 25 to 29 Minutes | 208 | 9.5% |
| 30 to 34 Minutes | 288 | 13.1% |
| 35 to 39 Minutes | 15 | 0.7% |
| 40 to 44 Minutes | 0 | 0.0% |
| 45 to 59 Minutes | 47 | 2.1% |
| 60 to 89 Minutes | 134 | 6.1% |
| 90 or more Minutes | 37 | 1.7% |
Commute Time by Sex in Eagleton Village
The most common commute times in Eagleton Village are 30 to 34 minutes (218 commuters, 18.4%) for males and 10 to 14 minutes (347 commuters, 34.3%) for females.
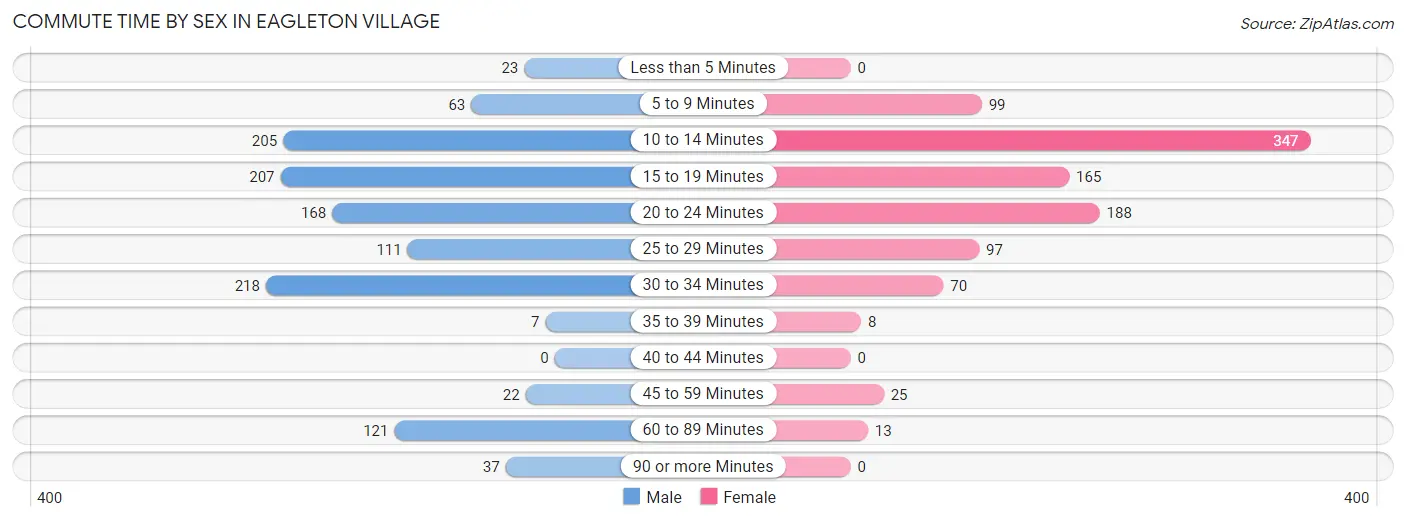
| Commute Time | Male | Female |
| Less than 5 Minutes | 23 (1.9%) | 0 (0.0%) |
| 5 to 9 Minutes | 63 (5.3%) | 99 (9.8%) |
| 10 to 14 Minutes | 205 (17.3%) | 347 (34.3%) |
| 15 to 19 Minutes | 207 (17.5%) | 165 (16.3%) |
| 20 to 24 Minutes | 168 (14.2%) | 188 (18.6%) |
| 25 to 29 Minutes | 111 (9.4%) | 97 (9.6%) |
| 30 to 34 Minutes | 218 (18.4%) | 70 (6.9%) |
| 35 to 39 Minutes | 7 (0.6%) | 8 (0.8%) |
| 40 to 44 Minutes | 0 (0.0%) | 0 (0.0%) |
| 45 to 59 Minutes | 22 (1.9%) | 25 (2.5%) |
| 60 to 89 Minutes | 121 (10.2%) | 13 (1.3%) |
| 90 or more Minutes | 37 (3.1%) | 0 (0.0%) |
Time of Departure to Work by Sex in Eagleton Village
The most frequent times of departure to work in Eagleton Village are 4:00 PM to 11:59 PM (280, 23.7%) for males and 8:00 AM to 8:29 AM (295, 29.1%) for females.
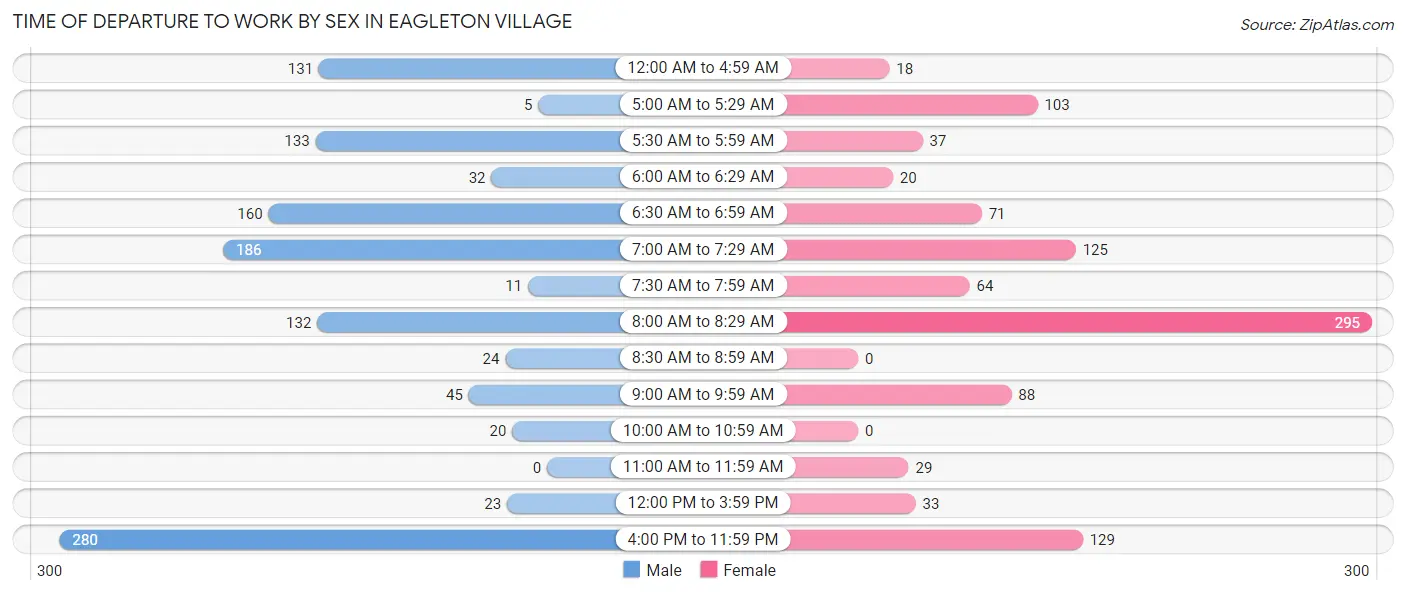
| Time of Departure | Male | Female |
| 12:00 AM to 4:59 AM | 131 (11.1%) | 18 (1.8%) |
| 5:00 AM to 5:29 AM | 5 (0.4%) | 103 (10.2%) |
| 5:30 AM to 5:59 AM | 133 (11.3%) | 37 (3.7%) |
| 6:00 AM to 6:29 AM | 32 (2.7%) | 20 (2.0%) |
| 6:30 AM to 6:59 AM | 160 (13.5%) | 71 (7.0%) |
| 7:00 AM to 7:29 AM | 186 (15.7%) | 125 (12.3%) |
| 7:30 AM to 7:59 AM | 11 (0.9%) | 64 (6.3%) |
| 8:00 AM to 8:29 AM | 132 (11.2%) | 295 (29.1%) |
| 8:30 AM to 8:59 AM | 24 (2.0%) | 0 (0.0%) |
| 9:00 AM to 9:59 AM | 45 (3.8%) | 88 (8.7%) |
| 10:00 AM to 10:59 AM | 20 (1.7%) | 0 (0.0%) |
| 11:00 AM to 11:59 AM | 0 (0.0%) | 29 (2.9%) |
| 12:00 PM to 3:59 PM | 23 (1.9%) | 33 (3.3%) |
| 4:00 PM to 11:59 PM | 280 (23.7%) | 129 (12.8%) |
| Total | 1,182 (100.0%) | 1,012 (100.0%) |
Housing Occupancy in Eagleton Village
Occupancy by Ownership in Eagleton Village
Of the total 2,278 dwellings in Eagleton Village, owner-occupied units account for 1,593 (69.9%), while renter-occupied units make up 685 (30.1%).
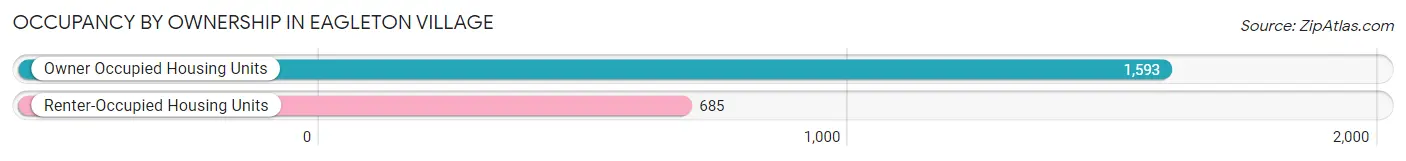
| Occupancy | # Housing Units | % Housing Units |
| Owner Occupied Housing Units | 1,593 | 69.9% |
| Renter-Occupied Housing Units | 685 | 30.1% |
| Total Occupied Housing Units | 2,278 | 100.0% |
Occupancy by Household Size in Eagleton Village
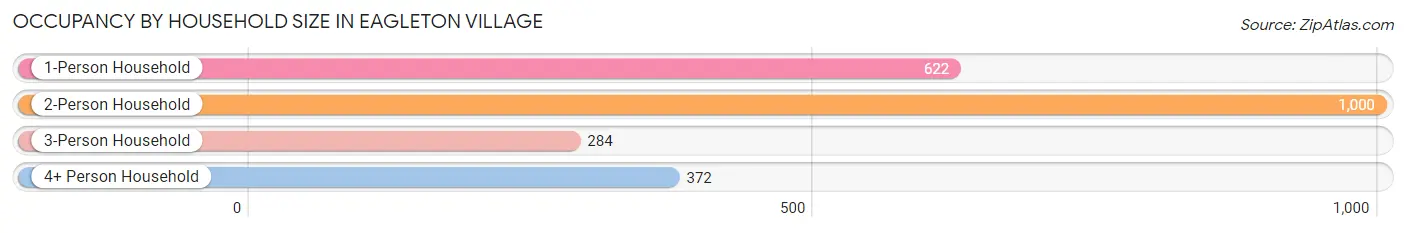
| Household Size | # Housing Units | % Housing Units |
| 1-Person Household | 622 | 27.3% |
| 2-Person Household | 1,000 | 43.9% |
| 3-Person Household | 284 | 12.5% |
| 4+ Person Household | 372 | 16.3% |
| Total Housing Units | 2,278 | 100.0% |
Occupancy by Ownership by Household Size in Eagleton Village
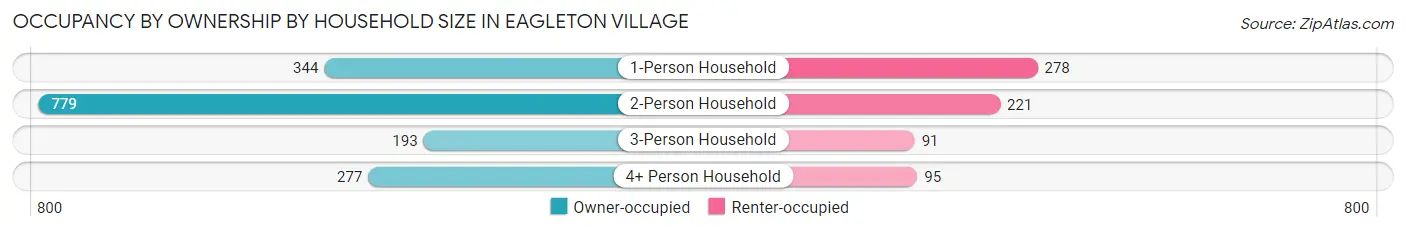
| Household Size | Owner-occupied | Renter-occupied |
| 1-Person Household | 344 (55.3%) | 278 (44.7%) |
| 2-Person Household | 779 (77.9%) | 221 (22.1%) |
| 3-Person Household | 193 (68.0%) | 91 (32.0%) |
| 4+ Person Household | 277 (74.5%) | 95 (25.5%) |
| Total Housing Units | 1,593 (69.9%) | 685 (30.1%) |
Occupancy by Educational Attainment in Eagleton Village
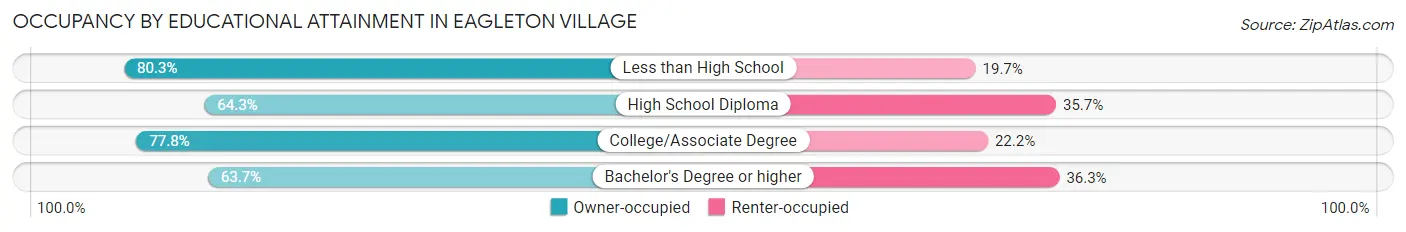
| Household Size | Owner-occupied | Renter-occupied |
| Less than High School | 114 (80.3%) | 28 (19.7%) |
| High School Diploma | 628 (64.3%) | 348 (35.7%) |
| College/Associate Degree | 618 (77.8%) | 176 (22.2%) |
| Bachelor's Degree or higher | 233 (63.7%) | 133 (36.3%) |
Occupancy by Age of Householder in Eagleton Village
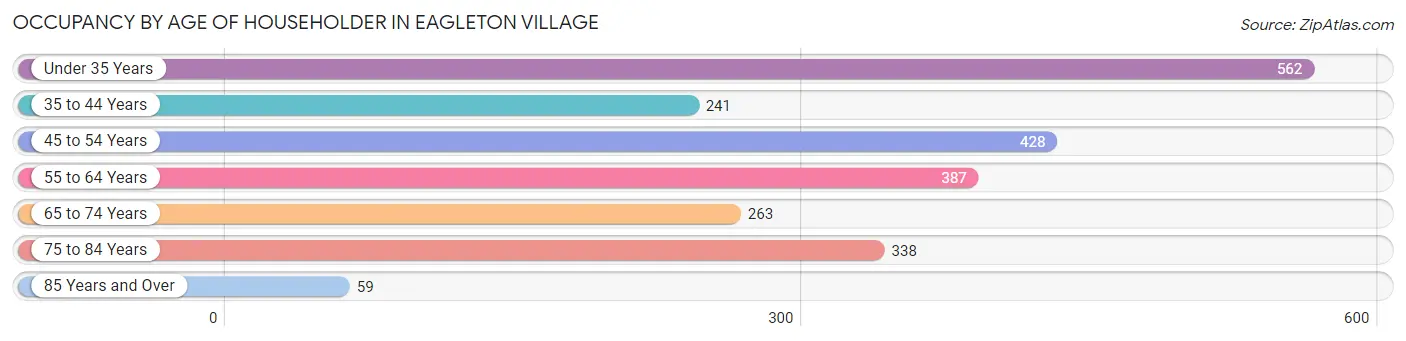
| Age Bracket | # Households | % Households |
| Under 35 Years | 562 | 24.7% |
| 35 to 44 Years | 241 | 10.6% |
| 45 to 54 Years | 428 | 18.8% |
| 55 to 64 Years | 387 | 17.0% |
| 65 to 74 Years | 263 | 11.6% |
| 75 to 84 Years | 338 | 14.8% |
| 85 Years and Over | 59 | 2.6% |
| Total | 2,278 | 100.0% |
Housing Finances in Eagleton Village
Median Income by Occupancy in Eagleton Village
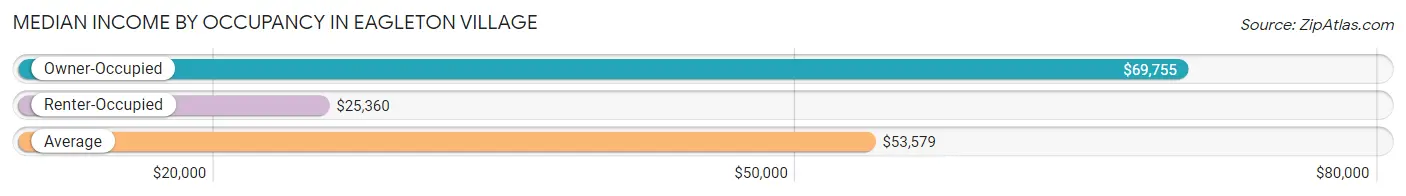
| Occupancy Type | # Households | Median Income |
| Owner-Occupied | 1,593 (69.9%) | $69,755 |
| Renter-Occupied | 685 (30.1%) | $25,360 |
| Average | 2,278 (100.0%) | $53,579 |
Occupancy by Householder Income Bracket in Eagleton Village
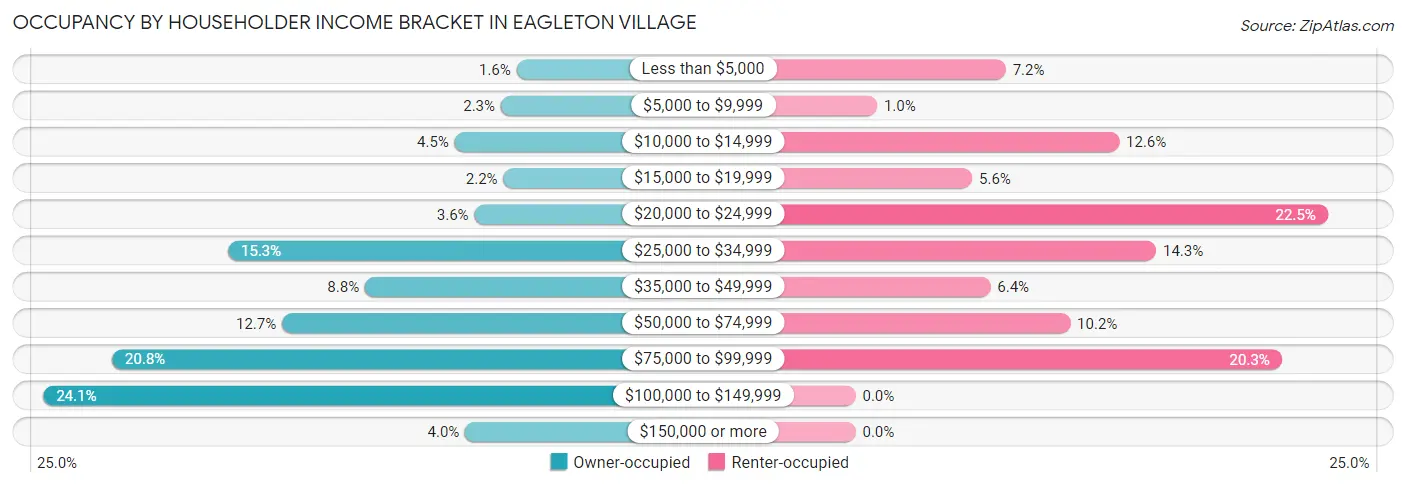
| Income Bracket | Owner-occupied | Renter-occupied |
| Less than $5,000 | 25 (1.6%) | 49 (7.1%) |
| $5,000 to $9,999 | 37 (2.3%) | 7 (1.0%) |
| $10,000 to $14,999 | 72 (4.5%) | 86 (12.6%) |
| $15,000 to $19,999 | 35 (2.2%) | 38 (5.6%) |
| $20,000 to $24,999 | 57 (3.6%) | 154 (22.5%) |
| $25,000 to $34,999 | 244 (15.3%) | 98 (14.3%) |
| $35,000 to $49,999 | 140 (8.8%) | 44 (6.4%) |
| $50,000 to $74,999 | 203 (12.7%) | 70 (10.2%) |
| $75,000 to $99,999 | 332 (20.8%) | 139 (20.3%) |
| $100,000 to $149,999 | 384 (24.1%) | 0 (0.0%) |
| $150,000 or more | 64 (4.0%) | 0 (0.0%) |
| Total | 1,593 (100.0%) | 685 (100.0%) |
Monthly Housing Cost Tiers in Eagleton Village
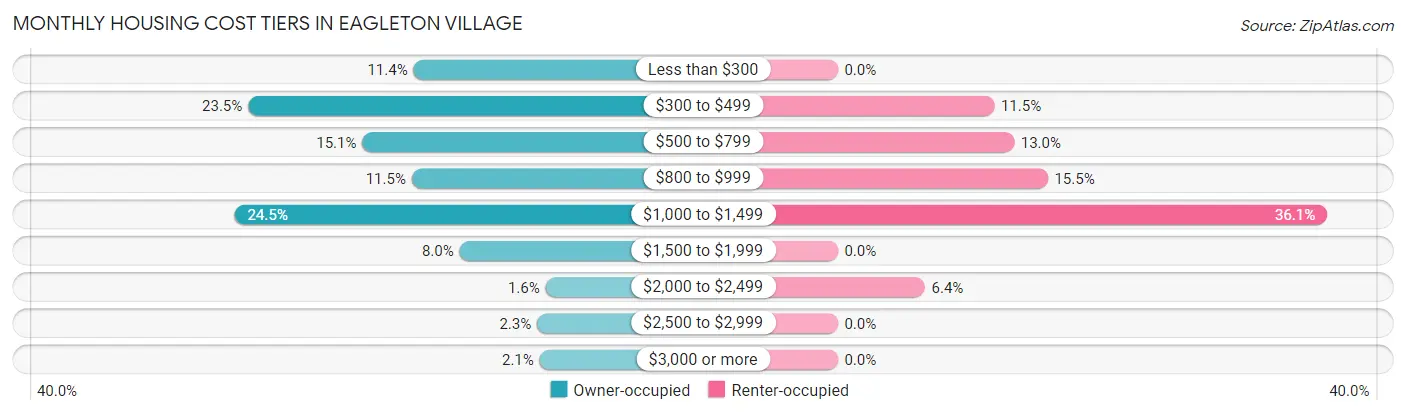
| Monthly Cost | Owner-occupied | Renter-occupied |
| Less than $300 | 181 (11.4%) | 0 (0.0%) |
| $300 to $499 | 375 (23.5%) | 79 (11.5%) |
| $500 to $799 | 241 (15.1%) | 89 (13.0%) |
| $800 to $999 | 183 (11.5%) | 106 (15.5%) |
| $1,000 to $1,499 | 391 (24.5%) | 247 (36.1%) |
| $1,500 to $1,999 | 127 (8.0%) | 0 (0.0%) |
| $2,000 to $2,499 | 26 (1.6%) | 44 (6.4%) |
| $2,500 to $2,999 | 36 (2.3%) | 0 (0.0%) |
| $3,000 or more | 33 (2.1%) | 0 (0.0%) |
| Total | 1,593 (100.0%) | 685 (100.0%) |
Physical Housing Characteristics in Eagleton Village
Housing Structures in Eagleton Village
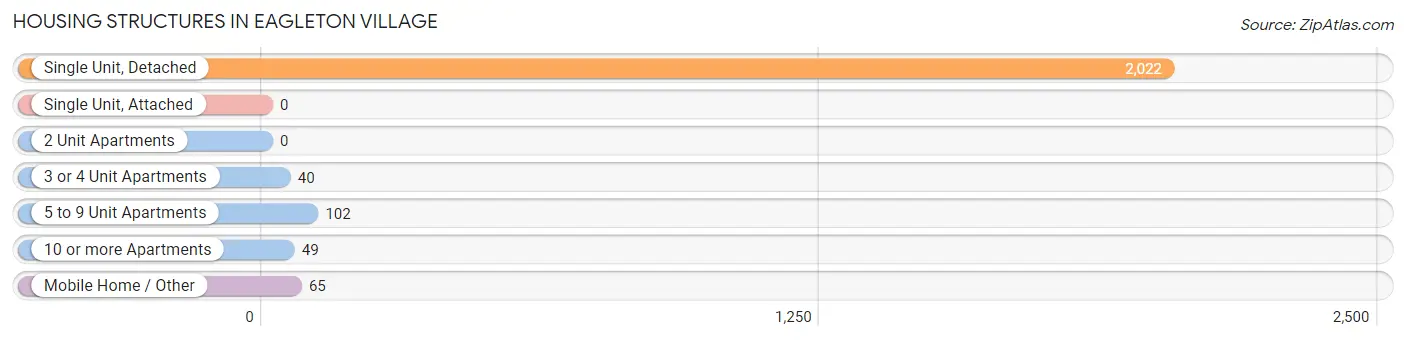
| Structure Type | # Housing Units | % Housing Units |
| Single Unit, Detached | 2,022 | 88.8% |
| Single Unit, Attached | 0 | 0.0% |
| 2 Unit Apartments | 0 | 0.0% |
| 3 or 4 Unit Apartments | 40 | 1.8% |
| 5 to 9 Unit Apartments | 102 | 4.5% |
| 10 or more Apartments | 49 | 2.1% |
| Mobile Home / Other | 65 | 2.9% |
| Total | 2,278 | 100.0% |
Housing Structures by Occupancy in Eagleton Village
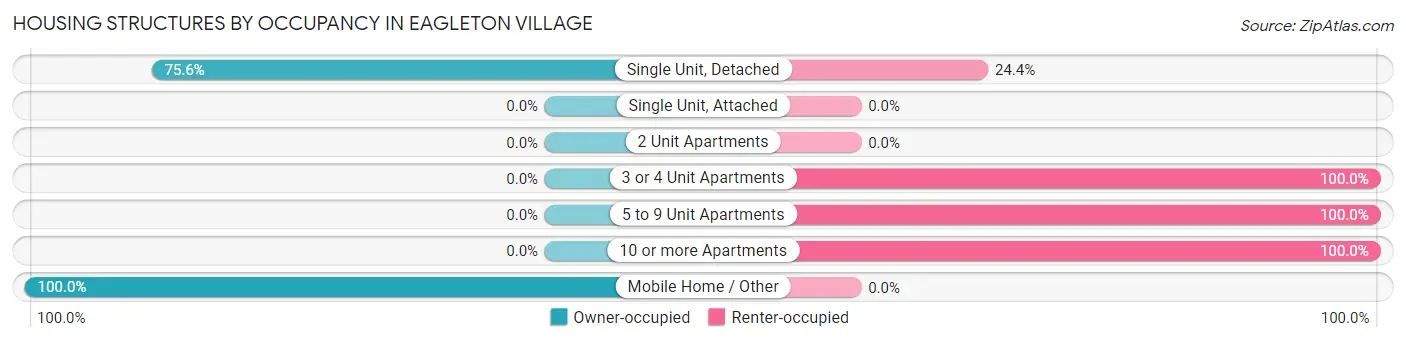
| Structure Type | Owner-occupied | Renter-occupied |
| Single Unit, Detached | 1,528 (75.6%) | 494 (24.4%) |
| Single Unit, Attached | 0 (0.0%) | 0 (0.0%) |
| 2 Unit Apartments | 0 (0.0%) | 0 (0.0%) |
| 3 or 4 Unit Apartments | 0 (0.0%) | 40 (100.0%) |
| 5 to 9 Unit Apartments | 0 (0.0%) | 102 (100.0%) |
| 10 or more Apartments | 0 (0.0%) | 49 (100.0%) |
| Mobile Home / Other | 65 (100.0%) | 0 (0.0%) |
| Total | 1,593 (69.9%) | 685 (30.1%) |
Housing Structures by Number of Rooms in Eagleton Village
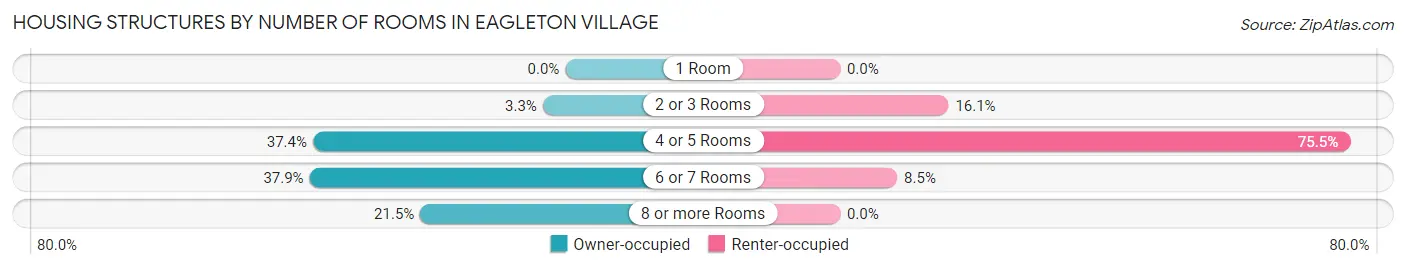
| Number of Rooms | Owner-occupied | Renter-occupied |
| 1 Room | 0 (0.0%) | 0 (0.0%) |
| 2 or 3 Rooms | 53 (3.3%) | 110 (16.1%) |
| 4 or 5 Rooms | 595 (37.3%) | 517 (75.5%) |
| 6 or 7 Rooms | 603 (37.9%) | 58 (8.5%) |
| 8 or more Rooms | 342 (21.5%) | 0 (0.0%) |
| Total | 1,593 (100.0%) | 685 (100.0%) |
Housing Structure by Heating Type in Eagleton Village
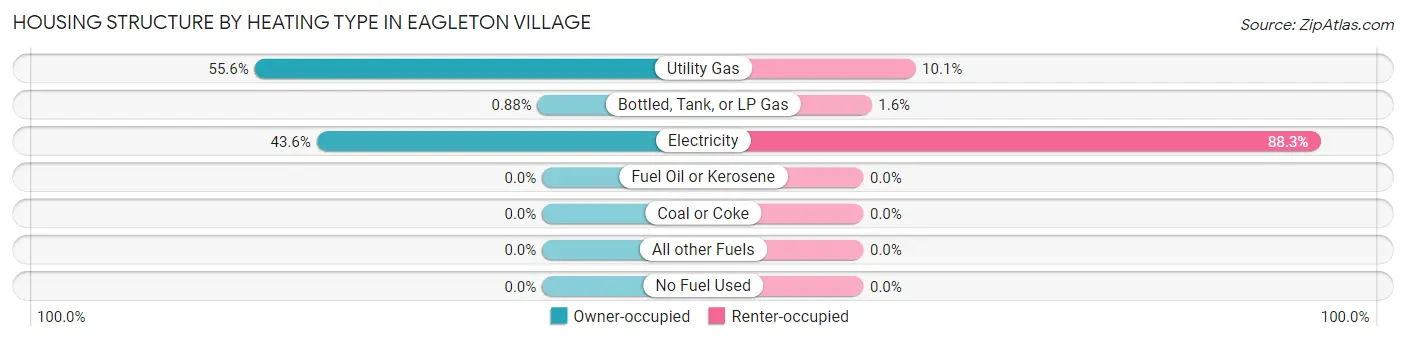
| Heating Type | Owner-occupied | Renter-occupied |
| Utility Gas | 885 (55.6%) | 69 (10.1%) |
| Bottled, Tank, or LP Gas | 14 (0.9%) | 11 (1.6%) |
| Electricity | 694 (43.6%) | 605 (88.3%) |
| Fuel Oil or Kerosene | 0 (0.0%) | 0 (0.0%) |
| Coal or Coke | 0 (0.0%) | 0 (0.0%) |
| All other Fuels | 0 (0.0%) | 0 (0.0%) |
| No Fuel Used | 0 (0.0%) | 0 (0.0%) |
| Total | 1,593 (100.0%) | 685 (100.0%) |
Household Vehicle Usage in Eagleton Village
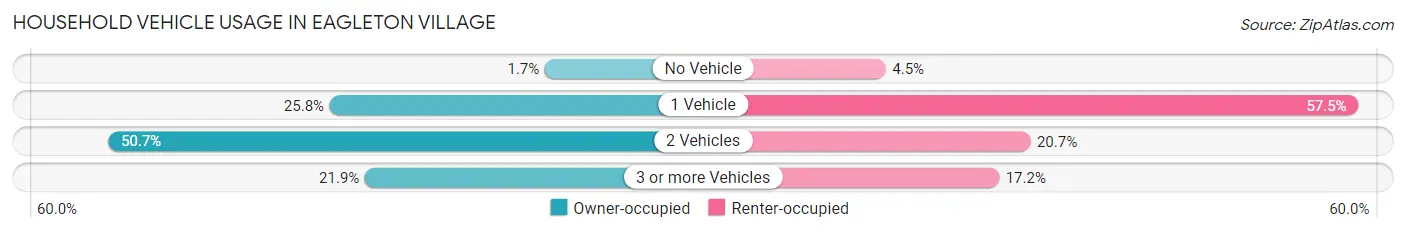
| Vehicles per Household | Owner-occupied | Renter-occupied |
| No Vehicle | 27 (1.7%) | 31 (4.5%) |
| 1 Vehicle | 411 (25.8%) | 394 (57.5%) |
| 2 Vehicles | 807 (50.7%) | 142 (20.7%) |
| 3 or more Vehicles | 348 (21.8%) | 118 (17.2%) |
| Total | 1,593 (100.0%) | 685 (100.0%) |
Real Estate & Mortgages in Eagleton Village
Real Estate and Mortgage Overview in Eagleton Village
| Characteristic | Without Mortgage | With Mortgage |
| Housing Units | 658 | 935 |
| Median Property Value | $139,800 | $152,000 |
| Median Household Income | $29,863 | $43 |
| Monthly Housing Costs | $339 | $33 |
| Real Estate Taxes | $688 | $42 |
Property Value by Mortgage Status in Eagleton Village
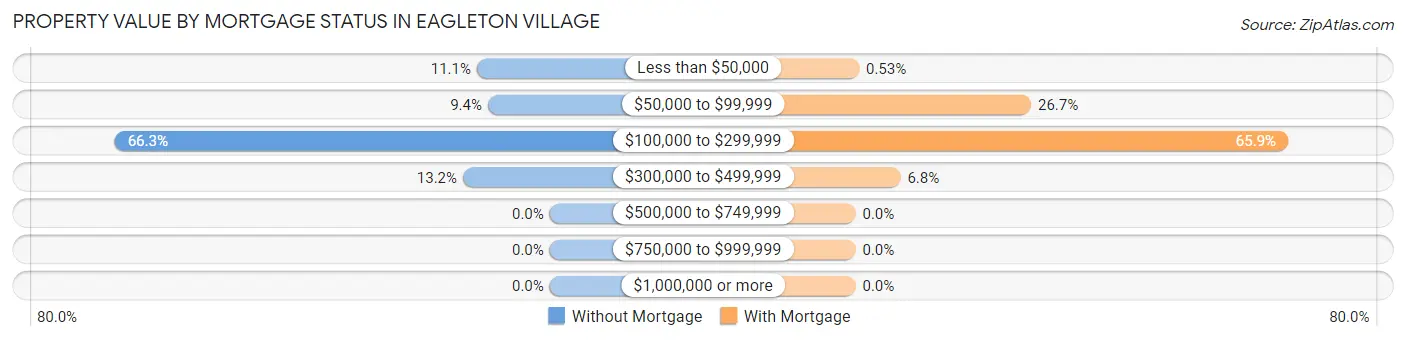
| Property Value | Without Mortgage | With Mortgage |
| Less than $50,000 | 73 (11.1%) | 5 (0.5%) |
| $50,000 to $99,999 | 62 (9.4%) | 250 (26.7%) |
| $100,000 to $299,999 | 436 (66.3%) | 616 (65.9%) |
| $300,000 to $499,999 | 87 (13.2%) | 64 (6.8%) |
| $500,000 to $749,999 | 0 (0.0%) | 0 (0.0%) |
| $750,000 to $999,999 | 0 (0.0%) | 0 (0.0%) |
| $1,000,000 or more | 0 (0.0%) | 0 (0.0%) |
| Total | 658 (100.0%) | 935 (100.0%) |
Household Income by Mortgage Status in Eagleton Village
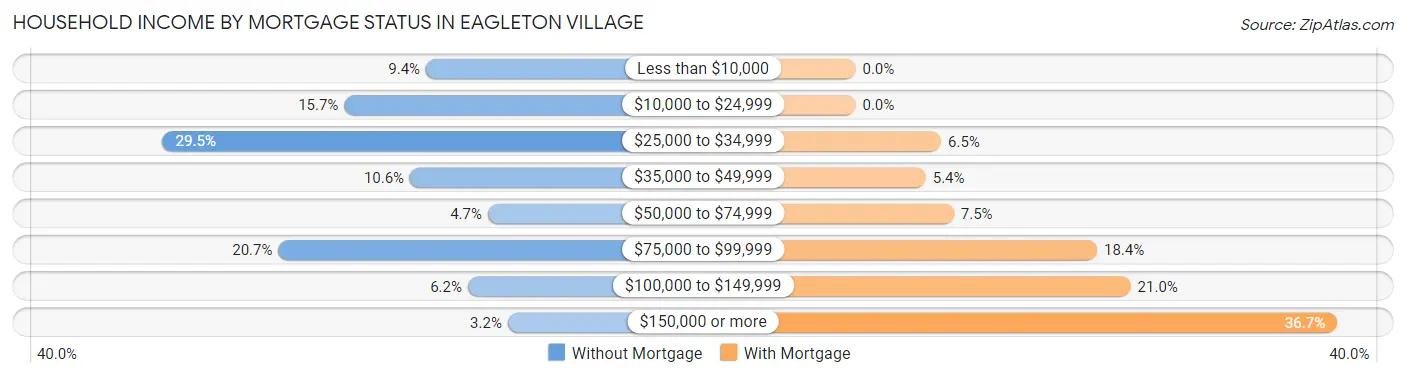
| Household Income | Without Mortgage | With Mortgage |
| Less than $10,000 | 62 (9.4%) | 0 (0.0%) |
| $10,000 to $24,999 | 103 (15.7%) | 0 (0.0%) |
| $25,000 to $34,999 | 194 (29.5%) | 61 (6.5%) |
| $35,000 to $49,999 | 70 (10.6%) | 50 (5.3%) |
| $50,000 to $74,999 | 31 (4.7%) | 70 (7.5%) |
| $75,000 to $99,999 | 136 (20.7%) | 172 (18.4%) |
| $100,000 to $149,999 | 41 (6.2%) | 196 (21.0%) |
| $150,000 or more | 21 (3.2%) | 343 (36.7%) |
| Total | 658 (100.0%) | 935 (100.0%) |
Property Value to Household Income Ratio in Eagleton Village
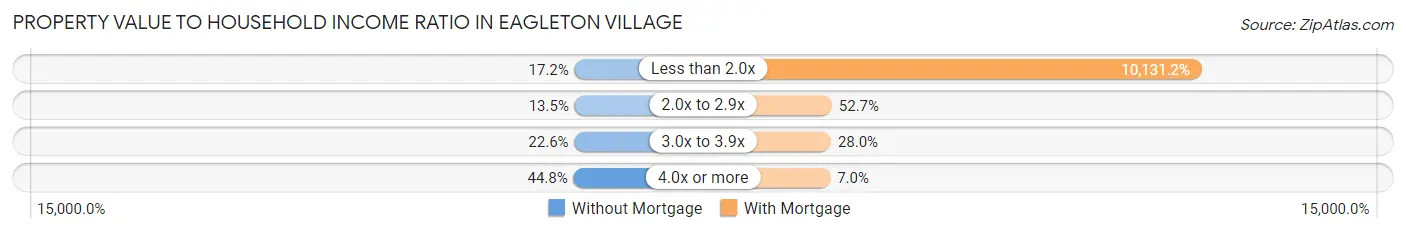
| Value-to-Income Ratio | Without Mortgage | With Mortgage |
| Less than 2.0x | 113 (17.2%) | 94,727 (10,131.2%) |
| 2.0x to 2.9x | 89 (13.5%) | 493 (52.7%) |
| 3.0x to 3.9x | 149 (22.6%) | 262 (28.0%) |
| 4.0x or more | 295 (44.8%) | 65 (7.0%) |
| Total | 658 (100.0%) | 935 (100.0%) |
Real Estate Taxes by Mortgage Status in Eagleton Village
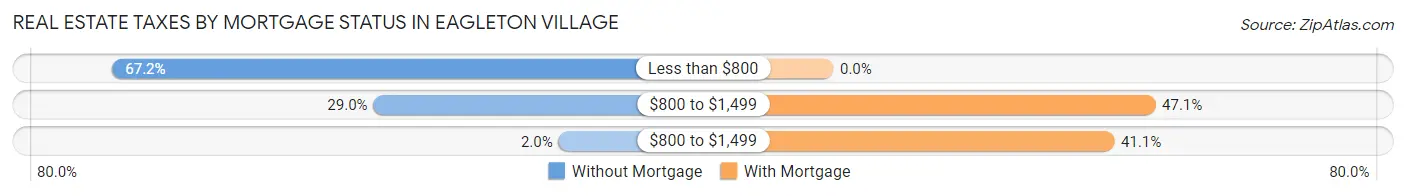
| Property Taxes | Without Mortgage | With Mortgage |
| Less than $800 | 442 (67.2%) | 0 (0.0%) |
| $800 to $1,499 | 191 (29.0%) | 440 (47.1%) |
| $800 to $1,499 | 13 (2.0%) | 384 (41.1%) |
| Total | 658 (100.0%) | 935 (100.0%) |
Health & Disability in Eagleton Village
Health Insurance Coverage by Age in Eagleton Village
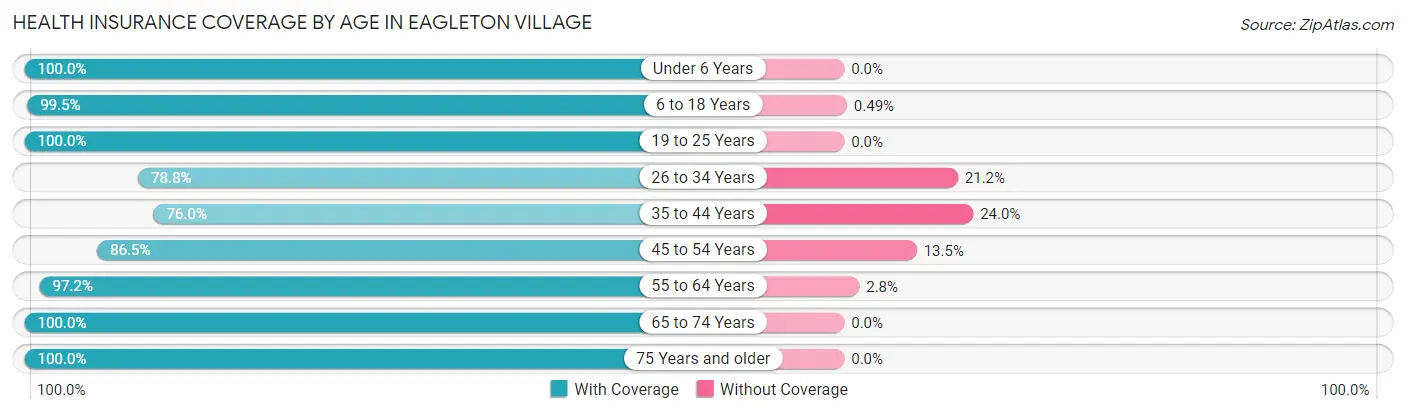
| Age Bracket | With Coverage | Without Coverage |
| Under 6 Years | 500 (100.0%) | 0 (0.0%) |
| 6 to 18 Years | 815 (99.5%) | 4 (0.5%) |
| 19 to 25 Years | 358 (100.0%) | 0 (0.0%) |
| 26 to 34 Years | 454 (78.8%) | 122 (21.2%) |
| 35 to 44 Years | 436 (76.0%) | 138 (24.0%) |
| 45 to 54 Years | 576 (86.5%) | 90 (13.5%) |
| 55 to 64 Years | 728 (97.2%) | 21 (2.8%) |
| 65 to 74 Years | 385 (100.0%) | 0 (0.0%) |
| 75 Years and older | 701 (100.0%) | 0 (0.0%) |
| Total | 4,953 (93.0%) | 375 (7.0%) |
Health Insurance Coverage by Citizenship Status in Eagleton Village
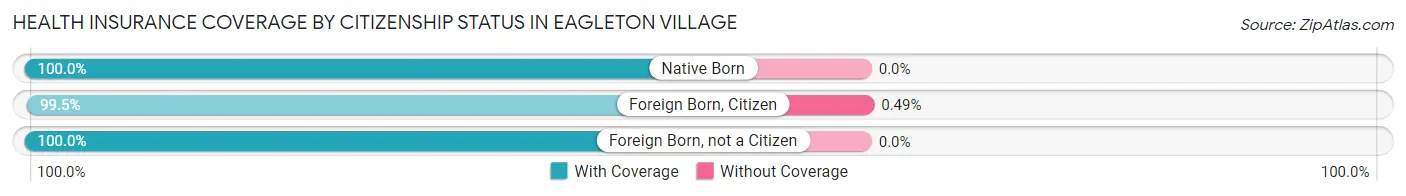
| Citizenship Status | With Coverage | Without Coverage |
| Native Born | 500 (100.0%) | 0 (0.0%) |
| Foreign Born, Citizen | 815 (99.5%) | 4 (0.5%) |
| Foreign Born, not a Citizen | 358 (100.0%) | 0 (0.0%) |
Health Insurance Coverage by Household Income in Eagleton Village
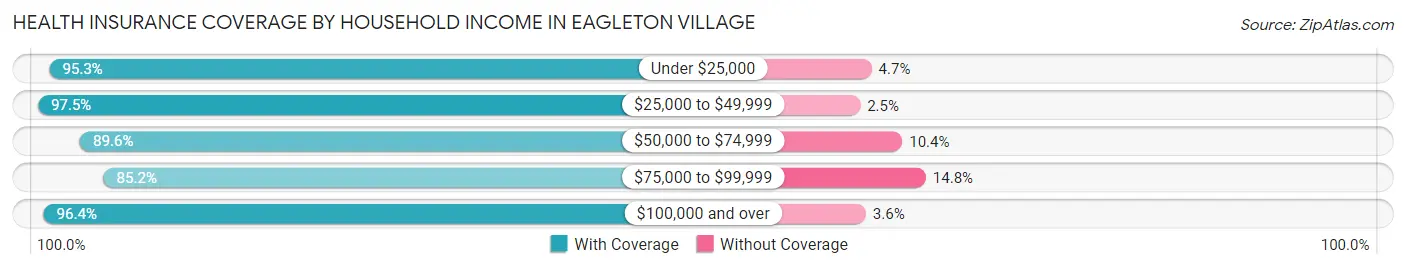
| Household Income | With Coverage | Without Coverage |
| Under $25,000 | 901 (95.3%) | 44 (4.7%) |
| $25,000 to $49,999 | 1,164 (97.5%) | 30 (2.5%) |
| $50,000 to $74,999 | 534 (89.6%) | 62 (10.4%) |
| $75,000 to $99,999 | 1,115 (85.2%) | 194 (14.8%) |
| $100,000 and over | 1,212 (96.4%) | 45 (3.6%) |
Public vs Private Health Insurance Coverage by Age in Eagleton Village
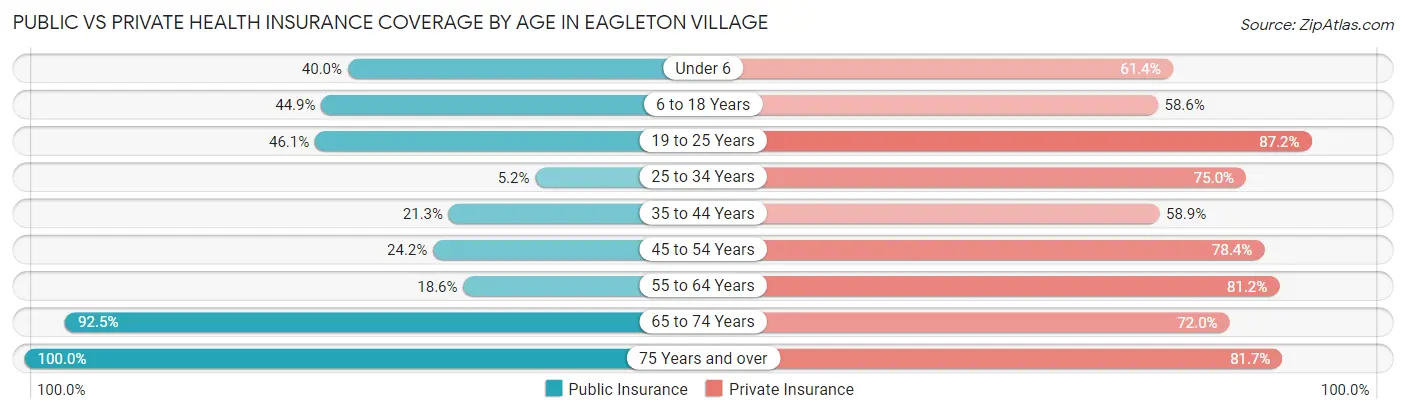
| Age Bracket | Public Insurance | Private Insurance |
| Under 6 | 200 (40.0%) | 307 (61.4%) |
| 6 to 18 Years | 368 (44.9%) | 480 (58.6%) |
| 19 to 25 Years | 165 (46.1%) | 312 (87.2%) |
| 25 to 34 Years | 30 (5.2%) | 432 (75.0%) |
| 35 to 44 Years | 122 (21.2%) | 338 (58.9%) |
| 45 to 54 Years | 161 (24.2%) | 522 (78.4%) |
| 55 to 64 Years | 139 (18.6%) | 608 (81.2%) |
| 65 to 74 Years | 356 (92.5%) | 277 (72.0%) |
| 75 Years and over | 701 (100.0%) | 573 (81.7%) |
| Total | 2,242 (42.1%) | 3,849 (72.2%) |
Disability Status by Sex by Age in Eagleton Village
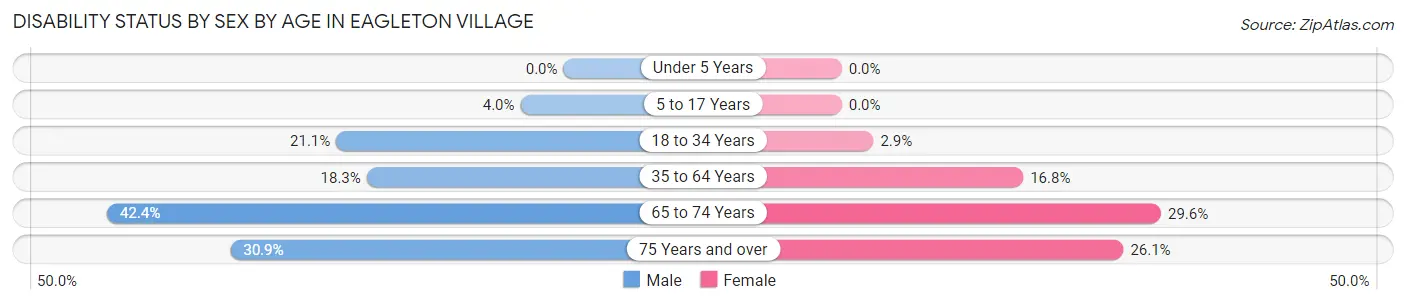
| Age Bracket | Male | Female |
| Under 5 Years | 0 (0.0%) | 0 (0.0%) |
| 5 to 17 Years | 22 (4.0%) | 0 (0.0%) |
| 18 to 34 Years | 93 (21.1%) | 15 (2.9%) |
| 35 to 64 Years | 168 (18.3%) | 180 (16.8%) |
| 65 to 74 Years | 83 (42.3%) | 56 (29.6%) |
| 75 Years and over | 115 (30.9%) | 86 (26.1%) |
Disability Class by Sex by Age in Eagleton Village
Disability Class: Hearing Difficulty
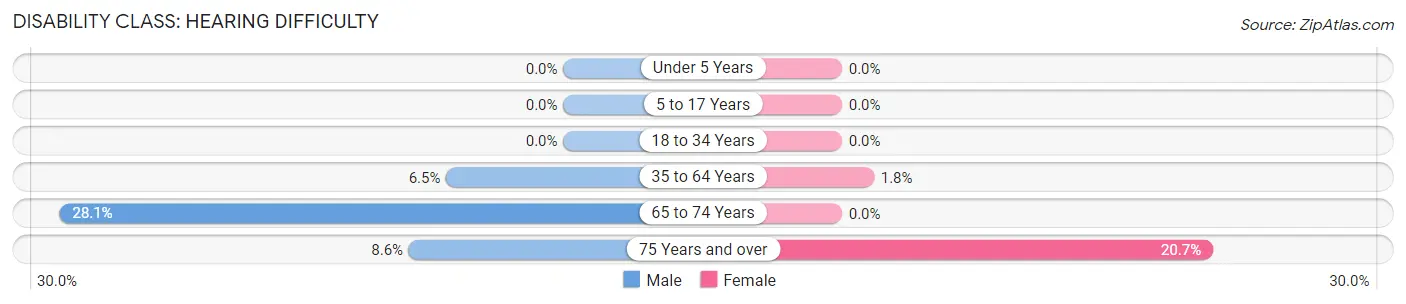
| Age Bracket | Male | Female |
| Under 5 Years | 0 (0.0%) | 0 (0.0%) |
| 5 to 17 Years | 0 (0.0%) | 0 (0.0%) |
| 18 to 34 Years | 0 (0.0%) | 0 (0.0%) |
| 35 to 64 Years | 60 (6.5%) | 19 (1.8%) |
| 65 to 74 Years | 55 (28.1%) | 0 (0.0%) |
| 75 Years and over | 32 (8.6%) | 68 (20.7%) |
Disability Class: Vision Difficulty
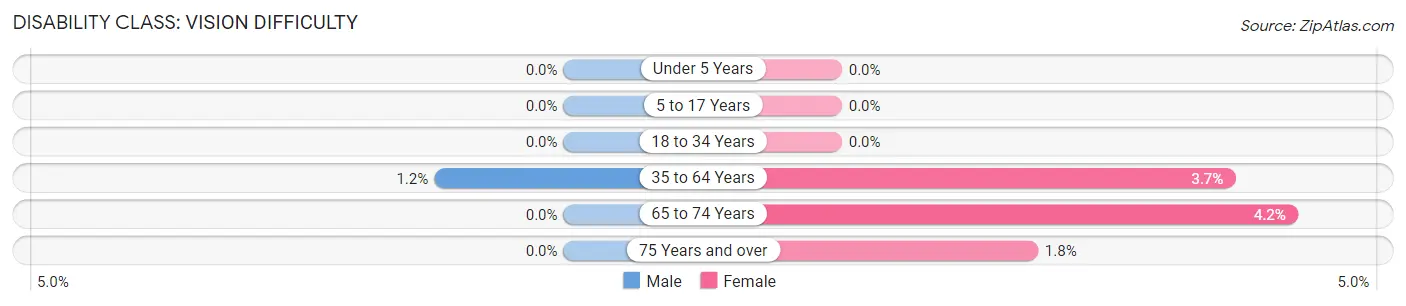
| Age Bracket | Male | Female |
| Under 5 Years | 0 (0.0%) | 0 (0.0%) |
| 5 to 17 Years | 0 (0.0%) | 0 (0.0%) |
| 18 to 34 Years | 0 (0.0%) | 0 (0.0%) |
| 35 to 64 Years | 11 (1.2%) | 39 (3.6%) |
| 65 to 74 Years | 0 (0.0%) | 8 (4.2%) |
| 75 Years and over | 0 (0.0%) | 6 (1.8%) |
Disability Class: Cognitive Difficulty
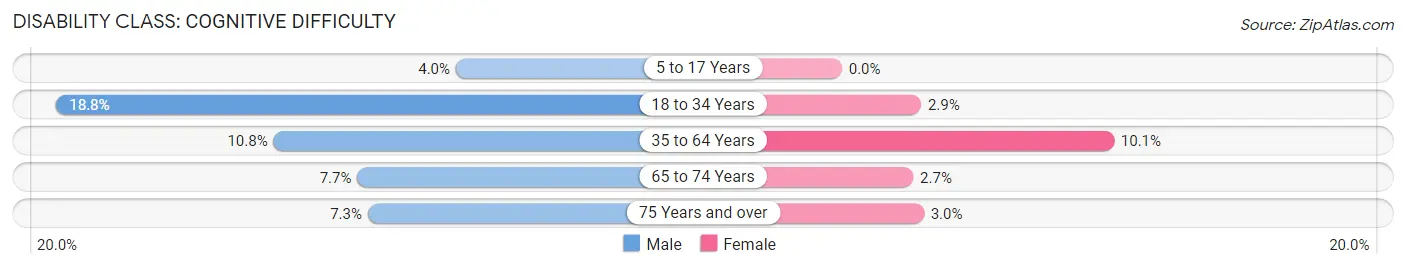
| Age Bracket | Male | Female |
| 5 to 17 Years | 22 (4.0%) | 0 (0.0%) |
| 18 to 34 Years | 83 (18.8%) | 15 (2.9%) |
| 35 to 64 Years | 99 (10.8%) | 108 (10.1%) |
| 65 to 74 Years | 15 (7.6%) | 5 (2.6%) |
| 75 Years and over | 27 (7.3%) | 10 (3.0%) |
Disability Class: Ambulatory Difficulty
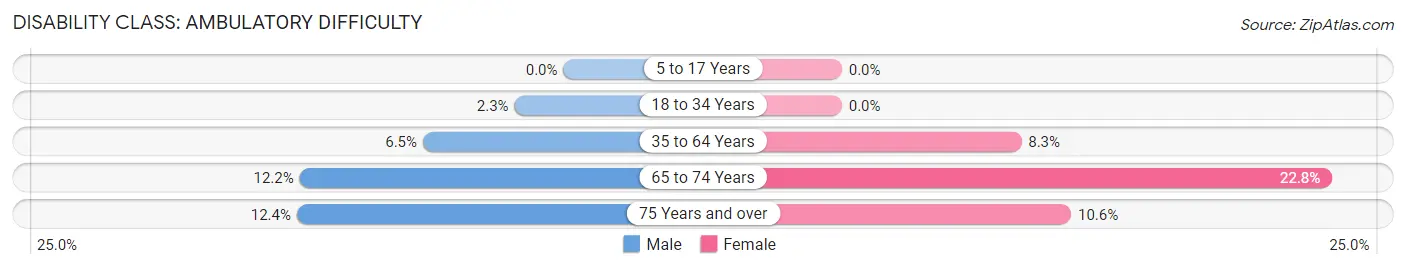
| Age Bracket | Male | Female |
| 5 to 17 Years | 0 (0.0%) | 0 (0.0%) |
| 18 to 34 Years | 10 (2.3%) | 0 (0.0%) |
| 35 to 64 Years | 60 (6.5%) | 89 (8.3%) |
| 65 to 74 Years | 24 (12.2%) | 43 (22.8%) |
| 75 Years and over | 46 (12.4%) | 35 (10.6%) |
Disability Class: Self-Care Difficulty
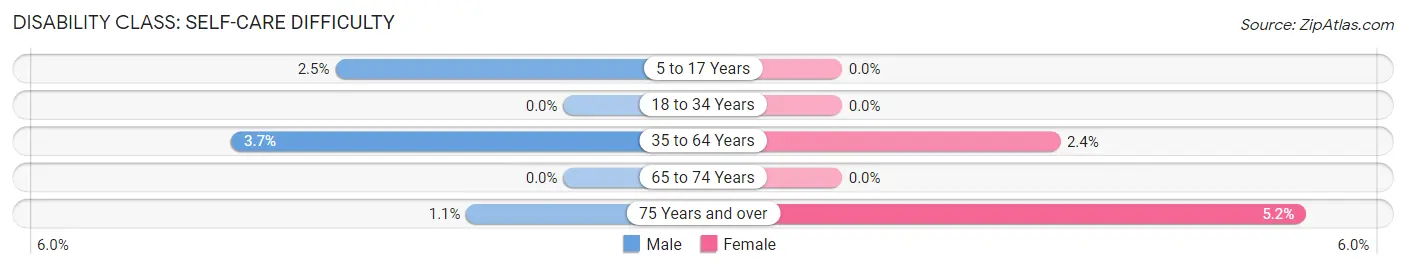
| Age Bracket | Male | Female |
| 5 to 17 Years | 14 (2.5%) | 0 (0.0%) |
| 18 to 34 Years | 0 (0.0%) | 0 (0.0%) |
| 35 to 64 Years | 34 (3.7%) | 26 (2.4%) |
| 65 to 74 Years | 0 (0.0%) | 0 (0.0%) |
| 75 Years and over | 4 (1.1%) | 17 (5.2%) |
Technology Access in Eagleton Village
Computing Device Access in Eagleton Village
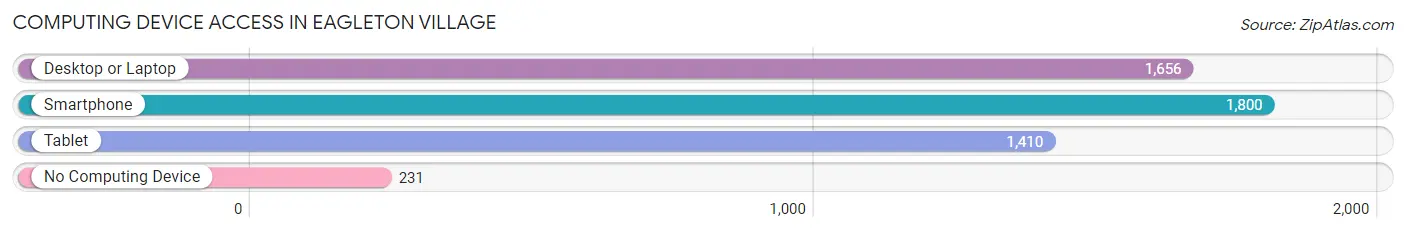
| Device Type | # Households | % Households |
| Desktop or Laptop | 1,656 | 72.7% |
| Smartphone | 1,800 | 79.0% |
| Tablet | 1,410 | 61.9% |
| No Computing Device | 231 | 10.1% |
| Total | 2,278 | 100.0% |
Internet Access in Eagleton Village
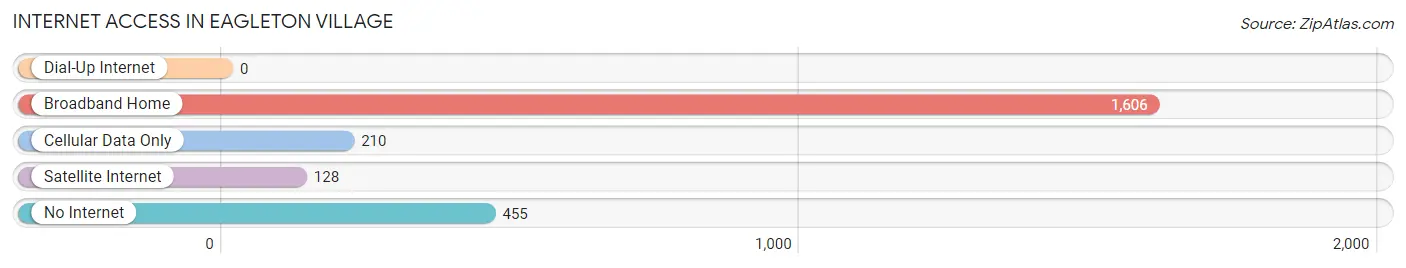
| Internet Type | # Households | % Households |
| Dial-Up Internet | 0 | 0.0% |
| Broadband Home | 1,606 | 70.5% |
| Cellular Data Only | 210 | 9.2% |
| Satellite Internet | 128 | 5.6% |
| No Internet | 455 | 20.0% |
| Total | 2,278 | 100.0% |
Eagleton Village Summary
Eagleton Village is a small town located in the state of Tennessee, United States. It is situated in the foothills of the Great Smoky Mountains, about 25 miles east of Knoxville. The town has a population of approximately 1,500 people and is known for its rural charm and friendly atmosphere.
Geography
Eagleton Village is located in the foothills of the Great Smoky Mountains, about 25 miles east of Knoxville. The town is situated in a valley surrounded by rolling hills and mountains. The terrain is mostly hilly and wooded, with some flat areas. The town is located at an elevation of 1,000 feet above sea level. The climate is mild, with temperatures ranging from the low 30s in the winter to the mid-80s in the summer.
Economy
Eagleton Village is a small, rural town with a limited economy. The main industries in the area are agriculture and tourism. The town is home to several small farms, which produce a variety of crops, including corn, soybeans, and hay. The town also has a few small businesses, including a grocery store, a hardware store, and a few restaurants. Tourism is also an important part of the local economy, as the town is located near several popular attractions, including the Great Smoky Mountains National Park and the Appalachian Trail.
Demographics
As of the 2010 census, the population of Eagleton Village was 1,500. The racial makeup of the town was 95.3% White, 1.7% African American, 0.7% Native American, 0.3% Asian, and 2.0% from other races. The median household income was $35,000, and the median age was 42.
History
Eagleton Village was founded in the early 1800s by settlers from North Carolina. The town was named after the local Eagleton family, who were among the first settlers in the area. The town grew slowly over the years, and by the early 1900s, it had become a popular destination for tourists. The town was also home to several small businesses, including a general store, a blacksmith shop, and a sawmill.
In the late 20th century, the town began to decline as the local economy shifted away from agriculture and tourism. The town was hit hard by the Great Recession of 2008, and many businesses closed. However, the town has since seen a resurgence in recent years, with new businesses opening and the local economy beginning to recover.
Eagleton Village is a small, rural town with a rich history and a friendly atmosphere. The town is home to a variety of businesses and attractions, and it is a popular destination for tourists. The town is also home to a diverse population, with a variety of racial and ethnic backgrounds. The town is a great place to live, work, and visit, and it is sure to remain a popular destination for years to come.
Common Questions
What is Per Capita Income in Eagleton Village?
Per Capita income in Eagleton Village is $30,343.
What is the Median Family Income in Eagleton Village?
Median Family Income in Eagleton Village is $82,997.
What is the Median Household income in Eagleton Village?
Median Household Income in Eagleton Village is $53,579.
What is Income or Wage Gap in Eagleton Village?
Income or Wage Gap in Eagleton Village is 43.0%.
Women in Eagleton Village earn 57.0 cents for every dollar earned by a man.
What is Inequality or Gini Index in Eagleton Village?
Inequality or Gini Index in Eagleton Village is 0.46.
What is the Total Population of Eagleton Village?
Total Population of Eagleton Village is 5,328.
What is the Total Male Population of Eagleton Village?
Total Male Population of Eagleton Village is 2,748.
What is the Total Female Population of Eagleton Village?
Total Female Population of Eagleton Village is 2,580.
What is the Ratio of Males per 100 Females in Eagleton Village?
There are 106.51 Males per 100 Females in Eagleton Village.
What is the Ratio of Females per 100 Males in Eagleton Village?
There are 93.89 Females per 100 Males in Eagleton Village.
What is the Median Population Age in Eagleton Village?
Median Population Age in Eagleton Village is 40.7 Years.
What is the Average Family Size in Eagleton Village
Average Family Size in Eagleton Village is 2.8 People.
What is the Average Household Size in Eagleton Village
Average Household Size in Eagleton Village is 2.3 People.
How Large is the Labor Force in Eagleton Village?
There are 2,559 People in the Labor Forcein in Eagleton Village.
What is the Percentage of People in the Labor Force in Eagleton Village?
61.9% of People are in the Labor Force in Eagleton Village.
What is the Unemployment Rate in Eagleton Village?
Unemployment Rate in Eagleton Village is 4.9%.